Trying DSE Graph + Studio in a Docker container on EC2
この記事は公開されてから1年以上経過しています。情報が古い可能性がありますので、ご注意ください。
An Apache Cassandra-based graph database: DSE Graph
DataStax recently released a new version of its flagship Cassandra product, DataStax Enterprise 5.0. DSE 5.0 includes a graph product called DataStax Enterprise Graph. DSE Graph is Tinkerpop-compliant graph database with OLTP and OLAP capabilities. I was interested in trying out DataStax Studio with DSE Graph as I read that it had integrated graph modelling and visualisation tools. So, I cooked up a Dockerfile and I will show you how to use it to start DataStax Studio on top of a single-node DSE Graph.
Prerequisites
To follow this walkthrough, you will require at least the following:
- an AWS account
- an existing EC2 SSH key pair in the region of your choice
- credentials for a DataStax Academy account
Prepare an EC2 instance
Use one of the standard CloudFormation templates to create an EC2 instance in ap-northeast-1 (Tokyo region). For your convenience, you can click this create stack link (template). You need to install Docker on the instance, and Amazon has provided instructions to do this as part of their ECS documentation. Be sure to limit SSH access to your IP address, as the default permitted SSH source CIDR in this template is 0.0.0.0/0 (everywhere).
sudo yum update -y
sudo yum install -y docker
sudo service docker start
sudo usermod -a -G docker ec2-user
Cntl-D to log out and log back in again, and test your installation with the following command.
docker info
Next, because you will clone a Git repository that contains a DSE Graph / Studio Dockerfile, you need to install git and clone with the following commands.
sudo yum install -y git
git clone https://github.com/amcp/dse-docker.git
Build and run the Docker image
Next, we will build and run the Docker image that contains a single-node DSE Graph instance with the Studio. These commands are complicated, so I will dissect them.
docker build --build-arg DSA_EMAIL=<your DSA email> --build-arg DSA_PASSWORD=<your DSA password> -t dse/docker .
docker run --privileged=true -t -i --name node1 -d -p 127.0.0.1:9091:9091 dse/docker
wget 127.0.0.1:9091 && cat index.html
The first command builds the docker image, and the second command runts the docker image with DSE Graph/Studio. You use your DataStax academy credentials where you see <your DSA email> and <your DSA password> (DataStax requires registration to download their stack). Note, the image that is built uses standard tools like apt-get to install DSE Graph from a known repository. The Dockerfile installs dependencies and copies a kickstart script that the Dockerfile uses to start DSE Graph and the Studio in a such that Docker does not terminate the image as soon as it runs. The second command runs the image you just built. It runs the image in privileged mode because Casssandra likes to change system parameters in the containers. -t -i are for being able to attach a bash shell to the running container for debugging or other purposes. The -name flag makes it easier to attach the terminal to a container pseudo TTY (docker attach node1). The -d flag daemonizes the container and the -p arguments instruct the host to connect host port 9091 to container port 9091 on the 127.0.0.1 interface. The last command is run on the EC2 host and verifies that you are able to access the Studio from outside the Docker container.
Tunnel in and try out DataStax Studio
To secure your EC2 resources, you can secure the DSE Graph/Studio stack with a SSH tunnel. Run the following SSH command to forward your local computer's port 9091 to the EC2 instance's port 9091.
ssh -i /path/to/key.pem ec2-user@<instance’s public IP> -L 9091:127.0.0.1:9091
Be sure to replace /path/to/key.pem with the actual path to your EC2 PEM key. Now you can navigate to the DataStax Studio in a browser on your local host. You will be presented with the following navigation screen.
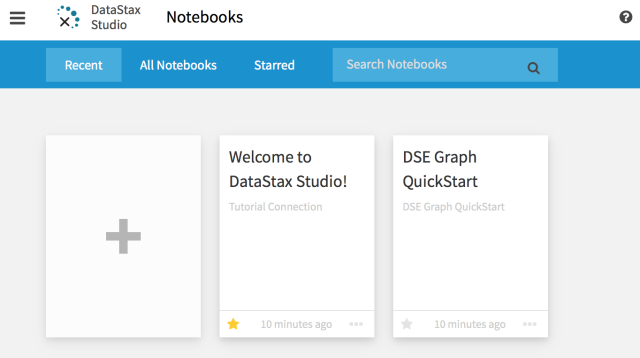
The Studio landing page shows a list of recently used notebooks. A notebook is an annotated and executable document.
If you click on the second notebook tile, "DSE Graph QuickStart" the Studio will demonstrate a richly-annotated notebook with small Gremlin script snippets, like the image below.
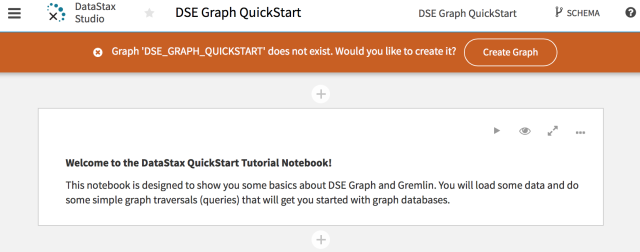
The quick start tutorial notebook is a combination of textual descriptions and executable Gremlin code. Before you can actually run the code snippets, you need to click the "Create Graph" button in orange above. This creates the Cassandra keyspace and data/metadata tables for your tutorial graph.
After you click the "Create Graph" button, the orange warning should disappear. When it does, you can work through the tutorial. Read the descriptions, and when you see something that looks like code, hover the mouse over the panel to reveal and real-time play button!
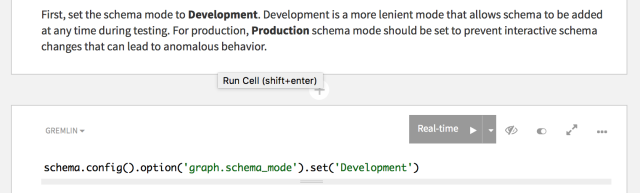
A studio cell is composed of a markdown or a Gremlin code editor, along with a play (execute) button.
In the same editor, you can choose the traversal engine you want to use to run Gremlin scripts. When the Gremlin code editor is open, the play button affords you the option to execute the Gremlin code, either with default traversal engine (OLTP) or with the Spark traversal engine (OLAP).
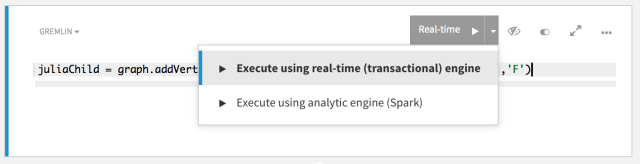
The Studio supports OLTP and OLAP executions.
Either way, when you execute a Gremlin script in the Studio, the results of the query are printed below the script cell. By default, the result set is shown in tabular form.
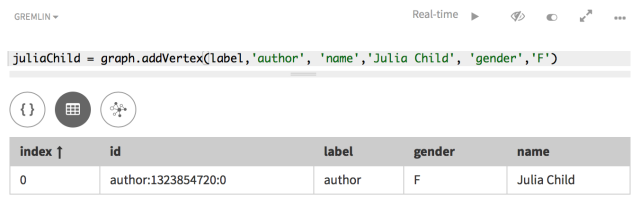
The Studio prints results in a table by default.
However, the Studio also supports graph and wire representations of the response.
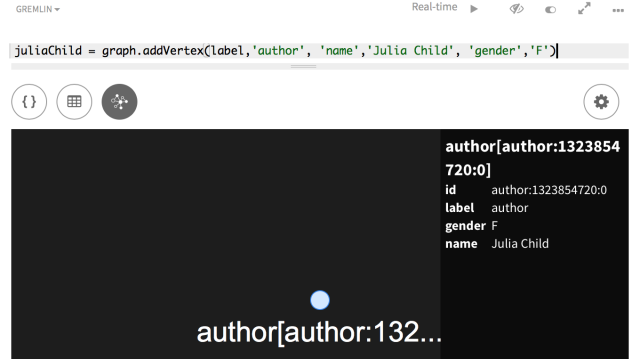
The Studio is able to display a response as a property graph.
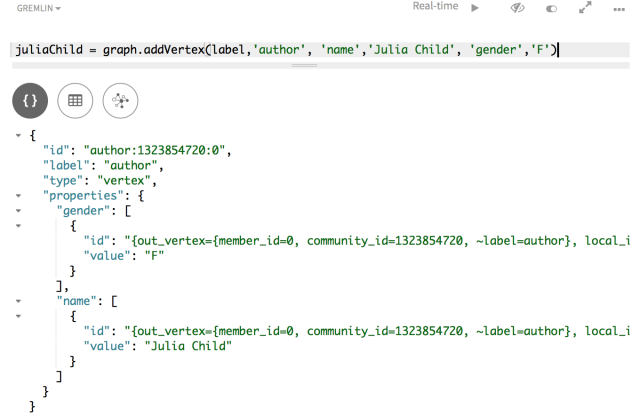
The Studio is also able to print a wire representation of the response as JSON.
Next steps
I encourage you to work through both tutorials, as well as to experiment with your own Gremlin scripts! Meanwhile, I will perform a gap analysis of supported TinkerPop features - I look forward to sharing the results with you.