
Spring Boot + Micrometer: Metrics to Send to CloudWatch Metrics and Configuration Method
This page has been translated by machine translation. View original
Micrometer is widely used in Spring Boot, and there's a library called Micrometer CloudWatch Exporter for exporting metrics to Amazon CloudWatch Metrics.
Using this, you can send metrics collected by Micrometer as custom metrics to CloudWatch Metrics.
However, CloudWatch Metrics custom metrics incur costs for each metric type and tag combination, so enabling everything without consideration can cause costs to balloon. When scaling out multiple instances/containers that register individual metrics, costs increase even further.
In this article, I've compiled information on selecting key metrics, understanding their meanings and how to interpret them, as well as how to configure them.
The assumed environment is as follows:
- Kotlin
1.9.25 - JVM:
amazon-corretto-17.0.17.10.1 - Spring Boot
3.5.12 - Infrastructure: ALB -> ECS Fargate (2 instances) -> Amazon Aurora MySQL
CloudWatch Metrics custom metrics pricing
Official: Amazon CloudWatch Pricing
Pricing structure
Custom metrics are billed monthly for each "metric name × dimension combination" as one metric.
Even with the same metric name, different dimension combinations count as separate metrics, so care is needed.
| Tiers | Cost (metric/month) |
|---|---|
| First 10,000 metrics | USD 0.30 |
| Next 240,000 metrics | USD 0.10 |
| Next 750,000 metrics | USD 0.05 |
| Beyond 1,000,000 metrics | USD 0.02 |
※These are Tokyo region prices as of March 2026. Please check the official site for the latest pricing.
For example, if you register custom metrics with Micrometer without careful consideration in a typical Spring Boot MVC application running in ECS containers, with 2 instances (Multi-AZ configuration) × 50-100 metrics (roughly estimated including tag combinations) = 100-200 metrics/month, you'd be looking at approximately $0.3 × 100-200 = $30-60/month.
Additionally, if dimensions include container IDs, new dimension combinations will be created with each deployment task replacement, increasing the number of metrics. For instance, with 5 deployments per month causing task replacements, metrics would increase, resulting in $150-300/month.
The number of metrics is the dominant factor, so it's important to narrow down the types of metrics and tag combinations.
Also, though not covered in this article, there are additional costs based on the number of API calls like PutMetricData.
Metric selection
Metrics for JVM GC and connection pools that require long-term observation or help with troubleshooting failures should be kept enabled. When using AWS, CPU and Memory metrics can be obtained through cloud-side settings, so collection through Micrometer can be omitted.
After consulting with AI, I enabled the following metrics. The interpretation of each metric is explained later.
| Category | Metric | Description |
|---|---|---|
| GC | jvm.gc.pause.count | GC count |
| GC | jvm.gc.pause.sum | Total time stopped for GC |
| GC | jvm.gc.pause.max | Maximum pause time |
| GC | jvm.gc.pause.avg | Average time |
| GC | jvm.gc.overhead.value | GC overhead |
| GC | jvm.gc.live.data.size.value | Amount of data surviving GC (leak signal) |
| GC | jvm.gc.max.data.size.value | Old Gen's maximum size |
| Memory | jvm.memory.used.value | Heap usage (shows leaks) |
| Memory | jvm.memory.max.value | Heap max (limit) |
| Thread | jvm.threads.live.value | Total number of currently living threads |
| Thread | jvm.threads.daemon.value | Number of daemon threads |
| Thread | jvm.threads.peak.value | Peak thread count since JVM startup |
| CP | hikaricp.connections.active.value | Number of connections in use |
| CP | hikaricp.connections.pending.value | Number of threads waiting |
| CP | hikaricp.connections.timeout.count | Total count of timeouts |
| CP | hikaricp.connections.max.value | Maximum pool size setting |
GC metrics
GC is a mechanism for managing Java heap memory, automatically collecting objects that are no longer needed.
Understanding each GC metric helps you grasp the state of your application's memory management and detect performance issues or memory leak indicators early.
In this case, our JVM is Amazon Corretto 17, using the default G1 GC (Garbage-First Garbage Collector). G1 is a generational and region-based GC that divides the heap into Young and Old areas while internally managing it as numerous regions. The basic cycle involves running young GC frequently to collect young objects, performing concurrent marking of the Old area as needed, and then collecting the Old area.
To understand these metrics, it's helpful to first grasp the basic concepts of G1 GC.
G1GC Basic Concepts
Heap Region Structure
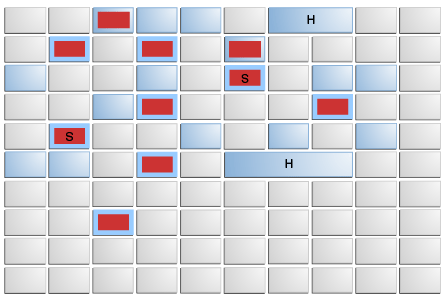
- Young Gen
- eden space: where new objects are initially allocated (red areas in the diagram)
- survivor space: where objects that survived eden space are moved (red areas with "S" in the diagram)
- Old Gen
- old space: where long-lived objects are moved (blue areas in the diagram)
G1GC Cycle
- Young-only phase
- Normal Young GC (STW)
- Collects only Young regions (eden + survivor)
- Surviving objects are evacuated (copied) to Survivor or Old
- This Young GC is repeatedly performed as the basic cycle
- Concurrent Start Young GC
- When Old region usage reaches a threshold, the next Young GC becomes this
- Performs Young GC while starting concurrent marking of Old regions
- Concurrent Marking
- Collects liveness information of objects in Old regions concurrently with application execution
- This information determines which Old regions to target for collection in the subsequent Space-reclamation phase
- Remark Phase (STW)
- Makes final adjustments to marking with STW
- Marks objects that couldn't be marked during concurrent marking
- By this point, Old regions to be collected in the next Cleanup phase are determined
- Cleanup Phase (STW)
- Uses marking results to organize Old regions for collection and decides whether to proceed to Space-reclamation phase
- If proceeding to Space-reclamation phase, a Normal Young GC is performed first
- Normal Young GC (STW)
- Space-reclamation phase
- Mixed GC (STW)
- Collects Young regions plus high-efficiency Old regions
- Evacuates live objects in Old to different regions to resolve fragmentation
- Ends when collecting more Old regions becomes inefficient
- Returns to Young-only phase afterward
- Mixed GC (STW)
- Other
- Full GC (STW)
- Last resort when normal cycles can't keep up
- Example: If application runs out of memory (
OutOfMemoryError) during liveness information collection, an immediate STW Full GC is performed
- Example: If application runs out of memory (
- Collects unnecessary objects from entire heap and performs evacuation to resolve heap fragmentation
- Last resort when normal cycles can't keep up
G1GC Types
| GC | Description |
|---|---|
| Young GC (= Minor GC) | Collects only Young regions (Eden + Survivor). Also starts concurrent marking of Old regions. The most frequent GC |
| Mixed GC | Collects Young regions plus high-efficiency Old regions |
| Full GC (= Major GC) | STW GC targeting the entire heap, the heaviest GC process |
- jvm.gc.pause.count
- Meaning: Cumulative count of application stops due to GC
- Details: Counts stops from all GC events, including minor GC (cleaning young generation) and full GC (cleaning the entire heap).
- Checkpoint: If this count increases rapidly, it indicates very frequent memory allocation and deallocation.
- jvm.gc.pause.sum
- Meaning: "Total" application pause time due to GC
- Details: Sum of all time the application has been stopped for GC since startup.
- Checkpoint: Longer total time means reduced throughput (processing volume per unit time).
- jvm.gc.pause.max
- Meaning: "Maximum pause time" per GC event
- Details: The longest time the application was stopped by any single GC.
- Checkpoint: Helps identify the cause of "worst response delays". If a web app occasionally becomes unresponsive for seconds, this max value is often spiking.
- jvm.gc.pause.avg
- Meaning: "Average" application pause time due to GC
- Details: A derived value calculated from
jvm.gc.pause.sum / jvm.gc.pause.count. It's a statistical value internally maintained by Micrometer's Timer and may not be sent depending on the CloudWatch Exporter implementation version. - Checkpoint: A long average indicates frequent GC or heavy GC processing. Averages exceeding several hundred milliseconds can negatively impact user experience.
- jvm.gc.overhead.value
- Meaning: Percentage of time spent on GC (GC overhead)
- Details: Shows what proportion of total execution time is occupied by GC processing (usually expressed as a percentage or 0-1 range).
- Checkpoint: If this value is high (e.g., exceeding 10%), the "CPU is being consumed by memory cleanup rather than business logic." If overhead becomes extremely high (98%+) and memory cannot be freed, OutOfMemoryError may occur.
- jvm.gc.live.data.size.value
- Meaning: Amount of data in Old Gen region surviving GC
- Details: The amount of "resident data that remains after cleanup = data continuously used by the application."
- Checkpoint: If this baseline value gradually increases, it may indicate cache expansion or a memory leak somewhere.
- jvm.gc.max.data.size.value
- Meaning: "Maximum size" physically available to Old Gen region
- Details: The maximum allocation available to Old Gen out of jvm.memory.max.value (total heap limit).
- Checkpoint: As
live.data.sizeapproaches this max.data.size, space for new objects in Old Gen diminishes, leading to frequent heavy GCs.
Memory metrics
These metrics help understand JVM memory usage.
Combined with GC behavior, they help detect OOM and leak symptoms early.
- jvm.memory.used.value
- Meaning: Current actual memory usage (in bytes)
- Details: This metric is sent as separate metrics for each memory pool with combinations of
areatags (heap/nonheap) andidtags (Eden Space,Survivor Space,Old Gen,Metaspace, etc.). A memory leak is when heap used continuously increases and doesn't decrease after GC. - Checkpoint: It's normal for the overall heap value to fluctuate sharply with each GC, forming a "saw tooth" pattern when healthy. Pay special attention to whether
id=G1 Old Genused is continuously increasing.
- jvm.memory.max.value
- Meaning: "Maximum limit" of memory allowed for JVM use
- Details: Corresponds to the value specified with Java startup option -Xmx.
- Checkpoint: As used approaches this max, JVM repeatedly performs GC to create memory. As a result, the
jvm.gc.overheadspikes, potentially leading toOutOfMemoryErrorand Full GC, causing the app to crash.
Thread metrics
Metrics to understand JVM thread states.
Helps detect thread leaks or excessive thread creation. Note that JVM threads correspond one-to-one with OS native threads, so increased thread count strains OS resources. Thread leaks can eventually prevent creation of new threads, resulting in OutOfMemoryError: unable to create new native thread.
- jvm.threads.live.value
- Meaning: Total number of currently living (not terminated) threads
- Details: Includes both daemon and non-daemon threads.
- Checkpoint: If this value continuously increases, a thread leak (threads not being disposed after completion) may be occurring, which consumes resources and eventually causes
OutOfMemoryError: unable to create new native thread.
- jvm.threads.daemon.value
- Meaning: Number of currently living "daemon threads"
- Details: Daemon threads are background threads supporting main processes (non-daemon), such as GC threads. They automatically terminate when all main threads end.
- Checkpoint: By comparing the difference with
livecount, you can calculate how many application-specific business logic threads (non-daemon) exist.
- jvm.threads.peak.value
- Meaning: The record (peak value) of when thread count reached maximum since JVM startup
- Details: The number of threads at the moment when the application needed the most threads.
- Checkpoint: Helps understand the extent of momentary load spikes. If peak is abnormally high even while current live count is stable, it indicates a temporary mass thread creation occurred in the past.
Connection pool metrics
These are metrics for database connection pools.
Here, I'll use HikariCP metrics, the default connection pool in Spring Boot, as an example. These metrics are extremely useful for investigating performance issues and failures related to database connections, making them a priority for enabling.
- hikaricp.connections.active.value
- Meaning: Number of connections currently "in use" by the application
- Details: The number of connections where threads have called
getConnection()but not yetclose(). - Checkpoint: If this value consistently reaches max, processing may not be keeping up or there may be connection leaks.
- hikaricp.connections.pending.value
- Meaning: Number of threads "waiting" to borrow connections
- Details: The number of threads queued waiting for a new connection because the pool is full.
- Checkpoint: If values greater than 0 occur frequently, threads are being blocked waiting for DB connections, directly causing response delays for users.
- hikaricp.connections.timeout.count
- Meaning: Cumulative count of connection acquisition failures (timeouts)
- Details: The number of times a request timed out after waiting in pending state beyond the configured connectionTimeout.
- Checkpoint: If this is counting up, it indicates a dangerous state where "some processes are failing." You need to either increase the maximum pool size or optimize queries.
- hikaricp.connections.max.value
- Meaning: "Maximum configured number" of pooled connections
- Details: This is simply the value set with
maximumPoolSize. - Checkpoint: This is the pool size limit, so as active approaches this max, pending and timeout events become more likely.
Configuration method
TL;DR
The code is available in this repository:
Configuration steps
Add micrometer-registry-cloudwatch as a dependency
Add CloudWatch Exporter configuration to application.yml
Filter metrics to register
Other notes (supplementary)
- Regarding connection pool metrics
In environments using multiple DB instances in Multi-AZ configurations, it's preferable to configure metrics for each data source (writer/reader), but this depends on the driver and connection pool implementation, so I'll omit details here.
In our project, we use aws-advanced-jdbc-wrapper and register internal HikariCP pool metrics to Micrometer using MicrometerMetricsTrackerFactory:
Driver.setCustomConnectionProvider(
    HikariPooledConnectionProvider { hostSpec, _ ->
        val config = HikariConfig()
        ...
        config.poolName = "hikari-${hostSpec.role.name.lowercase()}-${hostSpec.host}"
        config.metricsTrackerFactory = MicrometerMetricsTrackerFactory(meterRegistry)

        return@HikariPooledConnectionProvider config
    },
)
- Regarding tag combinations
For example, if jvm.gc.pause has 3 tags (action / cause / gc), the number of metrics increases by their combinations. By default, Micrometer automatically attaches these tags to GC metrics, potentially generating more metrics than expected.
You can reduce the number of metrics by removing tags with filters as shown below, though I've omitted this as I was conflicted about whether to narrow these down:
@Configuration
class MicrometerConfig {

    @Bean
    fun dropJvmGcPauseTags(): MeterFilter {
        return MeterFilter.ignoreTags("action", "cause", "gc")
    }
}
Introduction to some registered metrics
For reference, I'll introduce some metrics registered in CloudWatch Metrics, briefly explaining how to read the graphs and what values indicate various states.
GC metrics
jvm.gc.pause.avggraph for 1 container
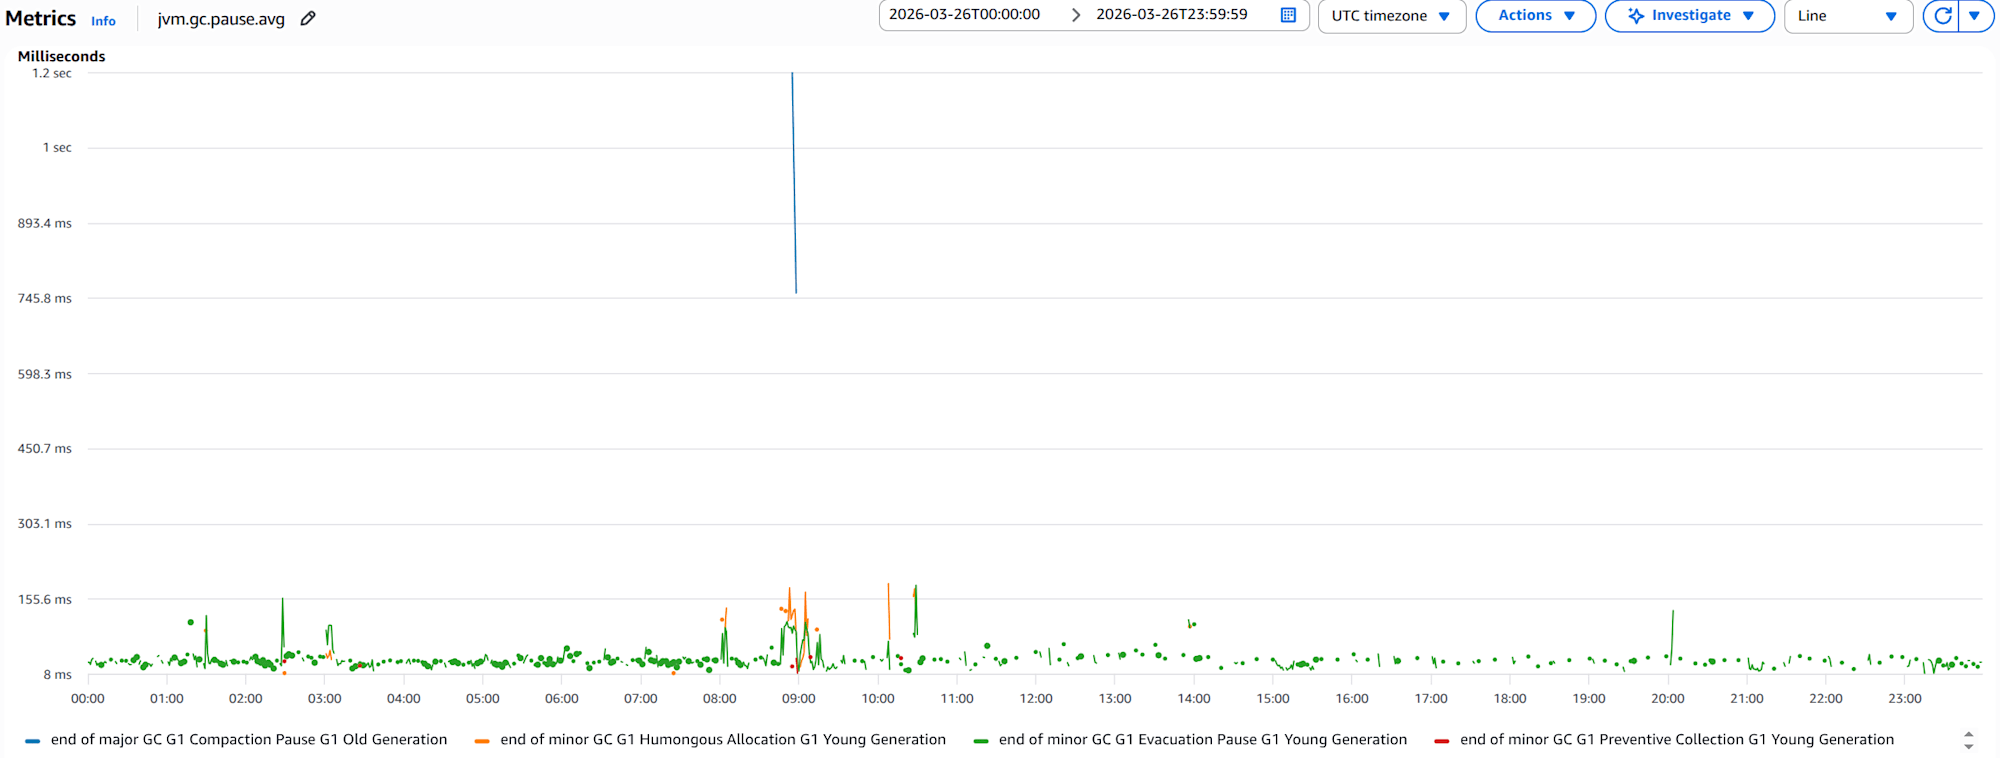
The focus should be on major GC - G1 Compaction Pause - G1 Old Generation, where the average GC pause time exceeds 1 second. This means the application is stopping for over 1 second during Old Gen collection, potentially significantly impacting user experience.
Memory metrics
jvm.memory.used.valueandjvm.memory.max.valuegraphs for 1 container
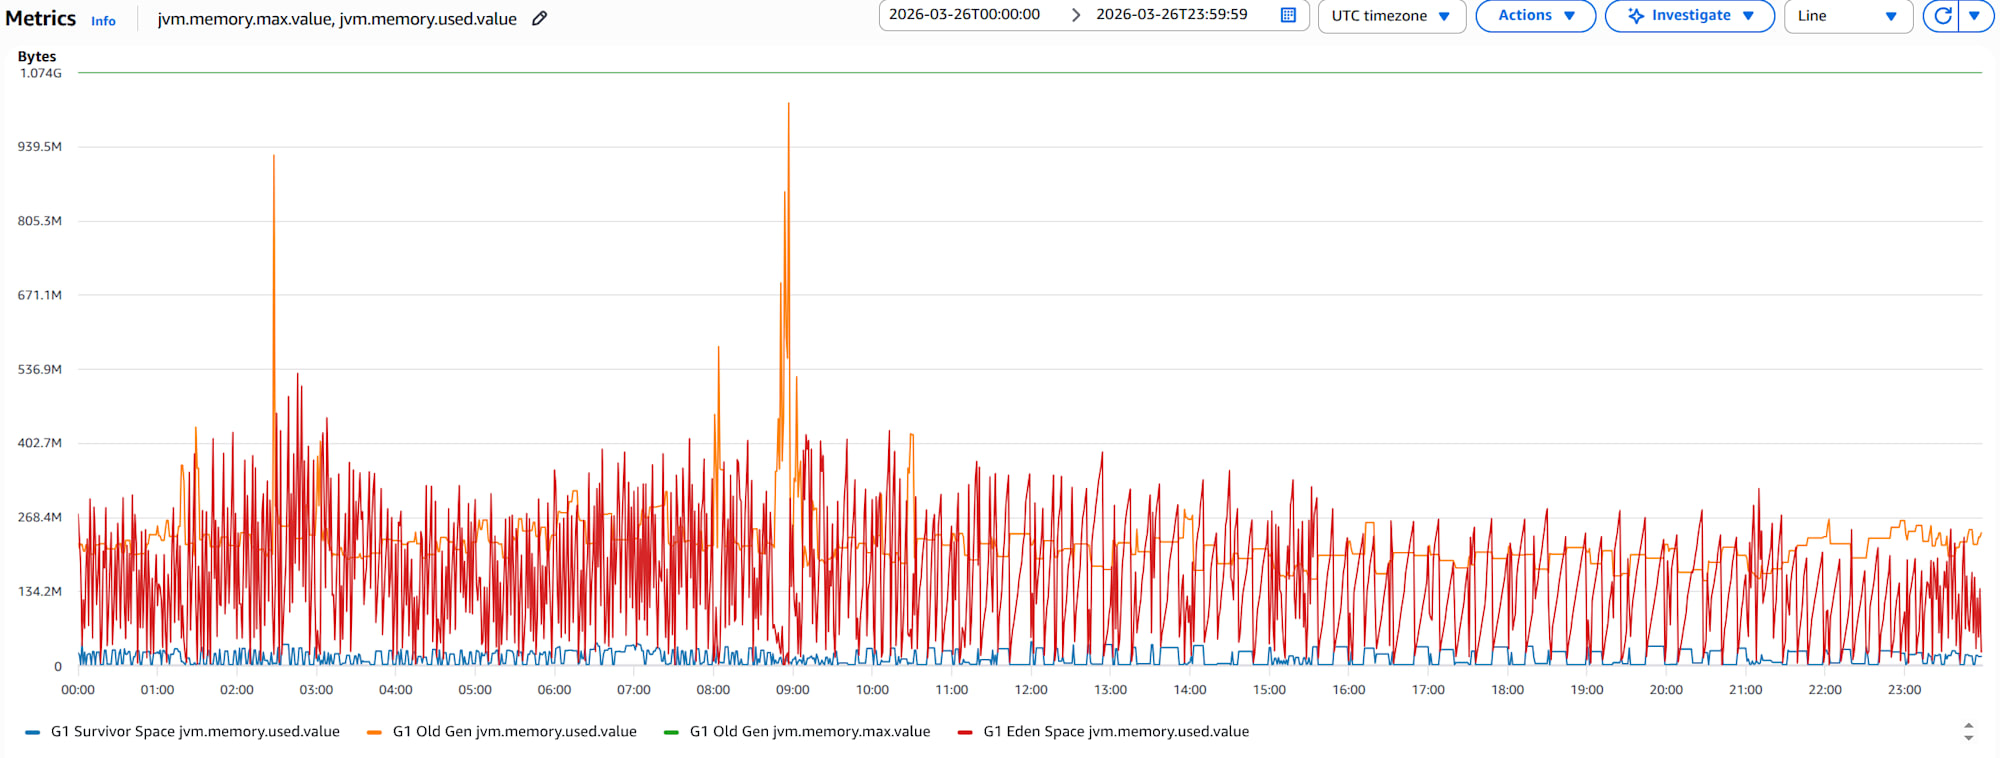
Memory in each area isn't continuously increasing, suggesting low likelihood of leaks. There are moments when Old Gen used approaches max, but if this happens frequently, it can increase GC overhead and in worst cases cause OutOfMemoryError Full GC, crashing the app.
Thread metrics
jvm.threads.live.value,jvm.threads.daemon.value, andjvm.threads.peak.valuegraphs for 1 container
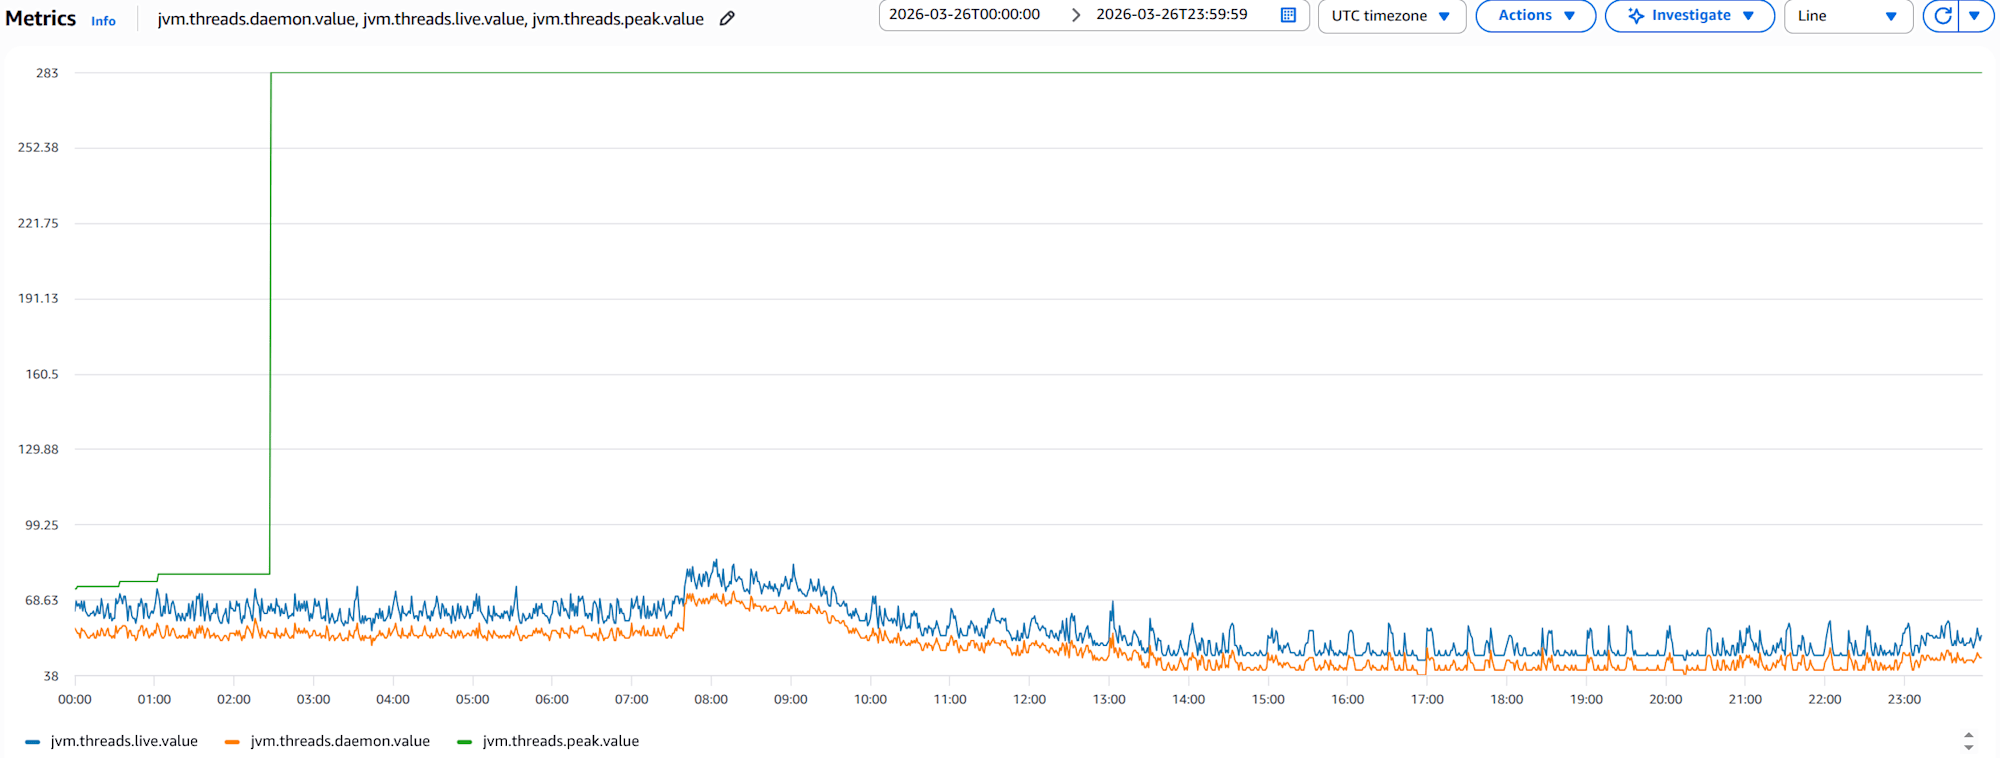
This graph shows that live thread count consistently exceeds daemon thread count, indicating application-specific threads exist. The stable live thread count shows no signs of thread leaks. However, a spike in peak at one point indicates a temporary load spike occurred.
Connection pool metrics
- Reader
hikaricp.connections.active.value,hikaricp.connections.pending.value,hikaricp.connections.timeout.count, andhikaricp.connections.max.valuegraphs for 1 container
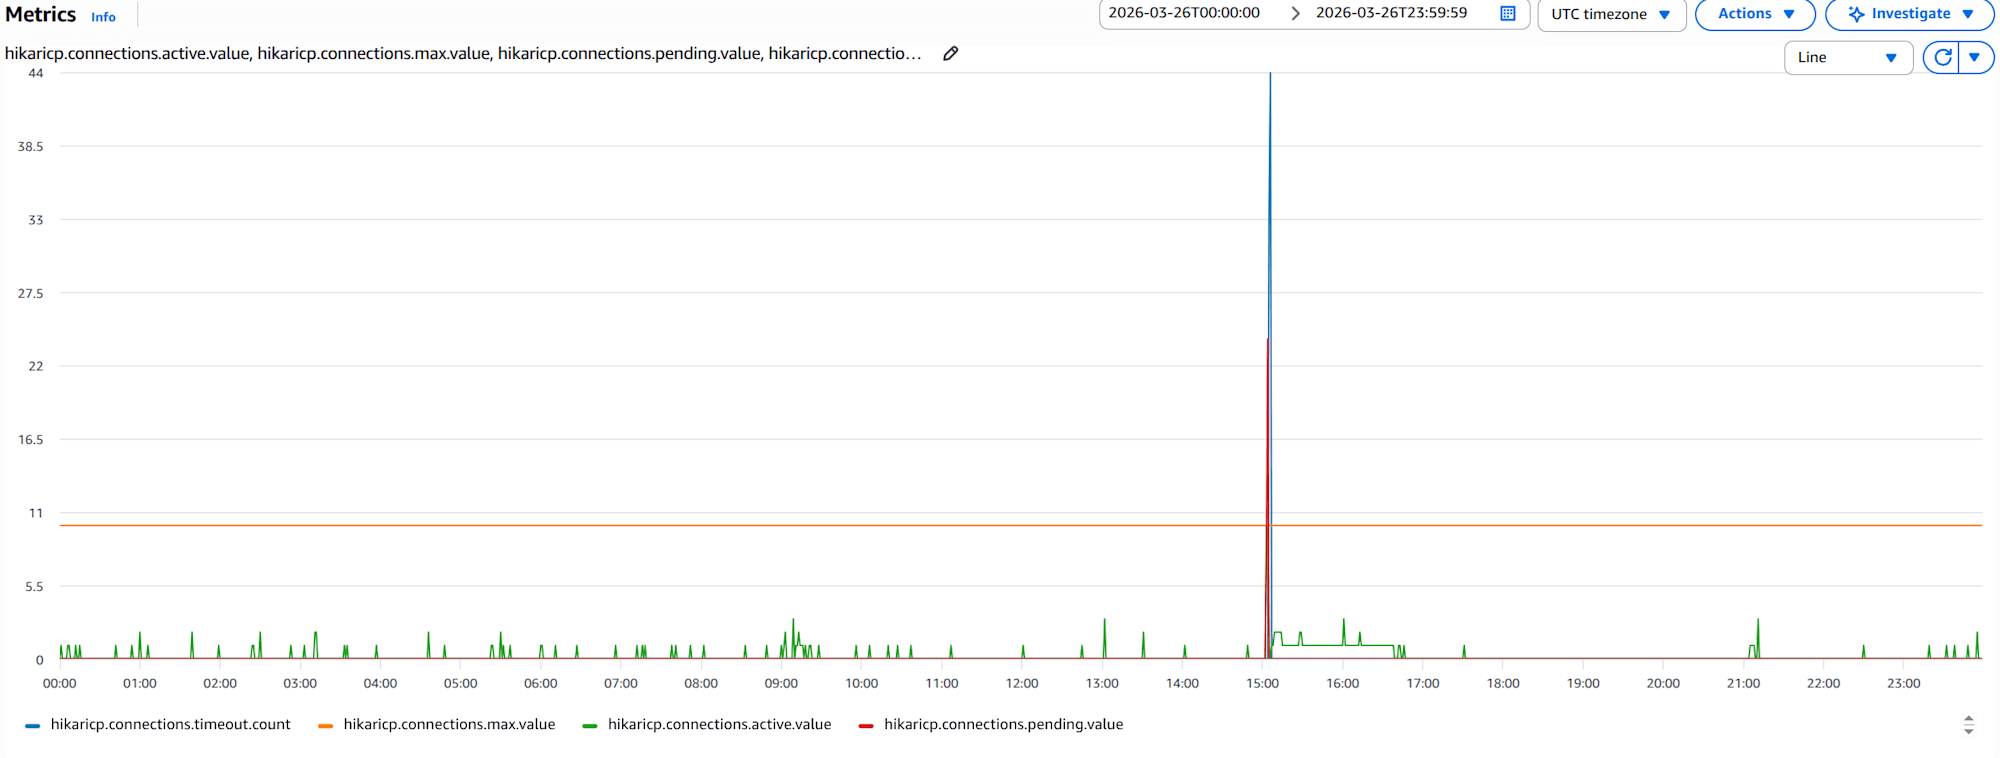
Typically, active should remain stable below max, but there are periods where active reaches max. Simultaneously, pending and timeout events occur frequently, suggesting potential user response delays or processing failures. This might require increasing maximum pool size or optimizing queries.
Conclusion
JVM GC, memory, and thread metrics are fundamental indicators for understanding application health. GC overhead and connection pool waits directly affect user experience and should be prioritized for monitoring.
While CloudWatch Metrics custom metrics are powerful monitoring tools, they come with costs, making it important to carefully select "what to send".
I hope this is helpful for someone.