![[Update] Amazon ECS now enables container health status checking through CloudWatch metrics](https://images.ctfassets.net/ct0aopd36mqt/wp-thumbnail-6d4fdf3578638cab4e6e4655b3d692aa/15a803840d72679e6593006354d5766b/amazon-elastic-container-service?w=3840&fm=webp)
[Update] Amazon ECS now enables container health status checking through CloudWatch metrics
This page has been translated by machine translation. View original
I want to know when and which container failed a health check
Hello, this is nonPi (@non____97).
Have you ever wanted to know when and which container failed a health check? I have.
Traditionally, container health checks only showed the current state. If it was an essential container, the task itself would become unhealthy and attempt to recreate the task, but otherwise, it was difficult to track the status retroactively.
With a recent update, Amazon ECS now allows you to check container health status via CloudWatch metrics.
For ECS clusters with Container Insights with Enhanced Observability enabled, when container health checks are configured in the task definition, the UnHealthyContainerHealthStatus metric will be recorded.
This makes it easy to understand when and which container failed a health check.
Let's check it out.
Testing it out
Test environment
The test environment is as follows:
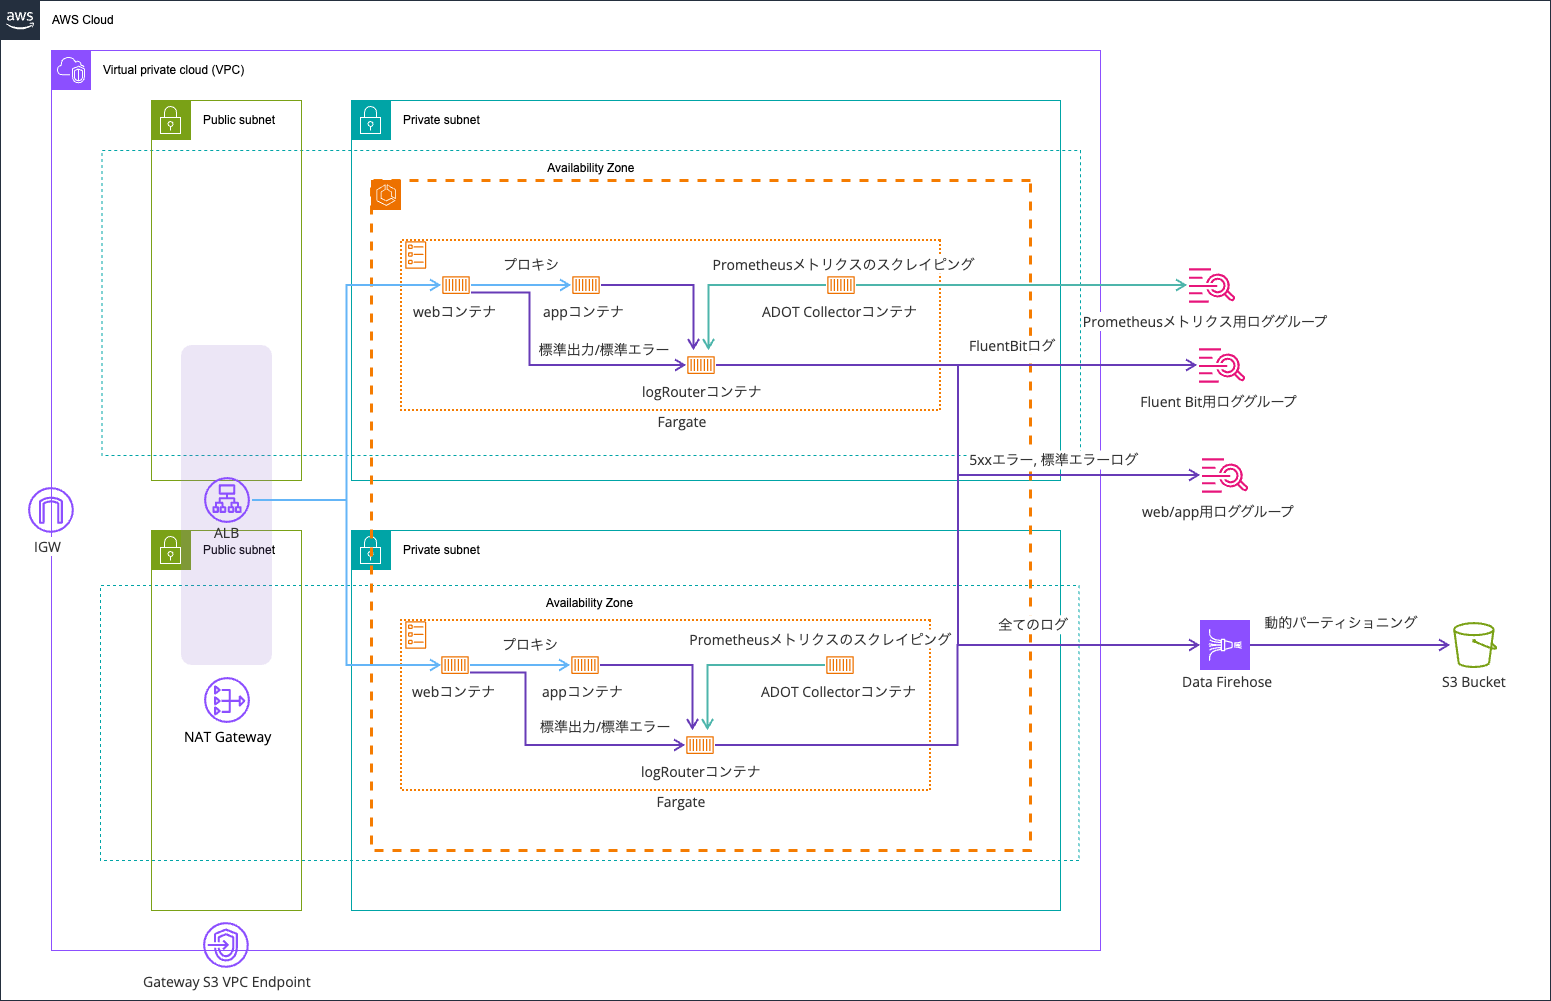
I'm using the environment from this article as a base:
The code is stored in this repository:
The health check section of the task definition looks like this:
{
  .
  .
  (omitted)
  .
  .
  "healthCheck": {
    "command": [
      "CMD-SHELL",
      "wget -q -O - http://localhost:3000/health || exit 1"
    ],
    "interval": 10,
    "timeout": 3,
    "retries": 3,
    "startPeriod": 5
  },
  .
  .
  (omitted)
  .
  .
}
Checking the metrics
After deployment, let's check the metric status.
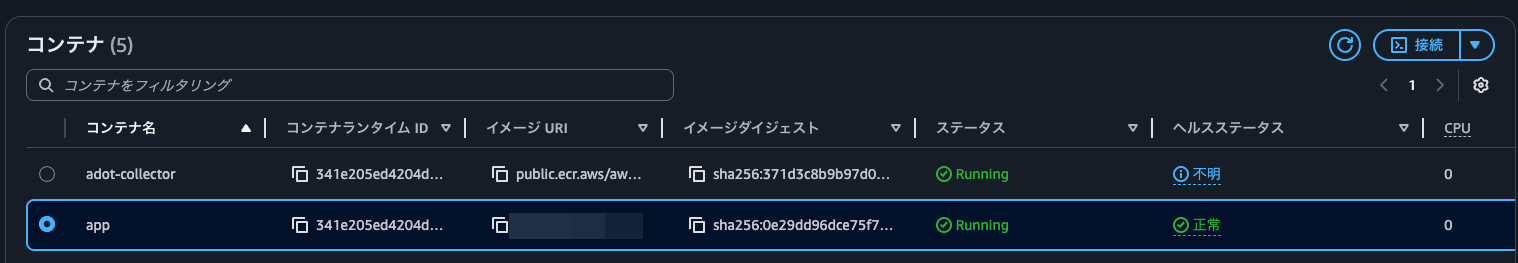
When I checked the container health status, it showed as healthy.
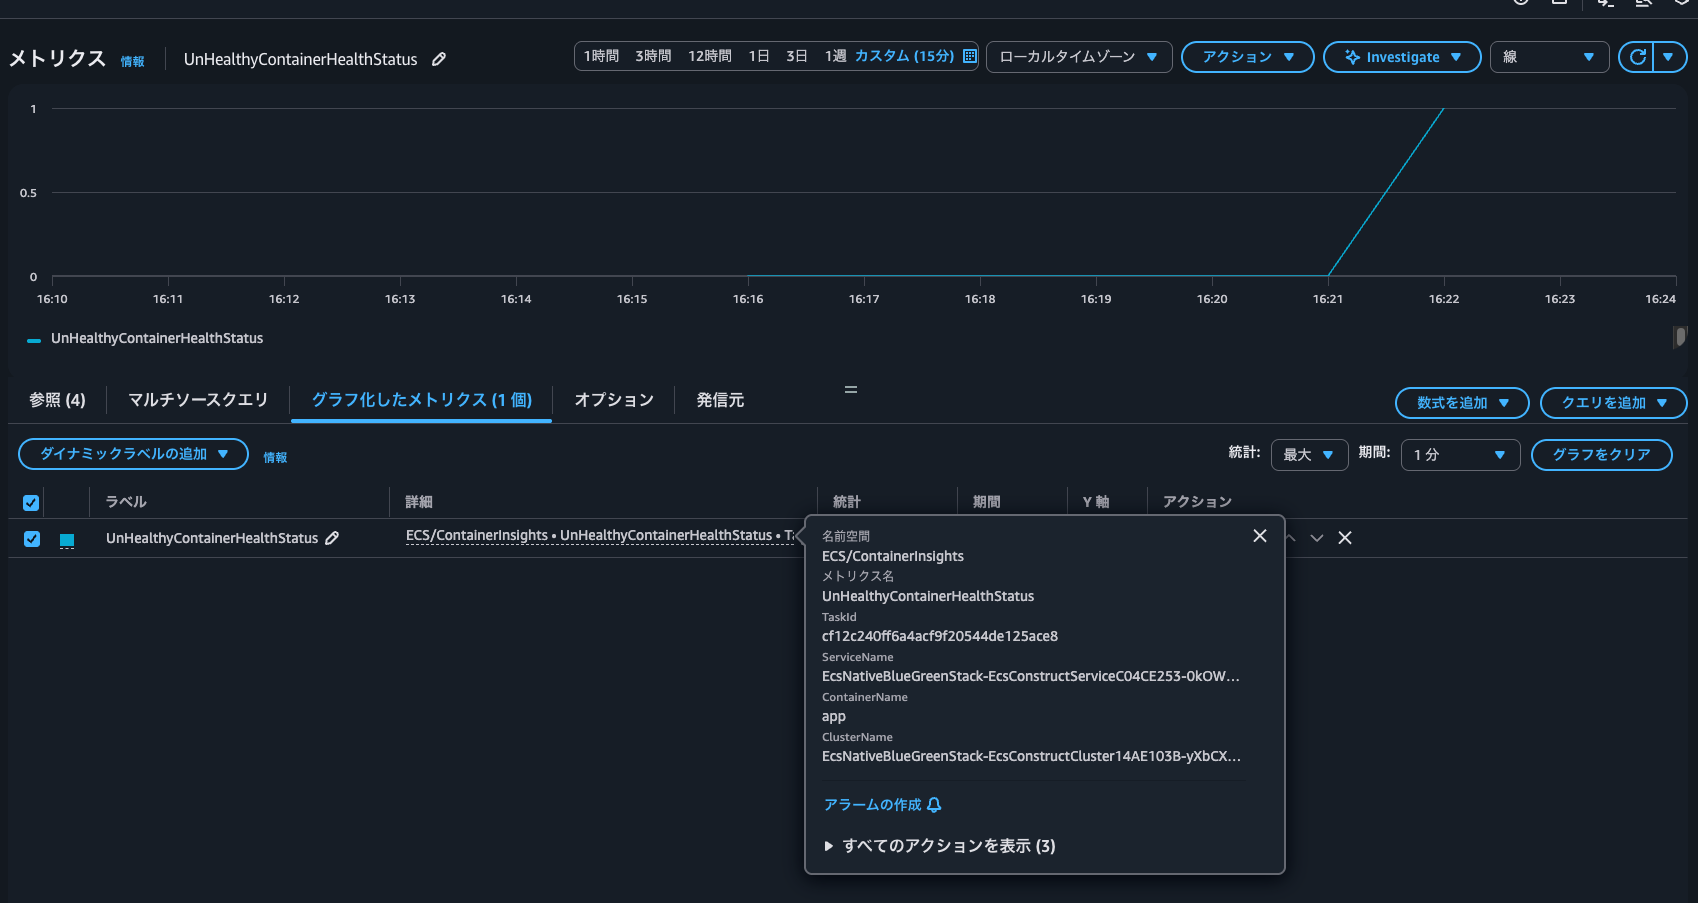
Filtering for UnHealthyContainerHealthStatus in the CloudWatch console shows the following dimensions in the ECS/ContainerInsights namespace:
- ClusterName
- ClusterName, ContainerName, ServiceName
- ClusterName, ContainerName, ServiceName, TaskId
- ClusterName, ContainerName, TaskDefinitionFamily
- ClusterName, ContainerName, TaskDefinitionFamily, TaskId
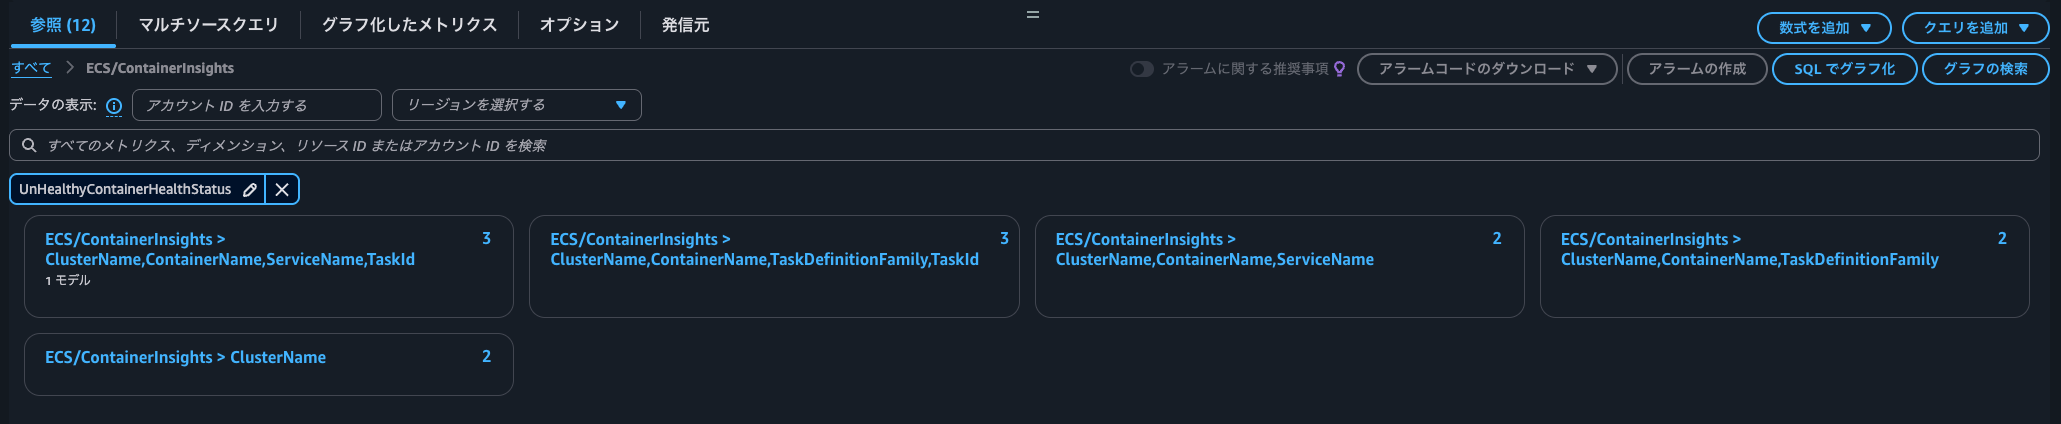
This makes it easy to see which task's container has failed health checks.
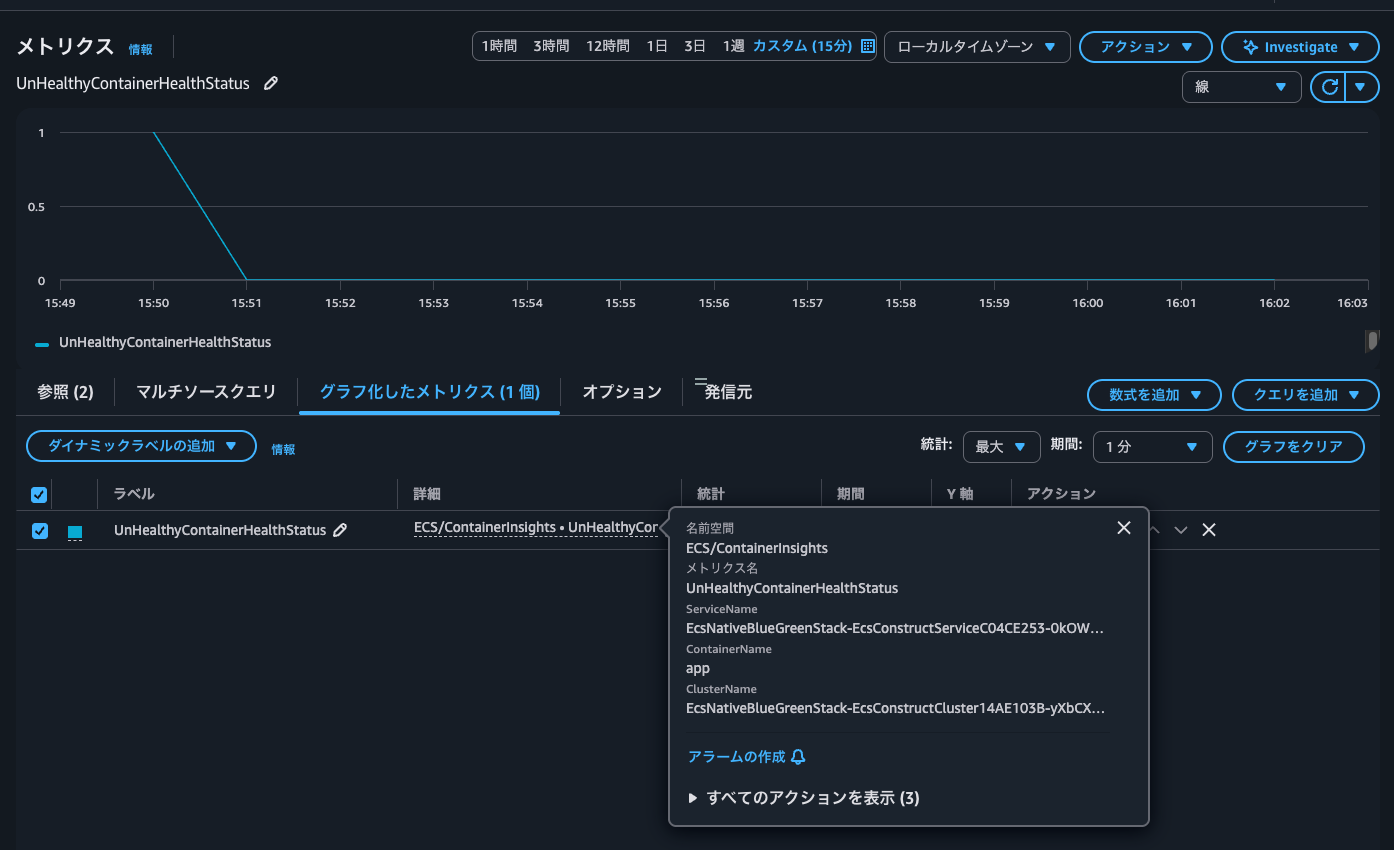
When checking the actual metrics, the current value is 0. However, during task startup, it seems it was 1, indicating a failed health check possibly because the application wasn't up yet. This could be a good opportunity to review the health check grace period and retry count.
These metrics are displayed using the EMF (Embedded Metric Format) logs.
The following EMF format log was output to the log stream FargateTelemetry-7742 in the log group /aws/ecs/containerinsights/EcsNativeBlueGreenStack-EcsConstructCluster14AE103B-yXbCXFNJC70r/performance:
{
    "Version": "0",
    "Type": "Container",
    "ContainerName": "app",
    "TaskId": "341e205ed4204d26b4184e08cf4d42f9",
    "TaskDefinitionFamily": "EcsNativeBlueGreenStackEcsConstructTaskDefinitionF683F4B2",
    "TaskDefinitionRevision": "75",
    "ServiceName": "EcsNativeBlueGreenStack-EcsConstructServiceC04CE253-0kOWEJKBOsNT",
    "ClusterName": "EcsNativeBlueGreenStack-EcsConstructCluster14AE103B-yXbCXFNJC70r",
    "Image": "<AWSアカウントID>.dkr.ecr.us-east-1.amazonaws.com/cdk-hnb659fds-container-assets-<AWSアカウントID>-us-east-1:4c7ba85e7238bc3d718b237eb86f47a20d829dc483700d0c1def4c1480761ef1",
    "ContainerKnownStatus": "PENDING",
    "ContainerHealthStatus": "HEALTHY",
    "Timestamp": 1769842260000,
    "CpuUtilized": 3.7039804077148433,
    "ContainerCpuUtilized": 3.7039804077148433,
    "CpuReserved": 256,
    "ContainerCpuReserved": 256,
    "ContainerCpuUtilization": 1.4468673467636106,
    "MemoryUtilized": 81,
    "ContainerMemoryUtilized": 81,
    "MemoryReserved": 512,
    "ContainerMemoryReserved": 512,
    "ContainerMemoryUtilization": 15.8203125,
    "StorageReadBytes": 95830016,
    "ContainerStorageReadBytes": 95830016,
    "StorageWriteBytes": 0,
    "ContainerStorageWriteBytes": 0,
    "NetworkRxBytes": 91,
    "ContainerNetworkRxBytes": 91,
    "NetworkRxDropped": 0,
    "NetworkRxErrors": 0,
    "NetworkRxPackets": 42729,
    "NetworkTxBytes": 250,
    "ContainerNetworkTxBytes": 250,
    "NetworkTxDropped": 0,
    "NetworkTxErrors": 0,
    "NetworkTxPackets": 1771,
    "UnHealthyContainerHealthStatus": 0,
    "CloudWatchMetrics": [
        {
            "Namespace": "ECS/ContainerInsights",
            "Metrics": [
                {
                    "Name": "ContainerCpuUtilized",
                    "Unit": "None"
                },
                {
                    "Name": "ContainerCpuReserved",
                    "Unit": "None"
                },
                {
                    "Name": "ContainerCpuUtilization",
                    "Unit": "Percent"
                },
                {
                    "Name": "ContainerMemoryUtilized",
                    "Unit": "Megabytes"
                },
                {
                    "Name": "ContainerMemoryReserved",
                    "Unit": "Megabytes"
                },
                {
                    "Name": "ContainerMemoryUtilization",
                    "Unit": "Percent"
                },
                {
                    "Name": "ContainerStorageReadBytes",
                    "Unit": "Bytes/Second"
                },
                {
                    "Name": "ContainerStorageWriteBytes",
                    "Unit": "Bytes/Second"
                },
                {
                    "Name": "ContainerNetworkRxBytes",
                    "Unit": "Bytes/Second"
                },
                {
                    "Name": "ContainerNetworkTxBytes",
                    "Unit": "Bytes/Second"
                },
                {
                    "Name": "UnHealthyContainerHealthStatus",
                    "Unit": "None"
                }
            ],
            "Dimensions": [
                [
                    "ClusterName"
                ],
                [
                    "ServiceName",
                    "ContainerName",
                    "ClusterName"
                ],
                [
                    "ContainerName",
                    "ClusterName",
                    "TaskDefinitionFamily"
                ],
                [
                    "TaskId",
                    "ServiceName",
                    "ContainerName",
                    "ClusterName"
                ],
                [
                    "TaskId",
                    "ContainerName",
                    "ClusterName",
                    "TaskDefinitionFamily"
                ]
            ]
        }
    ]
}
Let's also check the status during a failure.
After changing things to make the health check fail and waiting a while, the status became unhealthy.
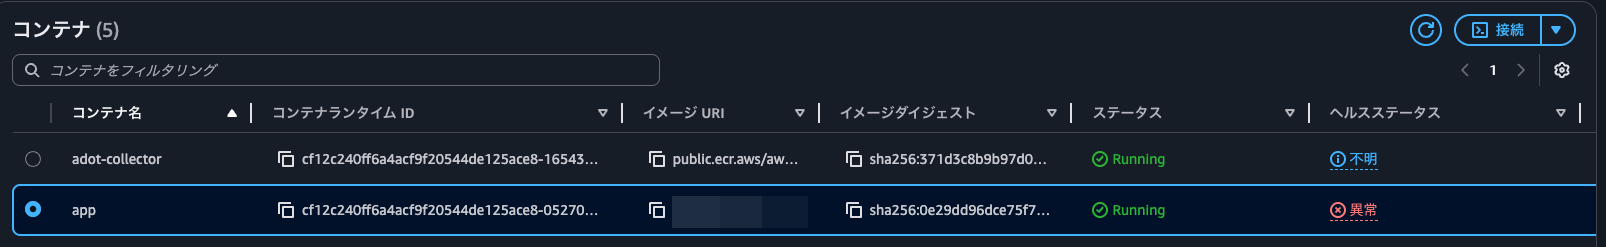
The UnHealthyContainerHealthStatus is now 1.
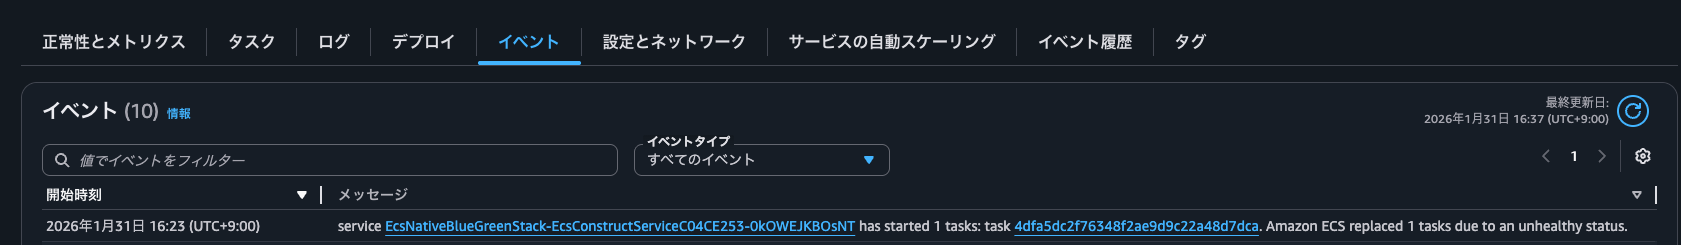
Looking at the ECS service events, we can see service EcsNativeBlueGreenStack-EcsConstructServiceC04CE253-0kOWEJKBOsNT has started 1 tasks: task 4dfa5dc2f76348f2ae9d9c22a48d7dca. Amazon ECS replaced 1 tasks due to an unhealthy status. This indicates that since this container was essential, it's trying to create and replace it with a new task. However, it's difficult to determine specifically which container it is from here. That's when using UnHealthyContainerHealthStatus is useful.
Useful for quickly detecting container stoppage and troubleshooting task stops
Amazon ECS now allows you to check container health status via CloudWatch metrics.
This is likely to be useful for quickly detecting container stoppage and troubleshooting task stops.
If you want to be notified when any container stops, you can use CloudWatch Metrics Insights Alarm with GROUP BY to set up multiple contributors per container in a single alarm, allowing you to quickly assess the situation from the notification content. (Be mindful of costs)
I hope this article helps someone.
This has been nonPi (@non____97) from the Cloud Business Division, Consulting Department!