
I tried handling logs larger than 16KB with AWS FireLens (AWS for Fluent Bit)
This page has been translated by machine translation. View original
16KB+ logs handling without splitting
Hello, I'm nonPi (@non____97).
Have you ever wanted to handle logs larger than 16KB without splitting them in Fluent Bit? I have.
As described in the Fluent Bit official manual, logs larger than 16KB are split in Fluent Bit.
When Fluent Bit is consuming logs from a container runtime, such as Docker, these logs will be split when larger than a certain limit, usually 16 KB. If your application emits a 100K log line, it will be split into seven partial messages. The docker parser will merge these back to one line. If instead you are using the Fluentd Docker Log Driver to send the logs to Fluent Bit, they might look like this:
{"source": "stdout", "log": "... omitted for brevity...", "partial_message": "true", "partial_id": "dc37eb08b4242c41757d4cd995d983d1cdda4589193755a22fcf47a638317da0", "partial_ordinal": "1", "partial_last": "false", "container_id": "a96998303938eab6087a7f8487ca40350f2c252559bc6047569a0b11b936f0f2", "container_name": "/hopeful_taussig"}]
When logs are split, it makes it difficult to query them correctly during log analysis.
To address this, you need to use a MultiLine filter with mode set to partial_message as follows:
[FILTER]
  name                  multiline
  match                 *
  multiline.key_content log
  mode                  partial_message
I couldn't find information online showing the state of logs before and after using the partial_message MultiLine filter in AWS for Fluent Bit, so I decided to try it myself.
Let's try it
Test environment
Here's my test environment:
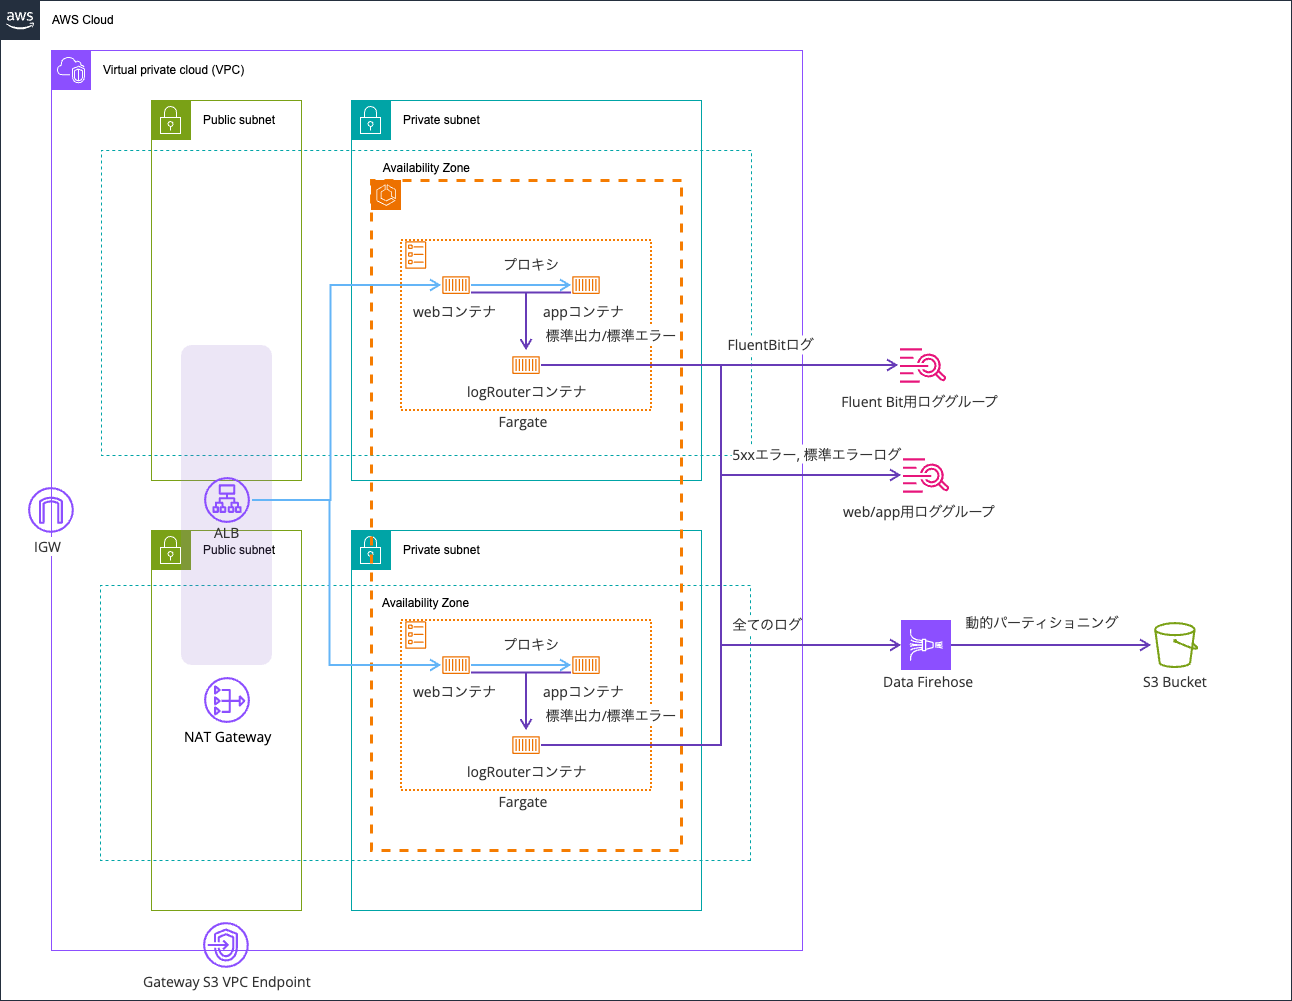
I'm reusing the environment from this article:
The code is stored in this repository:
Before using partial_message MultiLine filter
First, let's see what happens before using the partial_message MultiLine filter.
I created a path that outputs a log with 20,000 X characters when accessed at /app/large-log/.
app.get("/large-log", (req: Request, res: Response) => {
  // Generate a large log exceeding 16KB
  // To test FluentBit's 16KB limit
  const largeData = {
    message: "Testing 16KB+ log handling",
    timestamp: new Date().toISOString(),
    data: "X".repeat(20000),
  };

  req.log.error(largeData, "Large log entry generated");

  res.status(200).json({
    message: "Large log generated successfully",
    logSize: JSON.stringify(largeData).length,
    timestamp: new Date().toISOString(),
  });
});
Let's access it:
> curl http://EcsNat-AlbCo-gB01lRgFgX9v-1376474775.us-east-1.elb.amazonaws.com/app/large-log/
{"error":"Large log generated successfully","logSize":20089,"timestamp":"2026-01-17T08:17:23.126Z"}%
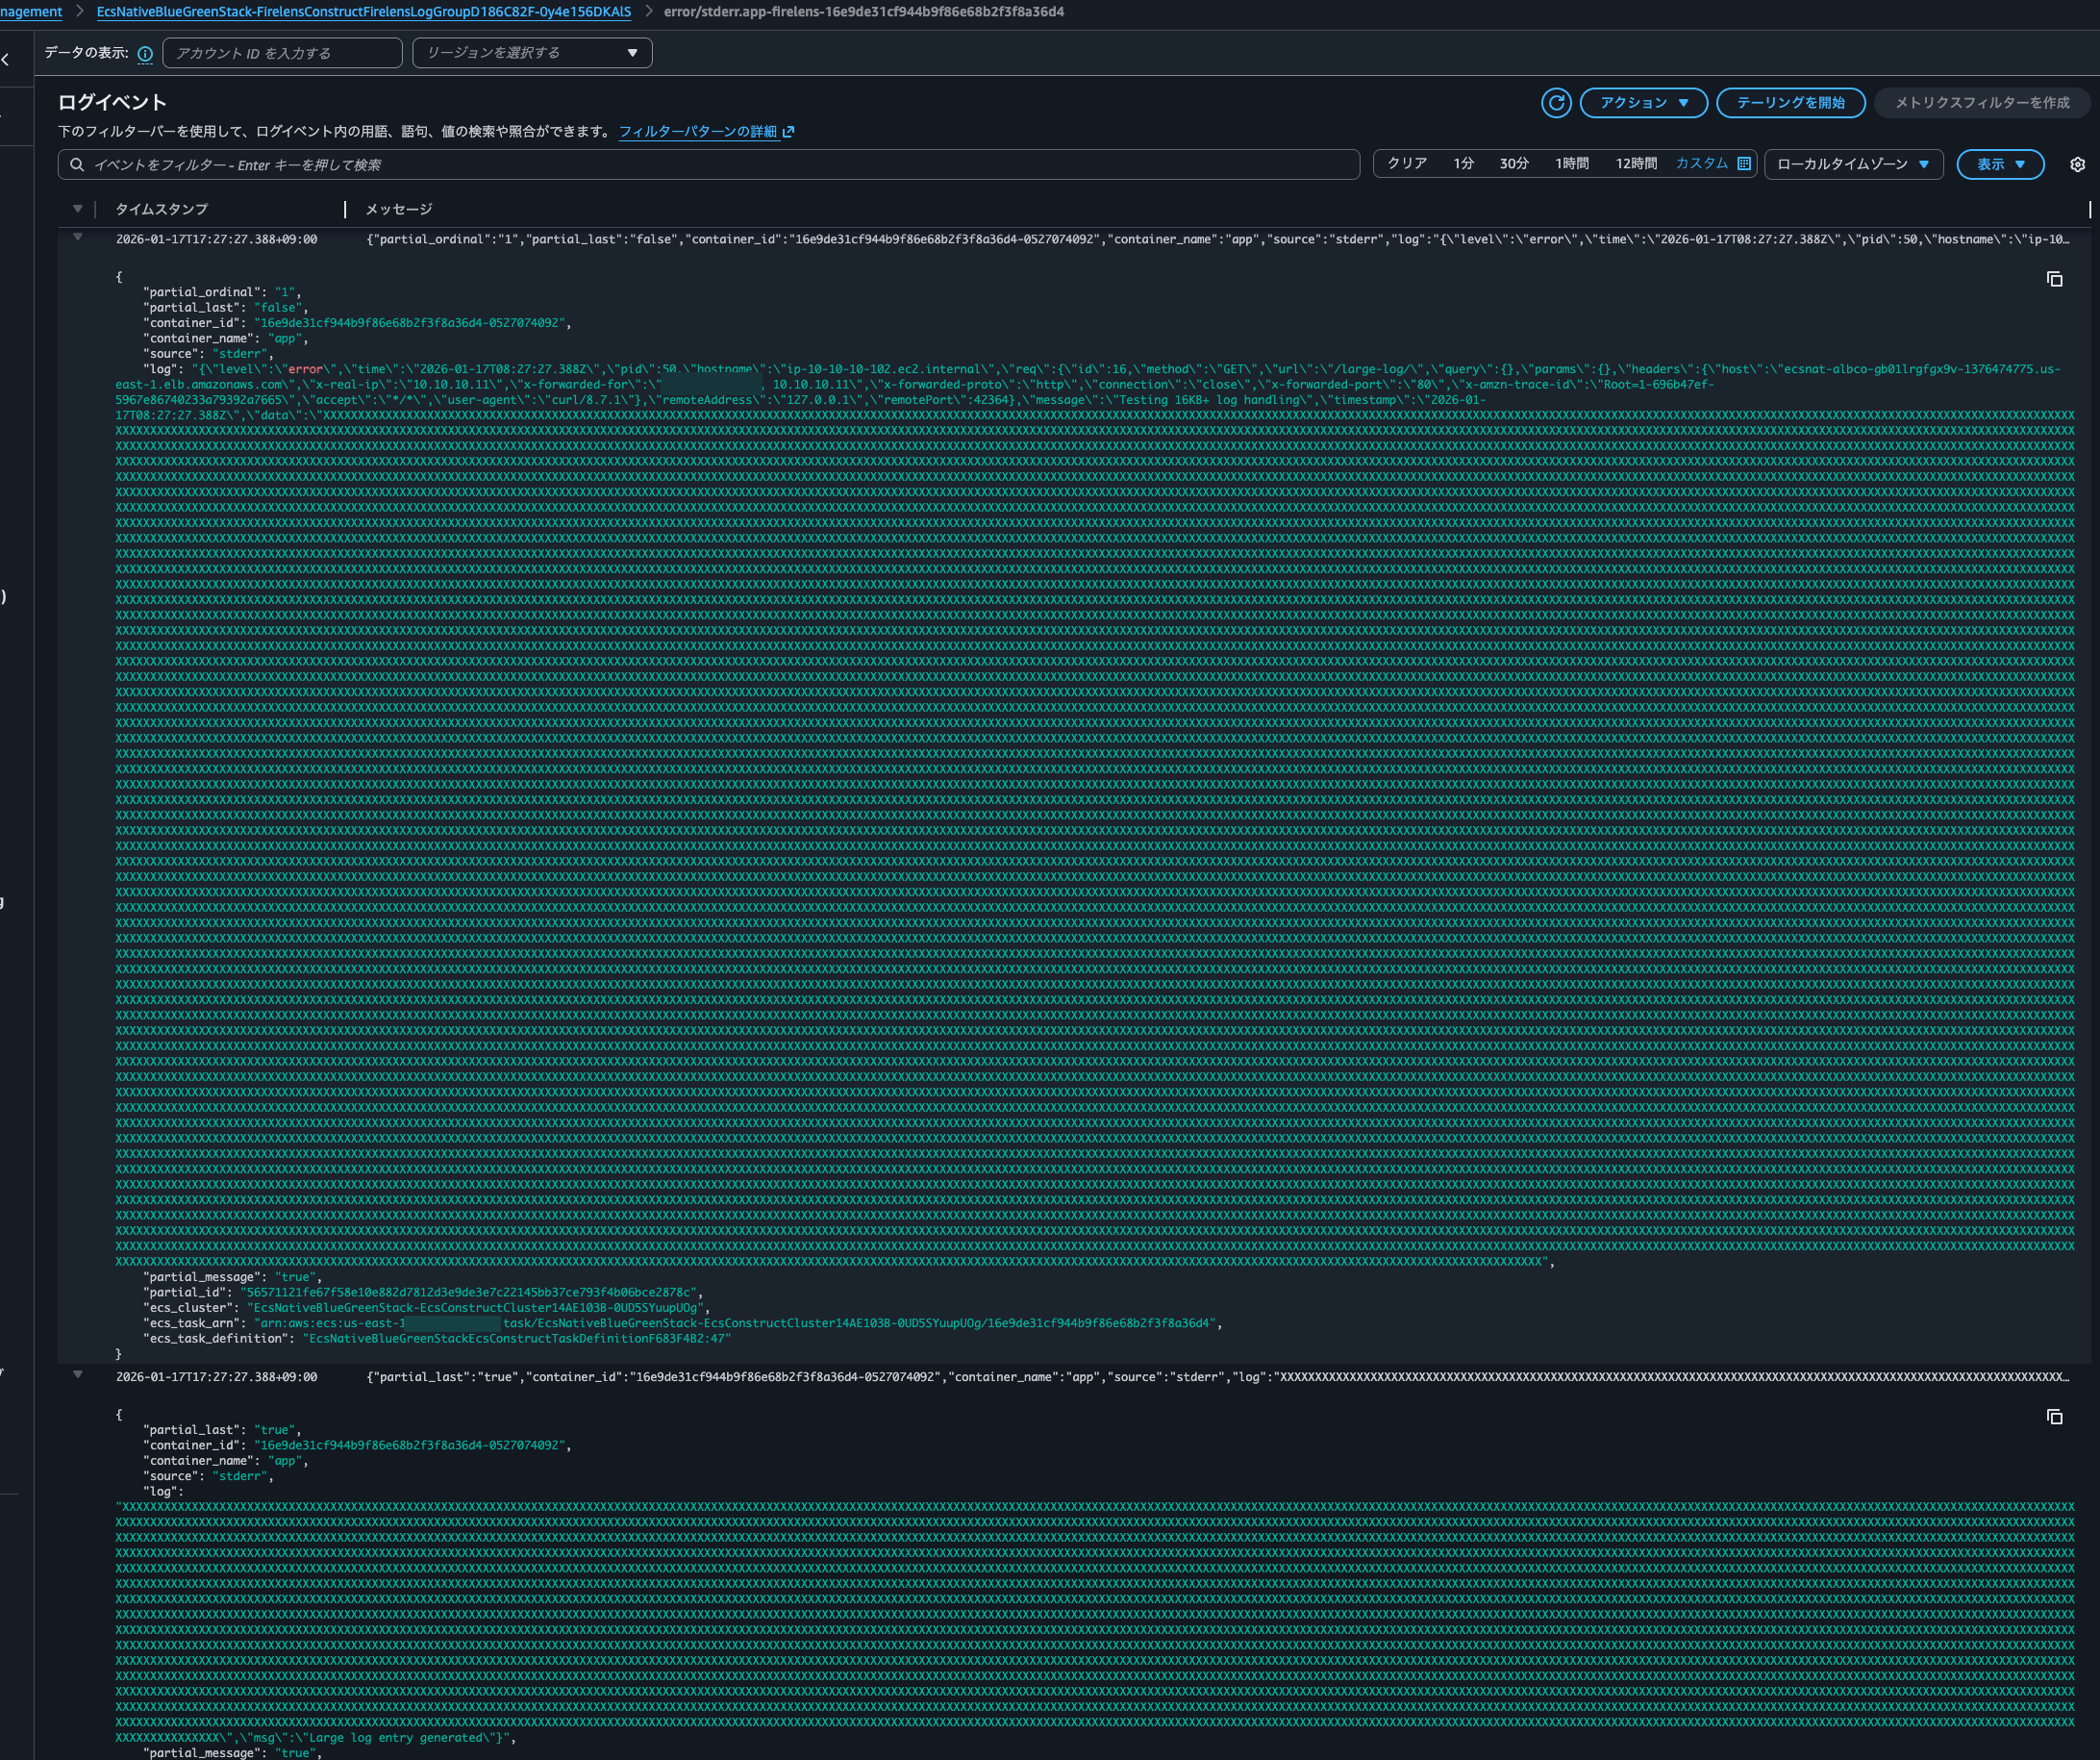
Checking CloudWatch Logs, I confirmed that the log was indeed split into two parts:
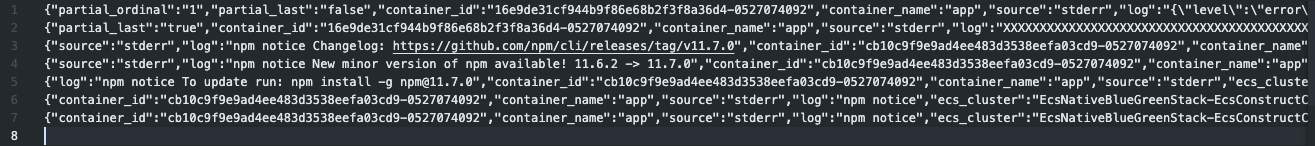
The logs output to the S3 bucket are also split into two lines:
Looking closely at the logs, due to the log being split in the middle, it's not parsed as JSON but treated as a string:
{
    "partial_ordinal": "1",
    "partial_last": "false",
    "container_id": "16e9de31cf944b9f86e68b2f3f8a36d4-0527074092",
    "container_name": "app",
    "source": "stderr",
    "log": "{\"level\":\"error\",\"time\":\"2026-01-17T08:27:27.388Z\",\"pid\":50,\"hostname\":\"ip-10-10-10-102.ec2.internal\",\"req\":{\"id\":16,\"method\":\"GET\",\"url\":\"/large-log/\",\"query\":{},\"params\":{},\"headers\":{\"host\":\"ecsnat-albco-gb01lrgfgx9v-1376474775.us-east-1.elb.amazonaws.com\",\"x-real-ip\":\"10.10.10.11\",\"x-forwarded-for\":\"<source IP address> 10.10.10.11\",\"x-forwarded-proto\":\"http\",\"connection\":\"close\",\"x-forwarded-port\":\"80\",\"x-amzn-trace-id\":\"Root=1-696b47ef-5967e86740233a79392a7665\",\"accept\":\"*/*\",\"user-agent\":\"curl/8.7.1\"},\"remoteAddress\":\"127.0.0.1\",\"remotePort\":42364},\"message\":\"Testing 16KB+ log handling\",\"timestamp\":\"2026-01-17T08:27:27.388Z\",\"data\":\"XXXXX..(omitted)..XXXXXX",
    "partial_message": "true",
    "partial_id": "56571121fe67f58e10e882d7812d3e9de3e7c22145bb37ce793f4b06bce2878c",
    "ecs_cluster": "EcsNativeBlueGreenStack-EcsConstructCluster14AE103B-0UD5SYuupUOg",
    "ecs_task_arn": "arn:aws:ecs:us-east-1:<AWS Account ID>:task/EcsNativeBlueGreenStack-EcsConstructCluster14AE103B-0UD5SYuupUOg/16e9de31cf944b9f86e68b2f3f8a36d4",
    "ecs_task_definition": "EcsNativeBlueGreenStackEcsConstructTaskDefinitionF683F4B2:47"
}
{
    "partial_last": "true",
    "container_id": "16e9de31cf944b9f86e68b2f3f8a36d4-0527074092",
    "container_name": "app",
    "source": "stderr",
    "log": "XXXX..(omitted)..XXX\",\"msg\":\"Large log entry generated\"}",
    "partial_message": "true",
    "partial_id": "56571121fe67f58e10e882d7812d3e9de3e7c22145bb37ce793f4b06bce2878c",
    "partial_ordinal": "2",
    "ecs_cluster": "EcsNativeBlueGreenStack-EcsConstructCluster14AE103B-0UD5SYuupUOg",
    "ecs_task_arn": "arn:aws:ecs:us-east-1:<AWS Account ID>:task/EcsNativeBlueGreenStack-EcsConstructCluster14AE103B-0UD5SYuupUOg/16e9de31cf944b9f86e68b2f3f8a36d4",
    "ecs_task_definition": "EcsNativeBlueGreenStackEcsConstructTaskDefinitionF683F4B2:47"
}
This is inconvenient when searching logs using CloudWatch Logs Insights.
After using partial_message MultiLine filter
Now let's see what happens after using the partial_message MultiLine filter.
I configured Fluent Bit as follows:
# ref : 詳解 FireLens – Amazon ECS タスクで高度なログルーティングを実現する機能を深く知る | Amazon Web Services ブログ https://aws.amazon.com/jp/blogs/news/under-the-hood-firelens-for-amazon-ecs-tasks/
# ref : aws-for-fluent-bit/use_cases/init-process-for-fluent-bit/README.md at mainline · aws/aws-for-fluent-bit https://github.com/aws/aws-for-fluent-bit/blob/mainline/use_cases/init-process-for-fluent-bit/README.md
[SERVICE]
    Flush                 1
    Grace                 30
    Parsers_File          /fluent-bit/parsers/parsers.conf

# Recombine log records split due to the 16KB limit
# Recombine into the original single log record using partial_message mode
# ref : Multiline | Fluent Bit: Official Manual https://docs.fluentbit.io/manual/data-pipeline/filters/multiline-stacktrace
[FILTER]
    Name                  multiline
    Match                 *-firelens-*
    multiline.key_content log
    mode                  partial_message
    flush_ms              2000

# Apply multiline parser to app container logs
# This doesn't have much effect since we're using pino logger for structured logs
# ref : Multiline parsing | Fluent Bit: Official Manual https://docs.fluentbit.io/manual/data-pipeline/parsers/multiline-parsing
# ref : 複数行またはスタックトレースの Amazon ECS ログメッセージの連結 - Amazon Elastic Container Service https://docs.aws.amazon.com/ja_jp/AmazonECS/latest/developerguide/firelens-concatanate-multiline.html
[FILTER]
    Name                  multiline
    Match                 app-firelens*
    multiline.key_content log
    multiline.parser      nodejs_stacktrace

# Parse app container logs as JSON
# Keep timestamp in ISO 8601 format as is (using json_without_time parser)
# Using the default parser would fail parsing as follows:
#  [2026/01/13 01:47:55.17286147] [error] [parser] cannot parse '2026-01-13T01:47:53.124Z'
#  [2026/01/13 01:47:55.17313453] [ warn] [parser:json] invalid time format %d/%b/%Y:%H:%M:%S %z for '2026-01-13T01:47:53.124Z'
# ref : JSON format | Fluent Bit: Official Manual https://docs.fluentbit.io/manual/data-pipeline/parsers/json
[FILTER]
    Name                  parser
    Match                 app-firelens-*
    Key_Name              log
    Parser                json_without_time
    Reserve_Data          On

# Parse web container logs
# Using Nginx parser for structured logs since we're using Nginx
[FILTER]
    Name                  parser
    Match                 web-firelens-*
    Key_Name              log
    Parser                nginx
    Reserve_Data          On

# Exclude ELB health check logs from web container
# Based on User agent
[FILTER]
    Name                  grep
    Match                 web-firelens-*
    Exclude               agent ELB-HealthChecker/2\.0

# Add tags to error logs
# Add tags for status codes 5xx or stderr logs
# Exclude logs that already have 5xx or stderr tags to prevent infinite loops
[FILTER]
    Name                  rewrite_tag
    Match_Regex           ^(?!5xx\.)(?!stderr\.).*-firelens-.*
    Rule                  $code ^5\d{2}$ 5xx.$TAG false
    Rule                  $source ^stderr$ stderr.$TAG false
    Emitter_Name          re_emitted

# Output all logs to Firehose
# Don't compress as we're using dynamic partitioning on the Data Firehose side
# Decompression is possible on the Data Firehose side but costs extra and is only available for CloudWatch Logs sources
# ref : Amazon Kinesis Data Firehose | Fluent Bit: Official Manual https://docs.fluentbit.io/manual/data-pipeline/outputs/firehose
# ref : CloudWatch Logs を解凍する - Amazon Data Firehose https://docs.aws.amazon.com/ja_jp/firehose/latest/dev/writing-with-cloudwatch-logs-decompression.html
[OUTPUT]
    Name                  kinesis_firehose
    Match                 *-firelens-*
    delivery_stream       ${FIREHOSE_DELIVERY_STREAM_NAME}
    region                ${AWS_REGION}
    time_key              datetime
    time_key_format       %Y-%m-%dT%H:%M:%S.%3NZ

# Output only logs tagged with 5xx or stderr to CloudWatch Logs
# ref : Amazon CloudWatch | Fluent Bit: Official Manual https://docs.fluentbit.io/manual/data-pipeline/outputs/cloudwatch
[OUTPUT]
    Name                  cloudwatch_logs
    Match_Regex           ^(5xx\.|stderr\.).*
    region                ${AWS_REGION}
    log_group_name        ${LOG_GROUP_NAME}
    log_stream_prefix     error/
I uploaded the configuration file to the S3 bucket and stopped the task to replace it.
Then I generated another large log:
> curl http://EcsNat-AlbCo-gB01lRgFgX9v-1376474775.us-east-1.elb.amazonaws.com/app/large-log/
{"message":"Large log generated successfully","logSize":20089,"timestamp":"2026-01-17T08:41:25.539Z"}%
This time, I confirmed that the logs weren't split and were combined into a single entry:
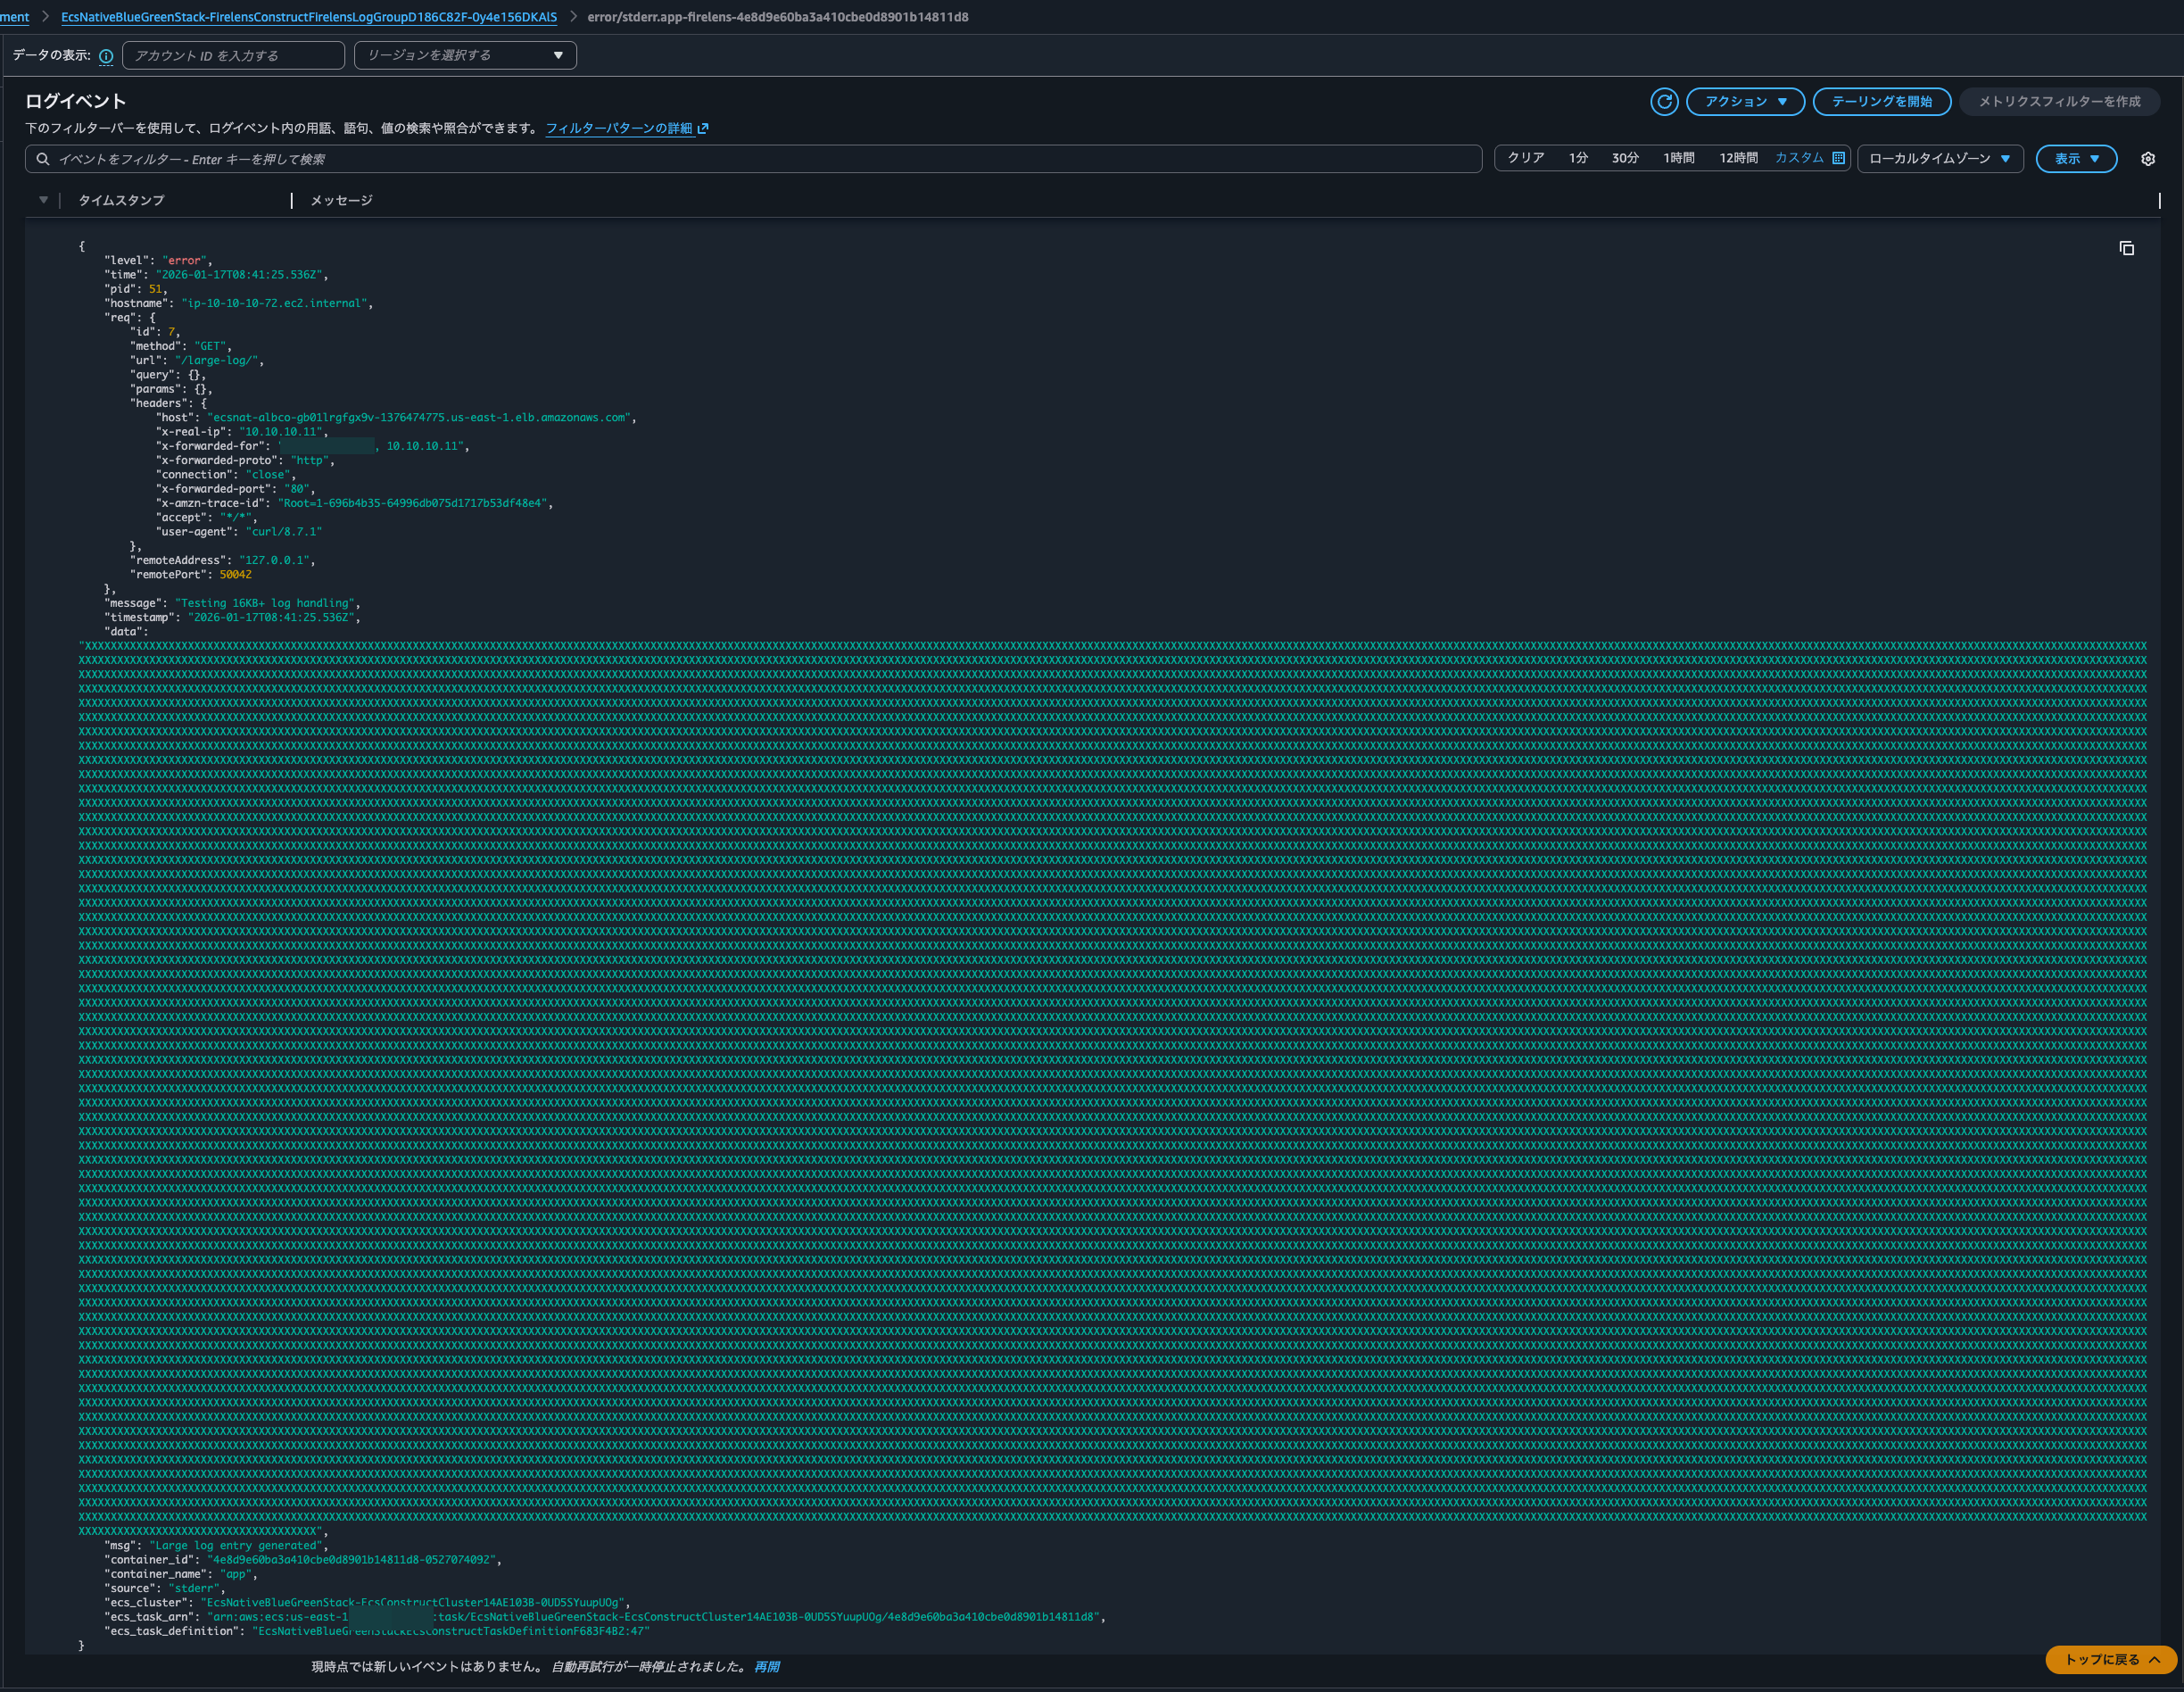
The logs output to the S3 bucket were similarly combined (there are 2 lines because I accessed it twice):
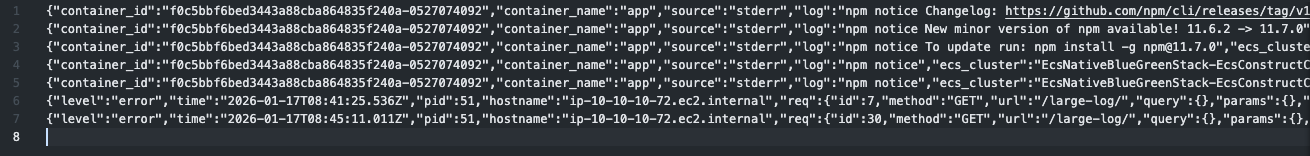
Checking the log content, I confirmed that the log was correctly parsed as JSON:
{
    "level": "error",
    "time": "2026-01-17T08:41:25.536Z",
    "pid": 51,
    "hostname": "ip-10-10-10-72.ec2.internal",
    "req": {
        "id": 7,
        "method": "GET",
        "url": "/large-log/",
        "query": {},
        "params": {},
        "headers": {
            "host": "ecsnat-albco-gb01lrgfgx9v-1376474775.us-east-1.elb.amazonaws.com",
            "x-real-ip": "10.10.10.11",
            "x-forwarded-for": "<source IP address> 10.10.10.11",
            "x-forwarded-proto": "http",
            "connection": "close",
            "x-forwarded-port": "80",
            "x-amzn-trace-id": "Root=1-696b4b35-64996db075d1717b53df48e4",
            "accept": "*/*",
            "user-agent": "curl/8.7.1"
        },
        "remoteAddress": "127.0.0.1",
        "remotePort": 50042
    },
    "message": "Testing 16KB+ log handling",
    "timestamp": "2026-01-17T08:41:25.536Z",
    "data": "XXXXX..(omitted)..XXXXX",
    "msg": "Large log entry generated",
    "container_id": "4e8d9e60ba3a410cbe0d8901b14811d8-0527074092",
    "container_name": "app",
    "source": "stderr",
    "ecs_cluster": "EcsNativeBlueGreenStack-EcsConstructCluster14AE103B-0UD5SYuupUOg",
    "ecs_task_arn": "arn:aws:ecs:us-east-1:<AWS Account ID>:task/EcsNativeBlueGreenStack-EcsConstructCluster14AE103B-0UD5SYuupUOg/4e8d9e60ba3a410cbe0d8901b14811d8",
    "ecs_task_definition": "EcsNativeBlueGreenStackEcsConstructTaskDefinitionF683F4B2:47"
}
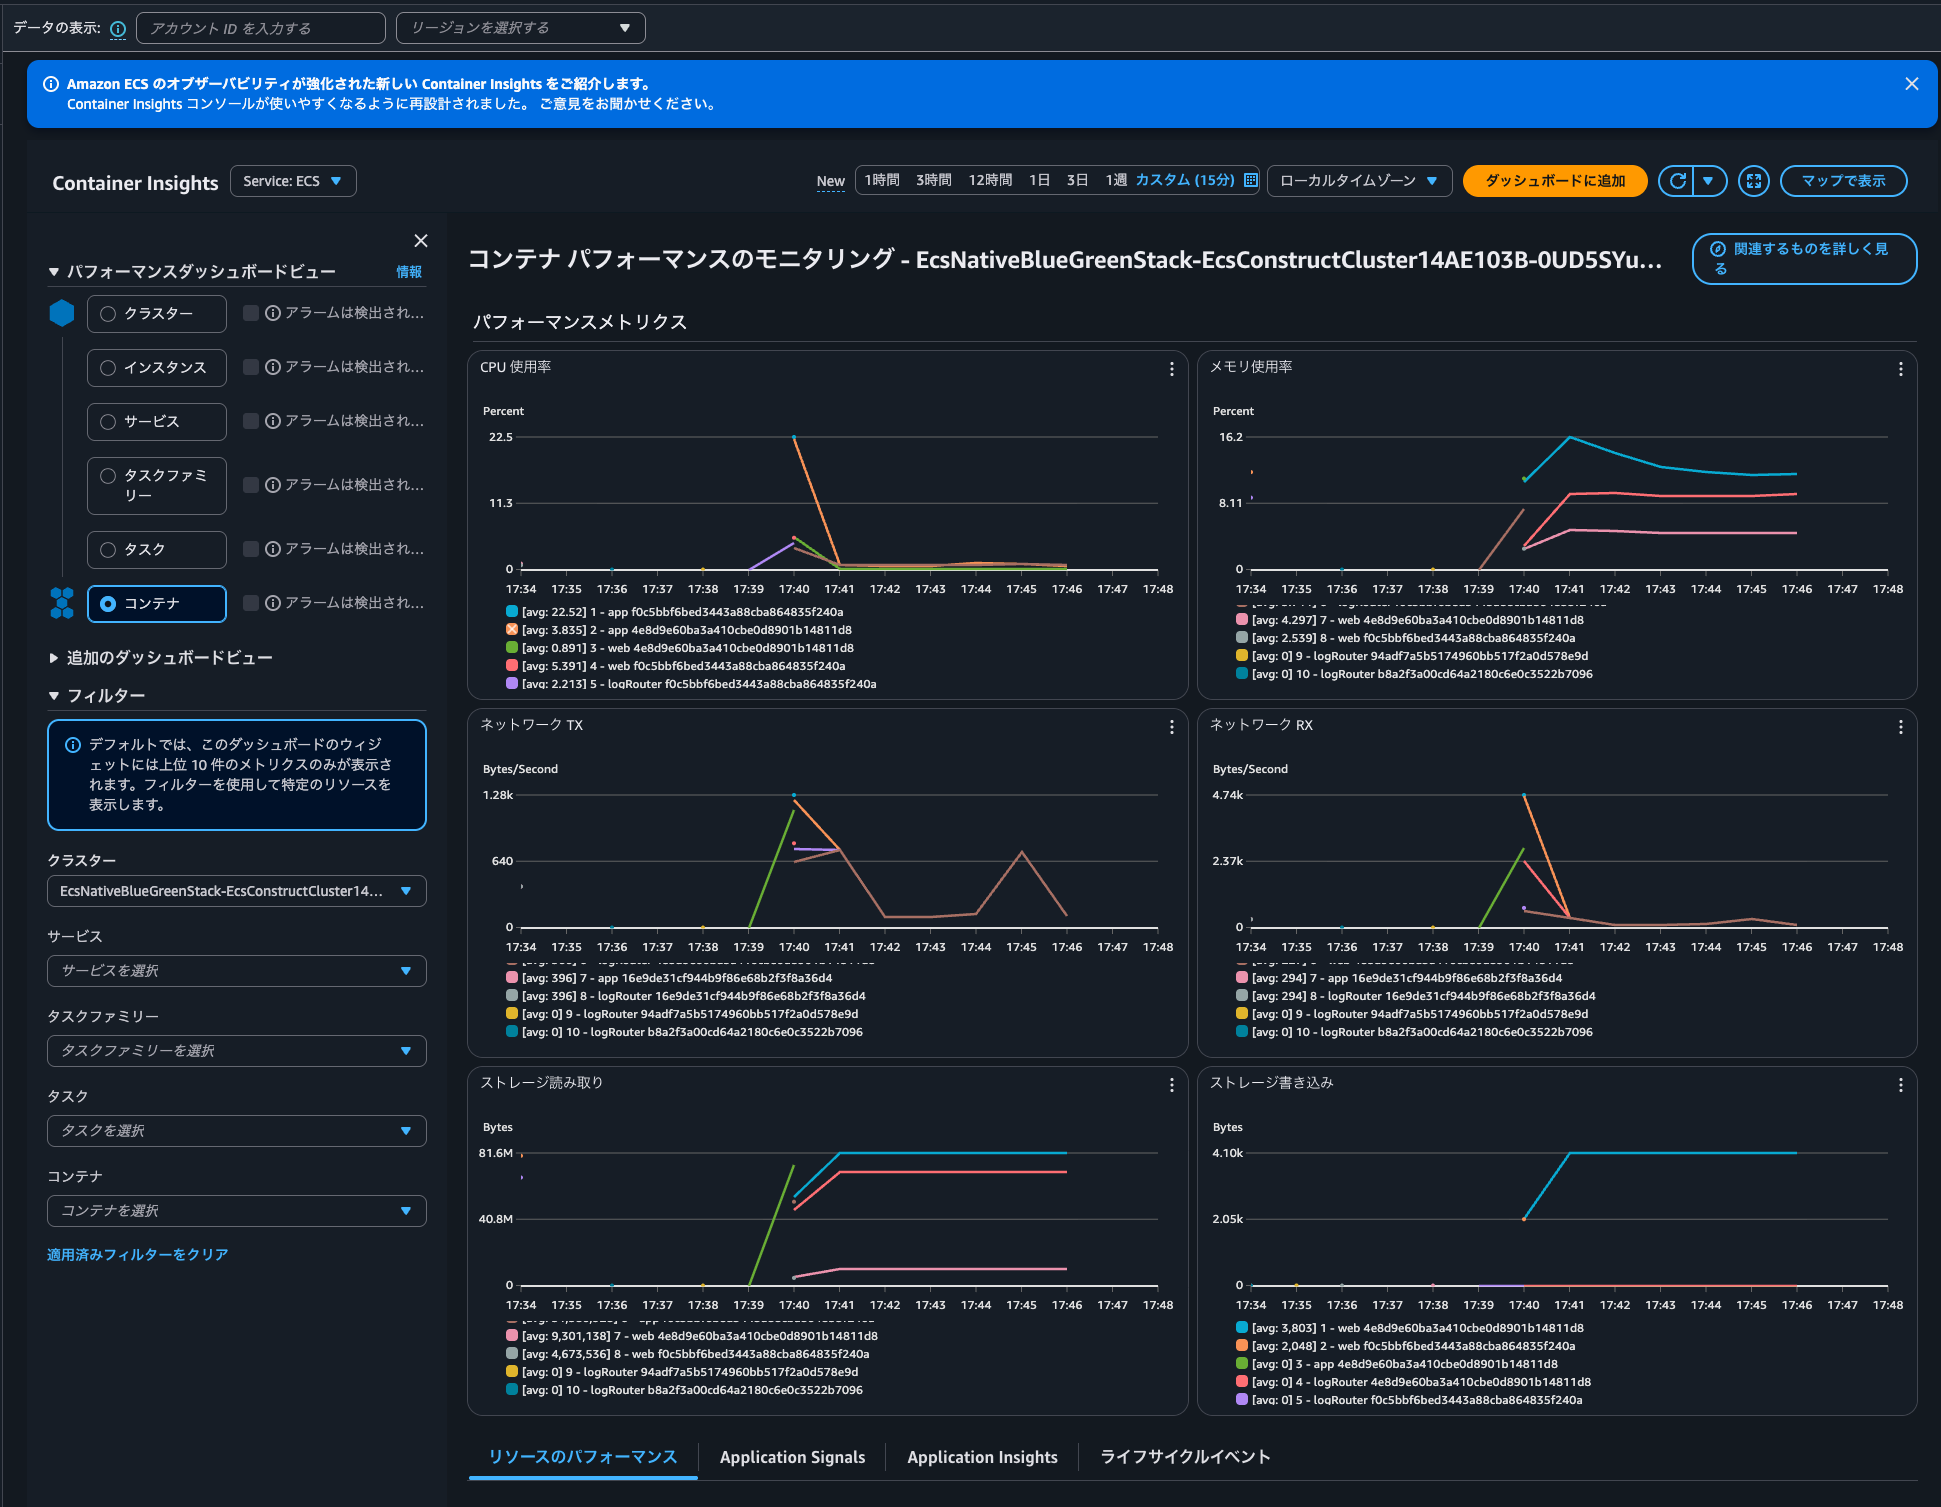
By the way, I didn't observe any significant spikes in CPU, memory, or other metrics for the Fluent Bit container when handling 16KB logs:
Be careful with Fluent Bit configuration when outputting large logs
I've demonstrated handling logs larger than 16KB with AWS FireLens (AWS for Fluent Bit).
When outputting large logs, be mindful of your Fluent Bit configuration.
Note that CloudWatch Logs has a 1MB limit per log event. While you probably won't output 1MB logs often, it's good to be aware of this limit.
The batch of events must satisfy the following constraints:
- The maximum batch size is 1,048,576 bytes. This size is calculated as the sum of all event messages in UTF-8, plus 26 bytes for each log event.
- Events more than 2 hours in the future are rejected while processing remaining valid events.
- Events older than 14 days or preceding the log group's retention period are rejected while processing remaining valid events.
- The log events in the batch must be in chronological order by their timestamp. The timestamp is the time that the event occurred, expressed as the number of milliseconds after Jan 1, 1970 00:00:00 UTC. (In AWS Tools for PowerShell and the AWS SDK for .NET, the timestamp is specified in .NET format: yyyy-mm-ddThh:mm:ss. For example, 2017-09-15T13:45:30.)
- A batch of log events in a single request must be in a chronological order. Otherwise, the operation fails.
- Each log event can be no larger than 1 MB.
- The maximum number of log events in a batch is 10,000.
- For valid events (within 14 days in the past to 2 hours in future), the time span in a single batch cannot exceed 24 hours. Otherwise, the operation fails.
Fluent Bit also compares the log buffer size with CloudWatch Logs' 1MB limit for validation. In this test, we set Flush to 1, so it attempts to output logs every second.
The relevant quotas to consider when sending logs to Data Firehose are:
| Name | Default | Adjustable | Description |
|---|---|---|---|
| Dynamic partitions | 500 per supported region | No | Maximum number of dynamic partitions for delivery streams in the current region. |
| Put request rate | 2,000 for us-east-1, us-west-2, eu-west-1 1,000 for other supported regions |
No | Maximum number of PutRecord and PutRecordBatch requests combined per second that can be made to a delivery stream in the current region. |
| Data rate | 5 for us-east-1, us-west-2, eu-west-1 1 for other supported regions |
No | Maximum capacity of a delivery stream in the current region (MiB per second). |
| Record rate | 500,000 for us-east-1, us-west-2, eu-west-1 100,000 for other supported regions |
No | Maximum capacity of a delivery stream in the current region (records per second). |
Excerpt from: Amazon Data Firehose endpoints and quotas - AWS General Reference
I hope this article is helpful to someone.
That's all from nonPi (@non____97) of the Cloud Business Division, Consulting Department!