
I Created a Skill with Claude Code to Analyze Costs Across Multiple AWS Accounts at Once
This page has been translated by machine translation. View original
Introduction
I am kasama from the Data Business Division.
In this article, I will introduce a Skill I created with Claude Code that analyzes costs across multiple AWS accounts at once. This Skill directly queries CUR 2.0 Parquet data with DuckDB, identifies resource creators through CloudTrail, generates improvement suggestions with Claude Code, and compiles everything into a single HTML report.
Prerequisites
- Claude Code is installed
- AWS CLI v2, DuckDB CLI, and jq are installed
- Authentication method compatible with AWS CLI's
credential_processis configured (authentication should complete withaws ... --profile <your-profile>). In this case, I'm using aws-vault
- CUR 2.0 export is configured (Parquet format, output to S3)
Setting up CUR 2.0 export
This Skill directly queries CUR 2.0 Parquet data on S3 using DuckDB, so CUR 2.0 export needs to be configured in advance. Follow these steps to set it up.
Open AWS Console → Billing and Cost Management → Data Exports → Create export and select Standard data export.
Data table settings are as follows:
| Item | Setting |
|---|---|
| Table | CUR 2.0 |
| Include resource IDs | ON |
| Split cost allocation data | ON |
| Time granularity | Daily |
| Column selection | Select all |
Delivery option settings are as follows:
| Item | Setting |
|---|---|
| Compression type / File format | Parquet |
| File versioning | Overwrite existing data export file |
| Data export refresh cadence | Daily |
Specify the destination S3 bucket and path prefix, then click Create. The path prefix must match the s3PathPattern in config.yaml. The default s3PathPattern uses cur-reports as a prefix, so specify cur-reports as the path prefix in the export settings as well. It may take up to 24 hours for the initial data to be output.
Once the export is complete, Parquet files will be output to a path like the following:
s3://<your-bucket>/<prefix>/<export-name>/data/BILLING_PERIOD=YYYY-MM/
Architecture
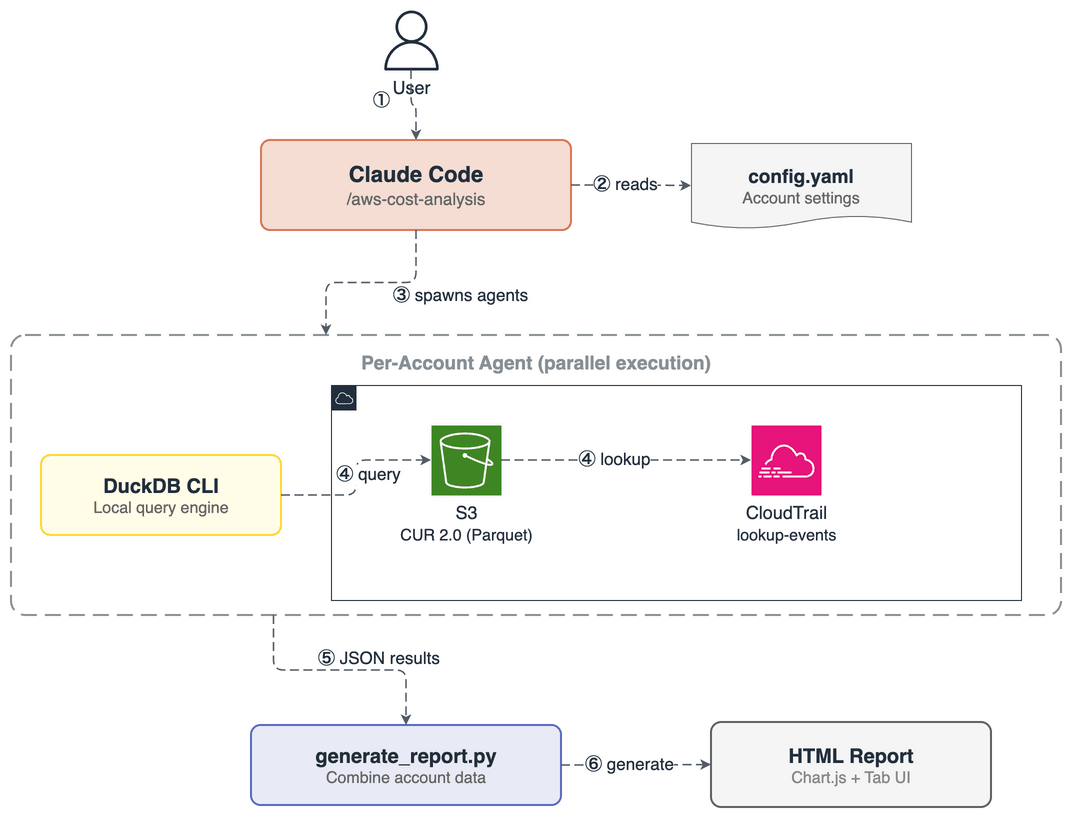
I'll explain the process flow according to the numbered steps in the diagram.
- User executes
/aws-cost-analysisin Claude Code - Load config.yaml and select target accounts and target month
- Launch Agents in parallel for each account
- Each Agent queries CUR 2.0 Parquet data on S3 using DuckDB CLI and identifies resource creators through CloudTrail
- Analysis results (JSON) from each Agent are aggregated in Claude Code, which generates improvement suggestions
- Python script (generate_report.py) generates an HTML report
Why AWS native services alone are not enough
AWS has several services for cost analysis. Cost Explorer enables cost analysis by service and resource, and can cross-check multiple accounts from an Organizations management account. Trusted Advisor detects idle resources and unused reserved instances, offering cost optimization suggestions. Amazon Q Developer's cost management features allow you to ask cost-related questions in natural language.
However, when operating multiple accounts, the following issues arise:
- Need to open the management console for each account. Check Cost Explorer, find high-cost resources, then check CloudTrail to see who created them, and repeat for each account
- Manual identification of resource creators. Cost Explorer shows resource IDs and cost allocation tags, but doesn't tell you "who created that resource." If the
aws:createdBytag is not set, you need to check CloudTrail separately
With this Skill, you can run /aws-cost-analysis once locally and complete cost analysis and report generation for multiple accounts at once. The biggest benefit I found was eliminating the need to open the management console multiple times.
HTML report structure
The generated HTML report includes the following elements:
- Summary cards (monthly total, comparison with previous month, forecast, budget consumption rate)
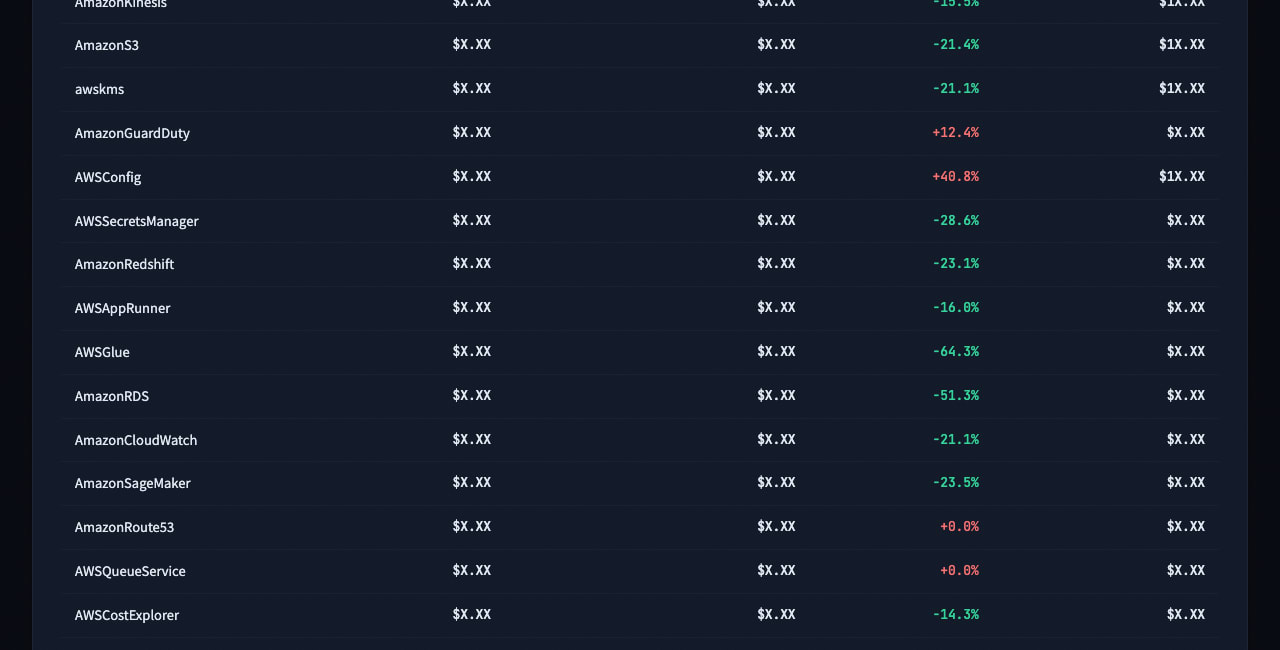
- Service-by-service cost horizontal bar graph + table (with previous month comparison, services with +50% or more compared to previous month highlighted)
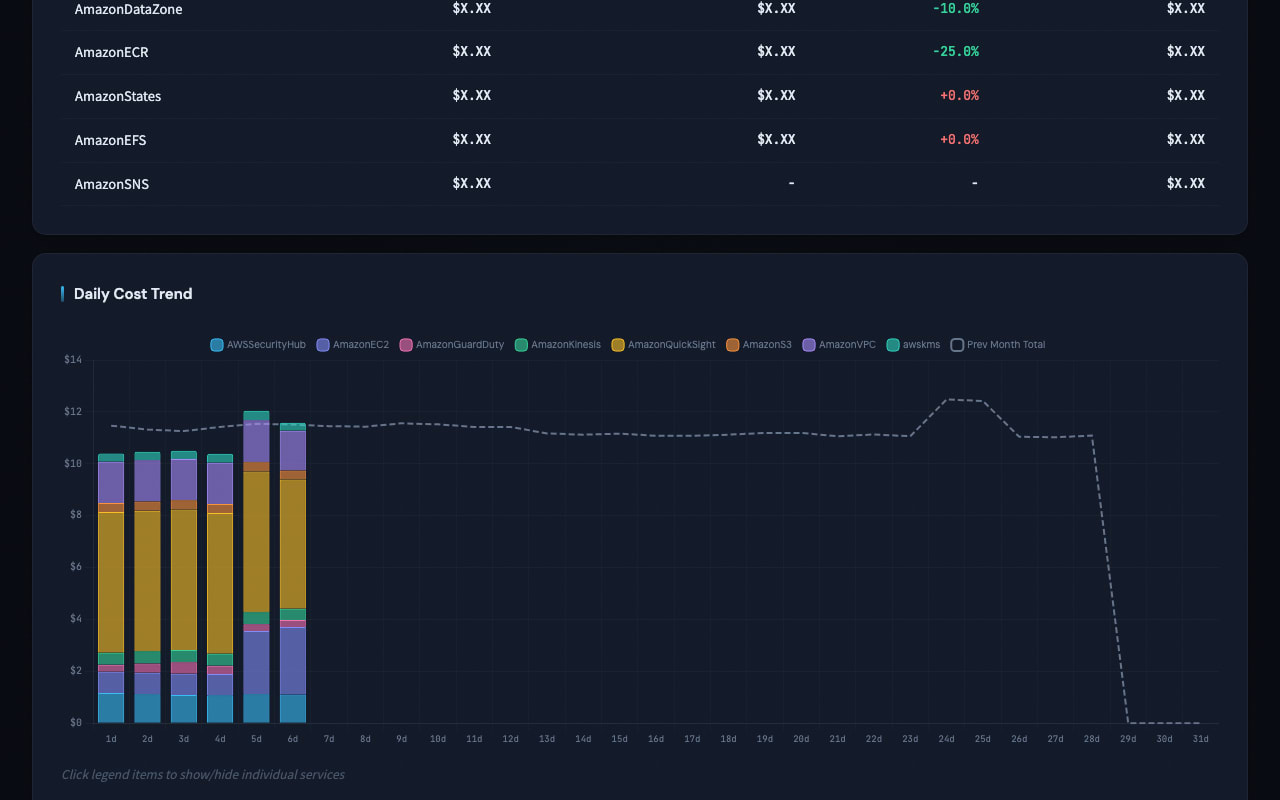
- Daily cost trend stacked bar graph + previous month line overlay
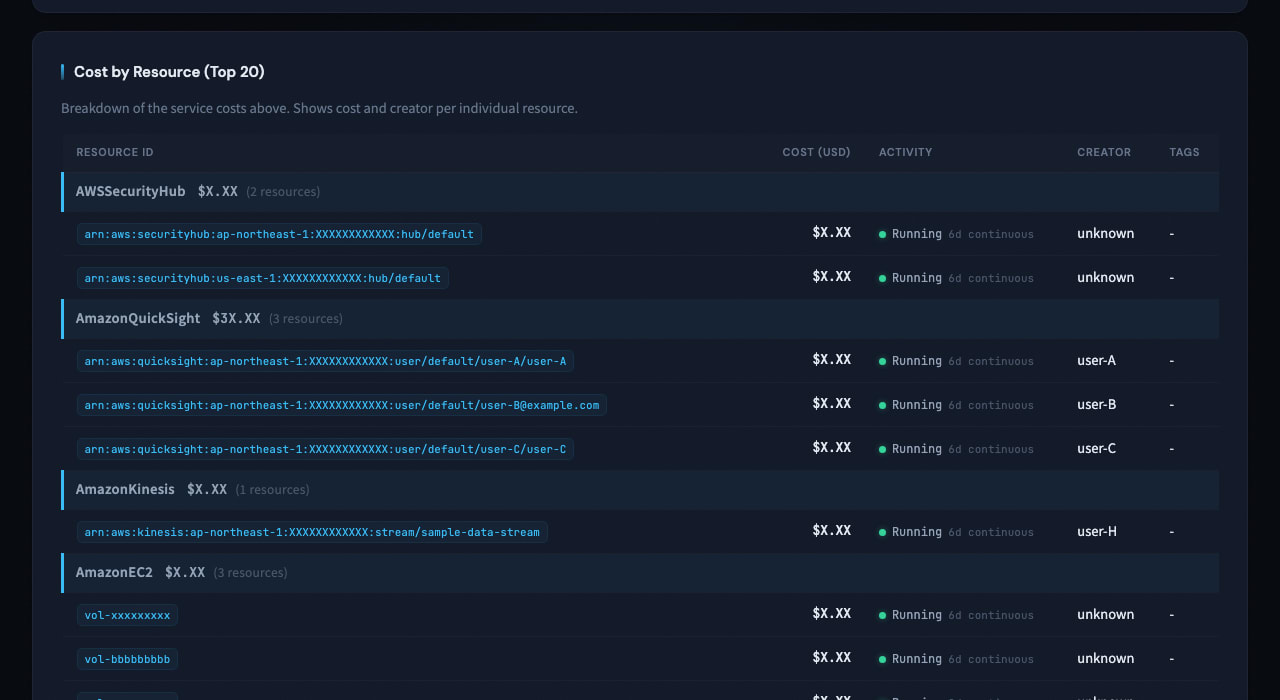
- Resource-by-resource Top 20 table (resource ID, tags, creator, new/continuing determination)
- Improvement suggestions generated by Claude Code (with priority and estimated cost reduction)
For multiple accounts, you can switch between accounts using the tab bar. The HTML is a standalone file that can be shared simply by uploading the file to Slack or other platforms.
Implementation
The implementation code is stored on GitHub.
The Skill file structure is as follows:
.claude/skills/aws-cost-analysis/
├── SKILL.md
├── config.yaml.example             # Account configuration template
├── references/
│   ├── INSTRUCTIONS.md             # Workflow procedures
│   ├── agent_prompt_template.md    # Account-specific Agent prompt template
│   └── analysis_queries.sql        # DuckDB query collection
└── scripts/
    ├── generate_report.py          # HTML report generation script
    └── report_template.html        # HTML template (Chart.js + tab UI)
SKILL.md is the entry point for the Skill, which is loaded first when Claude Code executes /aws-cost-analysis. INSTRUCTIONS.md defines the steps of the workflow, and analysis_queries.sql contains SQL queries for analyzing CUR 2.0 with DuckDB. agent_prompt_template.md is a prompt template for launching Agents for each account. generate_report.py combines the analysis results from all accounts into report_template.html to generate an HTML report.
Skill Creation Process
I didn't write this Skill from scratch, but created it step by step using Claude Code's Skills and commands. Here's the creation flow in order.
Creating a Skill template with skill-creator
I created a template for the Skill using /skill-creator, which is included in the Anthropic official plugin.
/skill-creator is a Skill for interactively creating Claude Code Skills, which automatically generates SKILL.md, workflow procedures, and reference file structures when you tell it the purpose and requirements of the Skill.
Why an HTML report?
The idea of outputting analysis results as an HTML report came from Claude Code's /insights command. /insights is a command that outputs Claude Code usage stats as an interactive HTML dashboard, and I found the approach of visualizing data in HTML to be very easy to understand, so I adopted a similar format for this cost analysis Skill.
Creating an HTML template with frontend-design
The HTML report template (report_template.html) was created using the /frontend-design Skill included in the Anthropic official plugin.
/frontend-design is a Skill with built-in design guidelines for typography, color schemes, animations, and more. For this project, I communicated requirements such as a dark theme dashboard UI, Chart.js graph rendering, and multi-account display with tab switching. Honestly, I'm not very familiar with frontend, and Claude Code would have done a decent job without this Skill, but I felt that using it improved the design quality by one level.
Validating with skill-creator and finishing with simplify
After all the Skill files were assembled, I asked /skill-creator to validate the Skill. I found and fixed missing workflow steps and query issues.
Finally, I reviewed the modified code with /simplify and organized redundant parts of the HTML template and Python script. /simplify is a Skill that targets recently changed code by default and improves code clarity and maintainability while preserving functionality.
Trying it out
Running the Skill
First, copy the skill to your project root. By placing the Skill files under .claude/skills/, Claude Code will recognize the skill.
cp -r 66_aws_cost_analysis_skill/.claude/skills/aws-cost-analysis .claude/skills/
Next, copy config.yaml.example to create config.yaml and edit it to match your environment.
cd .claude/skills/aws-cost-analysis
cp config.yaml.example config.yaml
After creating config.yaml, run /aws-cost-analysis in a Claude Code session.
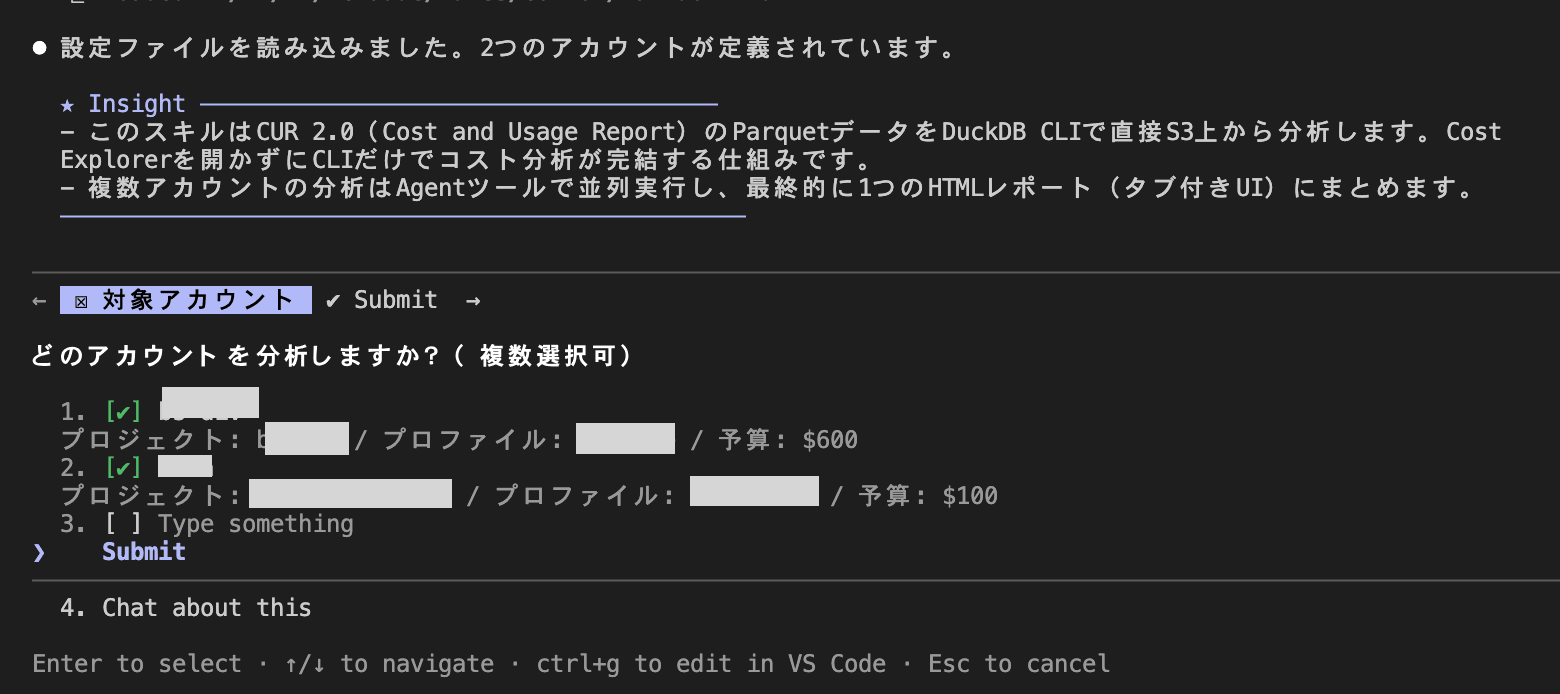
When you run the Skill, it first displays the list of accounts defined in config.yaml and asks you to select the accounts to analyze.
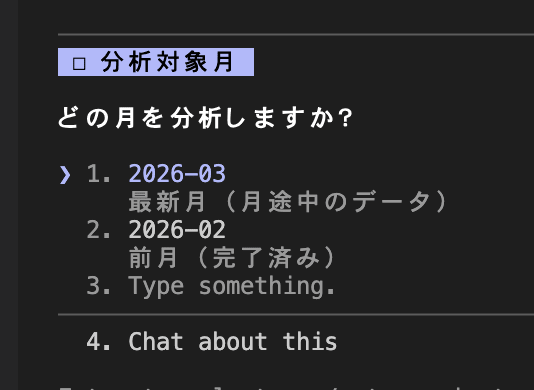
Next, you select the month to analyze from the available CUR data months.
DuckDB queries are executed for each account. If you select multiple accounts, they are executed in parallel using the Agent tool.

Finally, a single HTML file integrating data from all accounts is output, and the Skill processing is complete.

Generated HTML report
When you open the HTML in a browser, a dashboard like the following is displayed. (Amounts and resource names have been masked or replaced.)
Summary cards show the current month's total, comparison with the previous month, forecast, and budget consumption rate. You can switch accounts via the tab bar.

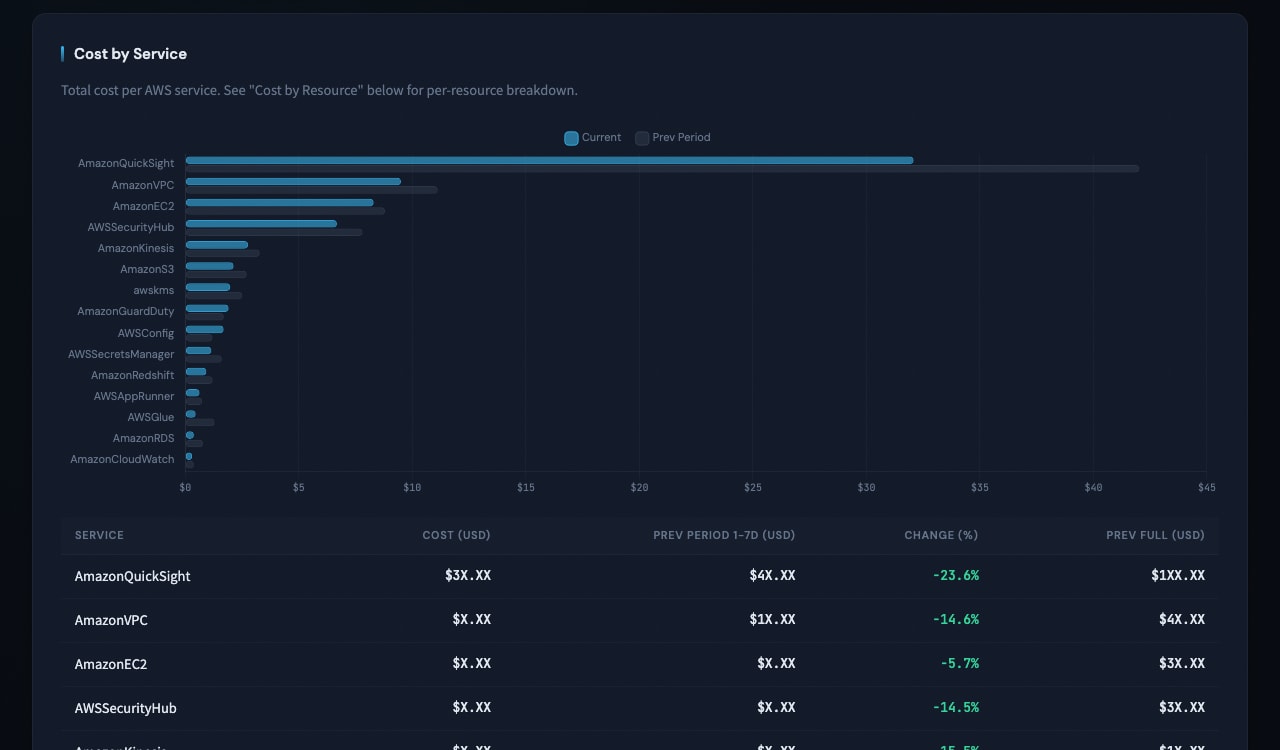
Service-by-service costs are displayed in horizontal bar graphs and tables.
Daily cost trends are shown in stacked bar graphs, with a line overlay for comparison with the previous month.
The Top 20 resources table shows resource IDs, costs, activity status, creators, and tags.
Improvement suggestions generated by Claude Code are displayed with priority and estimated cost reduction.


You can check the cost status of each account by switching accounts using the tab bar.
Final Thoughts
I created a Skill with Claude Code to analyze costs across multiple AWS accounts at once. Previously, I output cost analysis results in text format, but by switching to HTML reports, I added visual representations like graphs and tab switching, making it much easier to grasp the overall picture of the data. The ability to intuitively read anomalies and trends is a major benefit. I feel that the approach of outputting analysis data in an easy-to-understand format like HTML could be useful in various scenarios beyond cost analysis. I hope this has been helpful.