
I checked what kind of CloudWatch alarms are configured when setting up CloudWatch Application Insights for ECS clusters in Container Insights
This page has been translated by machine translation. View original
I want to check what kind of CloudWatch alarms are configured when setting up CloudWatch Application Insights for ECS
Hello, this is nonPi (@non____97).
Have you ever wondered what kind of CloudWatch alarms are configured when setting up CloudWatch Application Insights for ECS? I have.
As introduced in the article below, you can easily enable CloudWatch Application Insights from the Container Insights console.
By setting up Application Insights, you can easily configure application dashboards and alarms, as well as manage events.
So what kind of alarms are configured? I couldn't find any documentation about what alarms are set up, so I decided to check it myself.
Summary
- CloudWatch Alarms configured when setting up CloudWatch Application Insights for ECS:
- ALB's
HTTPCode_Target_4XX_Count - ALB's
HTTPCode_Target_5XX_Count - ECS cluster's
MemoryUtilized - ECS cluster's
CpuUtilized
- ALB's
What I did
Test environment
The test environment is as follows:
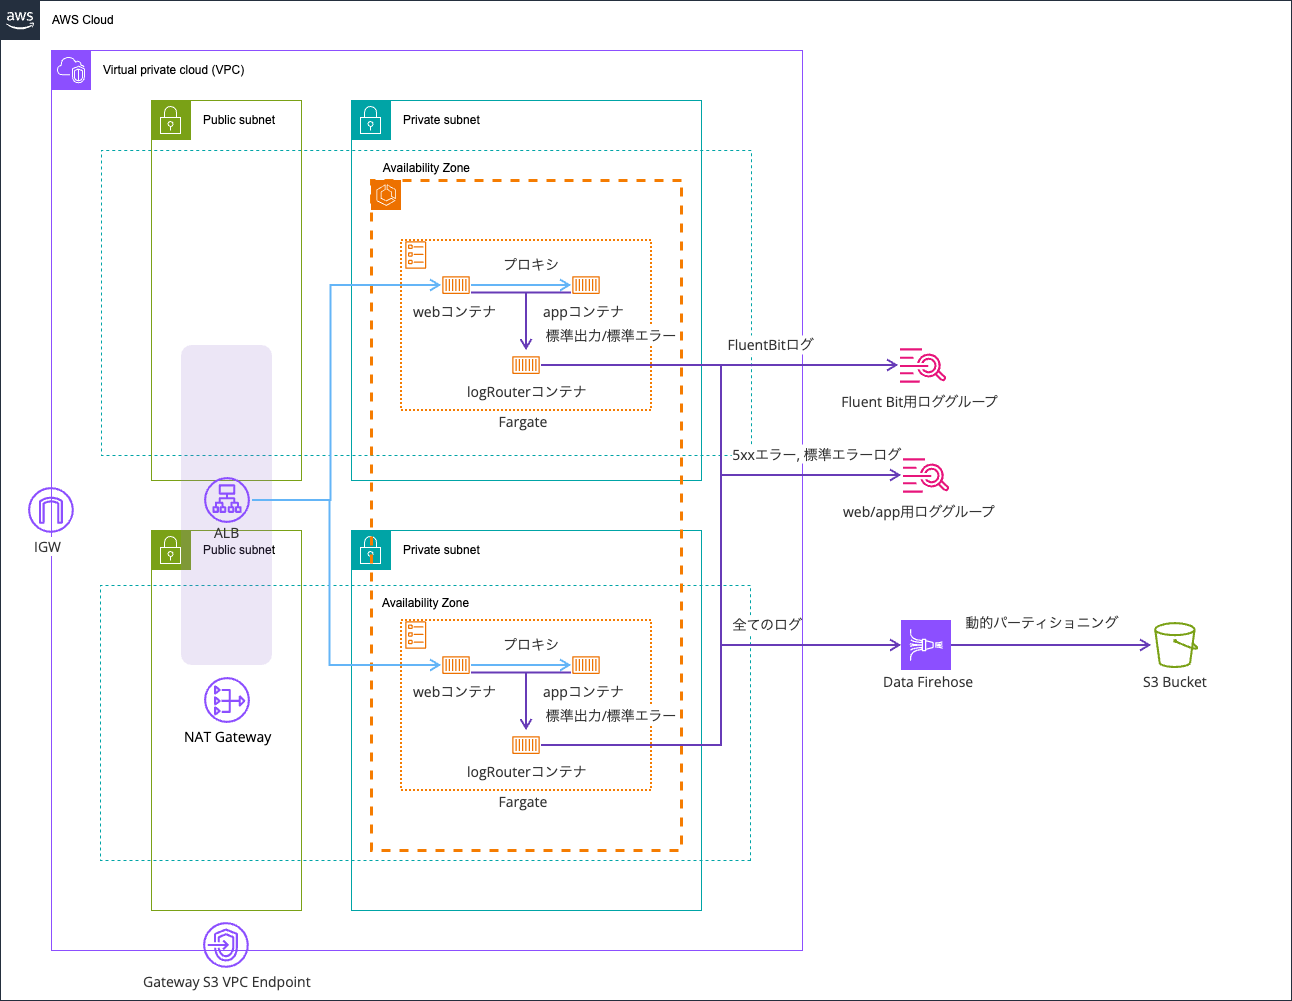
I reused what I had used in the article below:
The code is stored in the following repository:
Enabling CloudWatch Application Insights
I enabled Application Insights.
This was done from the Container Insights console.
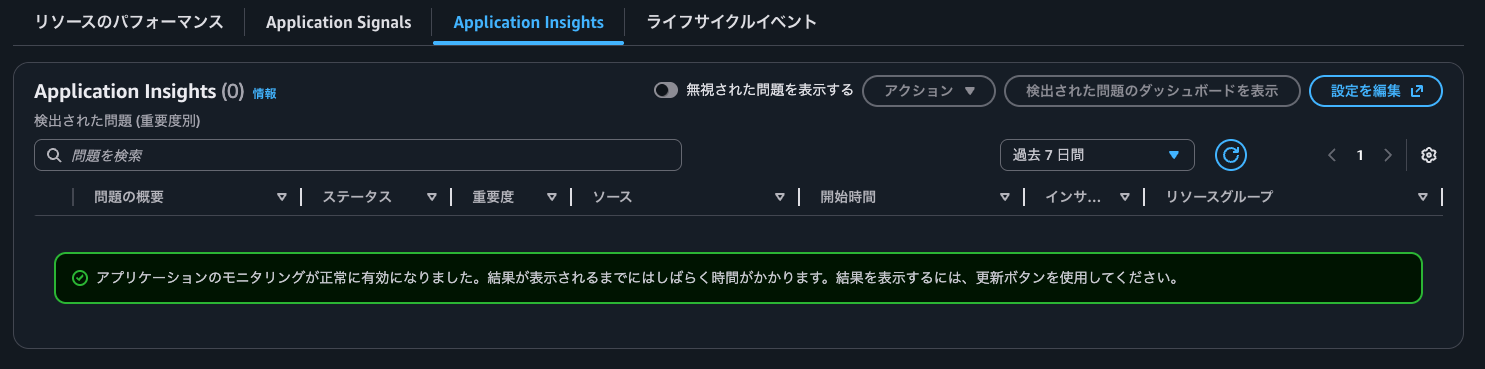
When checking the Application Insights tab, it displayed "Application monitoring has been successfully enabled. It may take some time before results are displayed. Use the refresh button to view results."
I clicked on Auto-configure Application Insights to enable it.
It seems to have been enabled successfully.
Checking the Application Insights dashboard
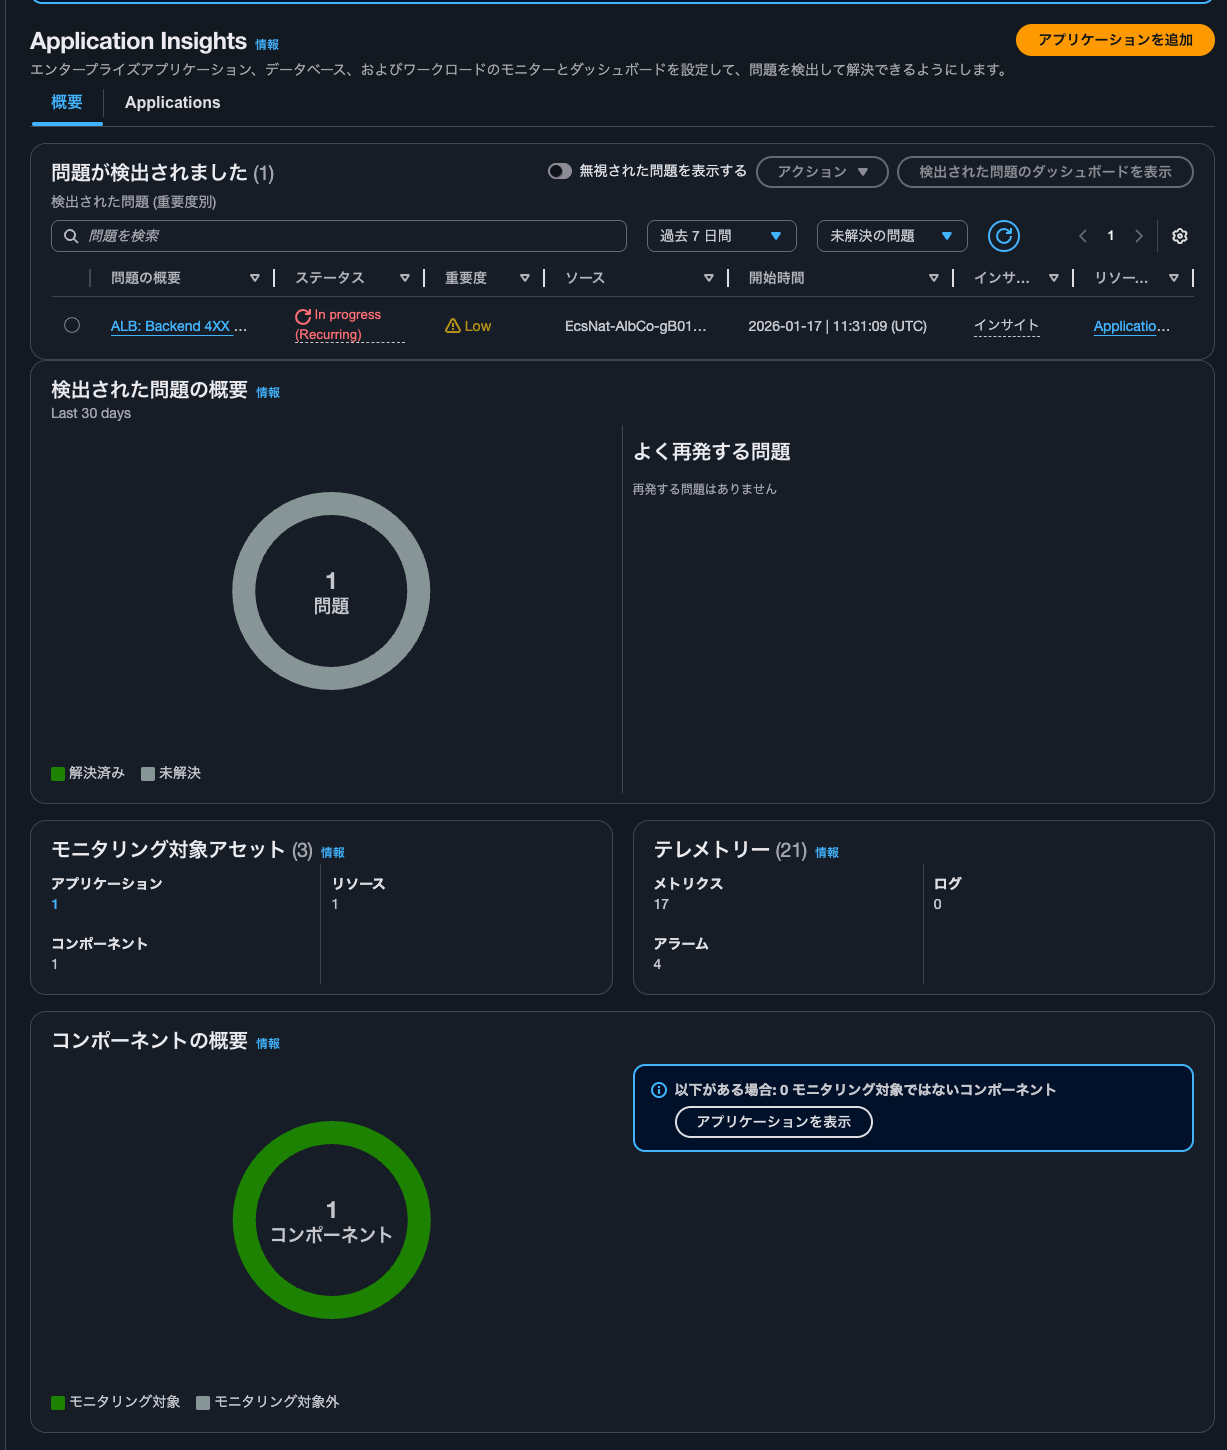
After a while, I was able to check the issues that occurred as shown below. It appears to be about 4XX errors returned by the backend.
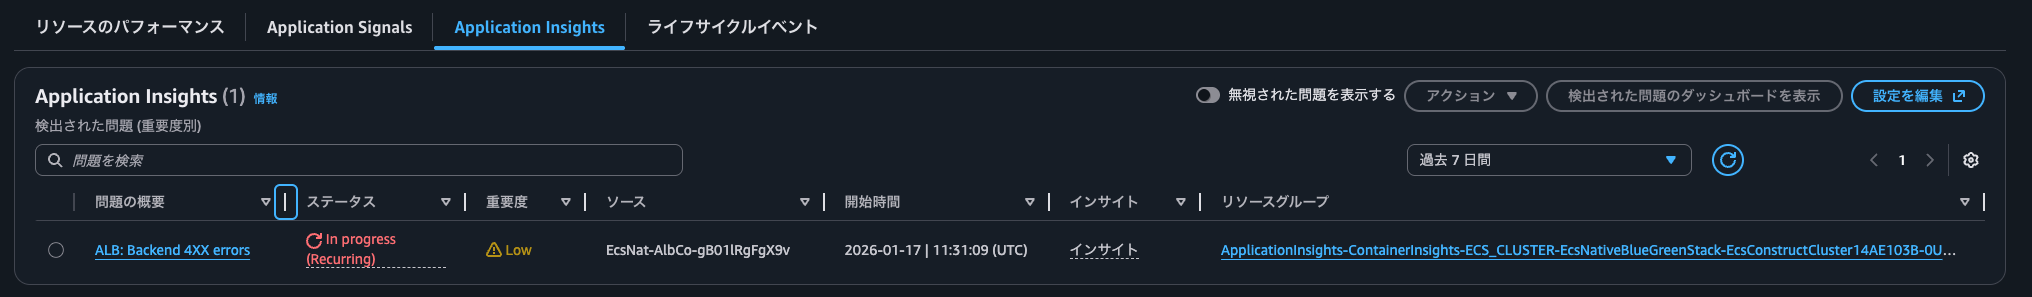
I could confirm the same content in the Application Insights console.
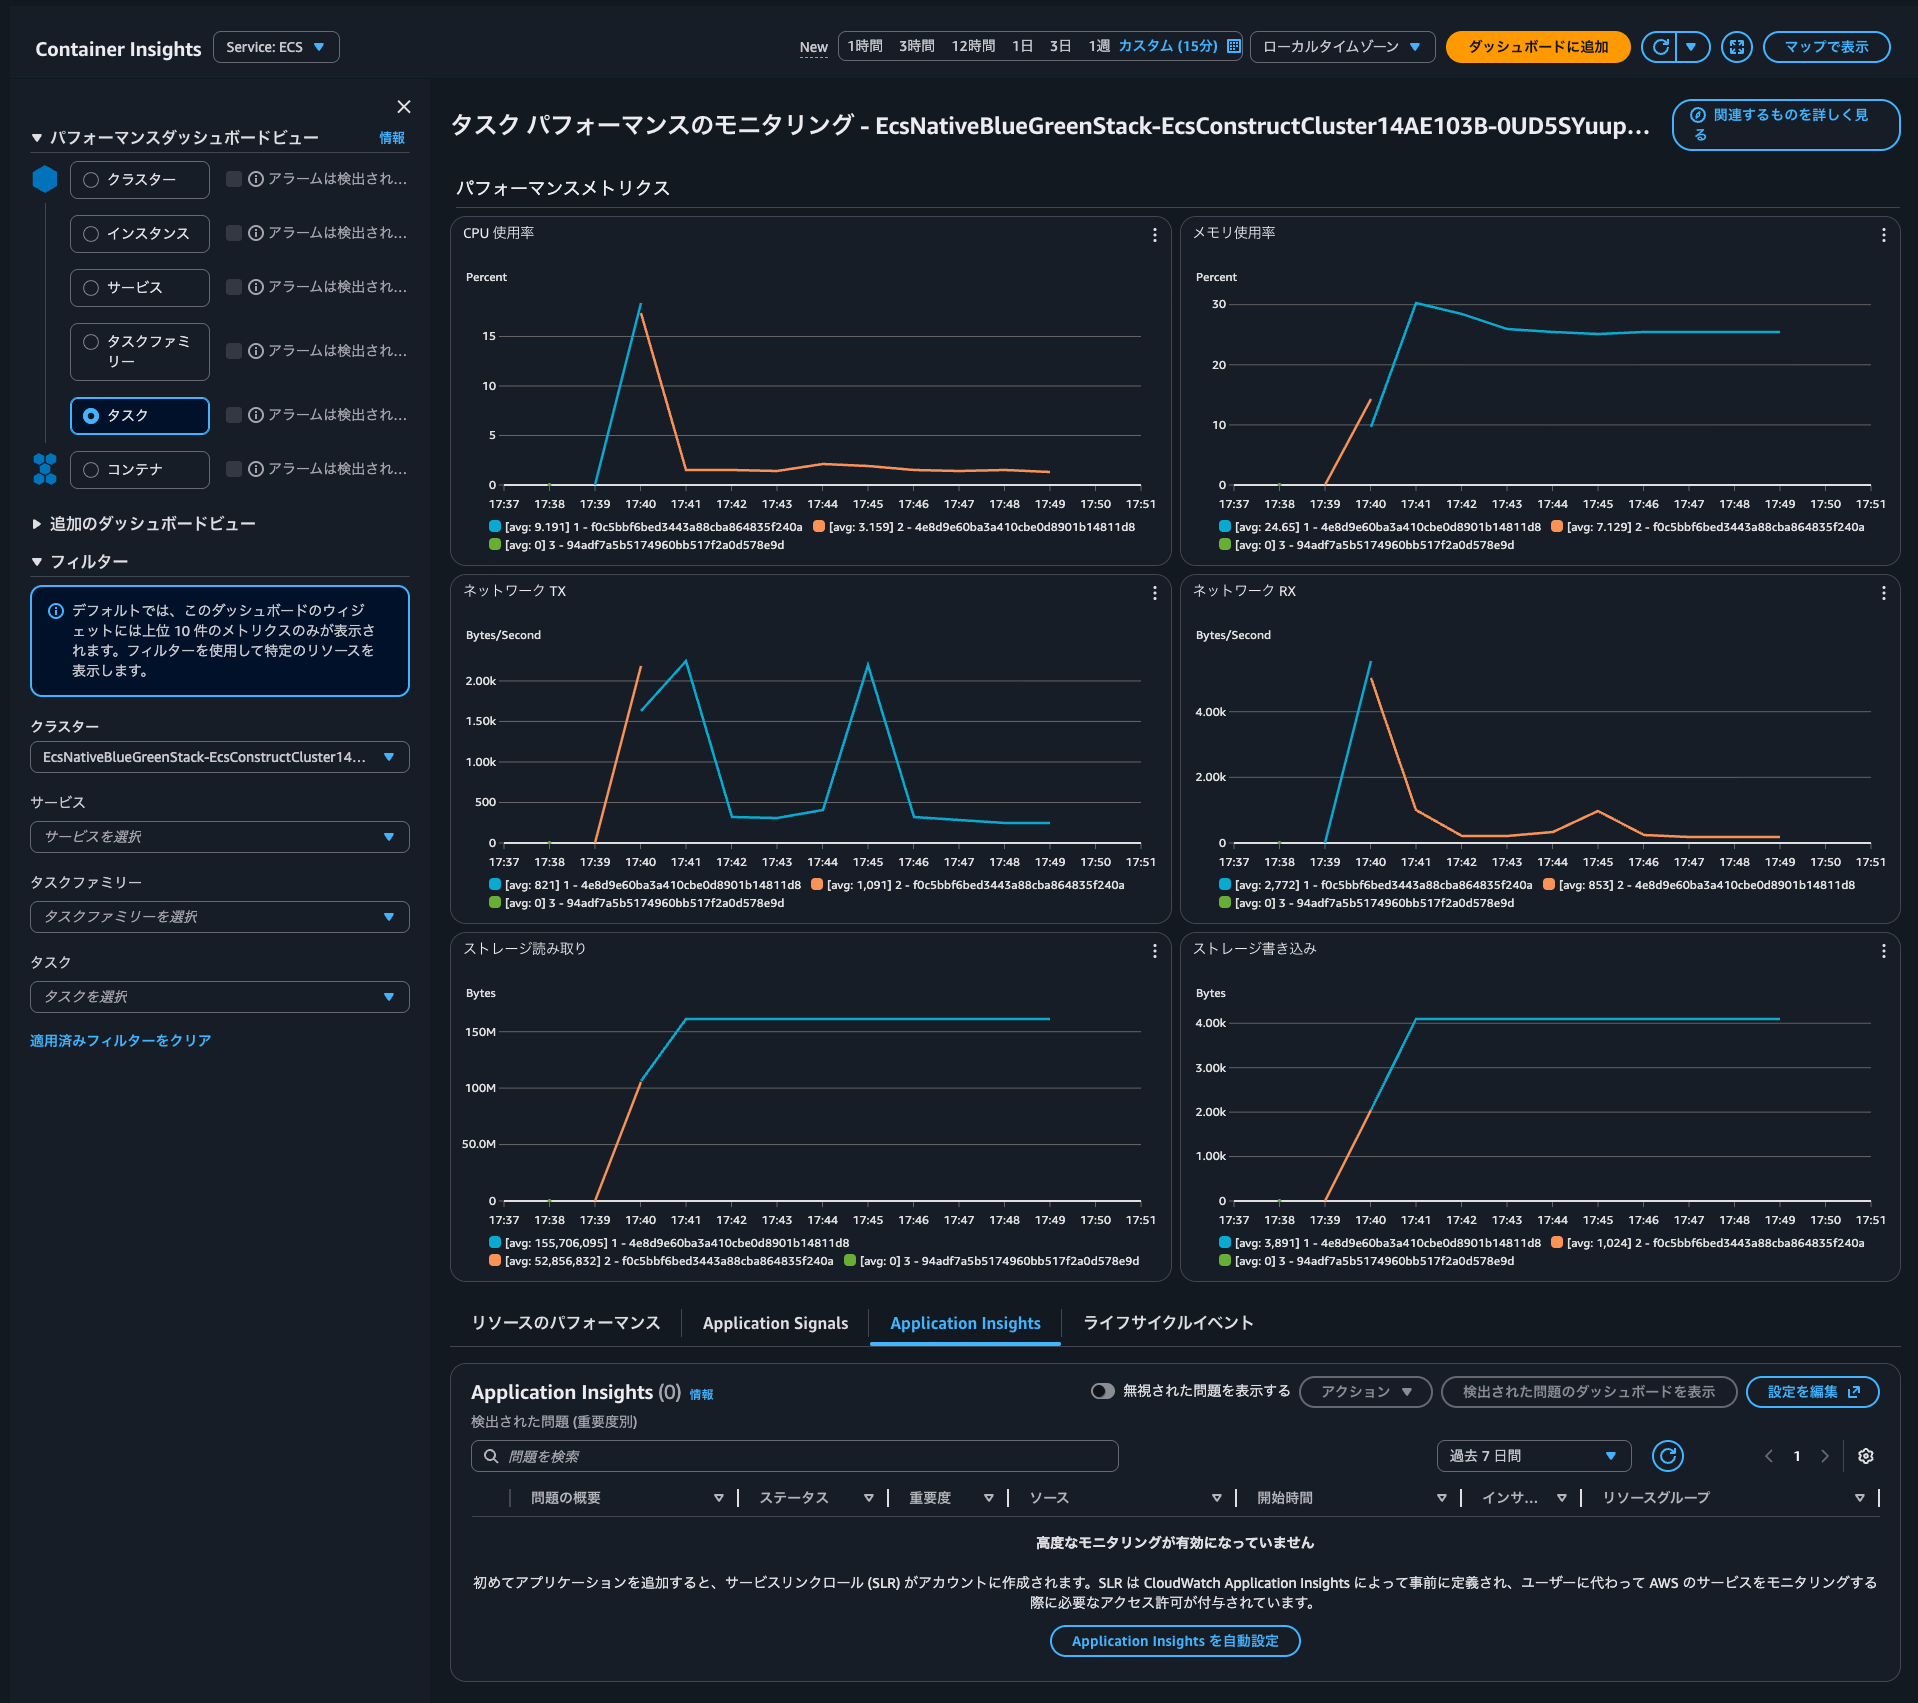
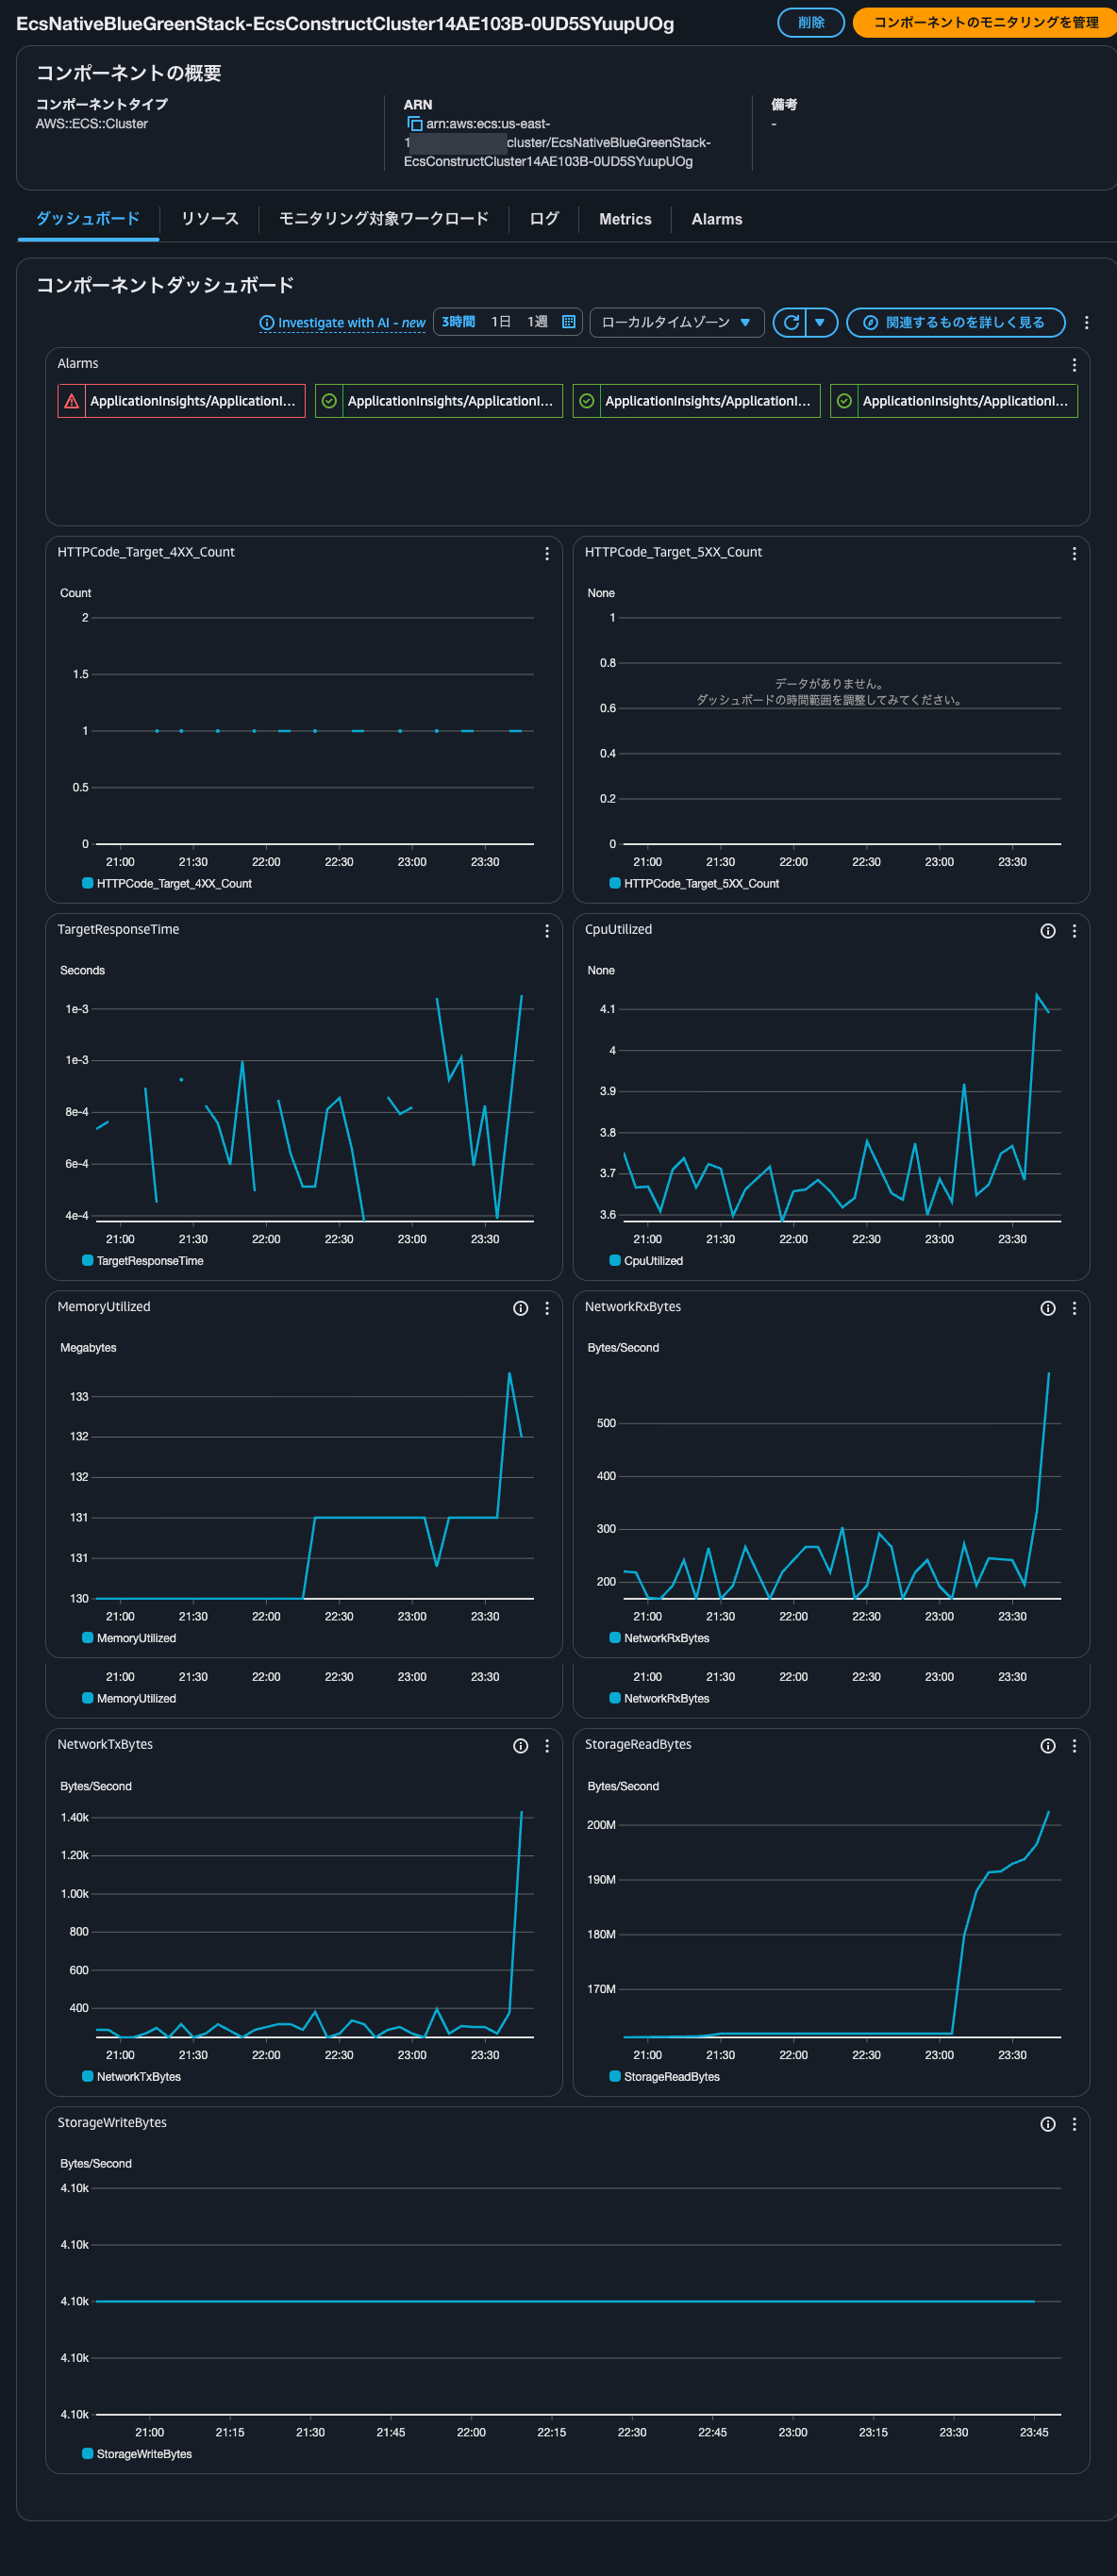
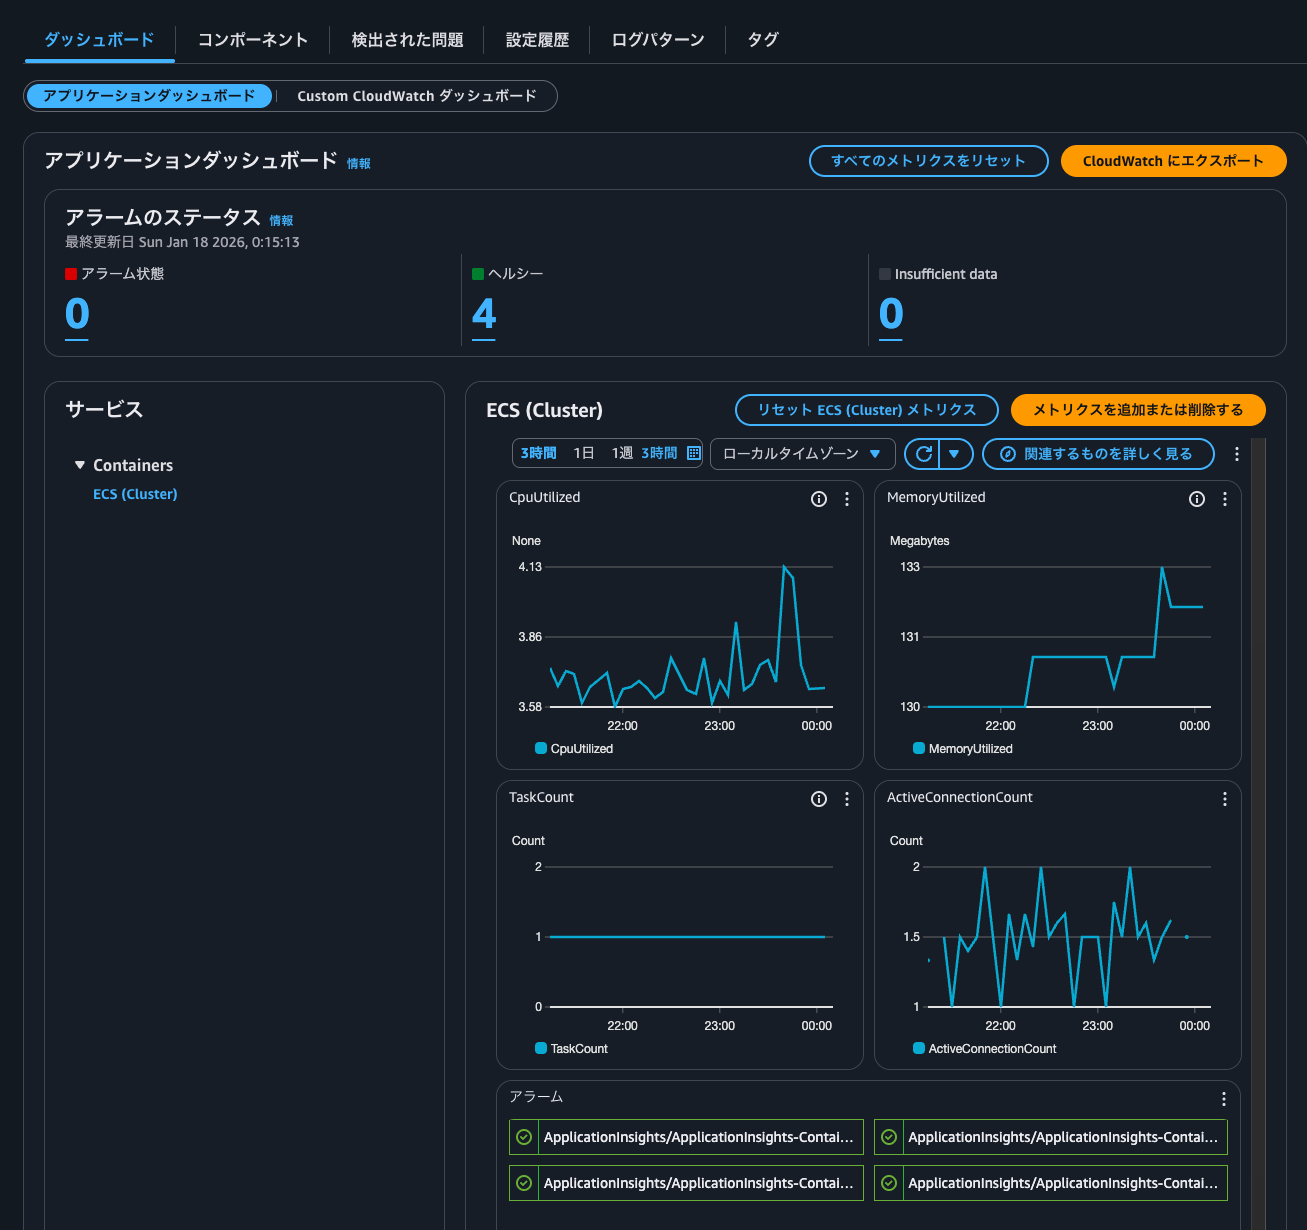
By selecting the application from Applications, I was able to check the Application Insights dashboard as follows:
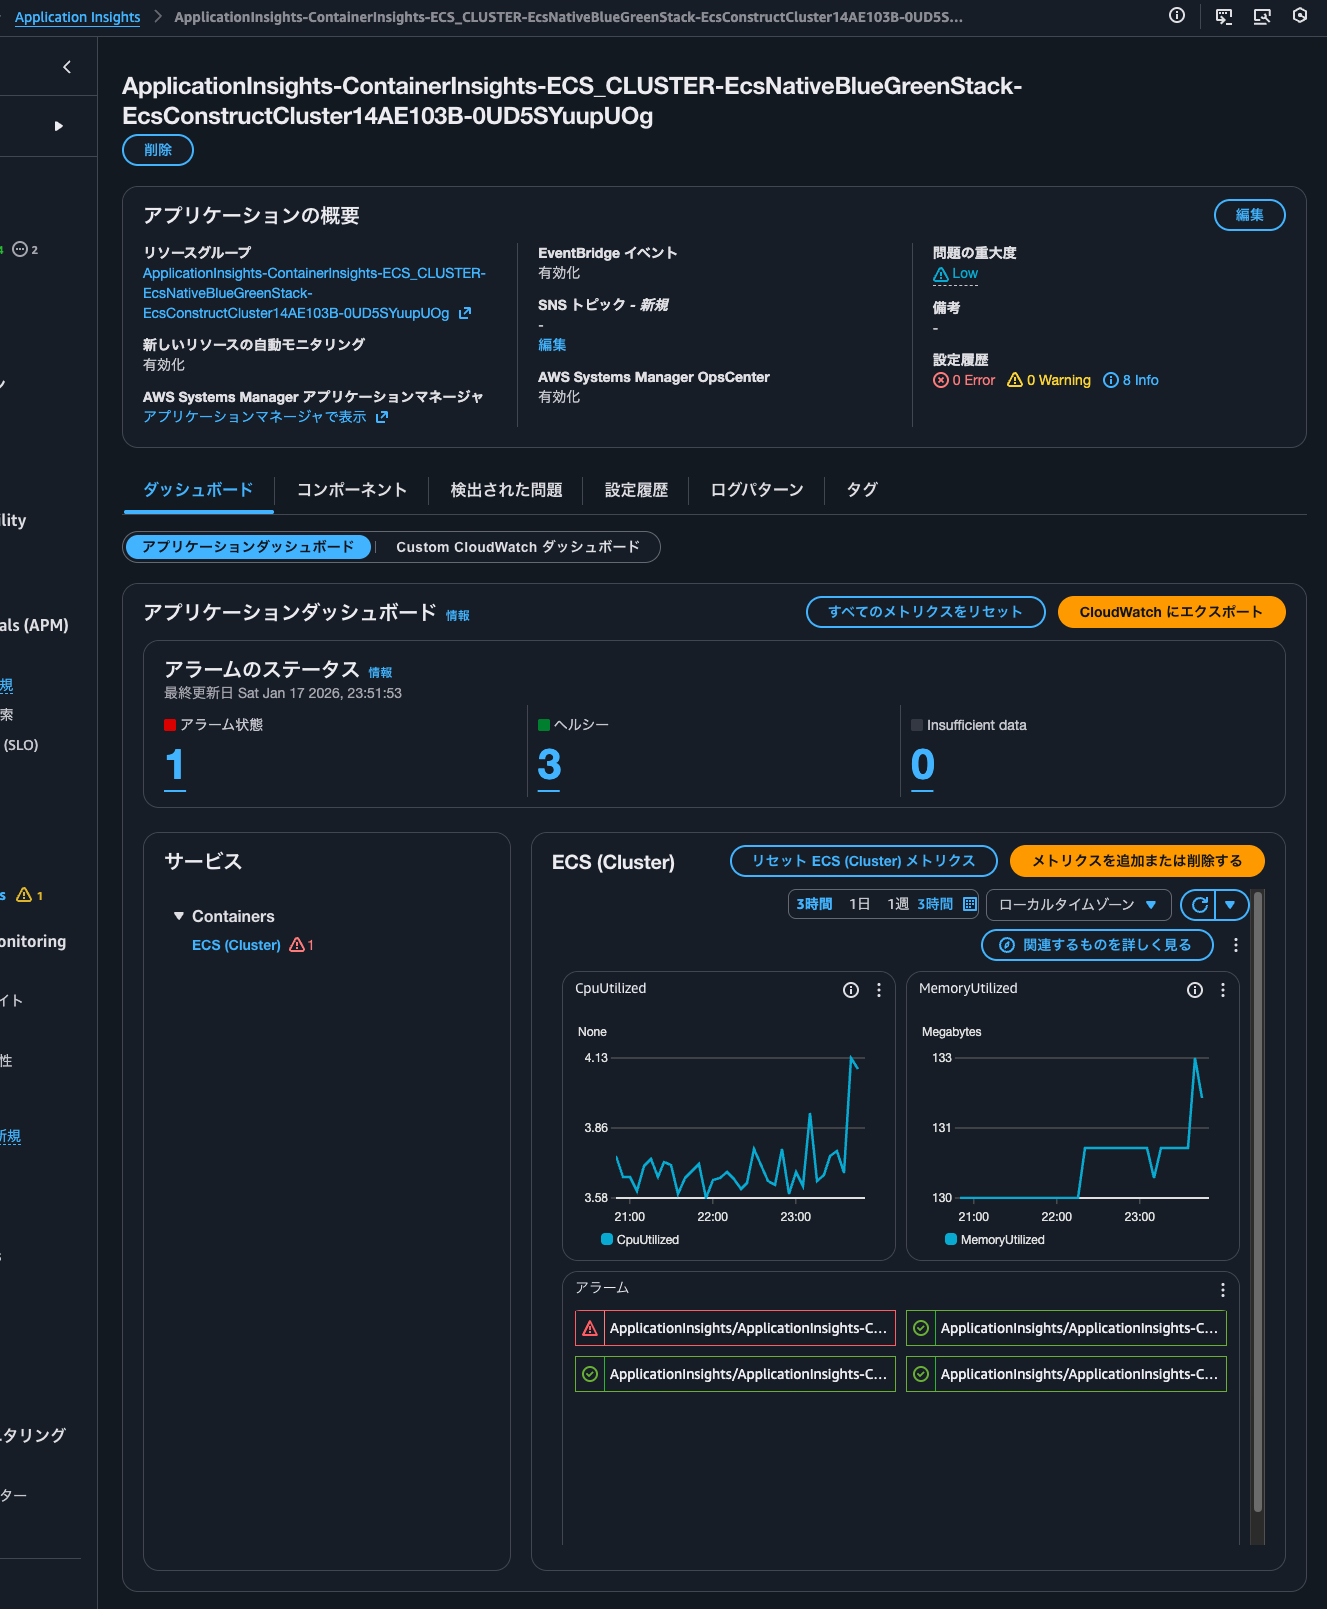
Four alarms were set up, and one of them is in alarm state.
The dashboard shows CPU and memory usage metrics.
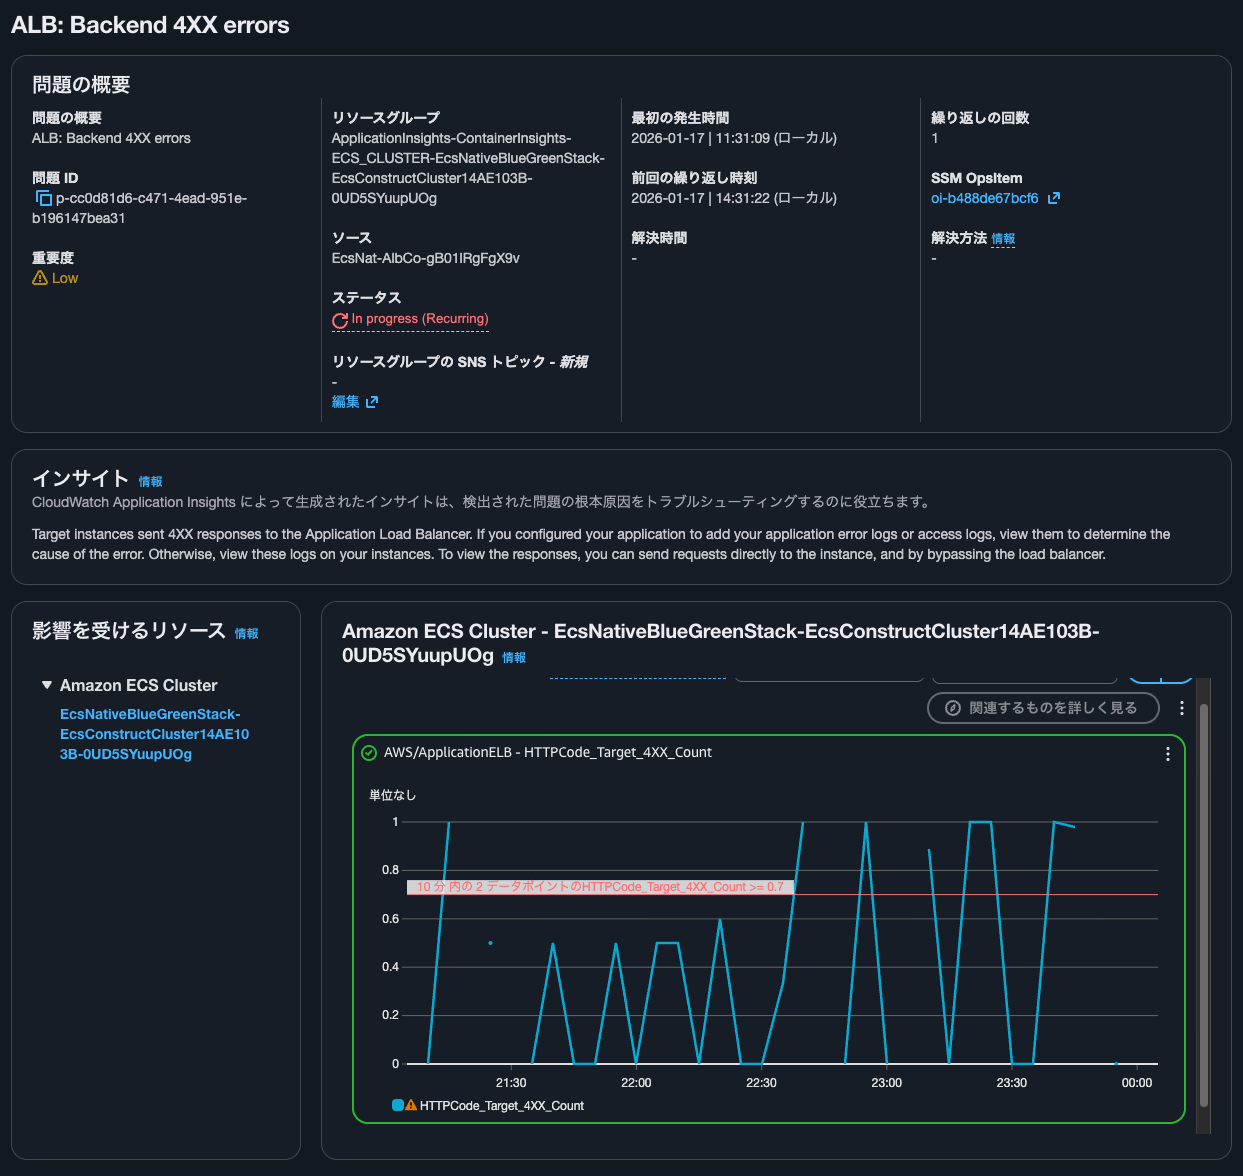
When clicking on the ALB: Backend 4XX errors link in Container Insights, I saw the following screen:
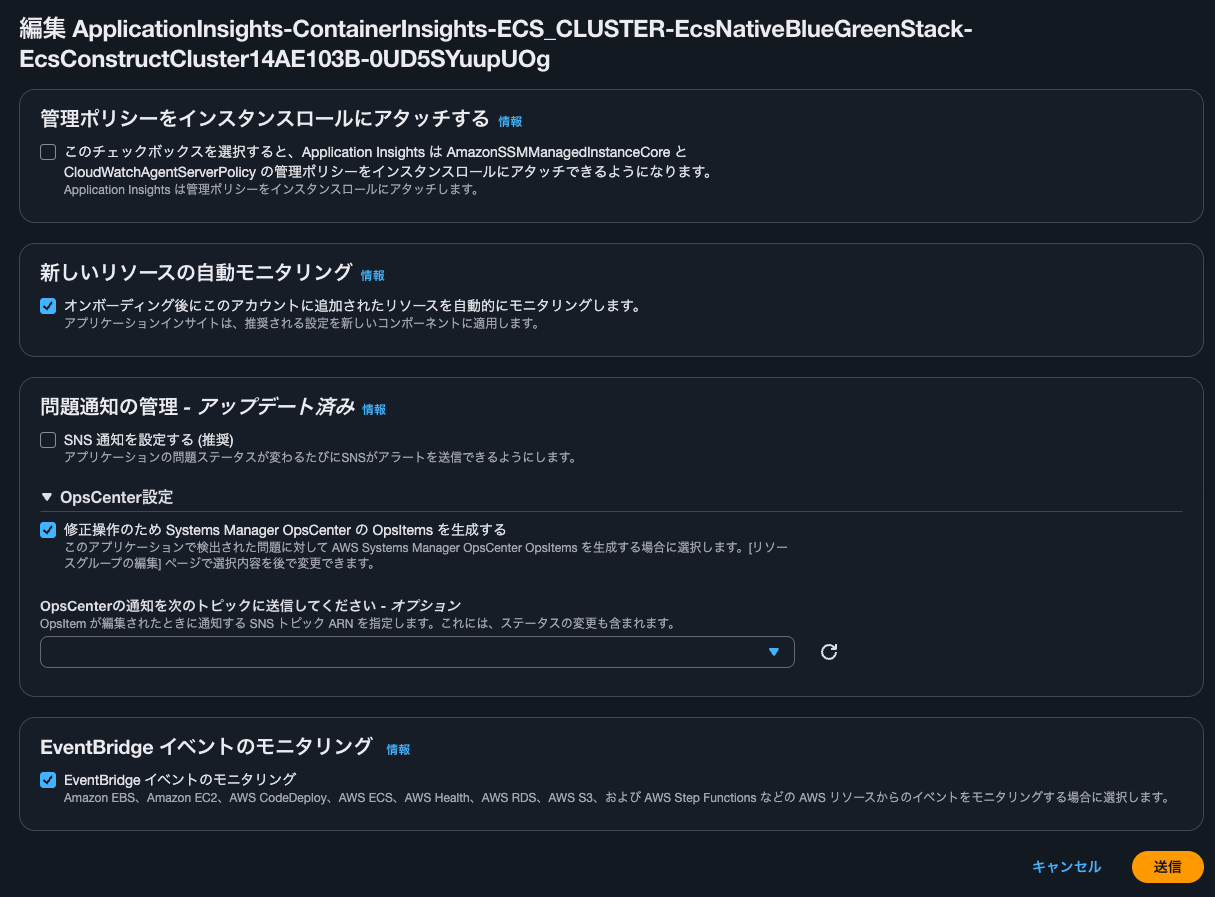
For reference, clicking on Edit shows the following screen:
Checking components
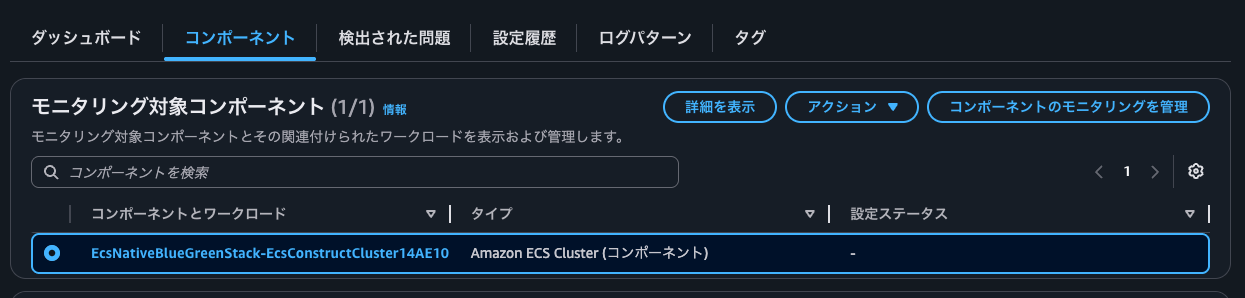
I checked the components.
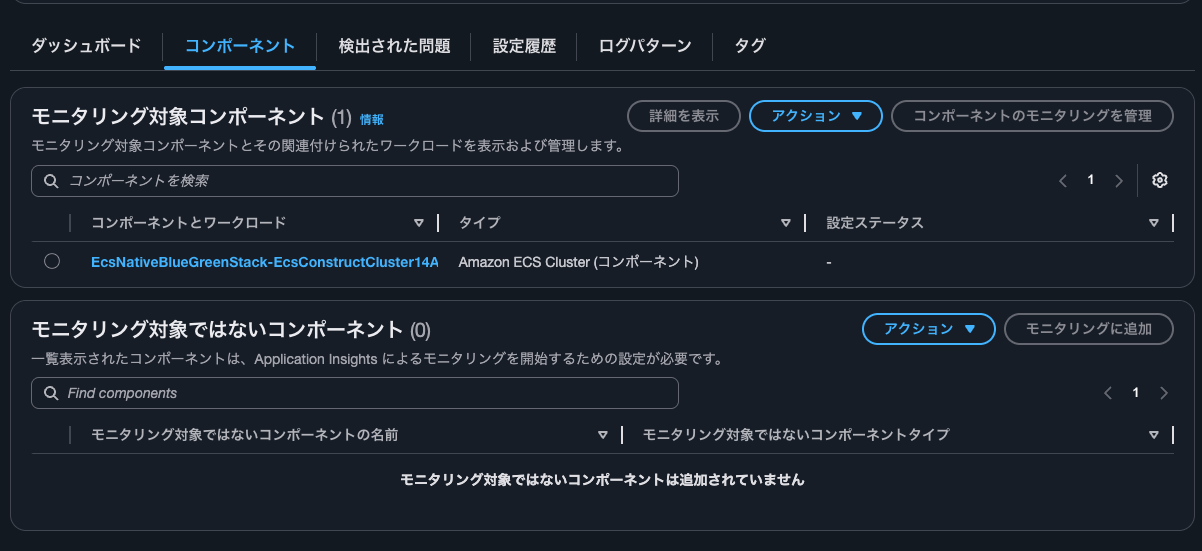
The type seems to be an ECS cluster. I clicked on the component and workload link.
I was able to view the dashboard as follows:
I clicked on the Resources tab. It seems that ECS services are registered as resources.
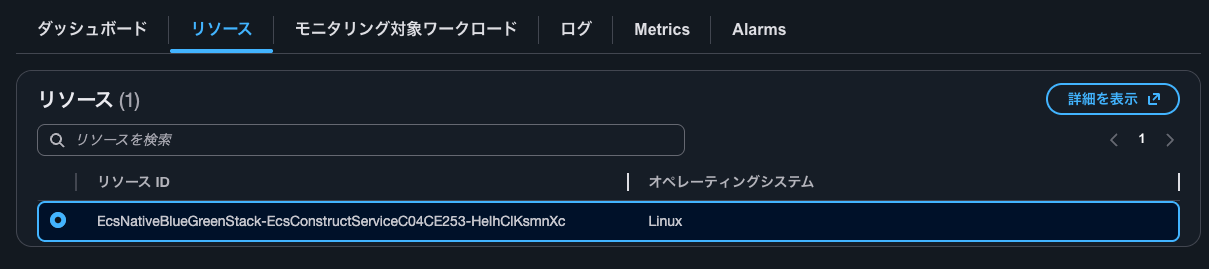
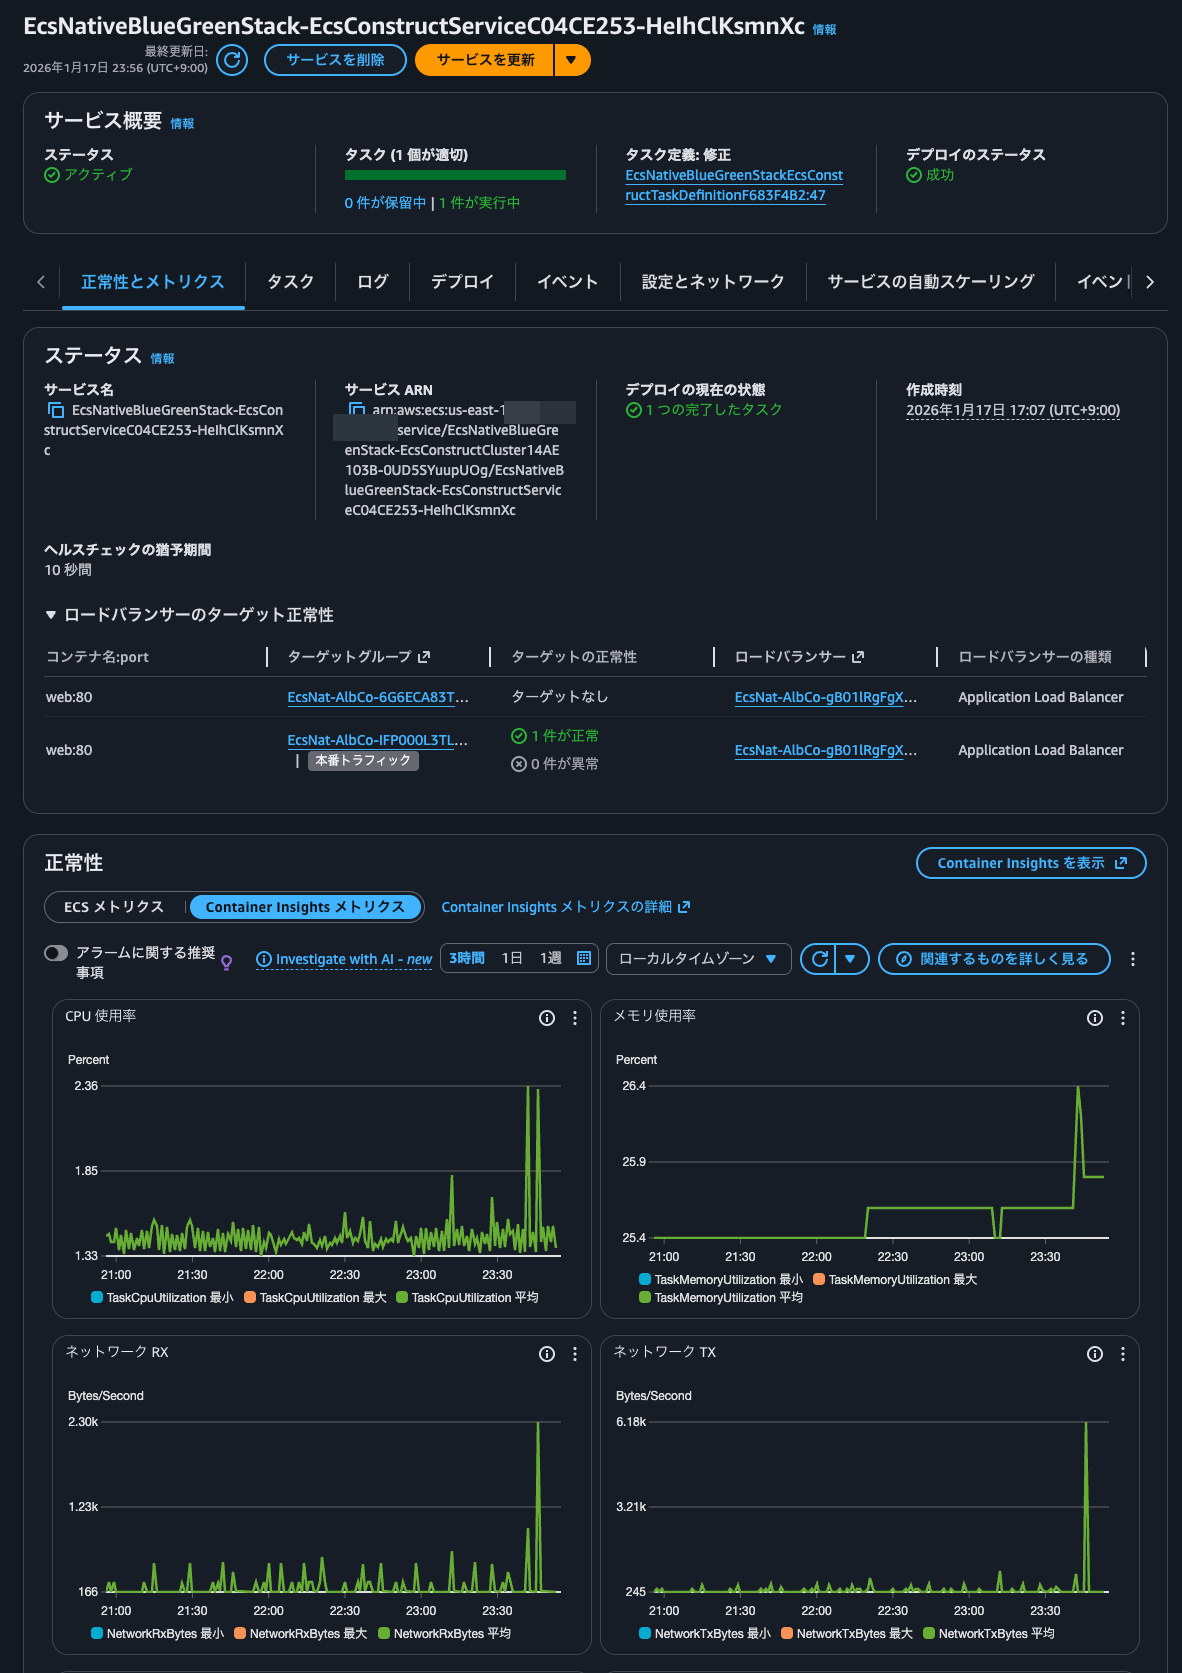
After selecting and clicking View details, the ECS service was displayed.
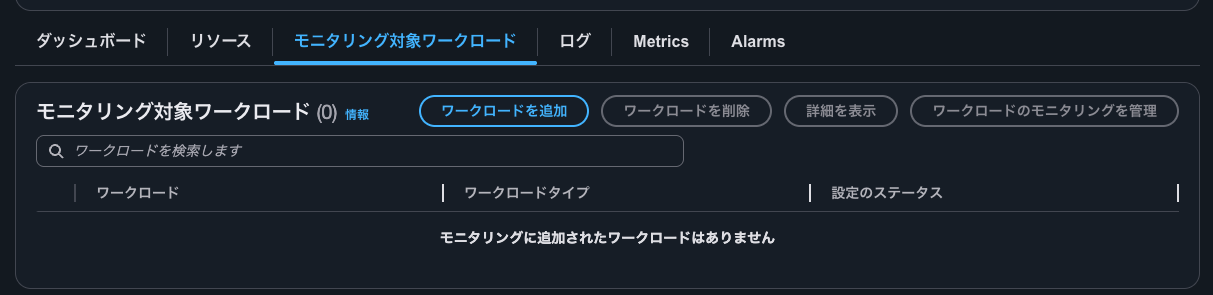
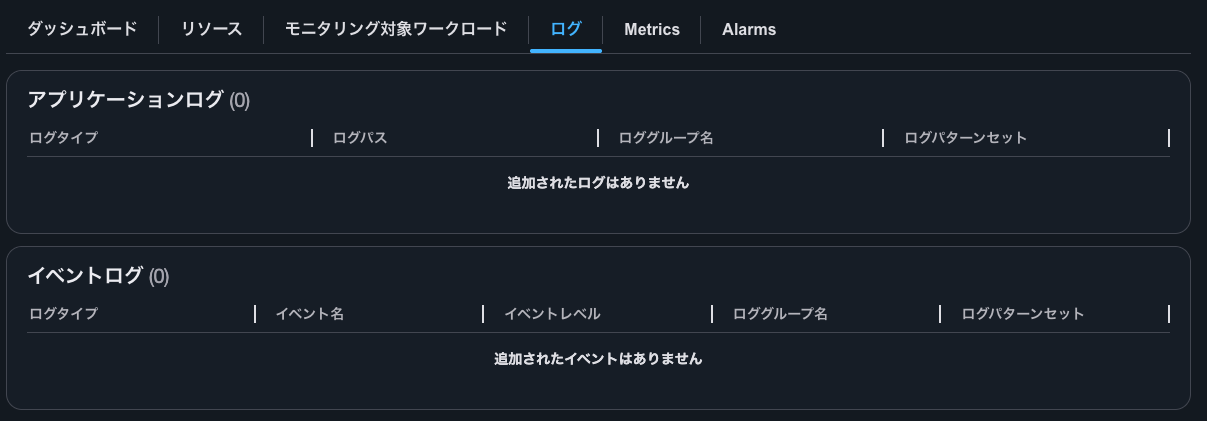
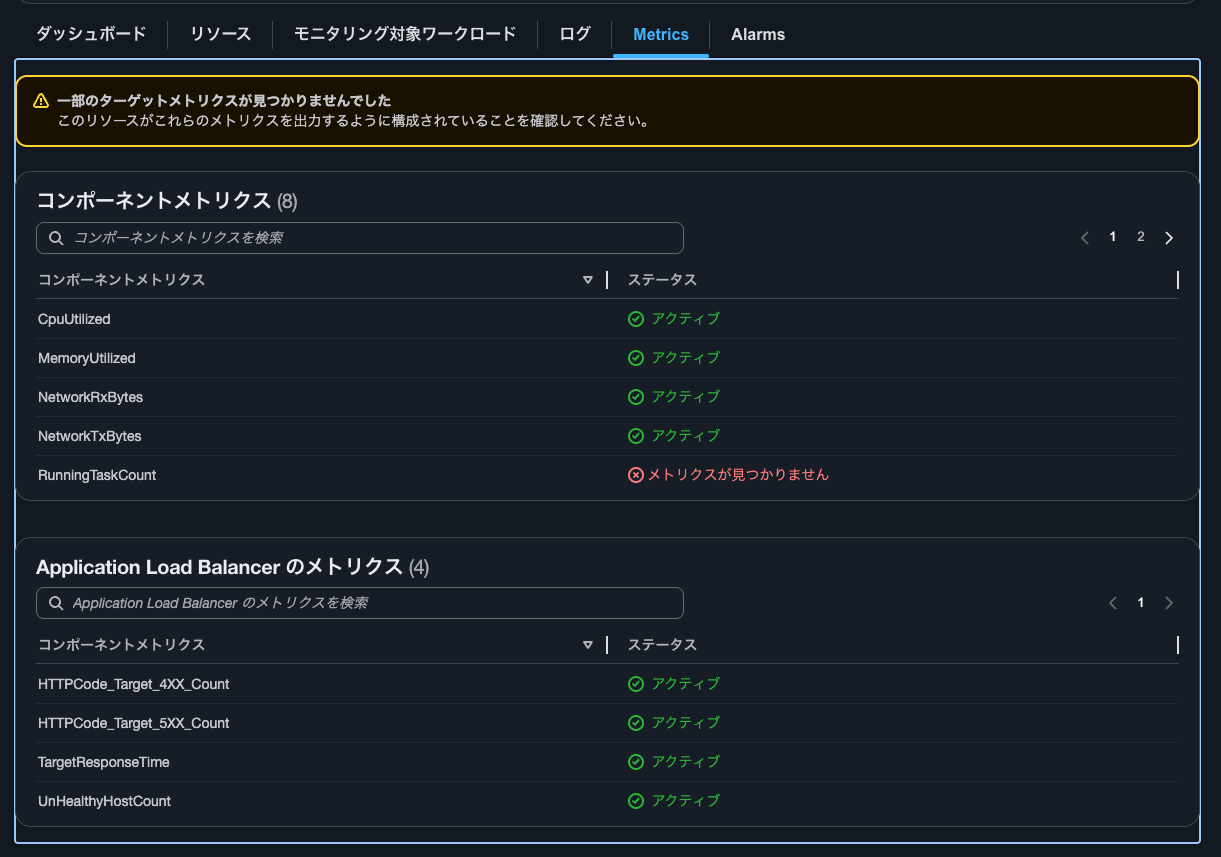
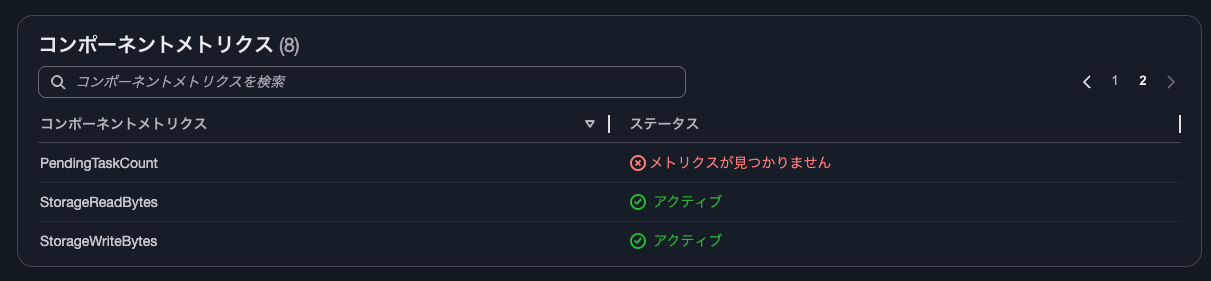
The Monitored workloads tab, Logs tab, Metrics tab, and Alarms tab are as follows:
Managing component monitoring
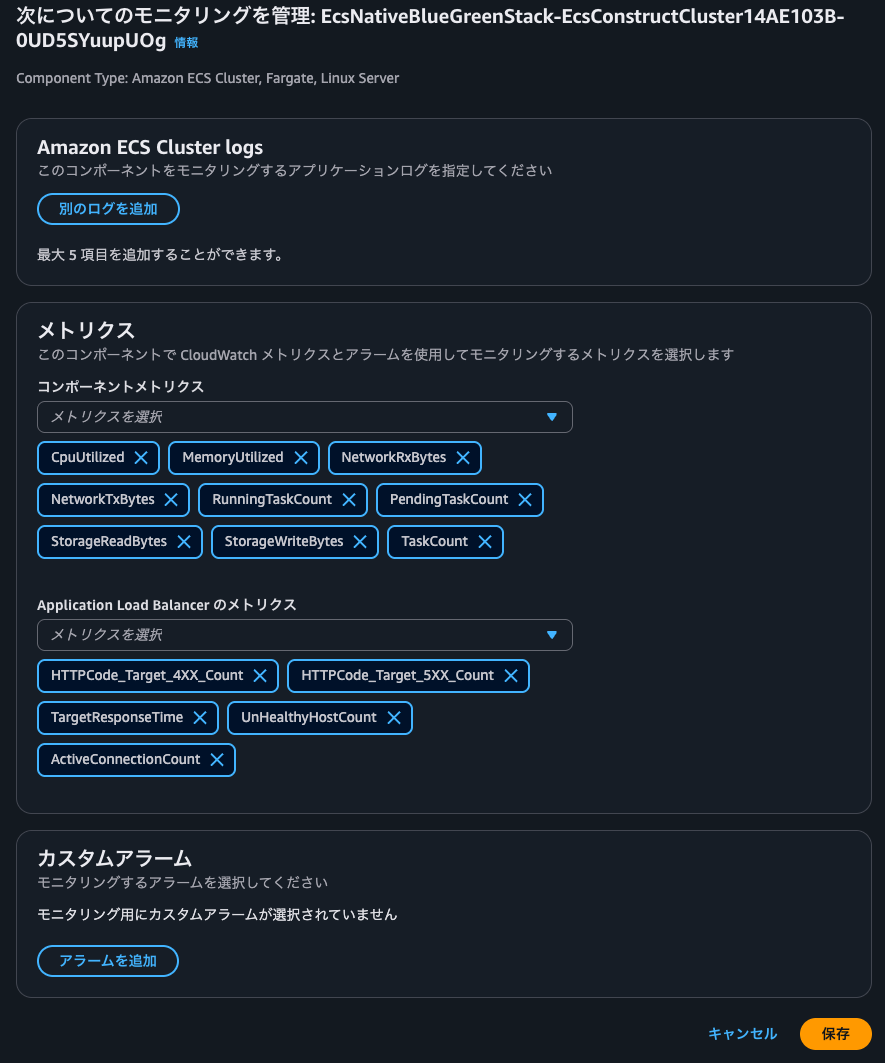
I edited the metrics handled in the component monitoring. I clicked on Manage component monitoring.
I was taken to a screen where I could manage the metrics to monitor and set up custom alarms as shown below.
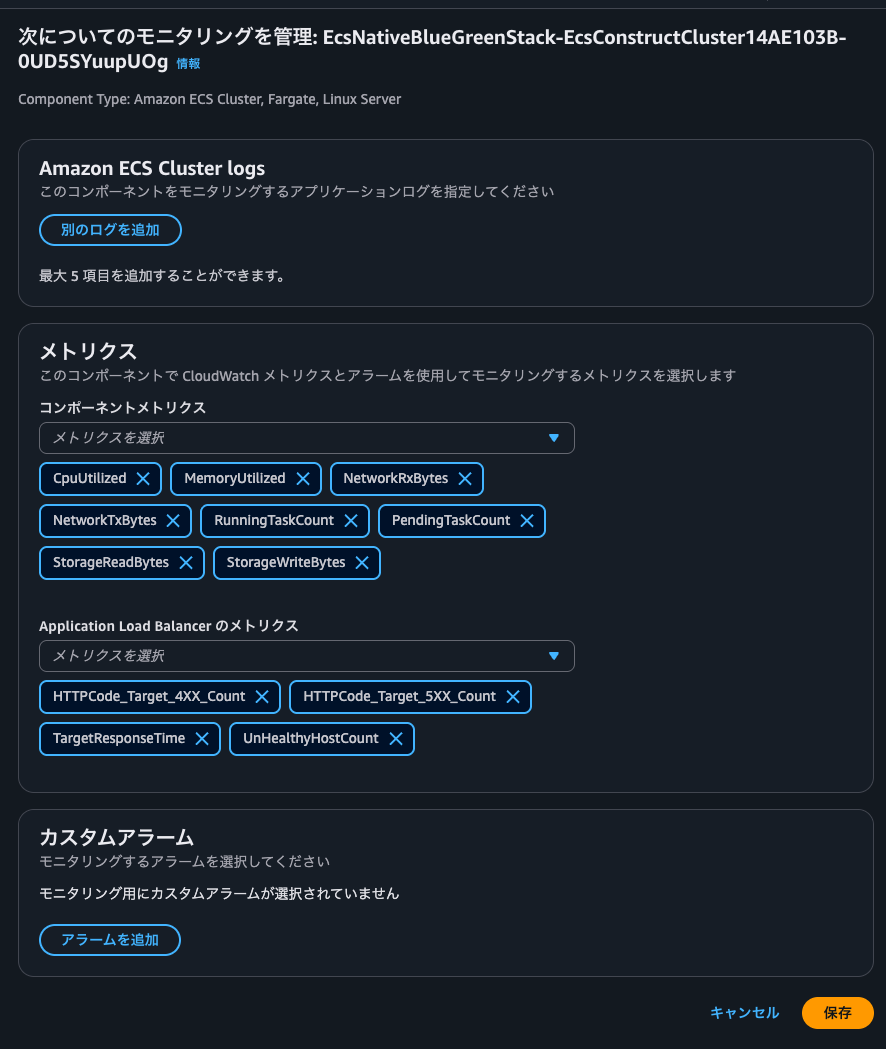
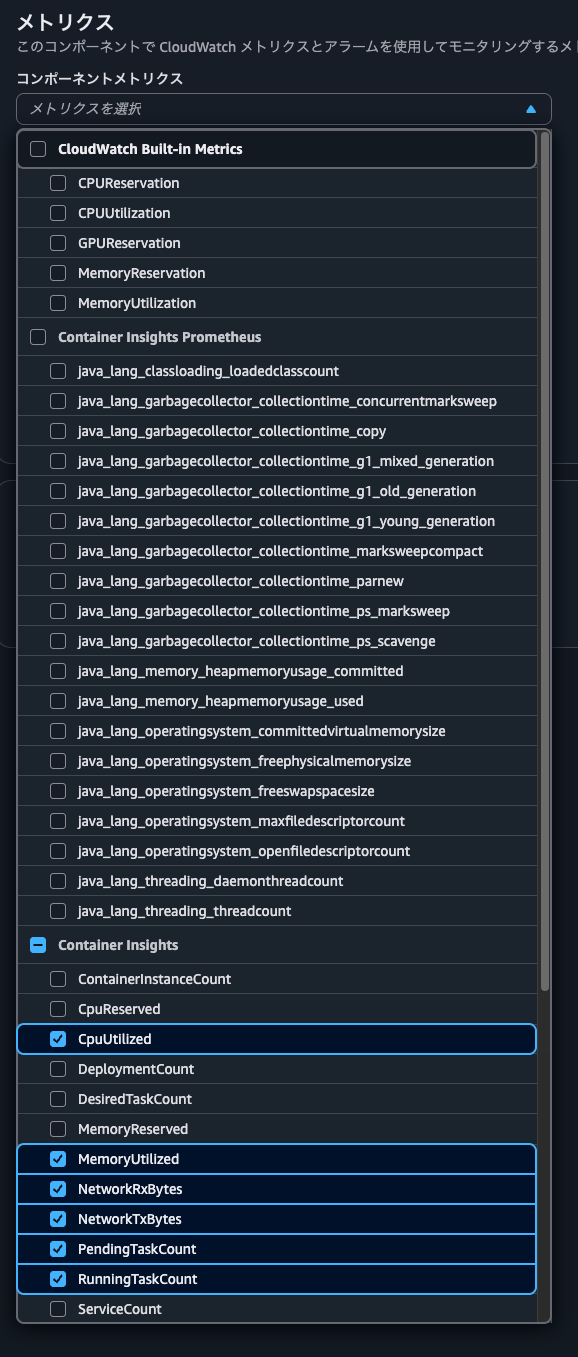
For component metrics, I can select either built-in metrics or metrics available through Container Insights.
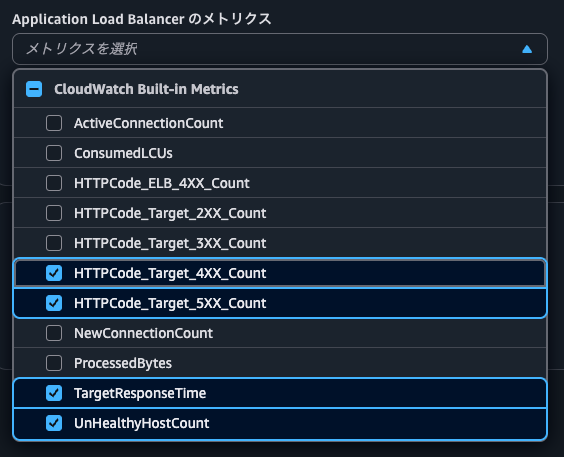
ALB metrics can also be selected as shown below.
I added TaskCount and ActiveConnectionCount and clicked Save.
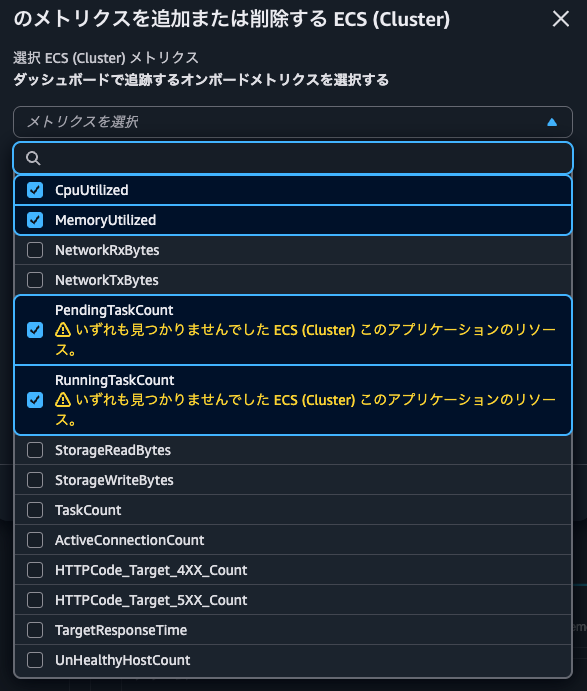
When checking the metric selection list from Add or remove metrics in the dashboard, I could now see the metrics I had just added.
After adding the metrics, they were reflected in the dashboard as shown below.
Checking configuration history
I checked the Configuration history tab.
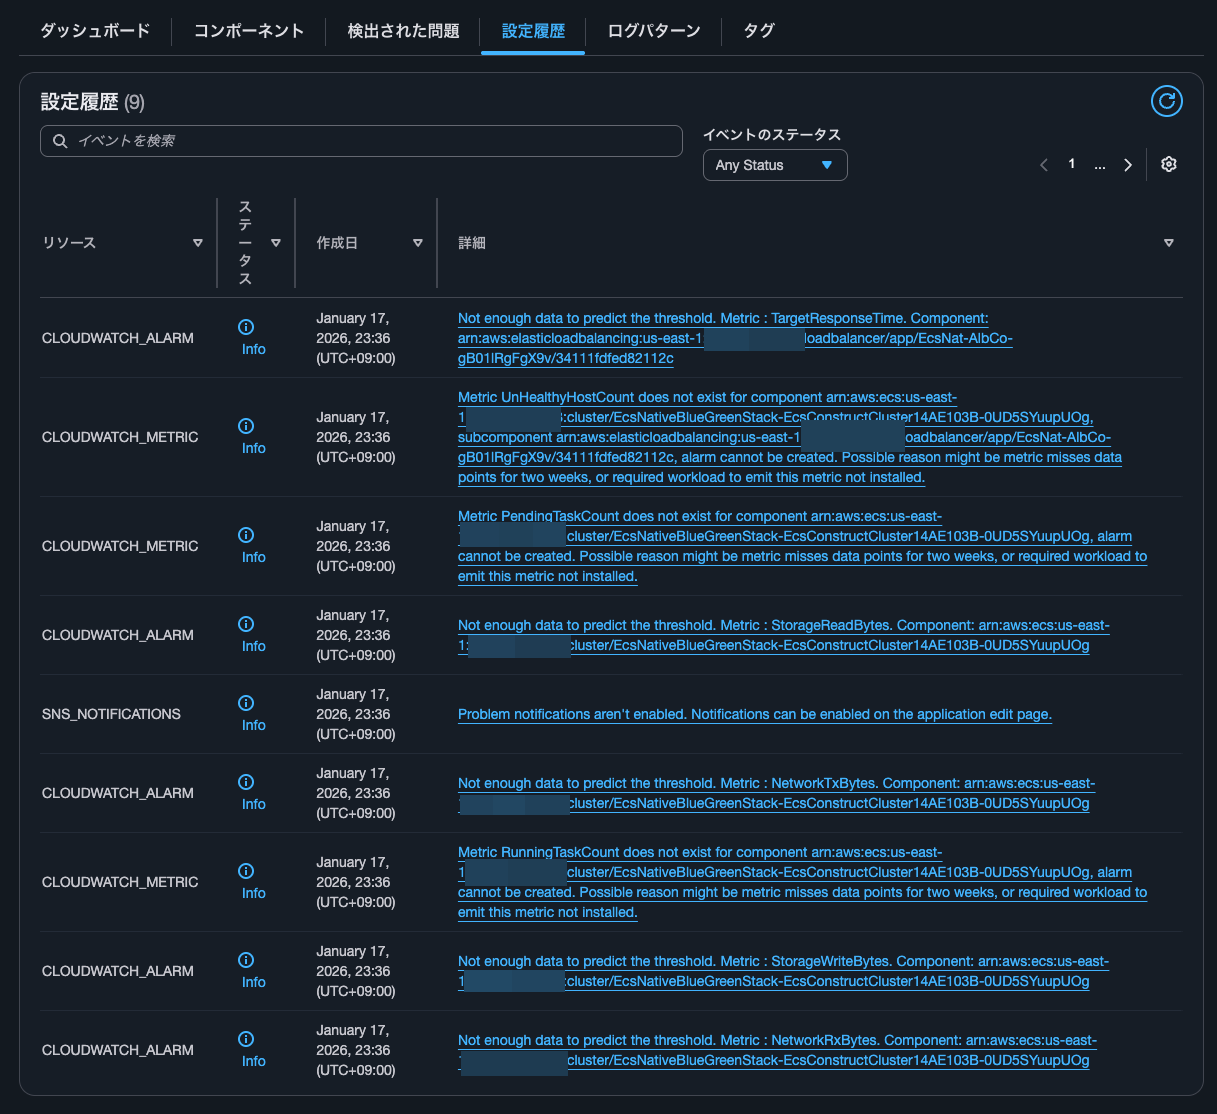
| Resource | Status | Creation date | Details |
|---|---|---|---|
| CLOUDWATCH_ALARM | Info | January 17, 2026, 23:36 (UTC+09:00) | Not enough data to predict the threshold. Metric : TargetResponseTime. Component: arn:aws:elasticloadbalancing:us-east-1:<AWSAccountID>:loadbalancer/app/EcsNat-AlbCo-gB01lRgFgX9v/34111fdfed82112c |
| CLOUDWATCH_METRIC | Info | January 17, 2026, 23:36 (UTC+09:00) | Metric UnHealthyHostCount does not exist for component arn:aws:ecs:us-east-1:<AWSAccountID>:cluster/EcsNativeBlueGreenStack-EcsConstructCluster14AE103B-0UD5SYuupUOg, subcomponent arn:aws:elasticloadbalancing:us-east-1:<AWSAccountID>:loadbalancer/app/EcsNat-AlbCo-gB01lRgFgX9v/34111fdfed82112c, alarm cannot be created. Possible reason might be metric misses data points for two weeks, or required workload to emit this metric not installed. |
| CLOUDWATCH_METRIC | Info | January 17, 2026, 23:36 (UTC+09:00) | Metric PendingTaskCount does not exist for component arn:aws:ecs:us-east-1:<AWSAccountID>:cluster/EcsNativeBlueGreenStack-EcsConstructCluster14AE103B-0UD5SYuupUOg, alarm cannot be created. Possible reason might be metric misses data points for two weeks, or required workload to emit this metric not installed. |
| CLOUDWATCH_ALARM | Info | January 17, 2026, 23:36 (UTC+09:00) | Not enough data to predict the threshold. Metric : StorageReadBytes. Component: arn:aws:ecs:us-east-1:<AWSAccountID>:cluster/EcsNativeBlueGreenStack-EcsConstructCluster14AE103B-0UD5SYuupUOg |
| SNS_NOTIFICATIONS | Info | January 17, 2026, 23:36 (UTC+09:00) | Problem notifications aren't enabled. Notifications can be enabled on the application edit page. |
| CLOUDWATCH_ALARM | Info | January 17, 2026, 23:36 (UTC+09:00) | Not enough data to predict the threshold. Metric : NetworkTxBytes. Component: arn:aws:ecs:us-east-1:<AWSAccountID>:cluster/EcsNativeBlueGreenStack-EcsConstructCluster14AE103B-0UD5SYuupUOg |
| CLOUDWATCH_METRIC | Info | January 17, 2026, 23:36 (UTC+09:00) | Metric RunningTaskCount does not exist for component arn:aws:ecs:us-east-1:<AWSAccountID>:cluster/EcsNativeBlueGreenStack-EcsConstructCluster14AE103B-0UD5SYuupUOg, alarm cannot be created. Possible reason might be metric misses data points for two weeks, or required workload to emit this metric not installed. |
| CLOUDWATCH_ALARM | Info | January 17, 2026, 23:36 (UTC+09:00) | Not enough data to predict the threshold. Metric : StorageWriteBytes. Component: arn:aws:ecs:us-east-1:<AWSAccountID>:cluster/EcsNativeBlueGreenStack-EcsConstructCluster14AE103B-0UD5SYuupUOg |
| CLOUDWATCH_ALARM | Info | January 17, 2026, 23:36 (UTC+09:00) | Not enough data to predict the threshold. Metric : NetworkRxBytes. Component: arn:aws:ecs:us-east-1:<AWSAccountID>:cluster/EcsNativeBlueGreenStack-EcsConstructCluster14AE103B-0UD5SYuupUOg |
There are several CLOUDWATCH_ALARM resources with "Not enough data to predict the threshold. Metric".
The target metrics are as follows:
- ALB's
TargetResponseTime - ECS cluster's
StorageReadBytes - ECS cluster's
StorageWriteBytes - ECS cluster's
NetworkTxBytes - ECS cluster's
NetworkRxBytes
These weren't in the CloudWatch alarms that I'll check later.
Based on the message, I thought it might be trying to set up CloudWatch Anomaly Detection, but I couldn't find any evidence in CloudTrail that it was trying to create such CloudWatch alarms.
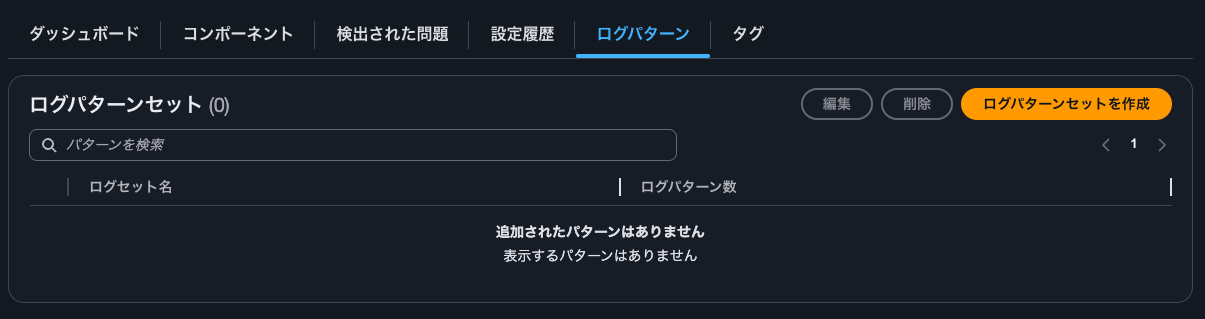
Checking log patterns
No log patterns were configured.
Checking CloudWatch alarms
I checked the CloudWatch alarms.
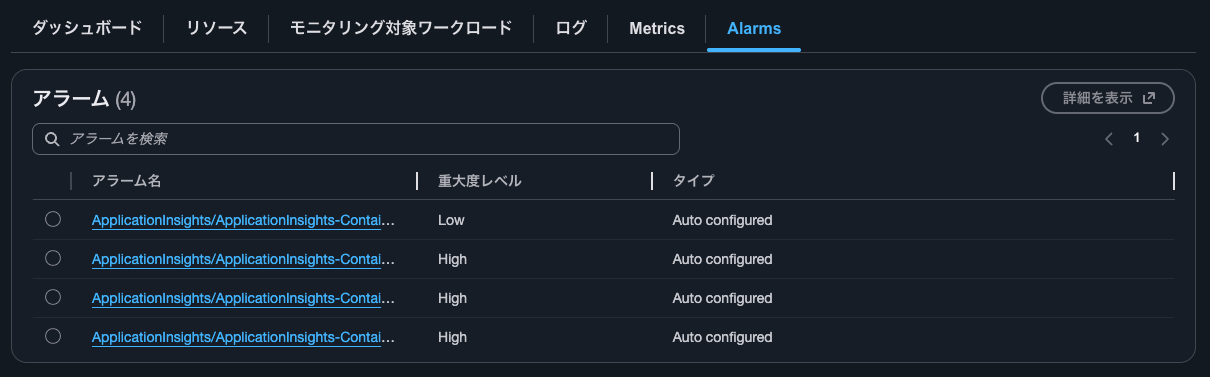
When checking CloudWatch Alarms, four were configured as follows:
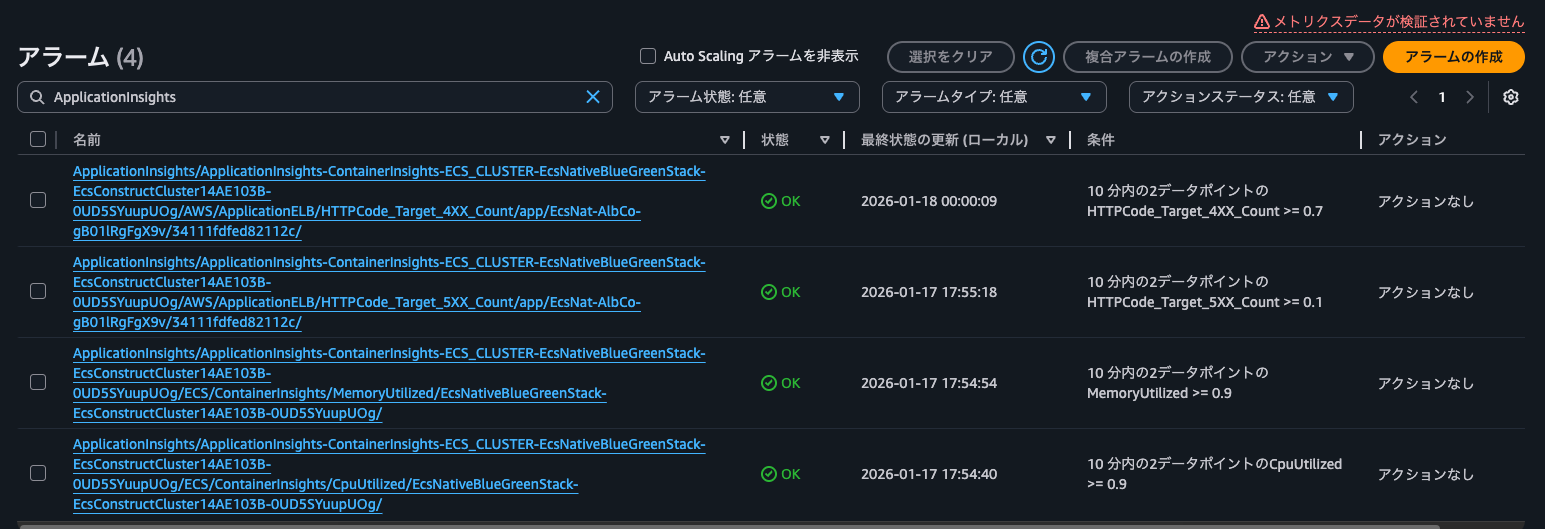
Specifically, alarms were set for the following four metrics:
- ALB's
HTTPCode_Target_4XX_Count - ALB's
HTTPCode_Target_5XX_Count - ECS cluster's
MemoryUtilized - ECS cluster's
CpuUtilized
The configuration for each alarm is as follows:
Type: AWS::CloudWatch::Alarm
Properties:
    AlarmName: ApplicationInsights/ApplicationInsights-ContainerInsights-ECS_CLUSTER-EcsNativeBlueGreenStack-EcsConstructCluster14AE103B-0UD5SYuupUOg/AWS/ApplicationELB/HTTPCode_Target_4XX_Count/app/EcsNat-AlbCo-gB01lRgFgX9v/34111fdfed82112c/
    AlarmDescription: This is math expression alarm created and managed by the
        CloudWatch Application Insights. To make changes please go to your
        application's configuration in Application Insights
    Tags:
        - Key: ApplicationInsightsManaged
          Value: "TRUE"
    ActionsEnabled: true
    OKActions: []
    AlarmActions: []
    InsufficientDataActions: []
    Dimensions: []
    EvaluationPeriods: 2
    DatapointsToAlarm: 2
    Threshold: 0.7
    ComparisonOperator: GreaterThanOrEqualToThreshold
    TreatMissingData: notBreaching
    Metrics:
        - Id: m8
          Label: HTTPCode_Target_4XX_Count
          Expression: m8_HTTPCode_Target_4XX_Count/m8_RequestCount
        - Id: m8_HTTPCode_Target_4XX_Count
          Label: input
          ReturnData: false
          MetricStat:
              Metric:
                  Namespace: AWS/ApplicationELB
                  MetricName: HTTPCode_Target_4XX_Count
                  Dimensions:
                      - Name: LoadBalancer
                        Value: app/EcsNat-AlbCo-gB01lRgFgX9v/34111fdfed82112c
              Period: 300
              Stat: Sum
              Unit: Count
        - Id: m8_RequestCount
          Label: input
          ReturnData: false
          MetricStat:
              Metric:
                  Namespace: AWS/ApplicationELB
                  MetricName: RequestCount
                  Dimensions:
                      - Name: LoadBalancer
                        Value: app/EcsNat-AlbCo-gB01lRgFgX9v/34111fdfed82112c
              Period: 300
              Stat: Sum
              Unit: Count
Type: AWS::CloudWatch::Alarm
Properties:
    AlarmName: ApplicationInsights/ApplicationInsights-ContainerInsights-ECS_CLUSTER-EcsNativeBlueGreenStack-EcsConstructCluster14AE103B-0UD5SYuupUOg/AWS/ApplicationELB/HTTPCode_Target_5XX_Count/app/EcsNat-AlbCo-gB01lRgFgX9v/34111fdfed82112c/
    AlarmDescription: This is math expression alarm created and managed by the
        CloudWatch Application Insights. To make changes please go to your
        application's configuration in Application Insights
    Tags:
        - Key: ApplicationInsightsManaged
          Value: "TRUE"
    ActionsEnabled: true
    OKActions: []
    AlarmActions: []
    InsufficientDataActions: []
    Dimensions: []
    EvaluationPeriods: 2
    DatapointsToAlarm: 2
    Threshold: 0.1
    ComparisonOperator: GreaterThanOrEqualToThreshold
    TreatMissingData: notBreaching
    Metrics:
        - Id: m7
          Label: HTTPCode_Target_5XX_Count
          Expression: m7_HTTPCode_Target_5XX_Count/m7_RequestCount
        - Id: m7_HTTPCode_Target_5XX_Count
          Label: input
          ReturnData: false
          MetricStat:
              Metric:
                  Namespace: AWS/ApplicationELB
                  MetricName: HTTPCode_Target_5XX_Count
                  Dimensions:
                      - Name: LoadBalancer
                        Value: app/EcsNat-AlbCo-gB01lRgFgX9v/34111fdfed82112c
              Period: 300
              Stat: Sum
              Unit: Count
        - Id: m7_RequestCount
          Label: input
          ReturnData: false
          MetricStat:
              Metric:
                  Namespace: AWS/ApplicationELB
                  MetricName: RequestCount
                  Dimensions:
                      - Name: LoadBalancer
                        Value: app/EcsNat-AlbCo-gB01lRgFgX9v/34111fdfed82112c
              Period: 300
              Stat: Sum
              Unit: Count
Type: AWS::CloudWatch::Alarm
Properties:
    AlarmName: ApplicationInsights/ApplicationInsights-ContainerInsights-ECS_CLUSTER-EcsNativeBlueGreenStack-EcsConstructCluster14AE103B-0UD5SYuupUOg/ECS/ContainerInsights/MemoryUtilized/EcsNativeBlueGreenStack-EcsConstructCluster14AE103B-0UD5SYuupUOg/
    AlarmDescription: This is math expression alarm created and managed by the
        CloudWatch Application Insights. To make changes please go to your
        application's configuration in Application Insights
    Tags:
        - Key: ApplicationInsightsManaged
          Value: "TRUE"
    ActionsEnabled: true
    OKActions: []
    AlarmActions: []
    InsufficientDataActions: []
    Dimensions: []
    EvaluationPeriods: 2
    DatapointsToAlarm: 2
    Threshold: 0.9
    ComparisonOperator: GreaterThanOrEqualToThreshold
    TreatMissingData: ignore
    Metrics:
        - Id: m1
          Label: MemoryUtilized
          Expression: m1_MemoryUtilized/m1_MemoryReserved
        - Id: m1_MemoryUtilized
          Label: input
          ReturnData: false
          MetricStat:
              Metric:
                  Namespace: ECS/ContainerInsights
                  MetricName: MemoryUtilized
                  Dimensions:
                      - Name: ClusterName
                        Value: EcsNativeBlueGreenStack-EcsConstructCluster14AE103B-0UD5SYuupUOg
              Period: 300
              Stat: Average
              Unit: Megabytes
        - Id: m1_MemoryReserved
          Label: input
          ReturnData: false
          MetricStat:
              Metric:
                  Namespace: ECS/ContainerInsights
                  MetricName: MemoryReserved
                  Dimensions:
                      - Name: ClusterName
                        Value: EcsNativeBlueGreenStack-EcsConstructCluster14AE103B-0UD5SYuupUOg
              Period: 300
              Stat: Average
              Unit: Megabytes
Type: AWS::CloudWatch::Alarm
Properties:
    AlarmName: ApplicationInsights/ApplicationInsights-ContainerInsights-ECS_CLUSTER-EcsNativeBlueGreenStack-EcsConstructCluster14AE103B-0UD5SYuupUOg/ECS/ContainerInsights/CpuUtilized/EcsNativeBlueGreenStack-EcsConstructCluster14AE103B-0UD5SYuupUOg/
    AlarmDescription: This is math expression alarm created and managed by the
        CloudWatch Application Insights. To make changes please go to your
        application's configuration in Application Insights
    Tags:
        - Key: ApplicationInsightsManaged
          Value: "TRUE"
    ActionsEnabled: true
    OKActions: []
    AlarmActions: []
    InsufficientDataActions: []
    Dimensions: []
    EvaluationPeriods: 2
    DatapointsToAlarm: 2
    Threshold: 0.9
    ComparisonOperator: GreaterThanOrEqualToThreshold
    TreatMissingData: ignore
    Metrics:
        - Id: m3
          Label: CpuUtilized
          Expression: m3_CpuUtilized/m3_CpuReserved
        - Id: m3_CpuUtilized
          Label: input
          ReturnData: false
          MetricStat:
              Metric:
                  Namespace: ECS/ContainerInsights
                  MetricName: CpuUtilized
                  Dimensions:
                      - Name: ClusterName
                        Value: EcsNativeBlueGreenStack-EcsConstructCluster14AE103B-0UD5SYuupUOg
              Period: 300
              Stat: Average
              Unit: None
        - Id: m3_CpuReserved
          Label: input
          ReturnData: false
          MetricStat:
              Metric:
                  Namespace: ECS/ContainerInsights
                  MetricName: CpuReserved
                  Dimensions:
                      - Name: ClusterName
                        Value: EcsNativeBlueGreenStack-EcsConstructCluster14AE103B-0UD5SYuupUOg
              Period: 300
              Stat: Average
              Unit: None
For managing dashboards and alarms for each application
I checked what kind of CloudWatch alarms are configured when setting up CloudWatch Application Insights for an ECS cluster in Container Insights.
This seems useful for managing dashboards and alarms for each application.
By the way, the issue mentioned in the article below where after configuring Application Insights, UpdateClusterSettings is executed and Container Insights is no longer with enhanced observability did not occur.
I hope this article helps someone.
That's all from nonPi (@non____97) of the Cloud Business Division, Consulting Department!