
Verifying the impact of C++ inline specification on performance in MSVC
This page has been translated by machine translation. View original
Introduction
"Adding inline makes function calls disappear and code run faster." When learning C++, many people might initially understand it this way. However, the reality is not that simple.
In this article, we'll use MSVC to empirically examine how the presence or absence of the inline keyword affects execution speed. Does simply adding the inline keyword make code faster, or are other factors more significant? Through this verification, we'll clarify the relationship between the inline keyword and inline expansion.
What is an inline function?
In C++, you can add the inline keyword to function declarations.
inline int add(int a, int b) { return a + b; }
The specified meaning in the specification is the relaxation of the ODR (One Definition Rule). Normally, only one definition of the same function is allowed throughout the program. With inline, you can place the same definition in multiple translation units without a linker error. This is a necessary mechanism when writing function definitions in header files.
In the C++ standard, inline is also described as a hint for inline expansion, but it has no binding force and compilers can ignore it. At least from the specification standpoint, the only guarantee is the relaxation of ODR, not a promise of speed improvement.
What is inline expansion?
Inline expansion is an optimization technique where the compiler replaces a function call with the body of the function.
// Calling code (conceptual image)
result = add(x, y);  →  result = x + y;  // call instruction disappears
This eliminates call overhead, leading to faster execution for small functions. Additionally, at the expansion site, there are benefits of additional optimizations like constant folding and loop optimization becoming more effective.
Adding the inline keyword doesn't guarantee that the compiler will perform inline expansion. Conversely, even without it, the compiler may automatically expand the function. Compilers automatically determine whether to expand based on function size and call frequency, estimating costs and benefits. MSVC also has an extension called __forceinline that strongly requests expansion from the compiler. Even so, it's not absolutely guaranteed.
Test Environment
| Item | Value |
|---|---|
| OS | Windows 11 |
| CPU | Intel Core i7-11700F |
| Compiler | MSVC v143 (Visual Studio 2022) |
| C++ Standard | C++14 |
Target Audience
- Those who have heard of C++
inlinebut don't know the mechanism well - Those interested in how compilers optimize function calls
References
- inline specifier - cppreference.com
- __forceinline - Microsoft Learn
- /GL (Whole Program Optimization) - Microsoft Learn
Verification Method
In this article, we'll empirically verify how compilers actually behave.
- Test 1: Presence or absence of
inlinespecification
We'll prepare 3 patterns for the same function: unmodified (plain) /inline/__forceinline, and compare execution times. This directly tests whether addinginlineactually makes code faster. - Test 2: Function characteristics
We'll prepare 3 types of functions: minimal function (add), function with branching (clamp), and function with a loop (heavy), to check how function size and structure affect inline expansion decisions. - Test 3: Call location
We'll compare execution times when function definitions and calls are in the same.cppfile (same-TU) versus different.cppfiles (cross-TU). - Test 4: Compilation conditions
We'll build the same code with 3 configurations: Debug (no optimization), Release_NoLTO (with optimization), and Release_LTO (with optimization + link-time optimization) to check the impact of optimization options.
Test Functions
We've prepared 3 types of functions. Each is defined with 3 modifiers: unmodified (plain) / inline / __forceinline in the same translation unit (same-TU). We add static to prevent link conflicts with identically named functions for cross-TU.
// --- add: minimal function (1 instruction) ---
static int add_plain_same_tu(int a, int b) {
    return a + b;
}
static inline int add_inlined_same_tu(int a, int b) {
    return a + b;
}
static __forceinline int add_forced_same_tu(int a, int b) {
    return a + b;
}

// --- clamp: function with branching ---
static int clamp_plain_same_tu(int value, int lo, int hi) {
    if (value < lo) return lo;
    if (value > hi) return hi;
    return value;
}
static inline int clamp_inlined_same_tu(int value, int lo, int hi) {
    if (value < lo) return lo;
    if (value > hi) return hi;
    return value;
}
static __forceinline int clamp_forced_same_tu(int value, int lo, int hi) {
    if (value < lo) return lo;
    if (value > hi) return hi;
    return value;
}

// --- heavy: function with loop ---
static int heavy_plain_same_tu(int n) {
    int sum = 0;
    for (int i = 1; i <= n; ++i) { sum += i * i; }
    return sum;
}
static inline int heavy_inlined_same_tu(int n) {
    int sum = 0;
    for (int i = 1; i <= n; ++i) { sum += i * i; }
    return sum;
}
static __forceinline int heavy_forced_same_tu(int n) {
    int sum = 0;
    for (int i = 1; i <= n; ++i) { sum += i * i; }
    return sum;
}
For the different translation unit (cross-TU), we define unmodified functions in a separate file.
// cross_tu_functions.h
#pragma once
int add_plain_cross_tu(int a, int b);
int clamp_plain_cross_tu(int value, int lo, int hi);
int heavy_plain_cross_tu(int n);
// cross_tu_functions.cpp
#include "cross_tu_functions.h"

int add_plain_cross_tu(int a, int b) {
    return a + b;
}
int clamp_plain_cross_tu(int value, int lo, int hi) {
    if (value < lo) return lo;
    if (value > hi) return hi;
    return value;
}
int heavy_plain_cross_tu(int n) {
    int sum = 0;
    for (int i = 1; i <= n; ++i) { sum += i * i; }
    return sum;
}
Measurement Method
We used the RUN_BENCH macro for measurements. To avoid calls through function pointers, we directly expanded the call expressions as macro arguments. After a 1 million warmup, we called add and clamp 100 million times, and heavy 10 million times, recording the elapsed time. Addition to a volatile variable prevents Dead Code Elimination. Note that the measurements in this article are from a single trial and include the effects of optimization suppression via volatile. Since our goal is to understand trends, differences of a few milliseconds are treated as margin of error.
bench.h (measurement macro and utilities)
#pragma once

#define _CRT_SECURE_NO_WARNINGS

#include <chrono>
#include <cstdio>
#include <string>
#include <vector>

struct BenchResult {
    std::string config;
    std::string function;
    std::string inline_type;
    std::string call_type;
    int iterations;
    double time_ms;
};

// RUN_BENCH: direct call macro (avoids function pointer to preserve inlining)
// - Warmup: 1,000,000 iterations
// - Measurement: `iters` iterations
// - volatile sink prevents dead-code elimination
#define RUN_BENCH(results, cfg, func, itype, ctype, iters, call_expr) \
    do {                                                              \
        volatile int sink = 0;                                        \
        for (int i = 0; i < 1000000; ++i) {                           \
            sink += (call_expr);                                      \
        }                                                             \
        auto start = std::chrono::high_resolution_clock::now();       \
        sink = 0;                                                     \
        for (int i = 0; i < (iters); ++i) {                           \
            sink += (call_expr);                                      \
        }                                                             \
        auto end = std::chrono::high_resolution_clock::now();         \
        double ms = std::chrono::duration<double, std::milli>(        \
            end - start).count();                                     \
        BenchResult r;                                                \
        r.config = (cfg);                                             \
        r.function = (func);                                          \
        r.inline_type = (itype);                                      \
        r.call_type = (ctype);                                        \
        r.iterations = (iters);                                       \
        r.time_ms = ms;                                               \
        (results).push_back(r);                                       \
    } while (0)

inline void write_csv(const std::vector<BenchResult>& results,
                      const std::string& filename) {
    FILE* fp = fopen(filename.c_str(), "w");
    if (!fp) return;
    fprintf(fp, "config,function,inline_type,call_type,iterations,time_ms\n");
    for (const auto& r : results) {
        fprintf(fp, "%s,%s,%s,%s,%d,%.3f\n",
                r.config.c_str(), r.function.c_str(),
                r.inline_type.c_str(), r.call_type.c_str(),
                r.iterations, r.time_ms);
    }
    fclose(fp);
}

inline void print_results(const std::vector<BenchResult>& results) {
    printf("%-14s %-24s %-14s %-10s %12s %10s\n",
           "config", "function", "inline_type", "call_type",
           "iterations", "time_ms");
    printf("----------------------------------------------------"
           "-------------------------------------------\n");
    for (const auto& r : results) {
        printf("%-14s %-24s %-14s %-10s %12d %10.3f\n",
               r.config.c_str(), r.function.c_str(),
               r.inline_type.c_str(), r.call_type.c_str(),
               r.iterations, r.time_ms);
    }
}
main() function (measurement execution part)
int main() {
    std::vector<BenchResult> results;
    const char* cfg = BENCH_CONFIG;

    const int ADD_ITERS   = 100000000; // 100 million
    const int CLAMP_ITERS = 100000000; // 100 million
    const int HEAVY_ITERS =  10000000; // 10 million

    // --- same-TU: add ---
    RUN_BENCH(results, cfg, "add_plain",  "plain",        "same_tu", ADD_ITERS,
              add_plain_same_tu(i, i + 1));
    RUN_BENCH(results, cfg, "add_inline", "inline",       "same_tu", ADD_ITERS,
              add_inlined_same_tu(i, i + 1));
    RUN_BENCH(results, cfg, "add_forced", "__forceinline", "same_tu", ADD_ITERS,
              add_forced_same_tu(i, i + 1));

    // --- same-TU: clamp ---
    RUN_BENCH(results, cfg, "clamp_plain",  "plain",        "same_tu", CLAMP_ITERS,
              clamp_plain_same_tu(i, 0, 1000));
    RUN_BENCH(results, cfg, "clamp_inline", "inline",       "same_tu", CLAMP_ITERS,
              clamp_inlined_same_tu(i, 0, 1000));
    RUN_BENCH(results, cfg, "clamp_forced", "__forceinline", "same_tu", CLAMP_ITERS,
              clamp_forced_same_tu(i, 0, 1000));

    // --- same-TU: heavy ---
    RUN_BENCH(results, cfg, "heavy_plain",  "plain",        "same_tu", HEAVY_ITERS,
              heavy_plain_same_tu(i % 50 + 1));
    RUN_BENCH(results, cfg, "heavy_inline", "inline",       "same_tu", HEAVY_ITERS,
              heavy_inlined_same_tu(i % 50 + 1));
    RUN_BENCH(results, cfg, "heavy_forced", "__forceinline", "same_tu", HEAVY_ITERS,
              heavy_forced_same_tu(i % 50 + 1));

    // --- cross-TU ---
    RUN_BENCH(results, cfg, "add_plain",   "plain", "cross_tu", ADD_ITERS,
              add_plain_cross_tu(i, i + 1));
    RUN_BENCH(results, cfg, "clamp_plain", "plain", "cross_tu", CLAMP_ITERS,
              clamp_plain_cross_tu(i, 0, 1000));
    RUN_BENCH(results, cfg, "heavy_plain", "plain", "cross_tu", HEAVY_ITERS,
              heavy_plain_cross_tu(i % 50 + 1));

    // --- Output ---
    print_results(results);

    std::string csv_name = std::string("results_") + cfg + ".csv";
    write_csv(results, csv_name);
    printf("\nResults written to %s\n", csv_name.c_str());

    return 0;
}
Build Configurations
We used three build configurations. The BENCH_CONFIG macro embeds the configuration name, reflected in the CSV filename.
| Configuration Name (Article Notation) | VS Configuration Name | Optimization | LTO |
|---|---|---|---|
| Debug | Debug | None (/Od) |
None |
| Release_NoLTO | ReleaseNoLTO | Yes (/O2 /Oi) |
None |
| Release_LTO | Release | Yes (/O2 /Oi) |
Yes (/GL + /LTCG) |
Build commands:
msbuild test-inline-code-performance.sln /p:Configuration=Debug /p:Platform=x64
msbuild test-inline-code-performance.sln /p:Configuration=ReleaseNoLTO /p:Platform=x64
msbuild test-inline-code-performance.sln /p:Configuration=Release /p:Platform=x64
We used the /FA option to output assembly listings.
Verification Results
Test 1: Presence or absence of inline specification
Here are the results for same translation unit with Release_NoLTO.
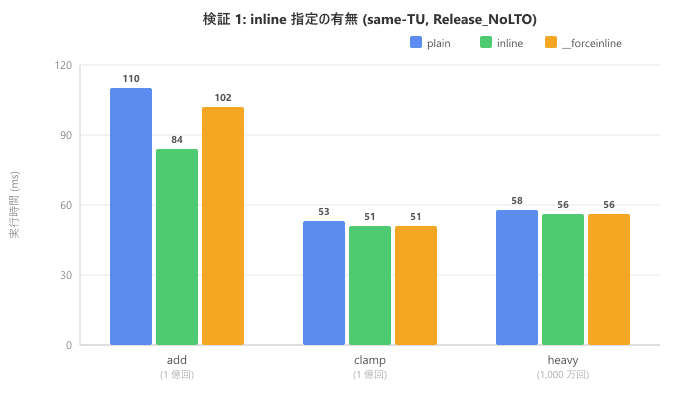
| Function | plain (ms) | inline (ms) |
__forceinline (ms) |
|---|---|---|---|
| add (100 million) | 110 | 84 | 102 |
| clamp (100 million) | 53 | 51 | 51 |
| heavy (10 million) | 58 | 56 | 56 |
For clamp and heavy, execution times are almost identical across all three modifiers. For add, there's some variation in the numbers, but checking the assembly confirmed that inline expansion occurred for all three modifiers. These differences likely stem from variations in code layout rather than whether inline expansion occurred. At least in this MSVC environment, the presence or absence of inline did not affect the compiler's optimization decisions.
Test 2: Function Characteristics
We reorganize the same data along the function axis. We checked the assembly for plain modifier, same-TU, Release_NoLTO.
| Function | Characteristic | Inline Expansion with plain |
|---|---|---|
| add | Minimal (1 instruction) | Expanded |
| clamp | With branching | Expanded |
| heavy | With loop | Not expanded |
The compiler automatically expanded the minimal add function. The clamp function with branching was also expanded. However, heavy with a loop was deemed too costly and was not expanded unless __forceinline was used. The reason heavy shows almost identical execution times across all three modifiers in Test 1 is that the calculation cost of the loop body dominates, making the presence or absence of call overhead less noticeable in the results. In this test, the function's characteristics had a much greater impact on expansion decisions than the presence of the inline keyword.
Test 3: Call Location
We compare same translation unit and different translation unit in Release_NoLTO. For cross-TU, only plain modifier was measured.
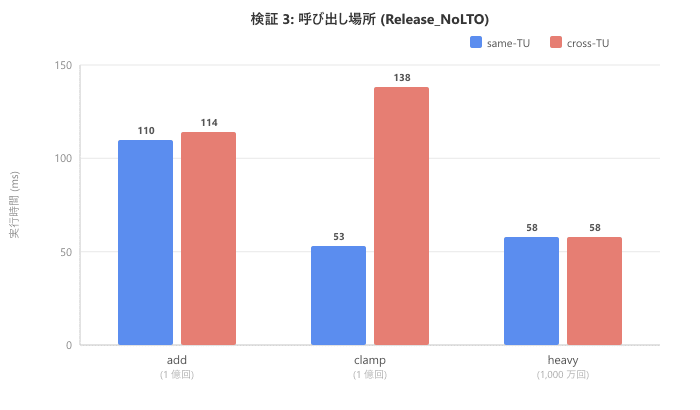
| Function | same-TU (ms) | cross-TU (ms) |
|---|---|---|
| add (100 million) | 110 | 114 |
| clamp (100 million) | 53 | 138 |
| heavy (10 million) | 58 | 58 |
Pay attention to clamp. It went from 53ms in same-TU to 138ms in cross-TU, about 2.6 times slower. When crossing translation units, the compiler cannot reference the function definition, preventing inline expansion. As a result, not only does call overhead remain, but opportunities for additional optimizations like constant folding that would happen at the expansion site are also lost. For add, the function body is so minimal that the call overhead itself is small, making the difference less noticeable. For heavy, there's no difference because it wasn't expanded to begin with.
Test 4: Compilation Conditions
We compare three build configurations in cross-TU.
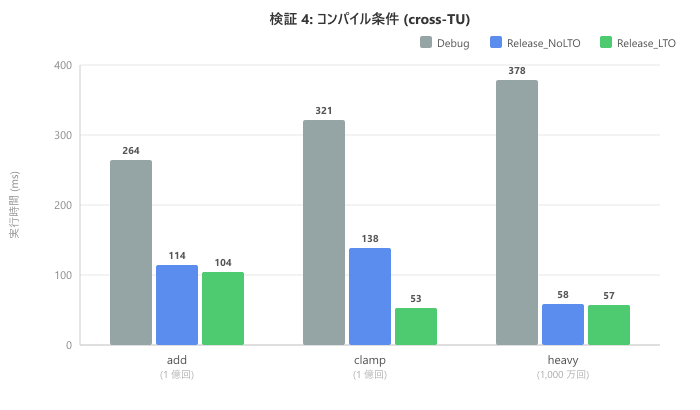
| Function | Debug (ms) | Release_NoLTO (ms) | Release_LTO (ms) |
|---|---|---|---|
| add (100 million) | 264 | 114 | 104 |
| clamp (100 million) | 321 | 138 | 53 |
| heavy (10 million) | 378 | 58 | 57 |
Debug is generally slower because optimizations are disabled. In Release_NoLTO, heavy shows significant improvement, but cross-TU clamp remains at 138ms. Note that in Release_LTO, clamp improves to 53ms. This is because LTO (Link-Time Optimization) enables inline expansion across translation units. The cross-TU performance degradation confirmed in Test 3 can be resolved with LTO.
Checking the Assembly
Beyond just numbers, we also verified inline expansion by examining the generated assembly.
Release_NoLTO: add (same-TU) → With expansion
$LL16@main:
    mov     ecx, DWORD PTR sink$1[rsp]
    inc     ecx
    add     ecx, edx          ; Addition is directly embedded
    mov     DWORD PTR sink$1[rsp], ecx
    add     edx, 2
    cmp     edx, 2000000
    jl      SHORT $LL16@main
There's no call instruction. The function body is directly expanded in the loop as add ecx, edx. Note that cmp edx, 2000000 is the comparison instruction for the warmup loop (1 million times), with the value changed due to the compiler's loop transformation. This doesn't affect our inline expansion verification.
Release_NoLTO: add (cross-TU) → No expansion
$LL88@main:
    lea     ebx, DWORD PTR [rax+1]
    mov     edx, ebx
    mov     ecx, eax
    call    ?add_plain_cross_tu@@YAHHH@Z  ; Function call remains
    ...
    jl      SHORT $LL88@main
Because the translation units differ, the call instruction remains, causing a function call each time. In Debug builds, call instructions are output even in the same translation unit because optimizations are disabled. We also confirmed that in Release_LTO cross-TU, the call instructions for add and clamp disappear, generating code equivalent to same-TU.
What We Learned
Through this verification in our MSVC environment, we confirmed the following:
- The presence or absence of the
inlinekeyword alone does not change the result of inline expansion - Whether inline expansion occurs depends greatly on the function's size and structure
- Crossing translation units loses opportunities for inline expansion
- Enabling LTO allows expansion across translation unit boundaries
However, this doesn't mean inline has no practical value. Adding inline allows you to place function definitions in header files, enabling the compiler to reference the function body from the calling translation unit. As confirmed in Test 3, this is important for creating opportunities for inline expansion.
Conclusion
Simply adding inline doesn't automatically make code faster. Inline expansion is automatically determined by the compiler based on function characteristics and costs. Function design, translation unit configuration, and LTO utilization affect speed more than the presence of the keyword. When performance is a concern, it's best to start by measuring with a profiler.