
Visualizing the Incident Investigation Thought Process Using Datadog MCP: Creating Skills
This page has been translated by machine translation. View original
Hello. I am Shiina from the Operations department.
Introduction
Recently, Datadog MCP servers have become generally available, and many of you are likely using them for incident investigations.
While MCP servers allow AI to directly obtain and analyze telemetry data, there is a challenge in understanding how it reached its conclusions.
To share findings with the team and allow humans to verify AI judgments, I felt we needed a mechanism to record and visualize the investigation process itself.
So this time, I created a skill using Claude Code Skills that allows you to keep a report of the investigation process while cycling through the "observation → hypothesis formulation → verification" loop.
I tried conducting an actual investigation using this skill, so I'd like to introduce it.
Created Skill
Overview
This is an incident investigation support skill using Datadog MCP server.
It narrows down causes by repeating the "observation → hypothesis formulation → verification" loop and visualizes the entire investigation process as an interactive HTML report.
Main Features
- Supports root cause identification through "observation → hypothesis formulation → verification" in incident investigations
- Evidence collection using Datadog MCP tools (metrics, logs, APM, events, etc.)
- Management and visualization of hypothesis status (Validated / Inconclusive / Invalidated)
- Automatic generation of interactive HTML investigation reports
SKILL.md
Please refer to the repository below.
Setup
Prerequisites
- Claude Code CLI installed
- Datadog MCP server configured
Please also refer to the following article for setup instructions.
https://dev.classmethod.jp/articles/datadog-mcp-server-apm-cloudformation-monitor/
Skill Installation
- Clone the repository in any directory.
git clone https://github.com/shiina-yuichi/dd-mcp-investigator.git
The file structure will be as follows.
dd-mcp-investigator/
├── .claude/
│   └── skills/
│       └── incident-investigation/
│           ├── SKILL.md                        # Skill definition (auto-detected by Claude Code)
│           └── templates/
│               └── investigation-report.html   # HTML report template
├── CLAUDE.md                                   # Project config
└── README.md
- Navigate to the directory and launch Claude Code.
SKILL.md placed under .claude/skills/ will be automatically detected by Claude Code.
cd dd-mcp-investigator
claude
- Confirm the skill registration.
Use the/skillscommand to display the skill list and confirm that incident-investigation is displayed.
  Skills
  1 skills

  Project skills (.claude/skills)
  incident-investigation · ~40 description tokens
Usage
Call the skill with the /incident-investigation command and request an investigation in natural language.

⏺ Please tell me about the incident you want to investigate. Providing any of the following information will help me start the investigation:

  1. Monitor alert — monitor name or ID
  2. Incident — incident ID or summary
  3. User report — problem symptoms, affected service name, time of occurrence, etc.

  What problem would you like to investigate?
Trying It Out
I tried the following incident investigations using Claude Code (Opus 4.6 model):
- User report (APM latency investigation)
- Monitor alert
APM Latency Investigation
Instructions
Investigate around 3/18 14:30 (JST)
The API request "GET /api/products" on the website "shopping-site" has some requests taking over 1 second.
Please identify the root cause
Output Results
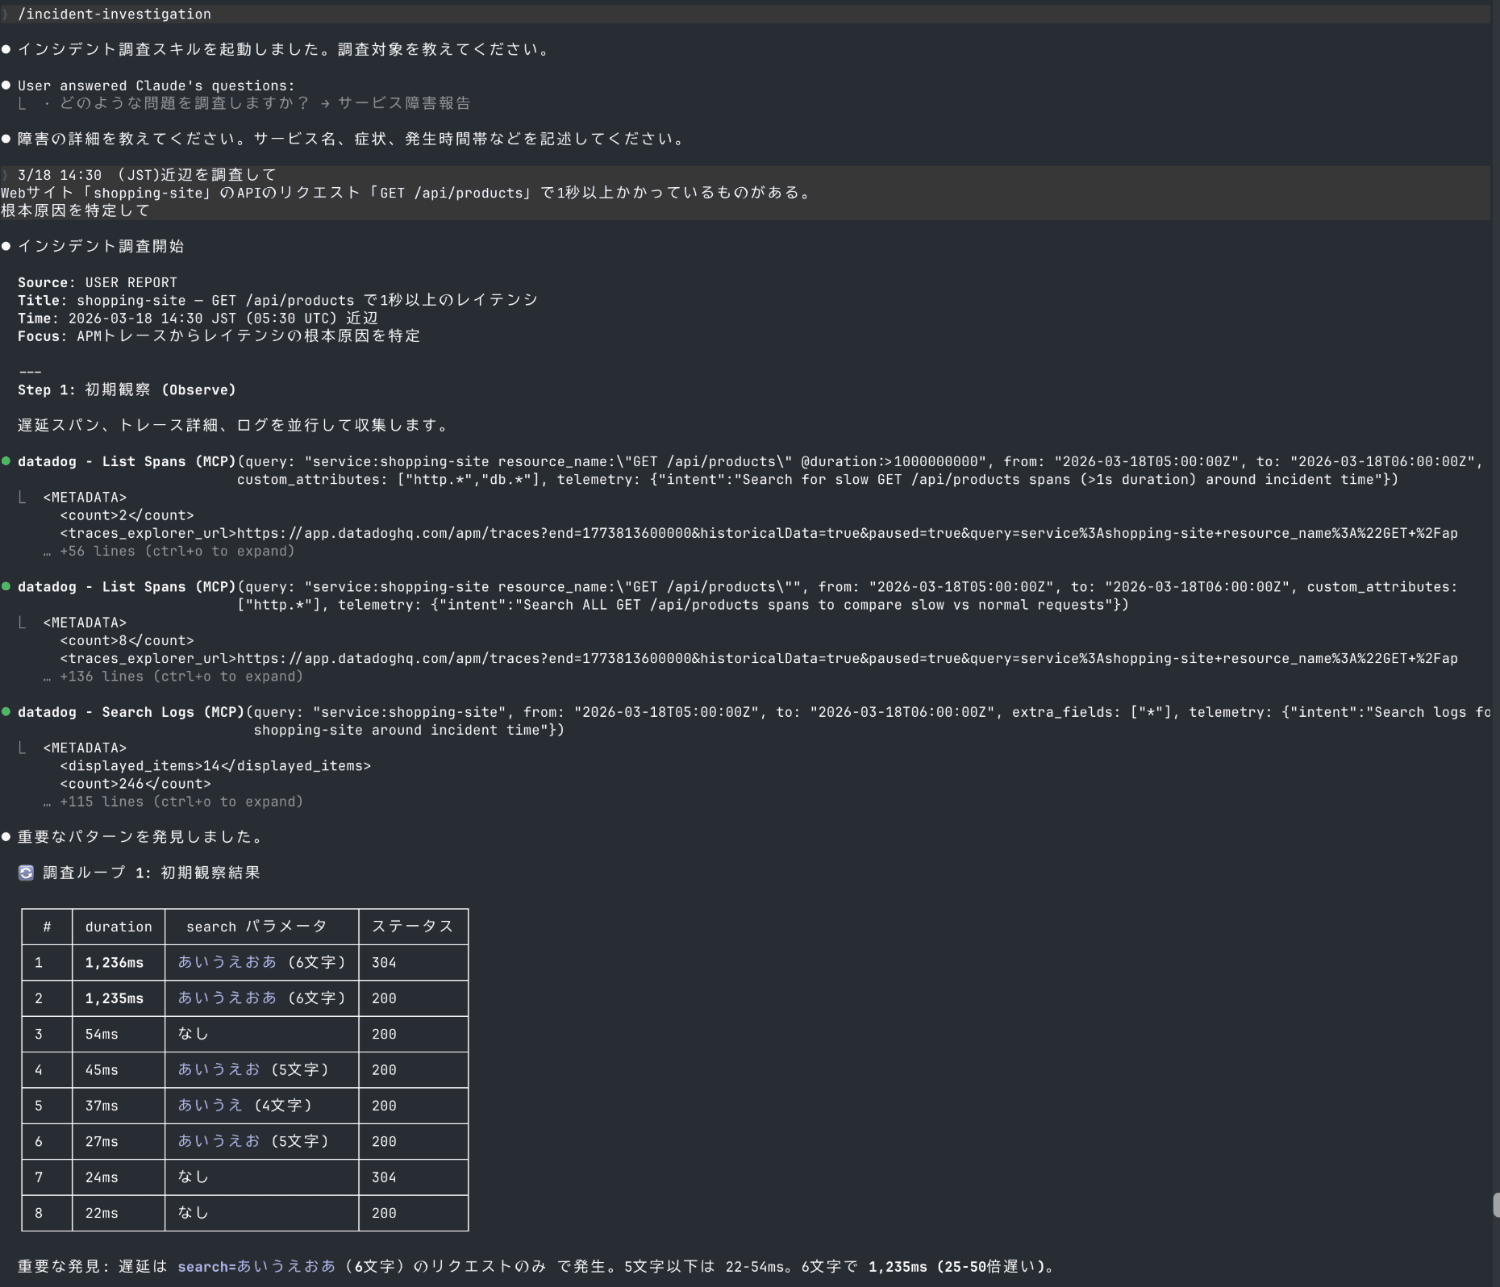
A complete incident investigation was performed using the Datadog MCP server.
Let's check the file output in HTML format.
Report
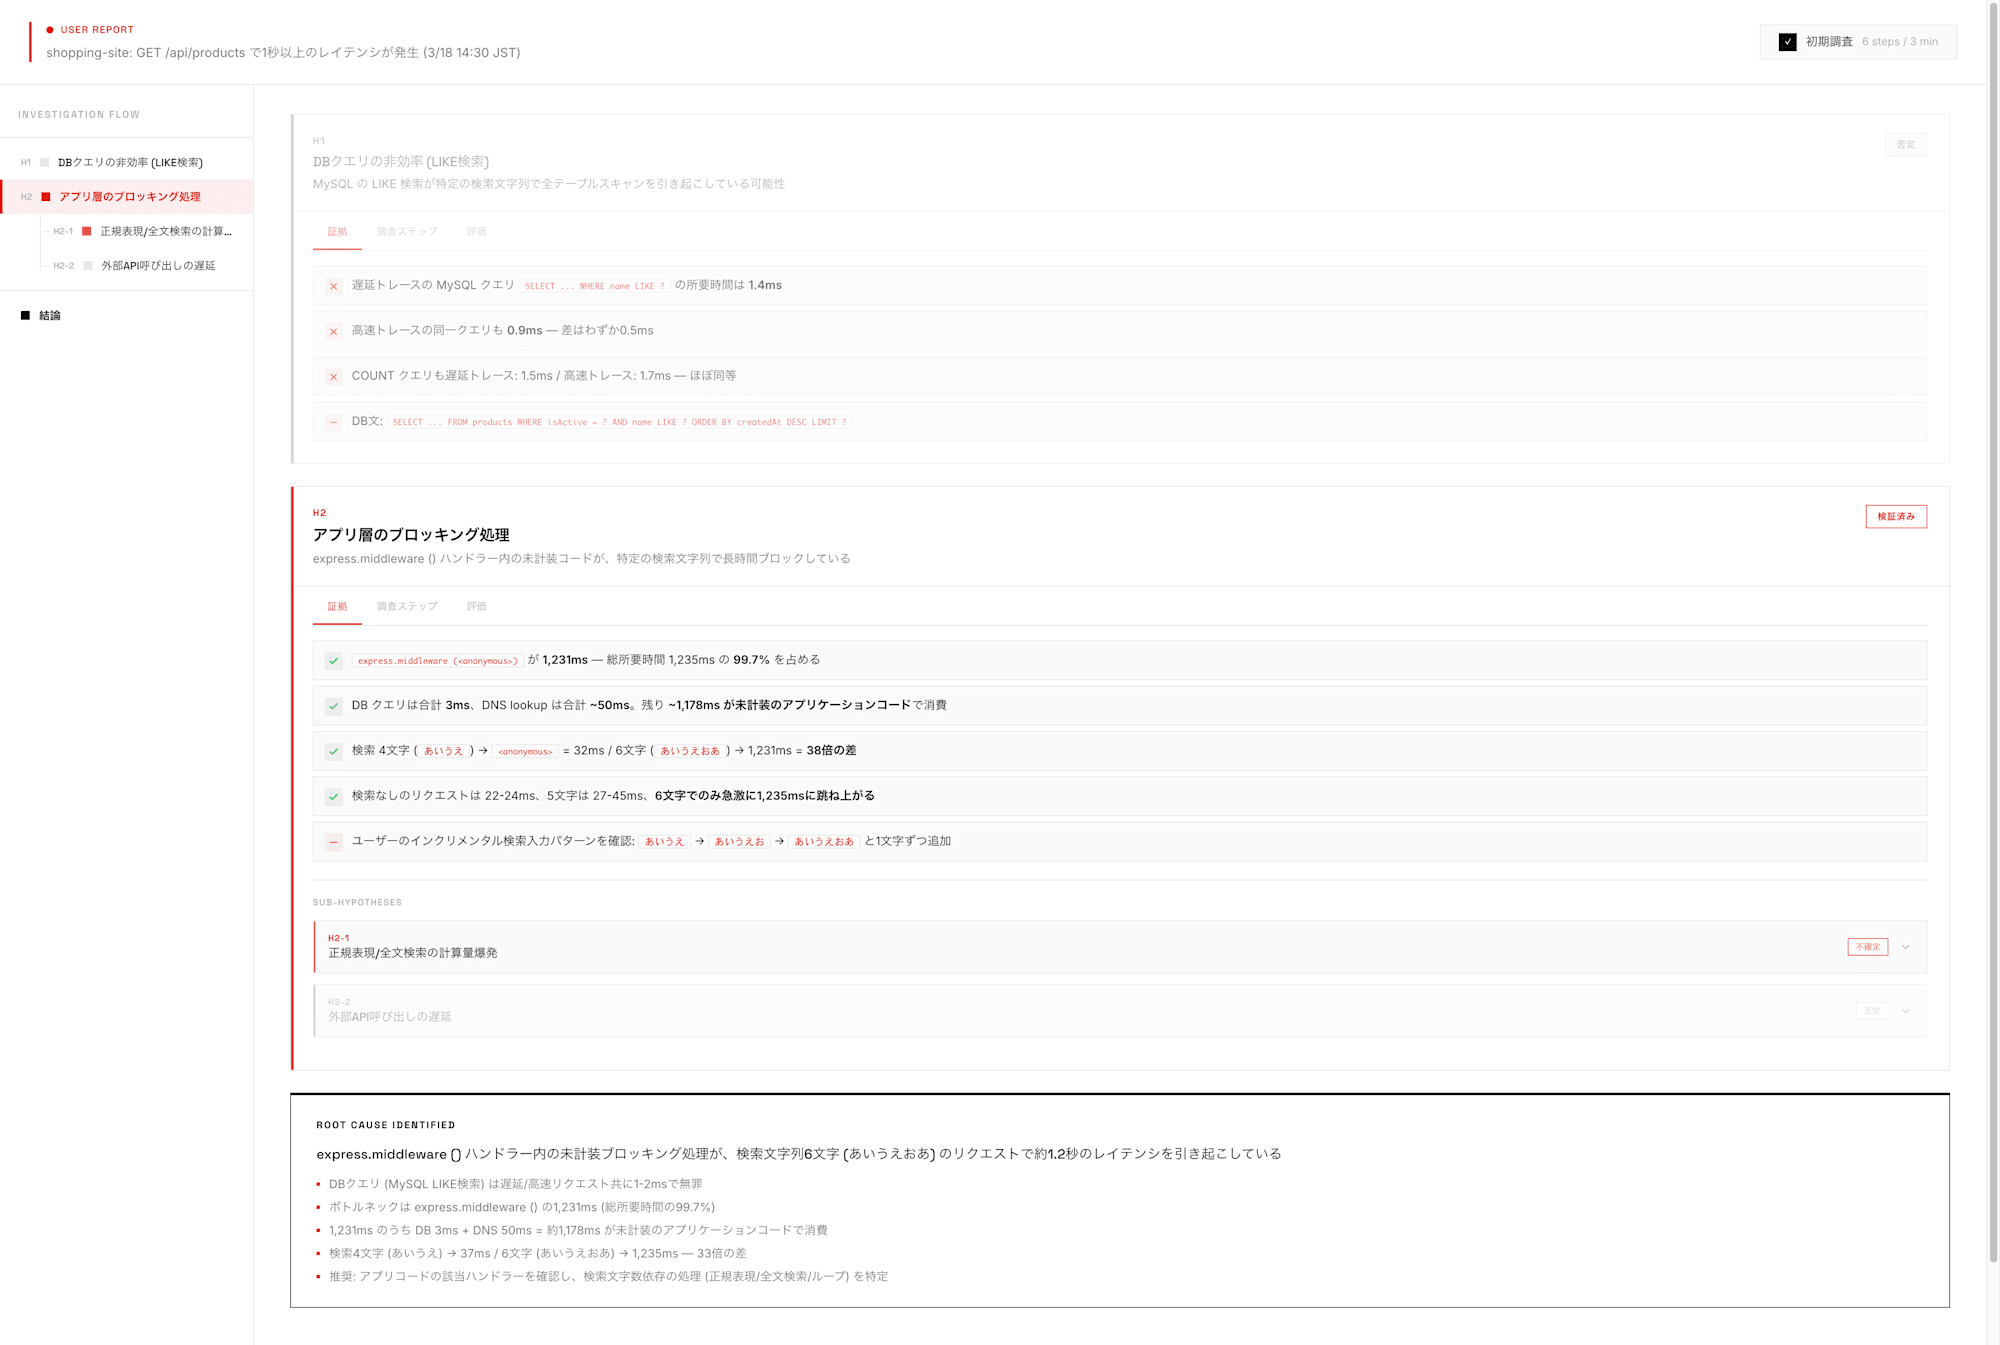
Evidence
Steps
Evaluation
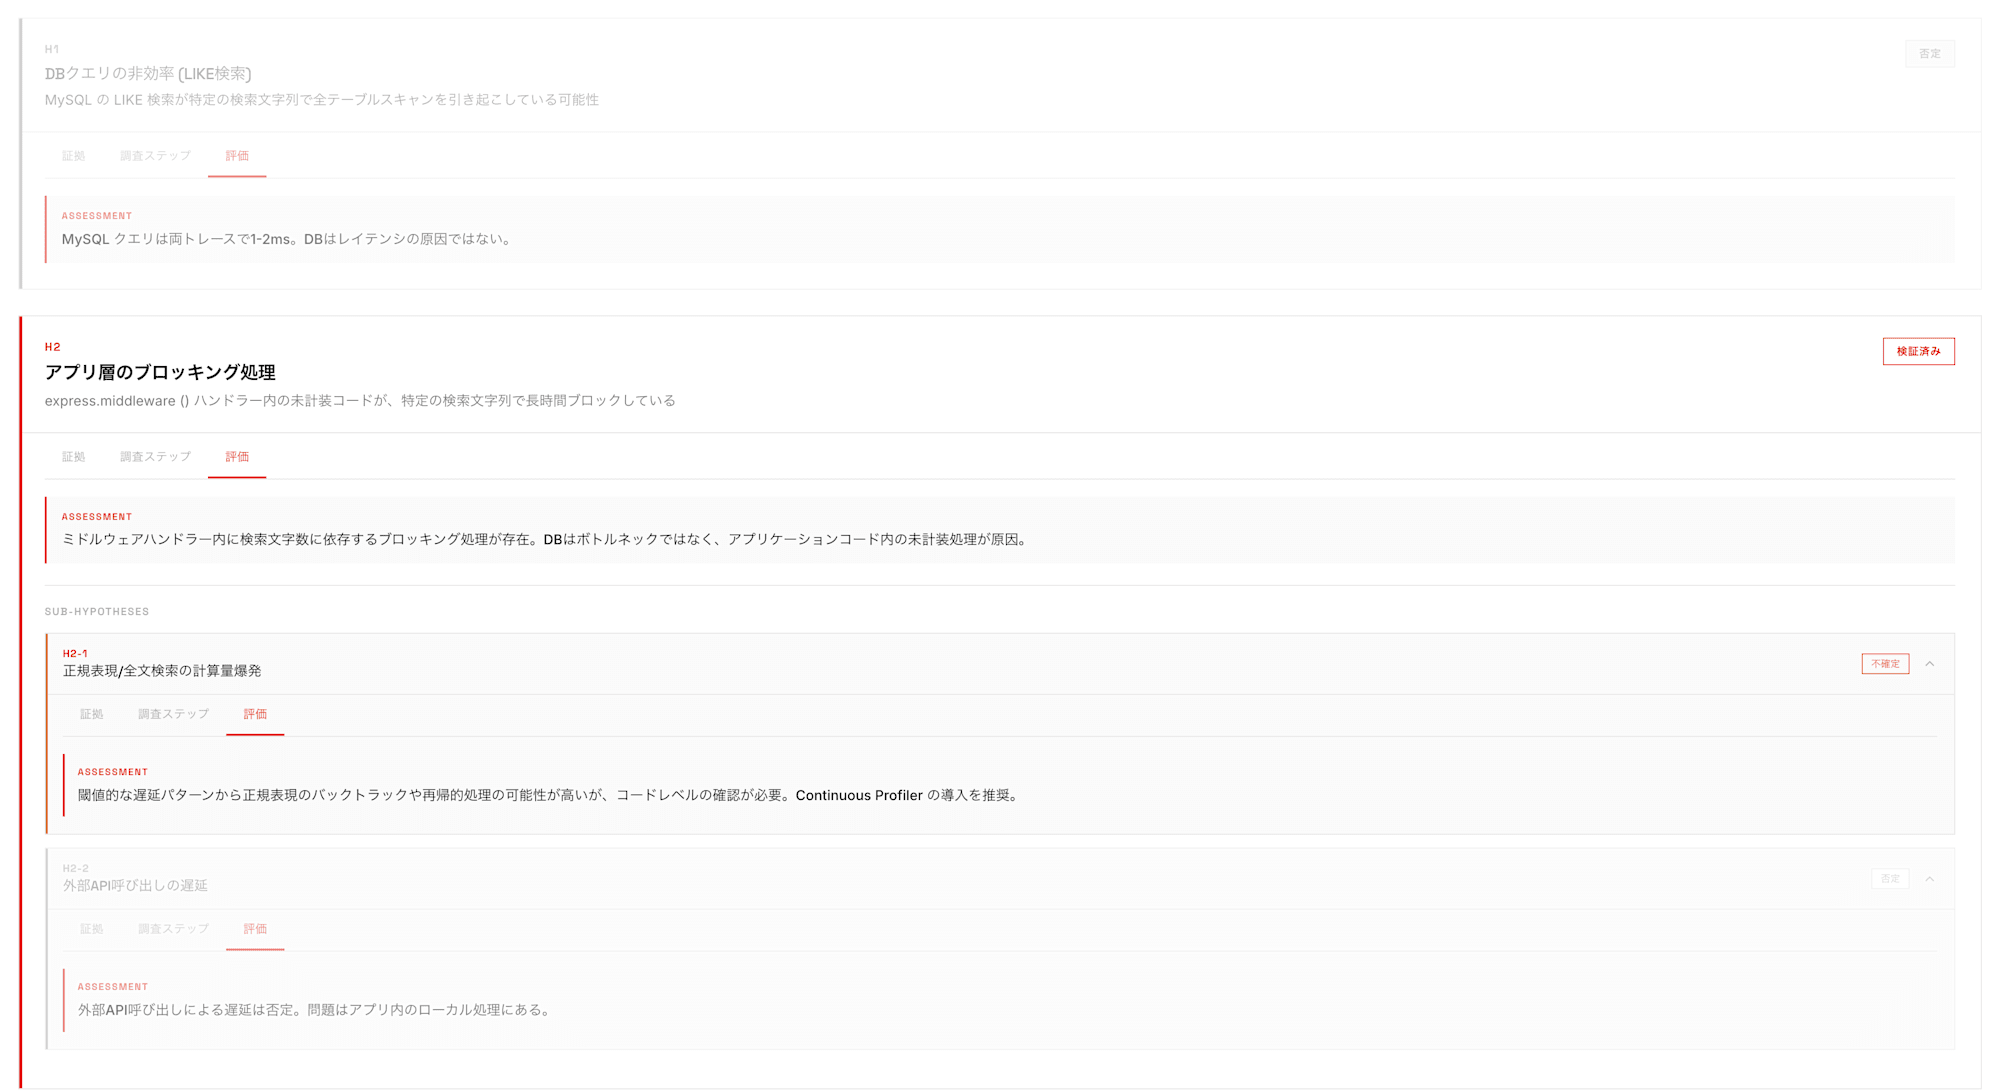
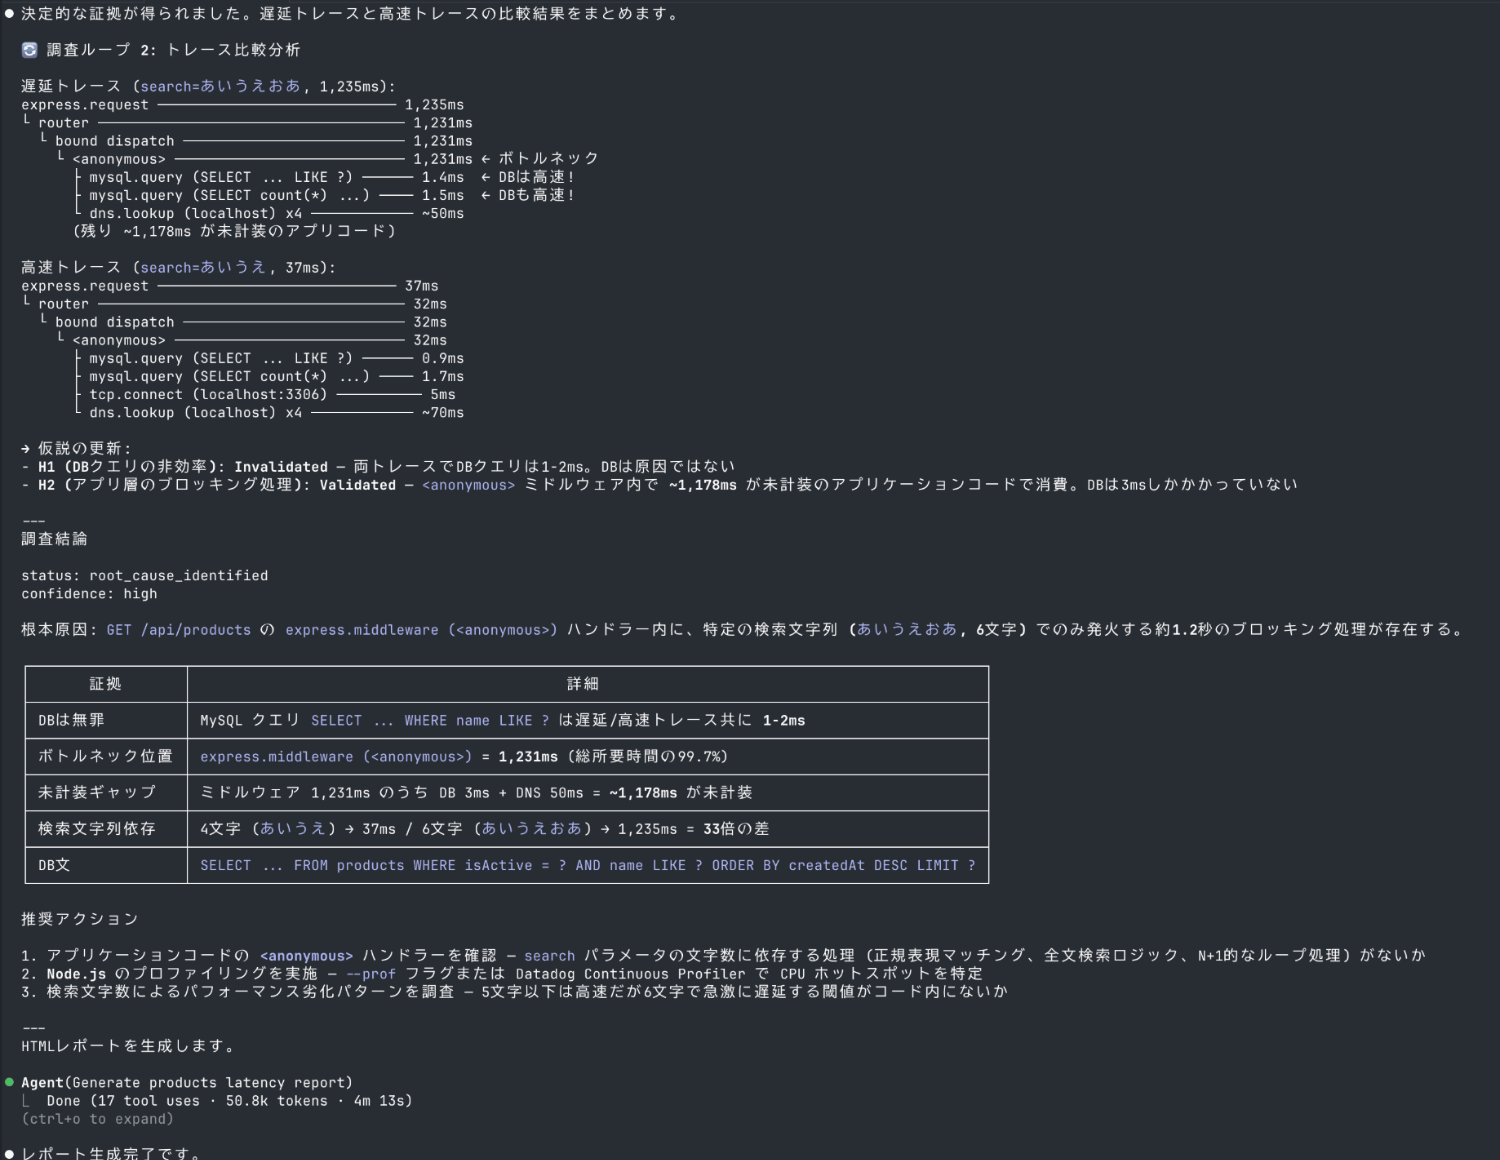
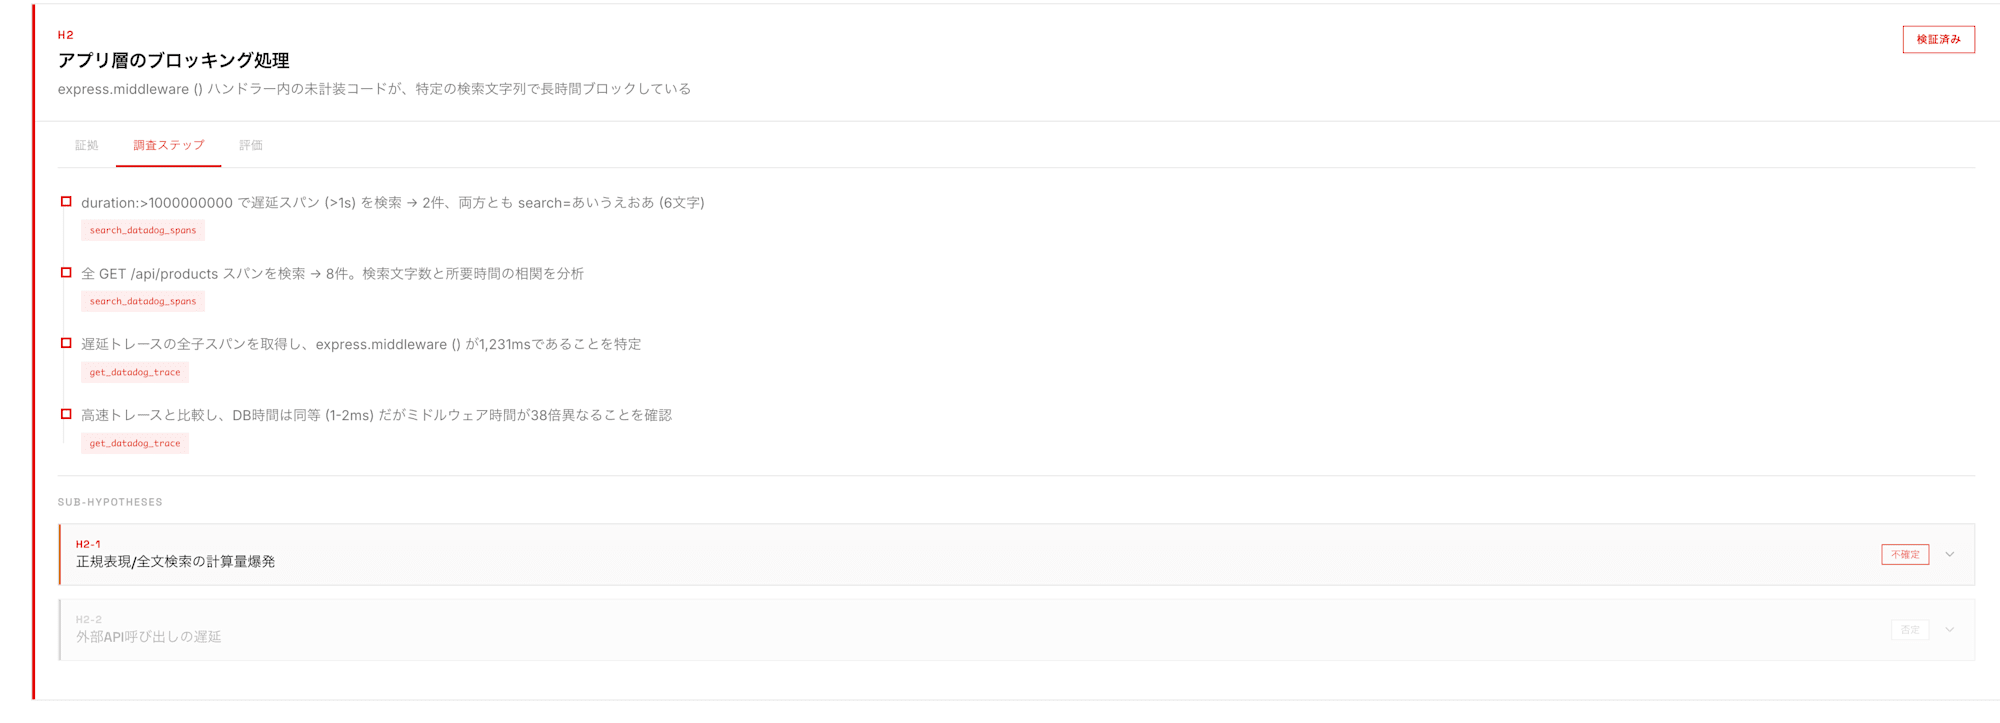
It helps narrow down the causes by repeating the verification loop based on several hypotheses.
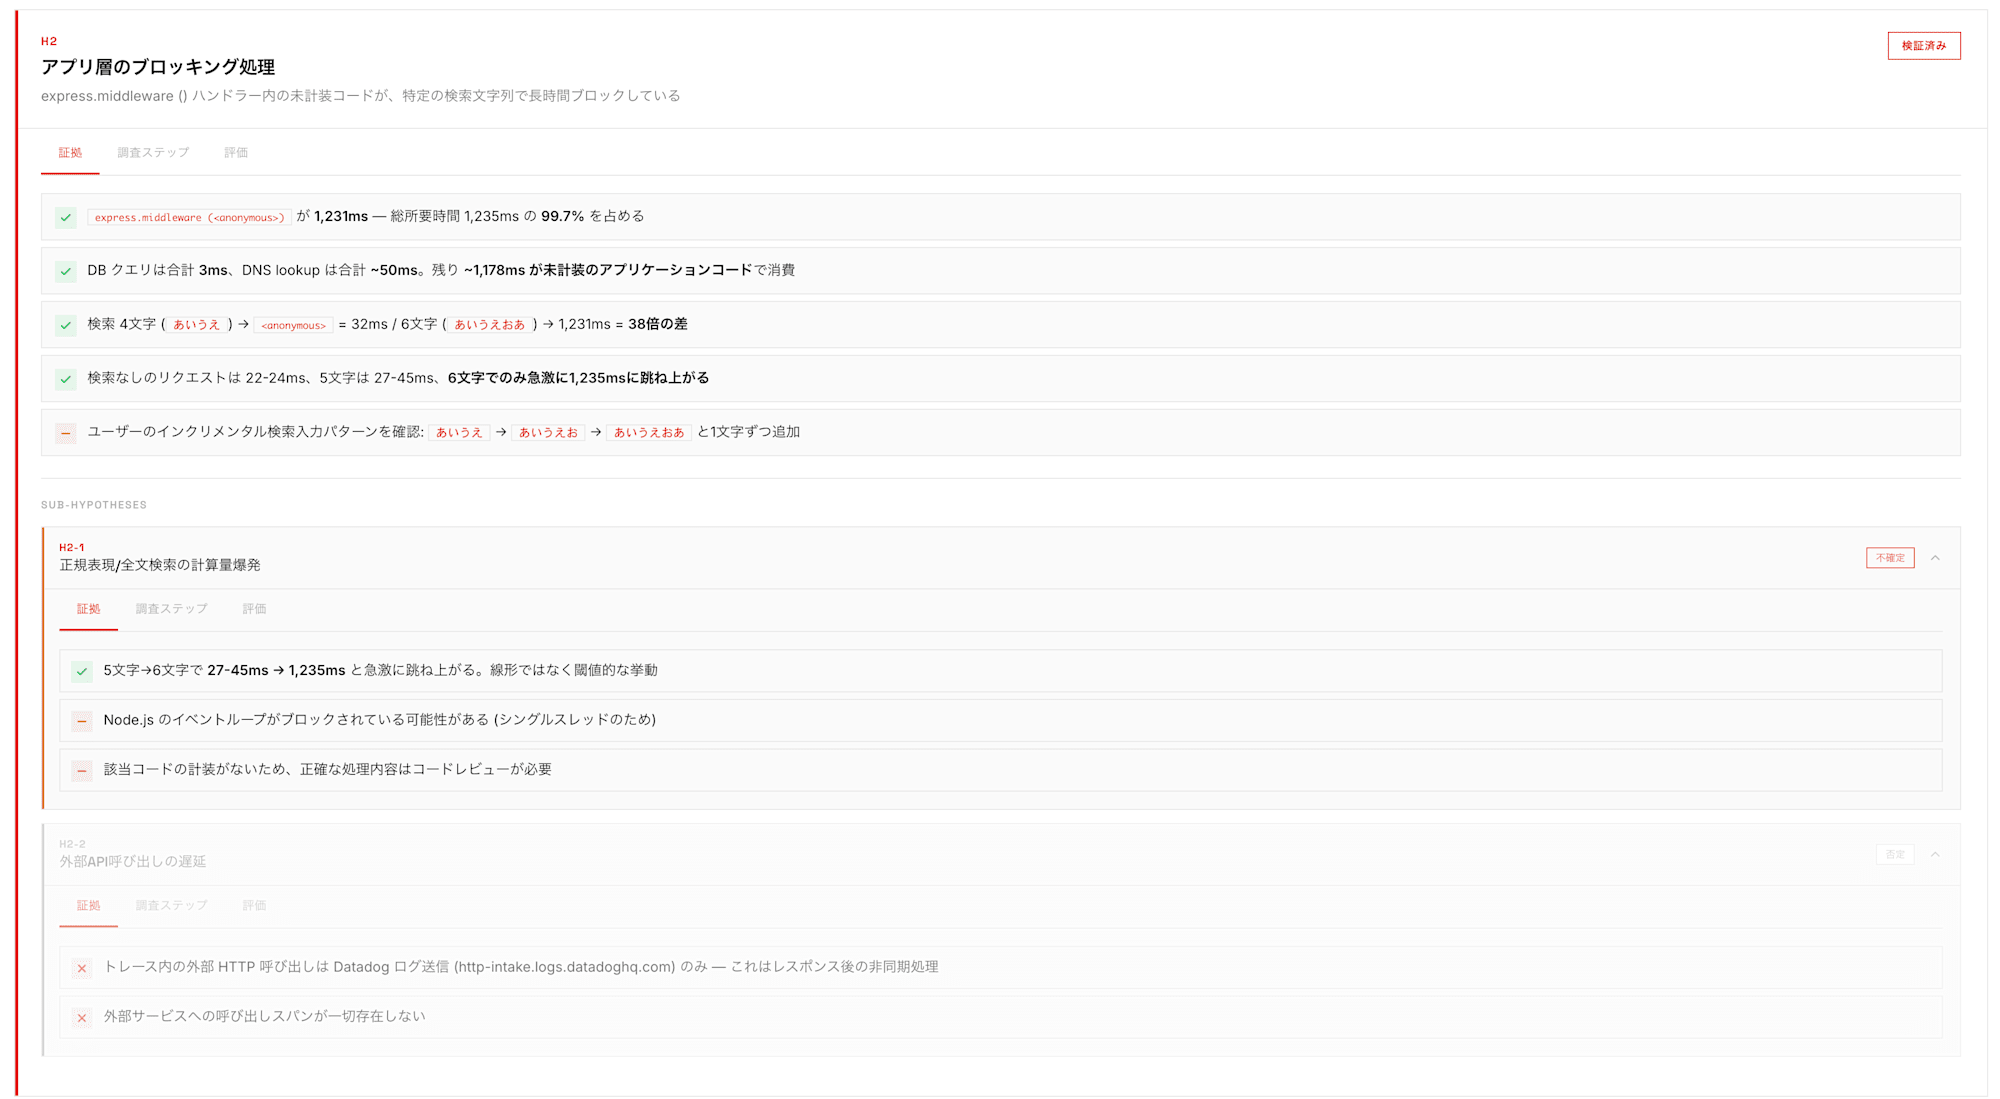
The investigation process, including what observational data was examined and how judgments were made, was visualized.
In this investigation, although there were hypotheses such as computational explosion in regex/full-text search, sufficient evidence was found for blocking processing at the application layer, which led to the conclusion.
Monitor Alert Investigation
Instructions
⏺ Please tell me about the incident or alert you want to investigate. Any of the following information will help me start the investigation:

  - Monitor alert: monitor name, ID, or alert content
  - Incident: incident ID, title, or description
  - User report: problem symptoms, affected services or host names

  What problem would you like to investigate?
For investigating a monitor alert, I specified a monitor ID.
Investigate monitor ID XXXXX
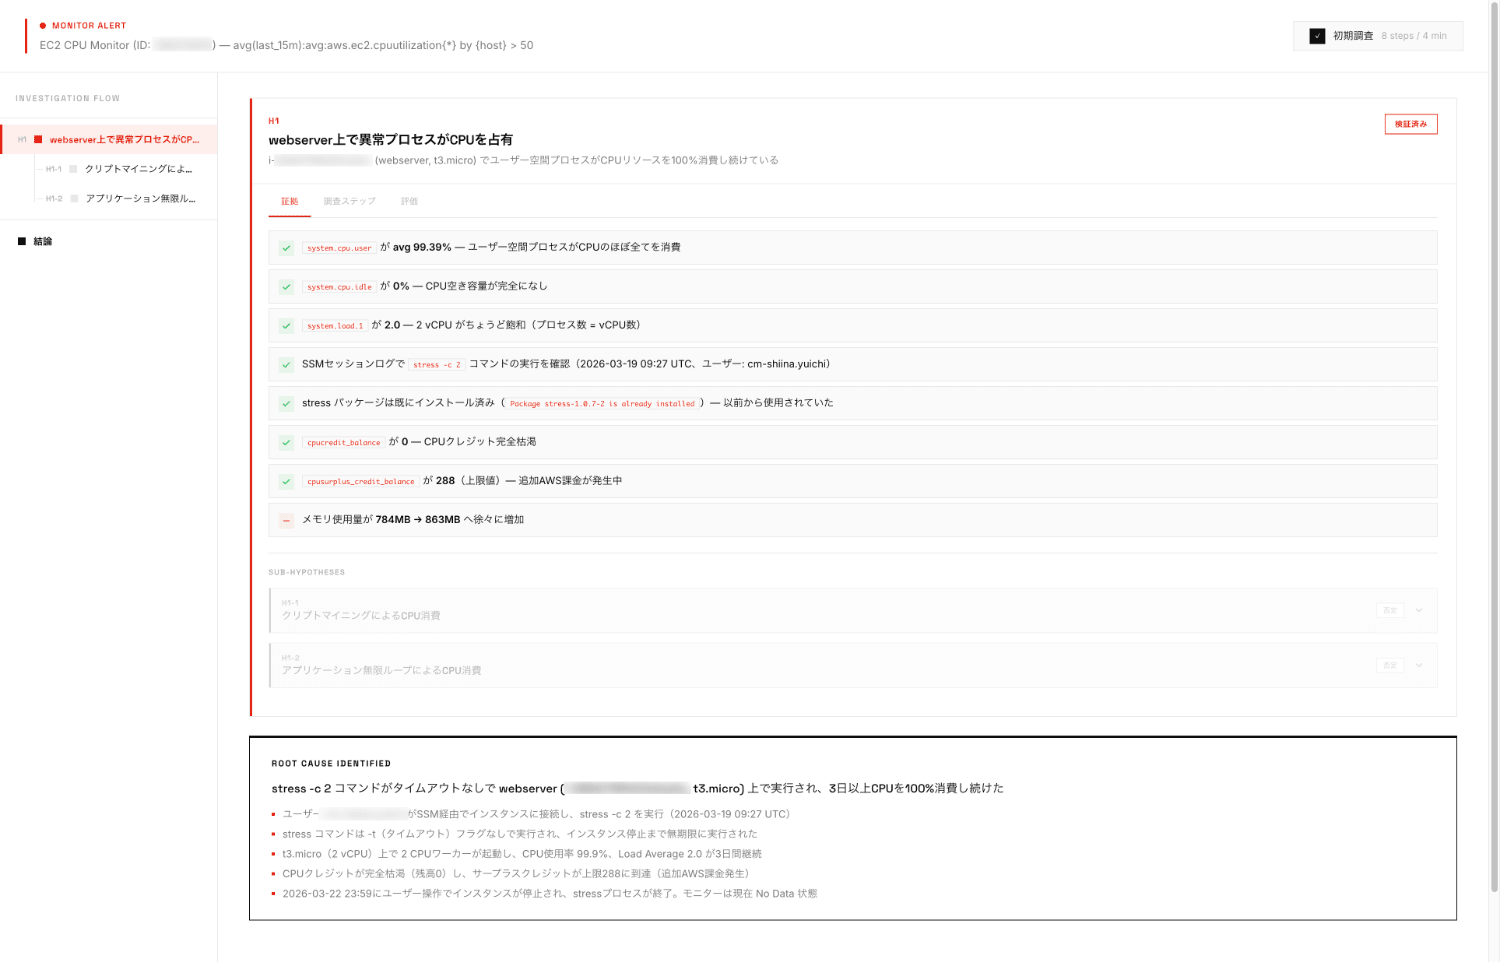
Output Results
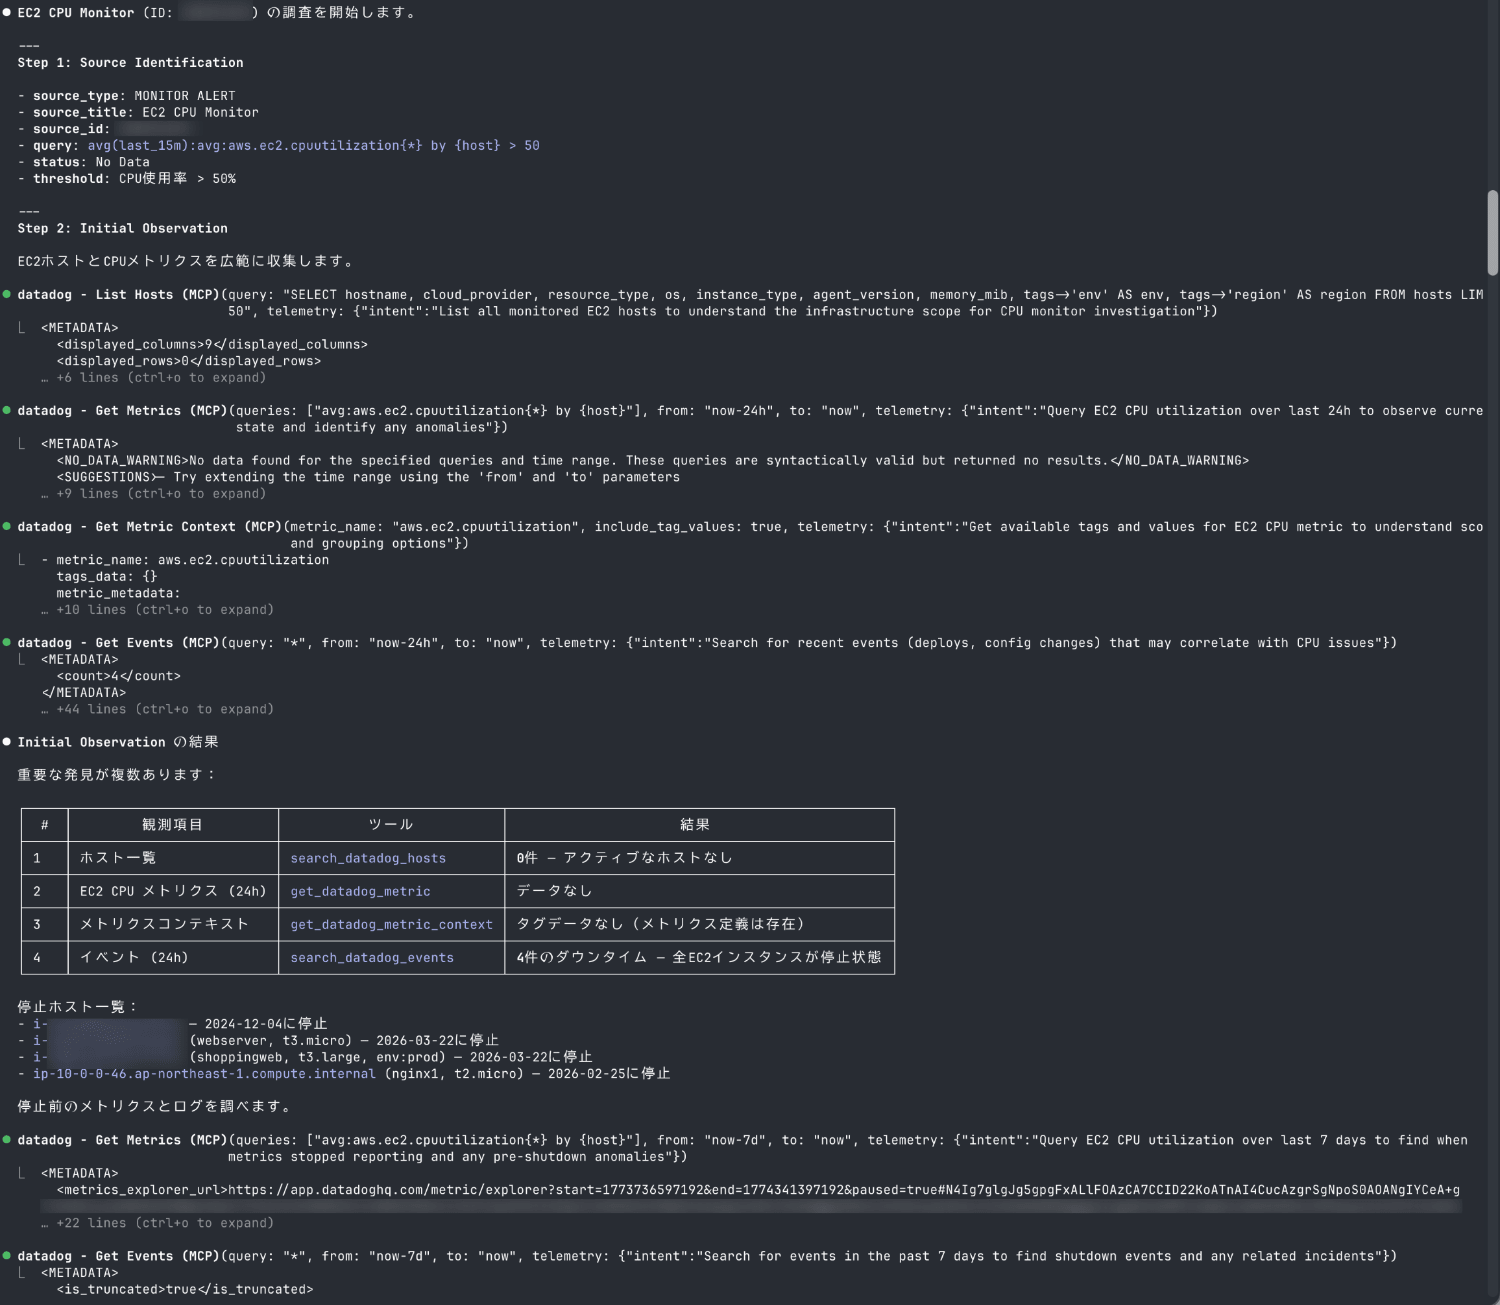
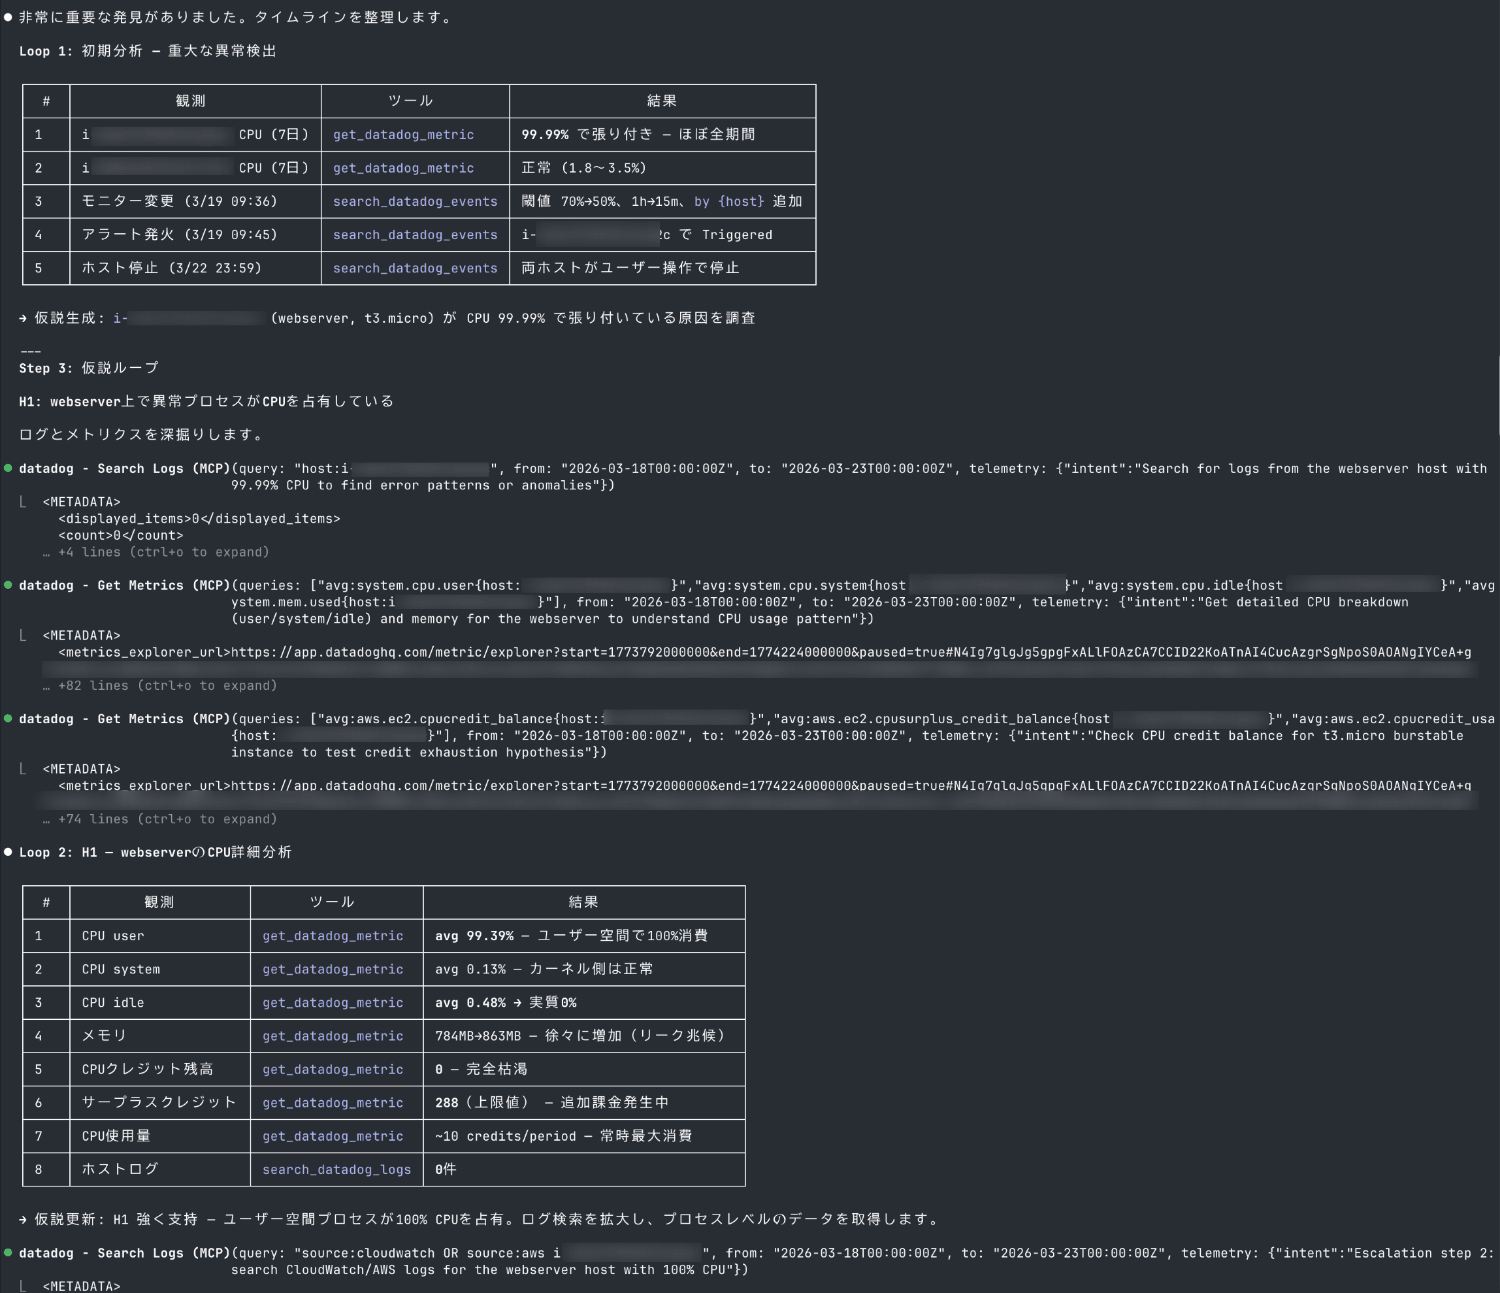
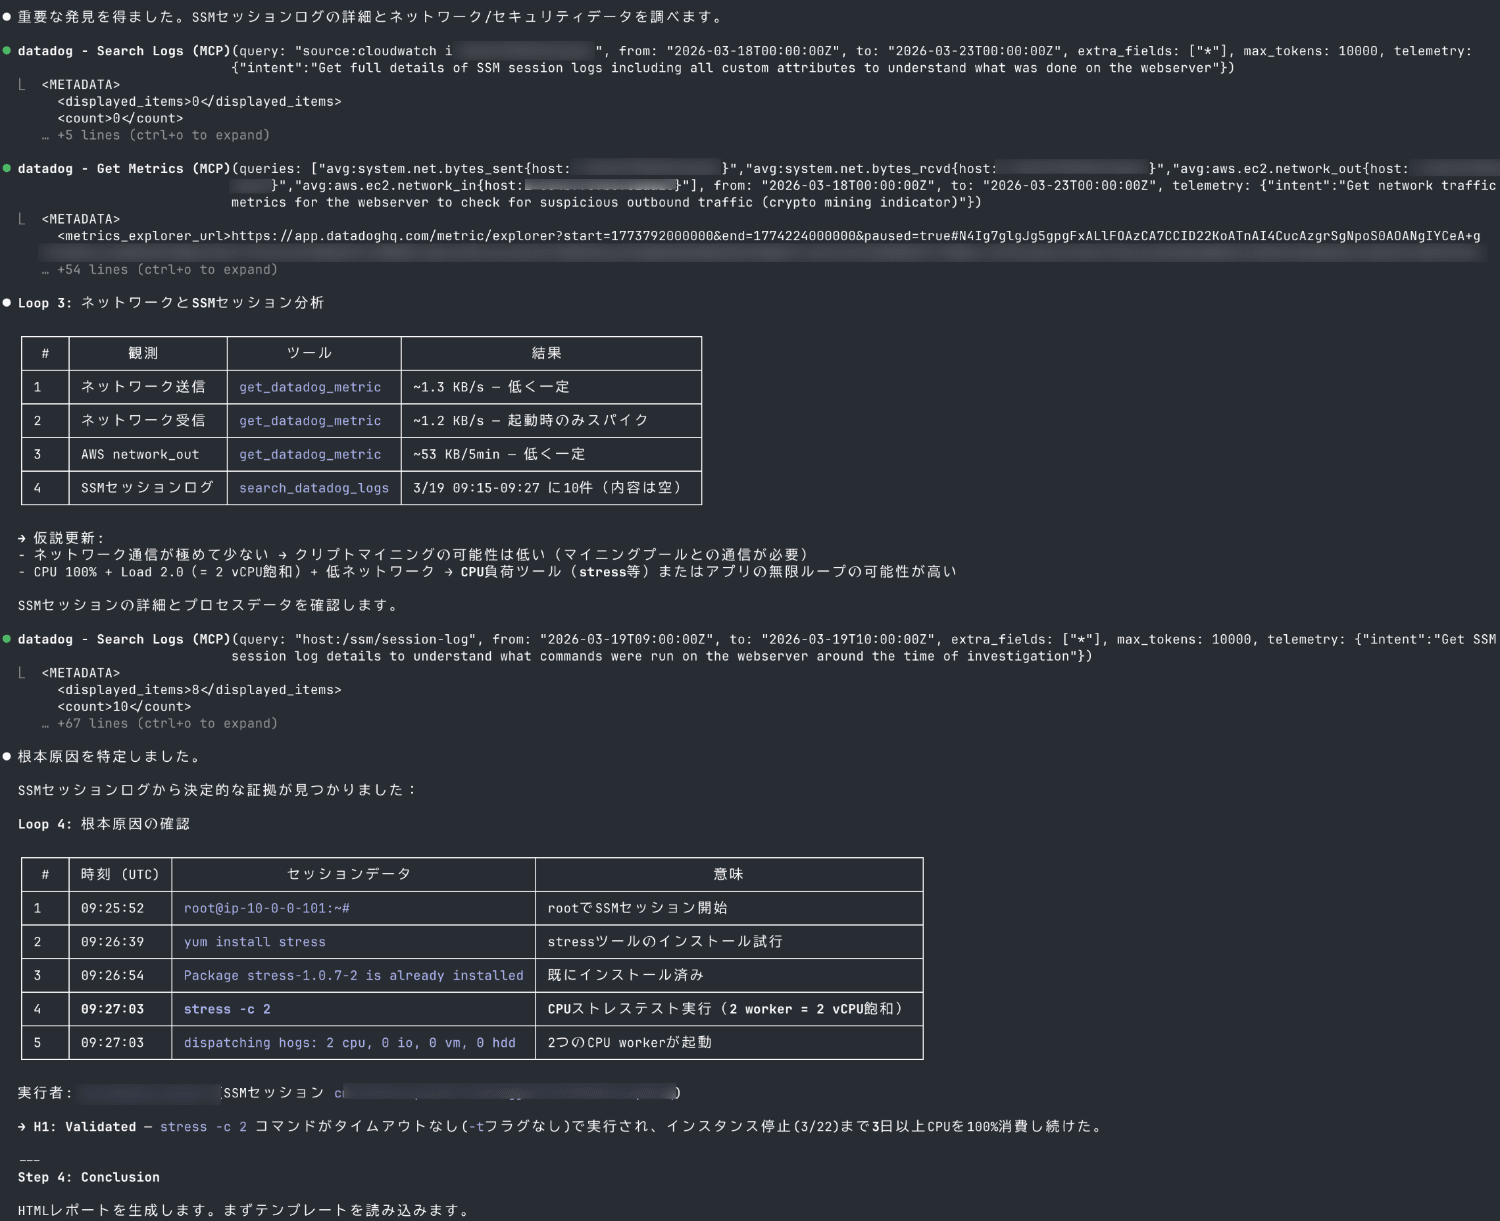
This also completed a full incident investigation using the Datadog MCP server.
Let's check the file output in HTML format.
Report
Evidence
Steps
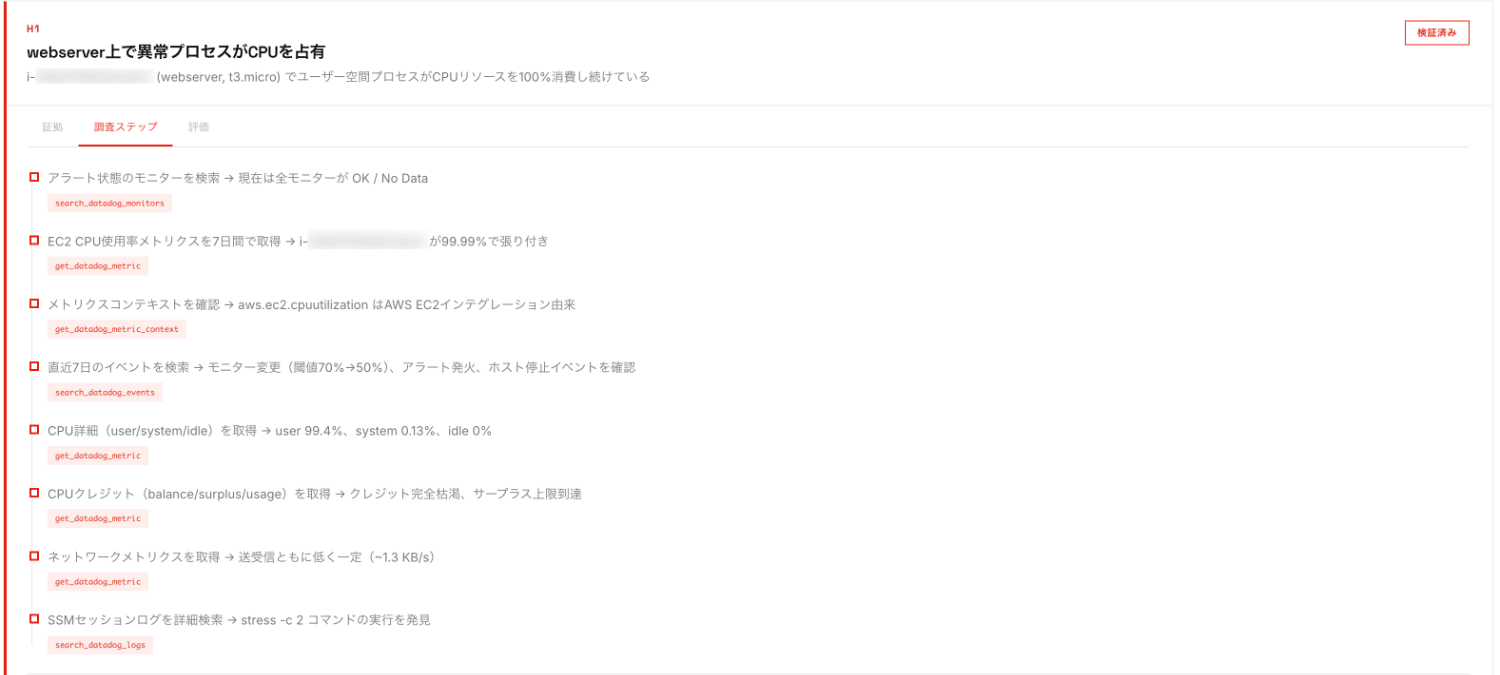
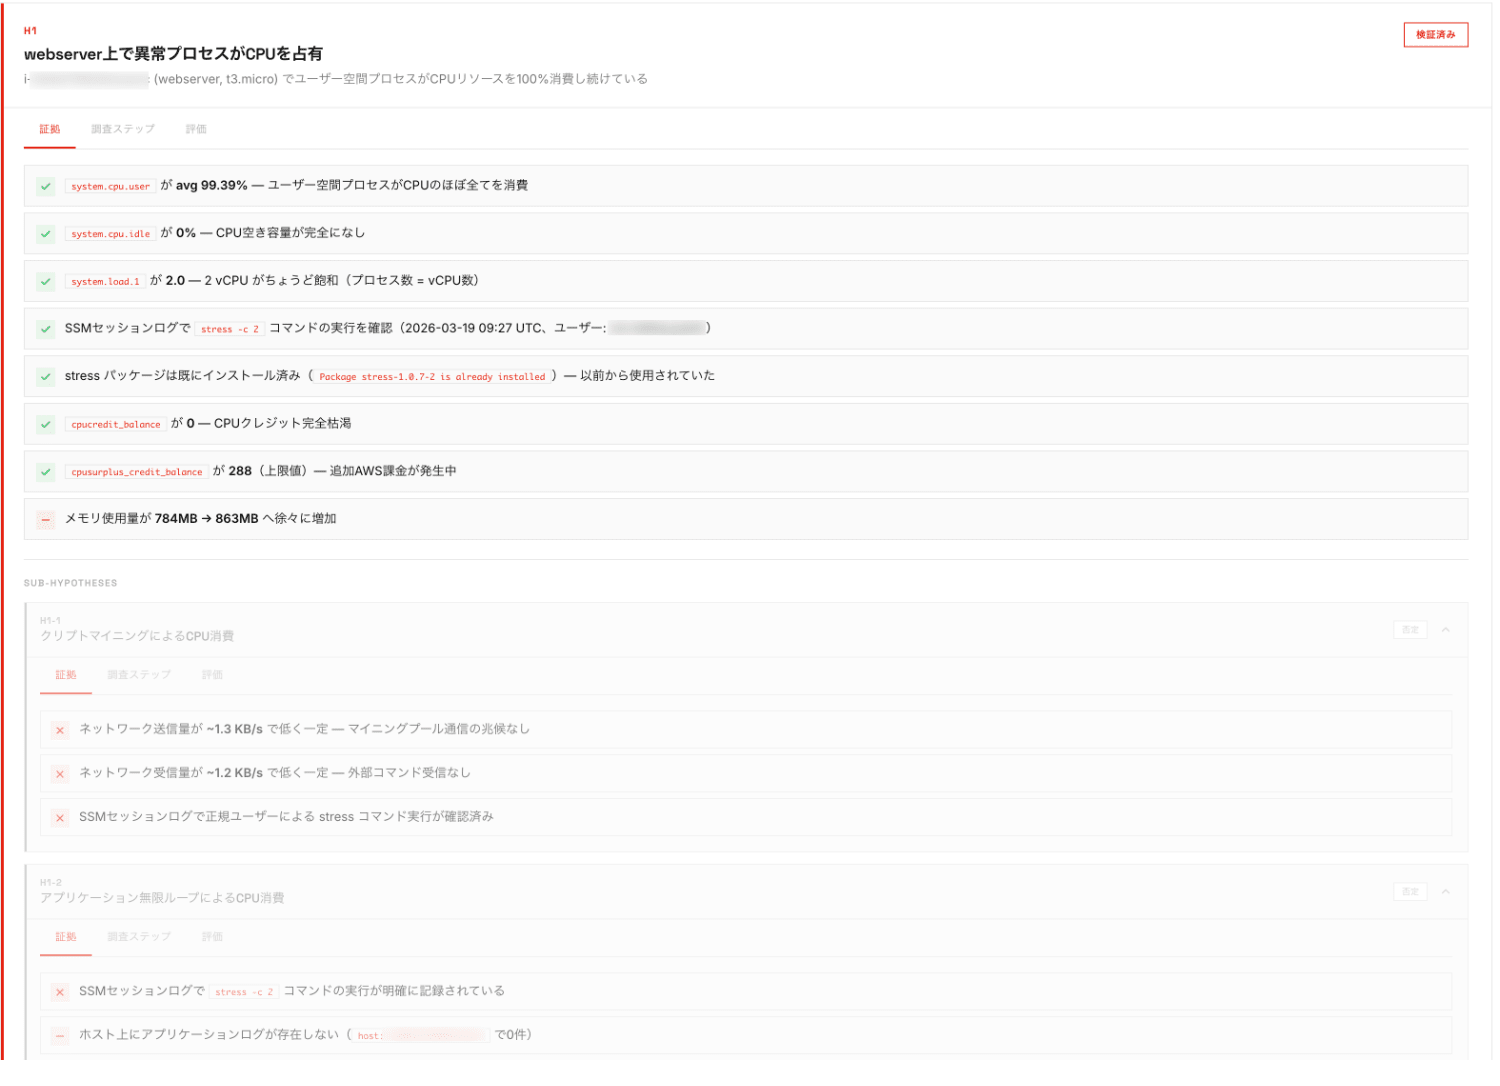
Evaluation
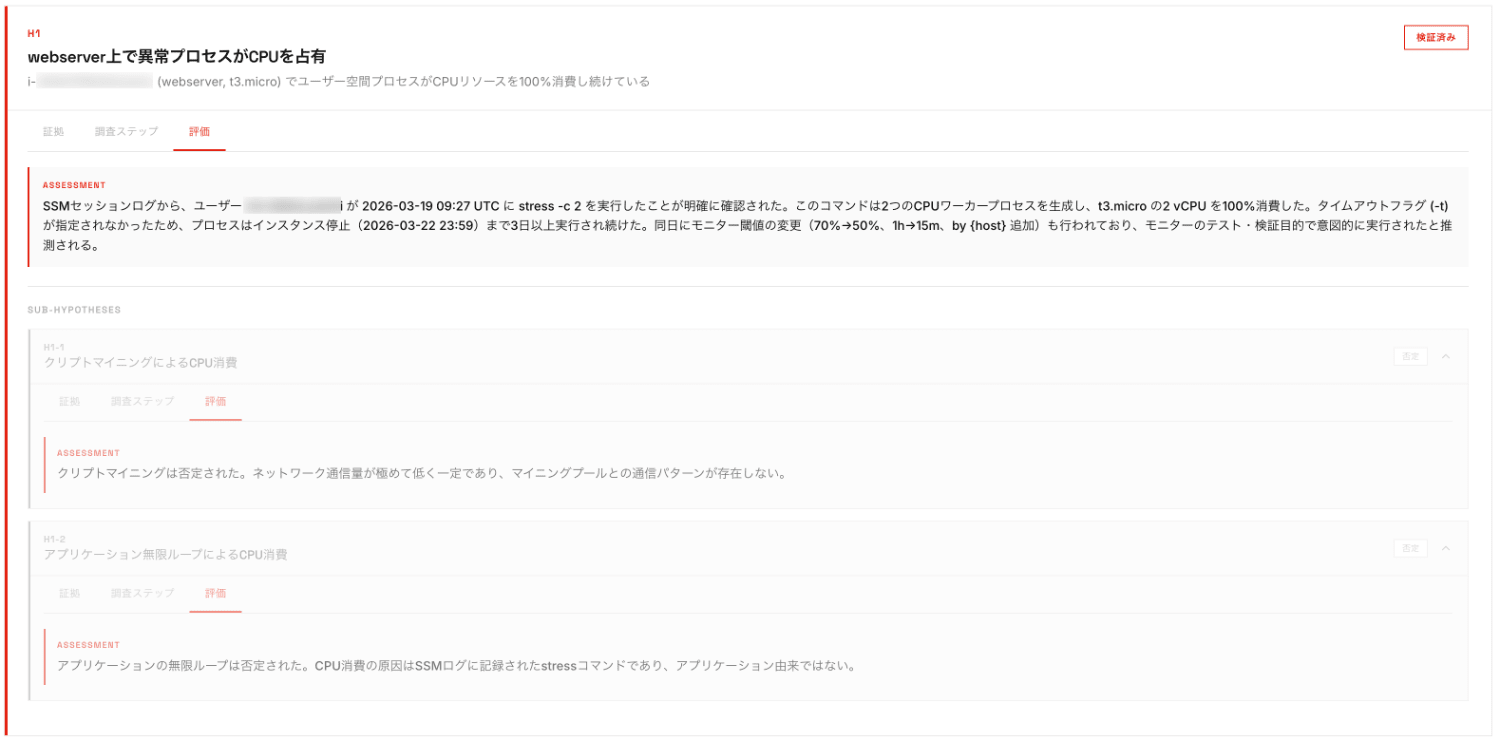
After examining metrics thoroughly, evidence was discovered from logs.
The evaluation also shows why certain hypotheses were rejected.
Conclusion
I created a skill that visualizes the thought process of incident investigations by combining Claude Code Skills and Datadog MCP server.
By cycling through the "observation → hypothesis formulation → verification" loop, it's possible to track what data the AI examined and how it made judgments, allowing humans to verify its validity.
Additionally, saving it as a report can be useful for sharing knowledge within the team and for post-incident reviews.
As the emergence of MCP servers increases instances of delegating incident investigations to AI, I believe visualizing and recording the investigation process will become increasingly important in the future.
I hope this article is helpful to you.