
I tried APM investigation and creating recommended monitors from CloudFormation on the official Datadog MCP server
This page has been translated by machine translation. View original
Hello. I'm Shiina from the Operations department.
Introduction
The long-awaited Datadog official MCP server Preview request has finally been approved.
Using the MCP server, AI agents like Claude Code can directly access Datadog observability data.
With just natural language instructions like "investigate recent error traces" or "create monitors suitable for this configuration," it can handle APM trace analysis, log investigation, and monitor creation.
In addition to setup procedures, I tried use cases of APM trace analysis, error investigation, and recommended monitor creation based on CloudFormation templates.
What is a Datadog MCP Server
The Datadog MCP server acts as a bridge connecting Datadog observability data with AI agents.
From MCP-compatible clients like Claude Code or Cursor, you can directly access Datadog's data and tools such as logs, traces, and monitors.
Main Disclaimers
When using the Preview, the following points should be noted:
- Use in production environments is not supported
- Only Datadog organizations on the allowlist can use it
- Checking compliance requirements for AI tools is the user's responsibility
- Datadog may collect information about MCP server usage
Toolsets
The Datadog MCP server supports a mechanism called toolsets.
By enabling only the necessary toolsets, you can reduce context window consumption.
Available toolsets are as follows:
| Toolset | Overview |
|---|---|
| core | Default set handling logs, metrics, traces, dashboards, monitors, incidents, hosts, services, events, and notebooks |
| alerting | Monitor validation, group search, and template retrieval |
| apm | APM trace analysis, span search, Watchdog insights, performance investigation |
| dbm | Integration with Database Monitoring |
| error-tracking | Error Tracking operations |
| feature-flags | Feature flag creation, listing, updating, and management |
| llmobs | LLM Observability span search and analysis |
| product-analytics | Product analytics query operations |
| networks | Cloud Network Monitoring and Network Device Monitoring analysis |
| onboarding | Guided setup and configuration of Datadog |
| security | Code security scanning, security signal and detection result searches |
| software-delivery | Integration with Software Delivery such as CI Visibility and Test Optimization |
| synthetics | Synthetic test operations |
Usage Method
When using with Claude Code, configure the MCP server in ~/.claude.json.
Toolsets are specified as query parameters for the endpoint URL.
- When using the core tool (default)
{
  "mcpServers": {
    "datadog": {
      "type": "http",
      "url": "https://mcp.datadoghq.com/api/unstable/mcp-server/mcp"
    }
  }
}
- When using core, apm, and alerting tools
{
  "mcpServers": {
    "datadog": {
      "type": "http",
      "url": "https://mcp.datadoghq.com/api/unstable/mcp-server/mcp?toolsets=core,apm,alerting"
    }
  }
}
Authentication Settings
OAuth 2.0 can be used for MCP server authentication.
Since browser authentication is possible, there is no need to define API and APP keys.
This provides peace of mind as authentication information doesn't need to be stored in the local environment.
Permission Scopes
The scopes granted by OAuth 2.0 authentication are mainly read-only.
You can read a wide range of data including APM, logs, metrics, dashboards, and monitors.
On the other hand, to perform update operations such as creating monitors or editing dashboards, you need to use the Datadog API with API and APP keys.
Setup
Let's use the US1 site endpoint and enable toolsets (core, apm, alerting).
1. MCP Server Configuration
- Add configuration using the
mcp addcommand.
claude mcp add -s user --transport http datadog "https://mcp.datadoghq.com/api/unstable/mcp-server/mcp?toolsets=core,apm,alerting"
The file has been modified.
Added HTTP MCP server datadog with URL: https://mcp.datadoghq.com/api/unstable/mcp-server/mcp?toolsets=core,apm,alerting to user config
File modified: /Users/shiina.yuichi/.claude.json
Checking ~/.claude.json, the configuration has been added.
  "mcpServers": {
    "datadog": {
      "type": "http",
      "url": "https://mcp.datadoghq.com/api/unstable/mcp-server/mcp?toolsets=core,apm,alerting"
    },
- Check the MCP list.
claude mcp list
If datadog settings are added to the list, setup is complete.
Checking MCP server health...

claude.ai Slack: https://mcp.slack.com/mcp - ✓ Connected
claude.ai Gmail: https://gmail.mcp.claude.com/mcp - ! Needs authentication
claude.ai Google Calendar: https://gcal.mcp.claude.com/mcp - ✓ Connected
awslabs.aws-documentation-mcp-server: uvx awslabs.aws-documentation-mcp-server@latest - ✓ Connected
awslabs.aws-iac-mcp-server: uvx awslabs.aws-iac-mcp-server@latest - ✓ Connected
datadog: https://mcp.datadoghq.com/api/unstable/mcp-server/mcp?toolsets=core,apm,alerting (HTTP) - ! Needs authentication
2. MCP Server Authentication
- Launch Claude Code.
claude
- Check with the
/mcpcommand.
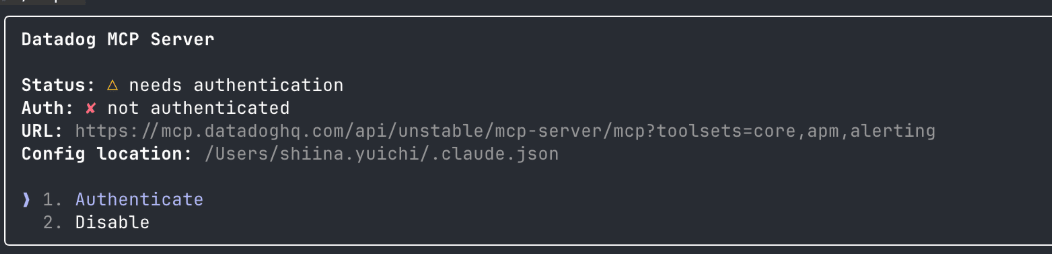
Before authentication, "needs authentication" is displayed.
    User MCPs (/Users/shiina.yuichi/.claude.json)
  ❯ awslabs.aws-documentation-mcp-server · ✔ connected
    awslabs.aws-iac-mcp-server · ✔ connected
    datadog · △ needs authentication
    pencil · ✔ connected

    claude.ai
    claude.ai Gmail · △ needs authentication
    claude.ai Google Calendar · ✔ connected
    claude.ai Slack · ✔ connected
-
Move the cursor to datadog and press Enter.
-
Select "1. Authenticate" from the details.
-
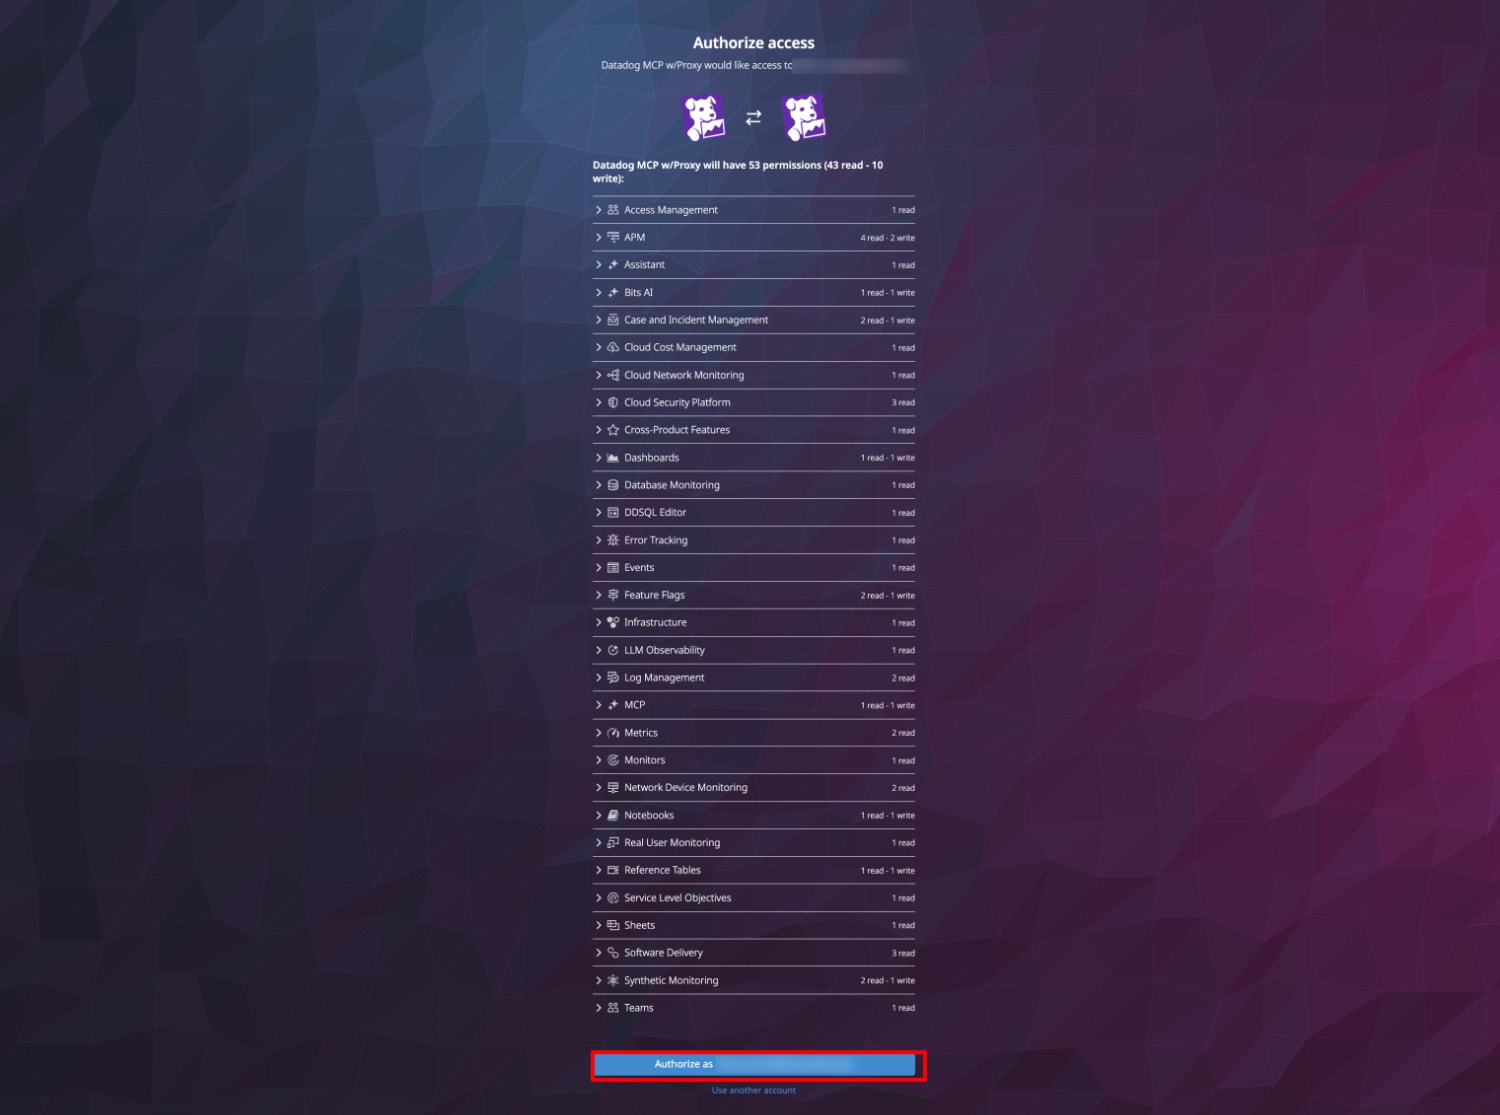
Select "Allow" in the Authorize access screen in the browser.
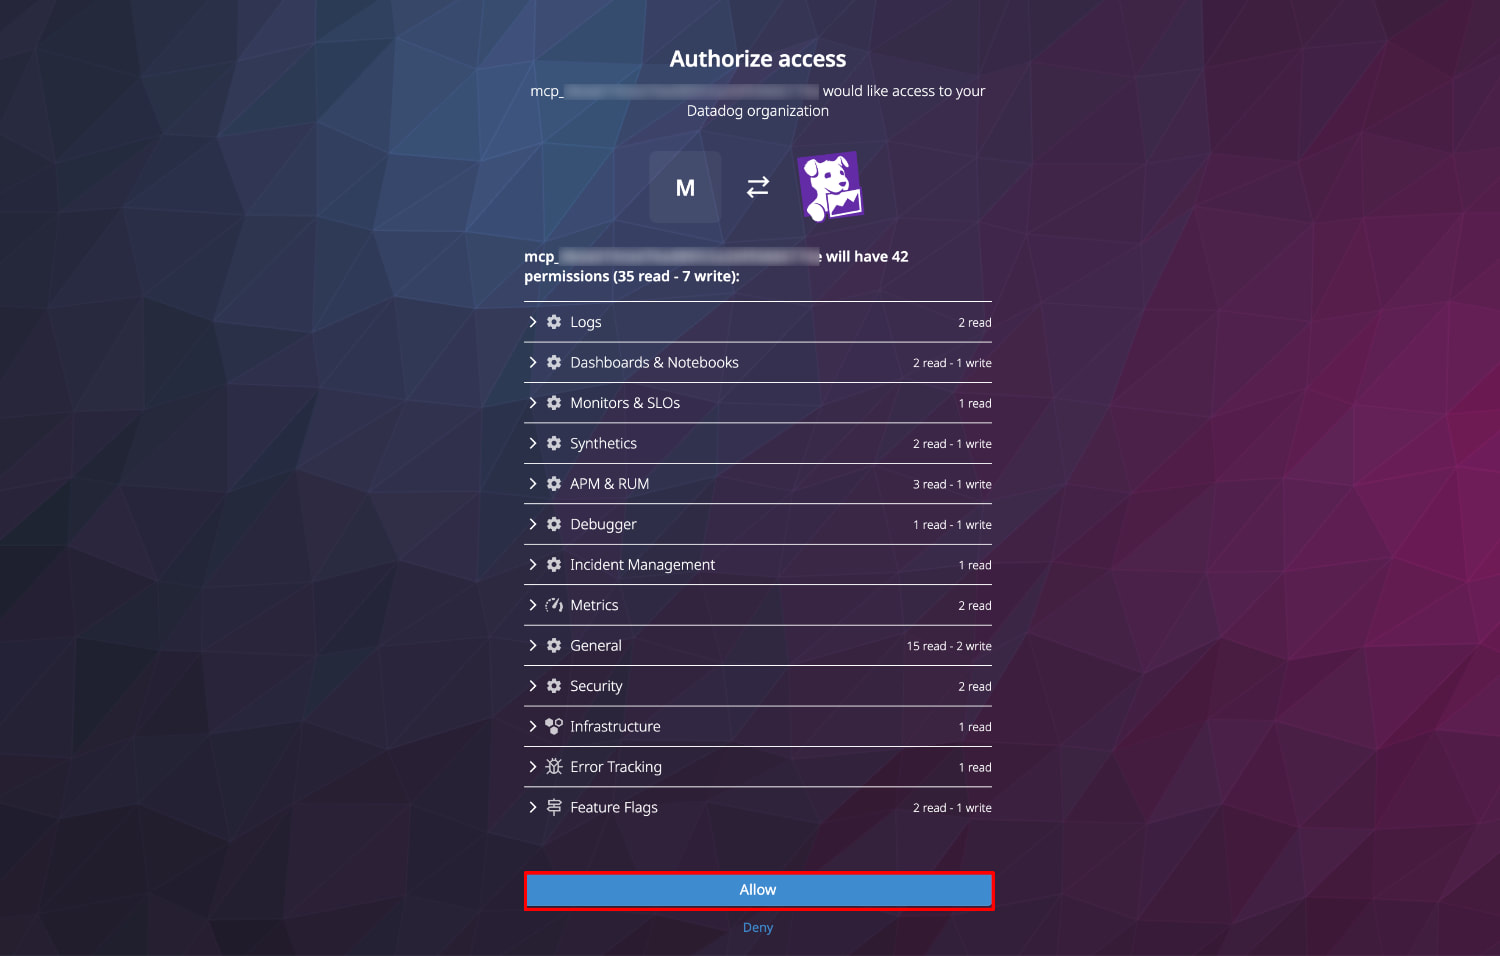
-
Select your Datadog organization.

-
Check the access permissions and authorize.
-
If successful, "Authentication Successful!" will be displayed.

-
On the Claude side, "Authentication successful. Connected to datadog." is displayed.
-
Check the status again with the
/mcpcommand.
Authentication is complete if the datadog status is "connected".
   User MCPs (/Users/shiina.yuichi/.claude.json)
  ❯ awslabs.aws-documentation-mcp-server · ✔ connected
    awslabs.aws-iac-mcp-server · ✔ connected
    datadog · ✔ connected
    pencil · ✔ connected

    claude.ai
    claude.ai Gmail · △ needs authentication
    claude.ai Google Calendar · ✔ connected
    claude.ai Slack · ✔ connected
3. Check Available Tools
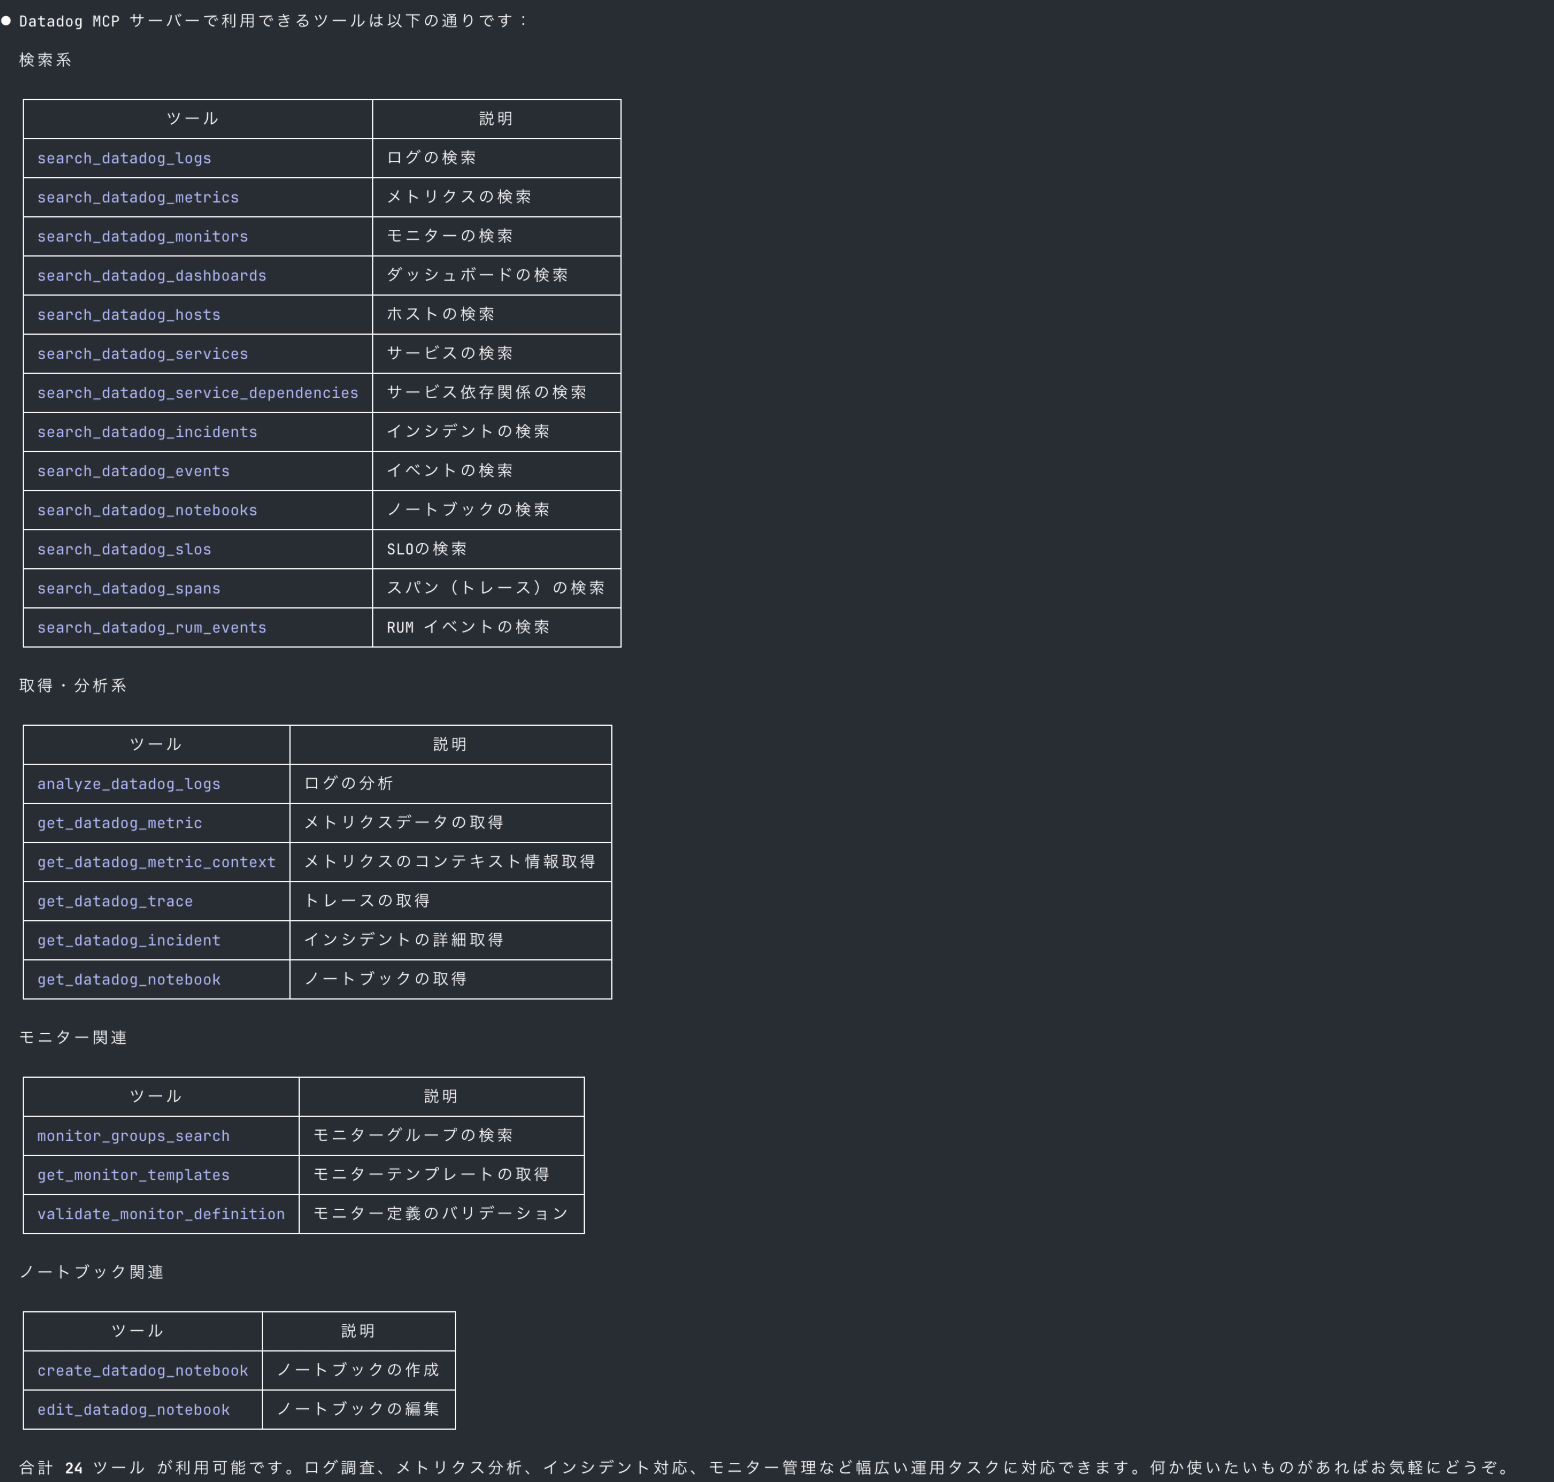
Let's check what tools are available with the Datadog MCP server.
What tools can I use with Datadog MCP?
Upon checking, 24 tools are available.
They cover a wide range of daily operational tasks such as log searching, trace analysis, and monitor operations.
Verification Scenarios
Using Claude Code (Opus 4.6 model), I verified the following two scenarios:
-
APM Investigation of a Shopping Web Application
- Trace analysis, identification of error spans and latency spans, suggestion of recommended actions
-
Creating Monitoring for a Serverless Application
- Automatic creation of recommended monitors based on an IaC template defining DynamoDB, API Gateway, and Lambda
APM Investigation of a Shopping Web Application
I'll analyze APM traces, investigate errors, and identify the causes of delays via the MCP server for a shopping site with intentionally added delay logic and random errors.
Trace Analysis
We've received reports of response delays for the "shopping-site" website.
Please analyze recent APM traces.
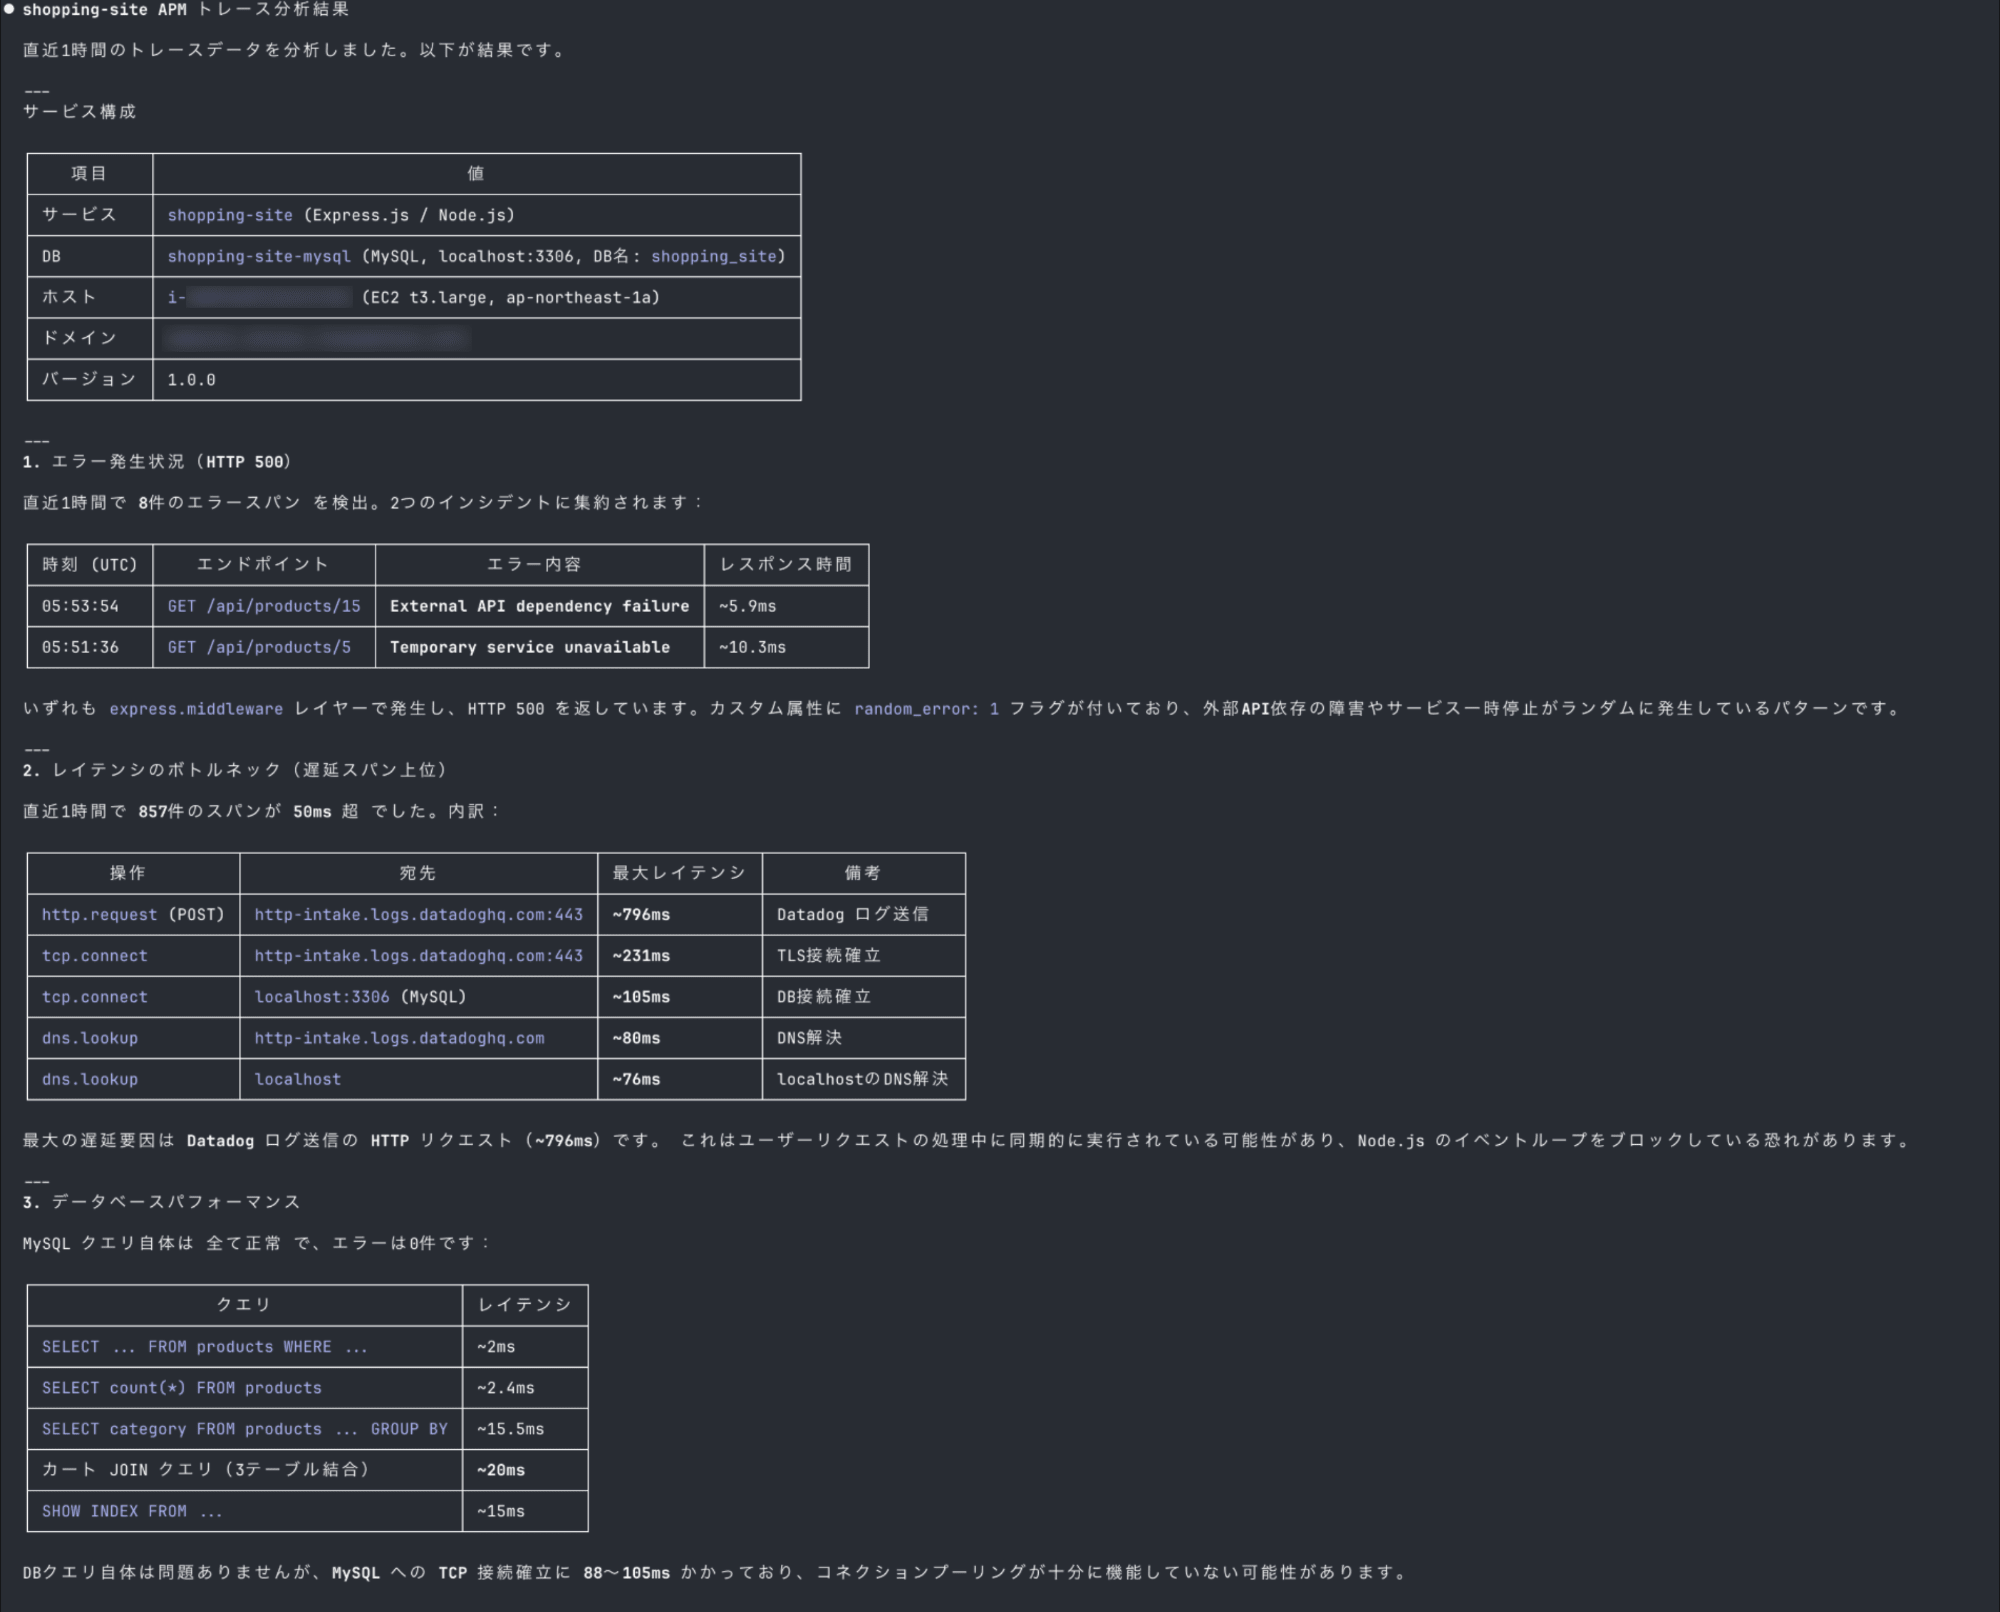
With just natural language instructions, it automatically performed service configuration understanding, span searching, and analysis.
It detected 8 error spans and identified the top bottlenecks among the latency spans.
Error Span Investigation
It seems that errors occur when adding items to the cart despite items being in stock.
Please identify the cause from spans and logs
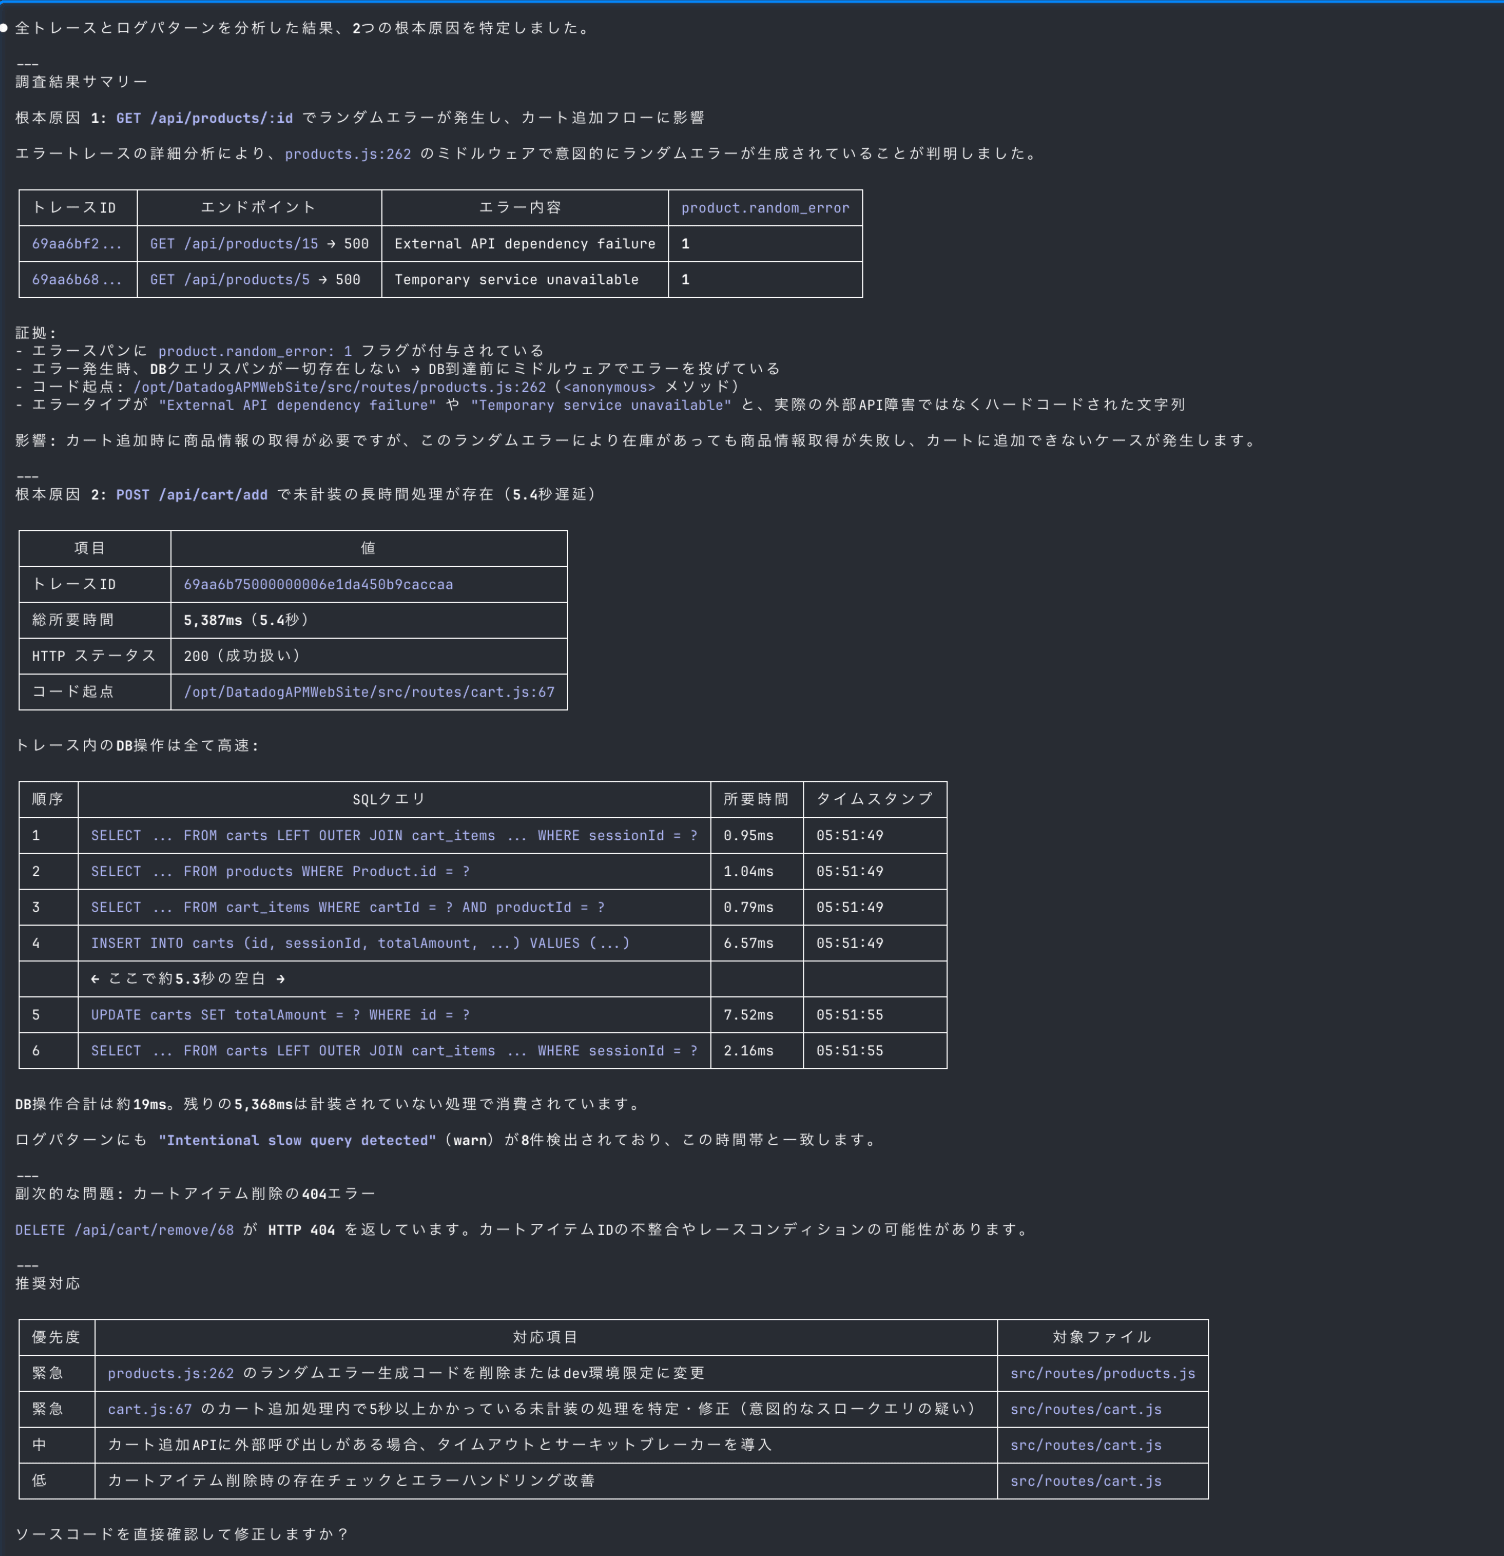
It continued the investigation and identified two root causes:
- Due to random error generation logic, product retrieval fails before reaching the DB, causing cart addition errors
- In POST
/api/cart/add, DB operations take about 19ms in total, but there's a 5.3-second gap in uninstrumented processing causing delays
These are both intentional issues I added to the app, but it identified the root causes from span attributes and trace timelines.
Latency Span Investigation
Some GET /api/products are taking over 1 second.
Please identify the root cause
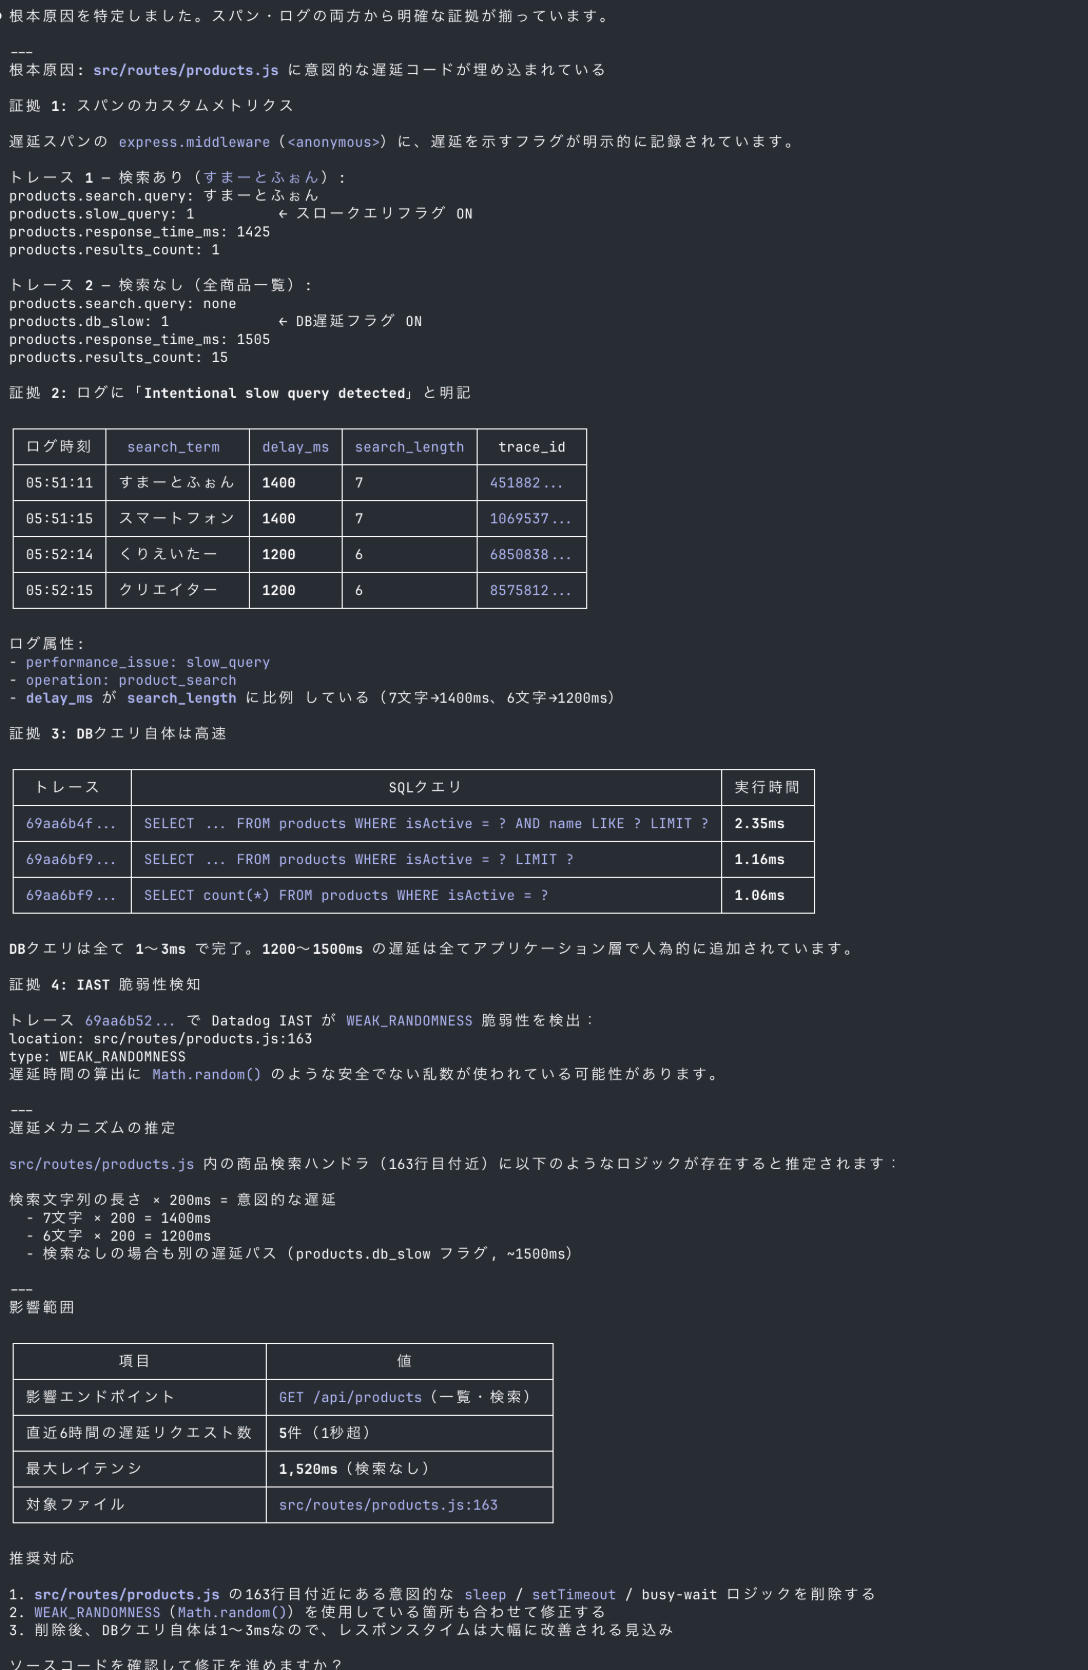
By comparing the facts of DB query processing times, it detected that delays were intentionally added in the application layer.
Furthermore, from the correlation between delay_ms and search_length in the logs, it even estimated the delay logic as "search string length × 200ms".
Suggesting Recommendations
Do you have any suggestions for optimizing this application?
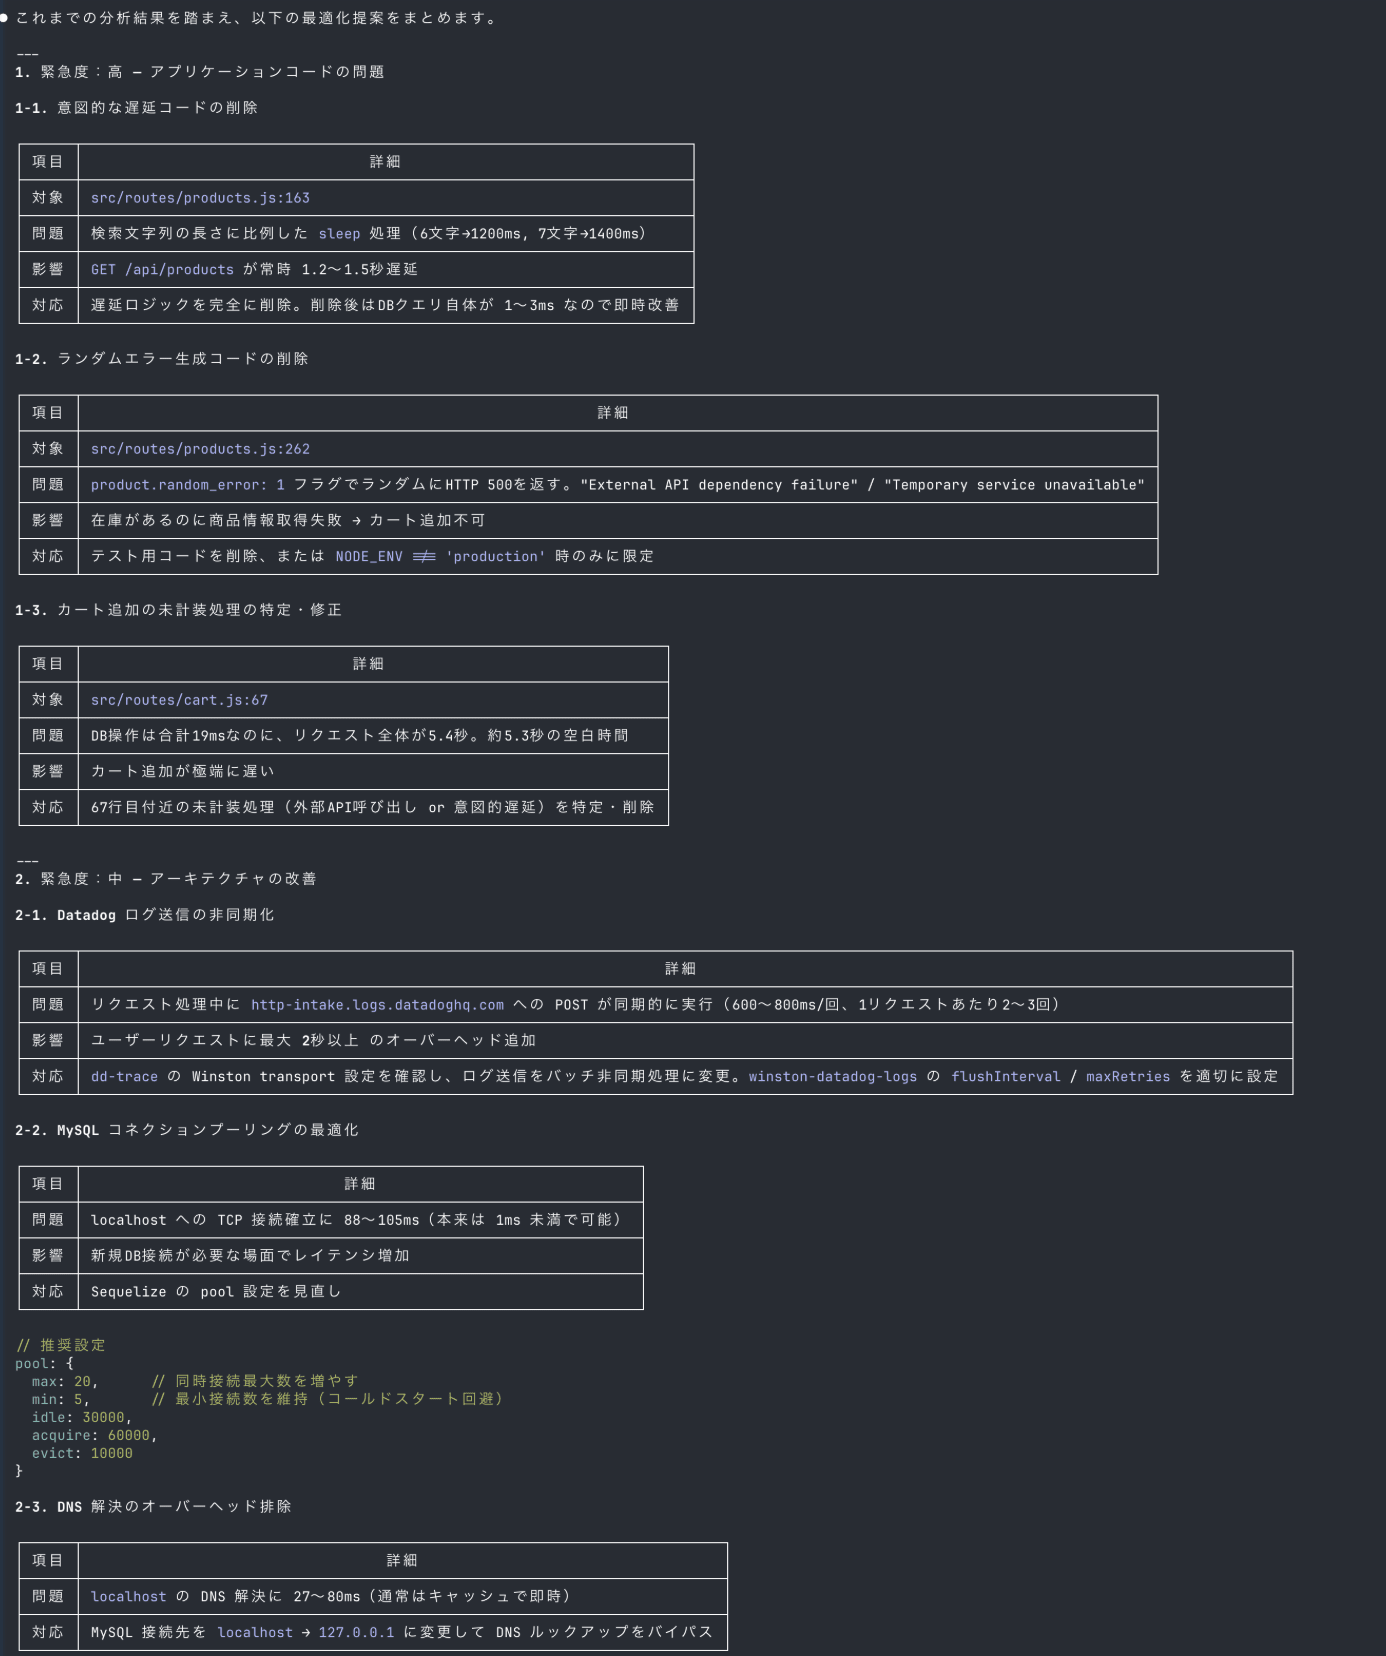
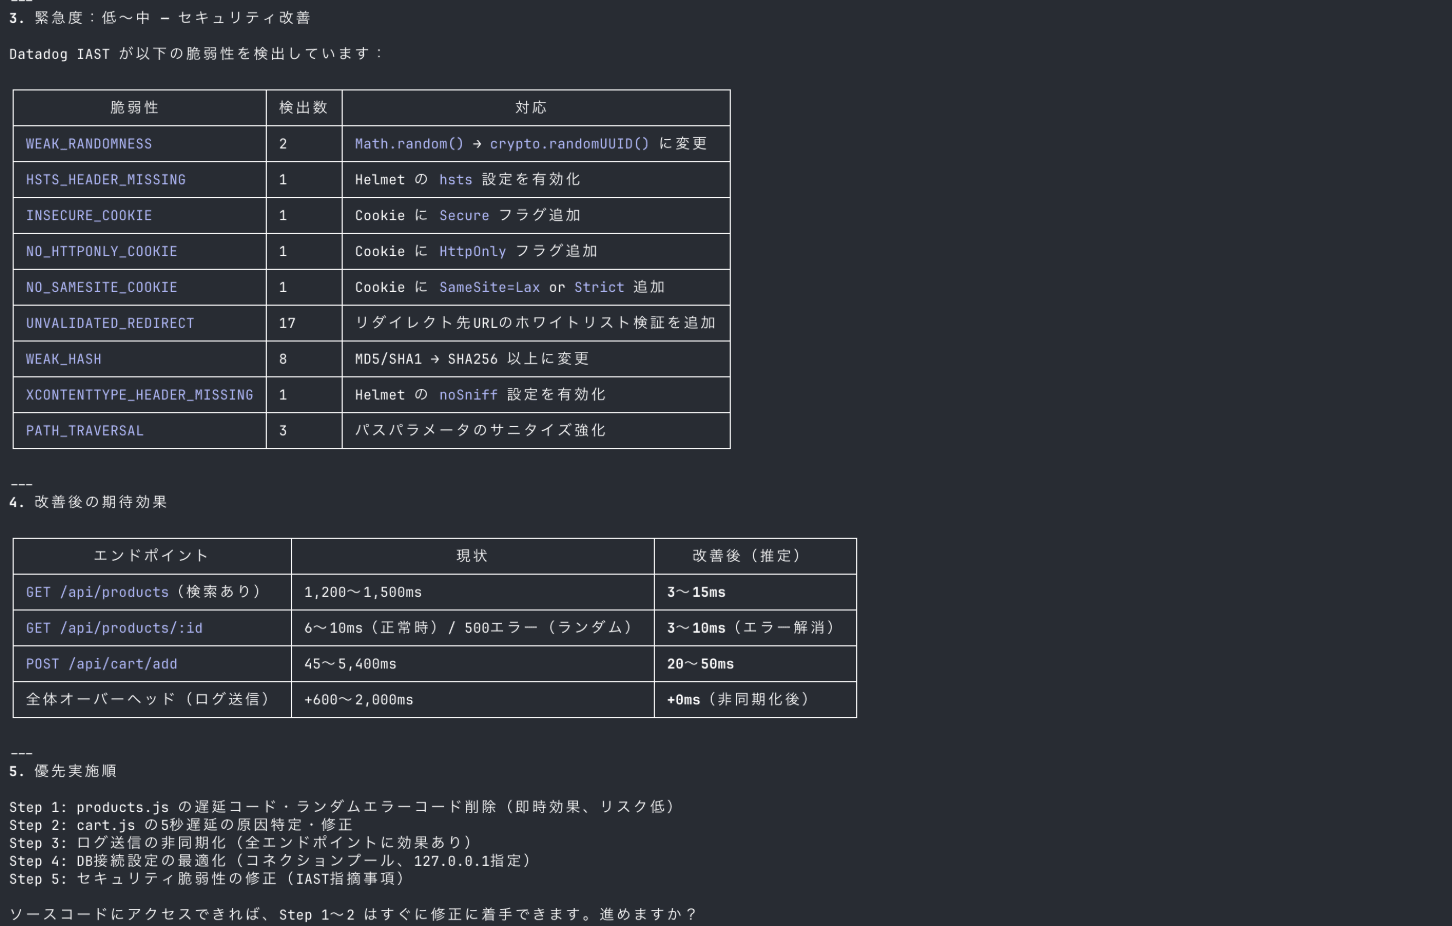
Based on the analysis results, it output optimization suggestions organized by urgency.
It covers application code issues (removing delay logic and random errors) and architectural improvements (asynchronous log sending and connection pooling optimization).
It also presents a comparison of expected latency for each endpoint after improvement, making it easy to determine response priorities.
Creating Monitoring Monitors for a Serverless Application
I'll design, create, and check the status of recommended monitors for infrastructure resources defined in a CloudFormation template.
Since Datadog's query syntax and metric names have unique specifications, there's a risk of hallucinations in AI-generated definitions.
I'll use the validate_monitor_definition tool for validation before creating the monitors.
Monitor Design
Please create Datadog monitoring monitors for the infrastructure resources defined in template.yaml in the directory.

- Analyze template.yaml: Read the file and identify the defined infrastructure resources (AWS Lambda, DynamoDB, API Gateway, SQS, SNS, etc.).
- Identify recommended monitoring items for each resource: Based on Datadog best practices, select appropriate monitoring monitors (error rates, latency, throttling, queue depth, etc.) for each resource type.
- Verify query syntax and metric names: Before creating monitor definitions, verify that the query syntax and metric names used in Datadog are correct.
- Create monitor definitions: Create Datadog monitors using validated queries.
- Alert notification destination: example@example.com
- Notification template: Please follow best practices.

It identified 8 Lambda functions, 3 DynamoDB tables, and API Gateway from template.yaml, and generated 7 monitor definitions.
The process flow first checks existing metric names in the environment using the List Metrics tool, then validates each monitor definition with validate_monitor_definition.
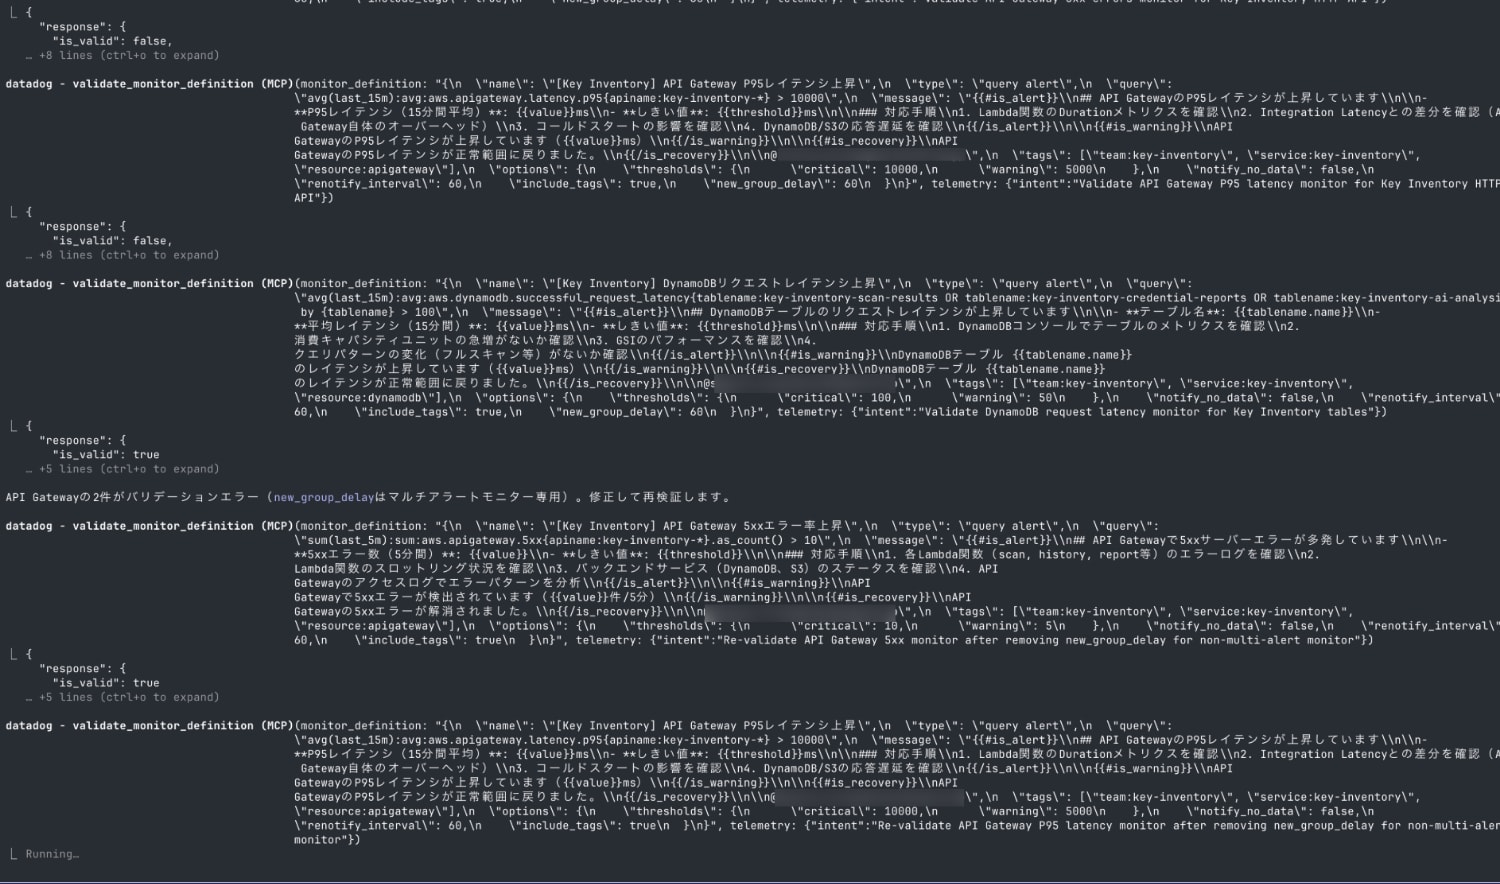
Validation errors for new_group_delay occurred in 2 API Gateway monitors, but it automatically fixed the options and passed the re-validation.
For the Lambda Duration monitor, it read timeout values defined in template.yaml (900 seconds for scan/ai-analysis, 30 seconds for API series) and set 80-83% of those values as thresholds.
The notification templates include response procedures for Alert / Warning / Recovery states, and are of quality that can be used directly in production.
Creating Monitors
Since monitors cannot be created via the MCP server, we'll use the Datadog API.
API and APP keys need to be set as environment variables, so exit Claude Code once and set them from the shell.
export DD_API_KEY=""
export DD_APP_KEY=""
export DD_SITE=datadoghq.com
Resume with the claude --resume command.

Although a JSON parsing error occurred during the first curl execution, it performed response checking, test monitor creation, and deletion.
While switching to batch creation with a Python script, it created all 7 monitors.
Checking Monitors
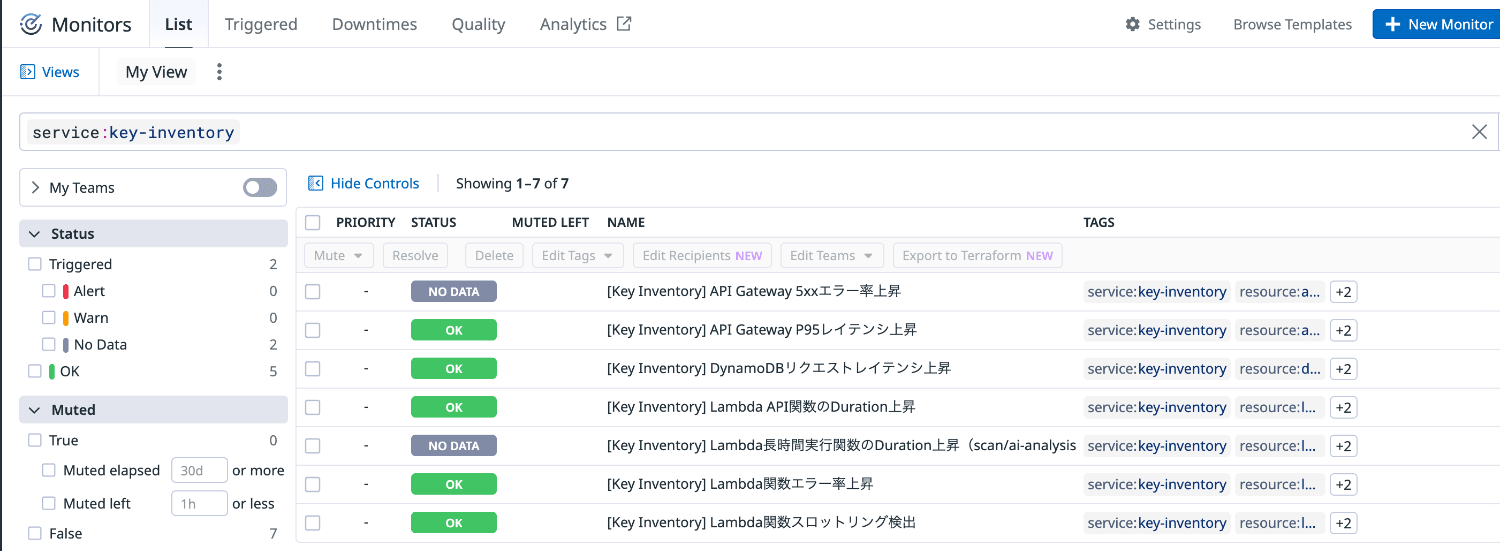
Please tell me the current status of the created monitors in detail
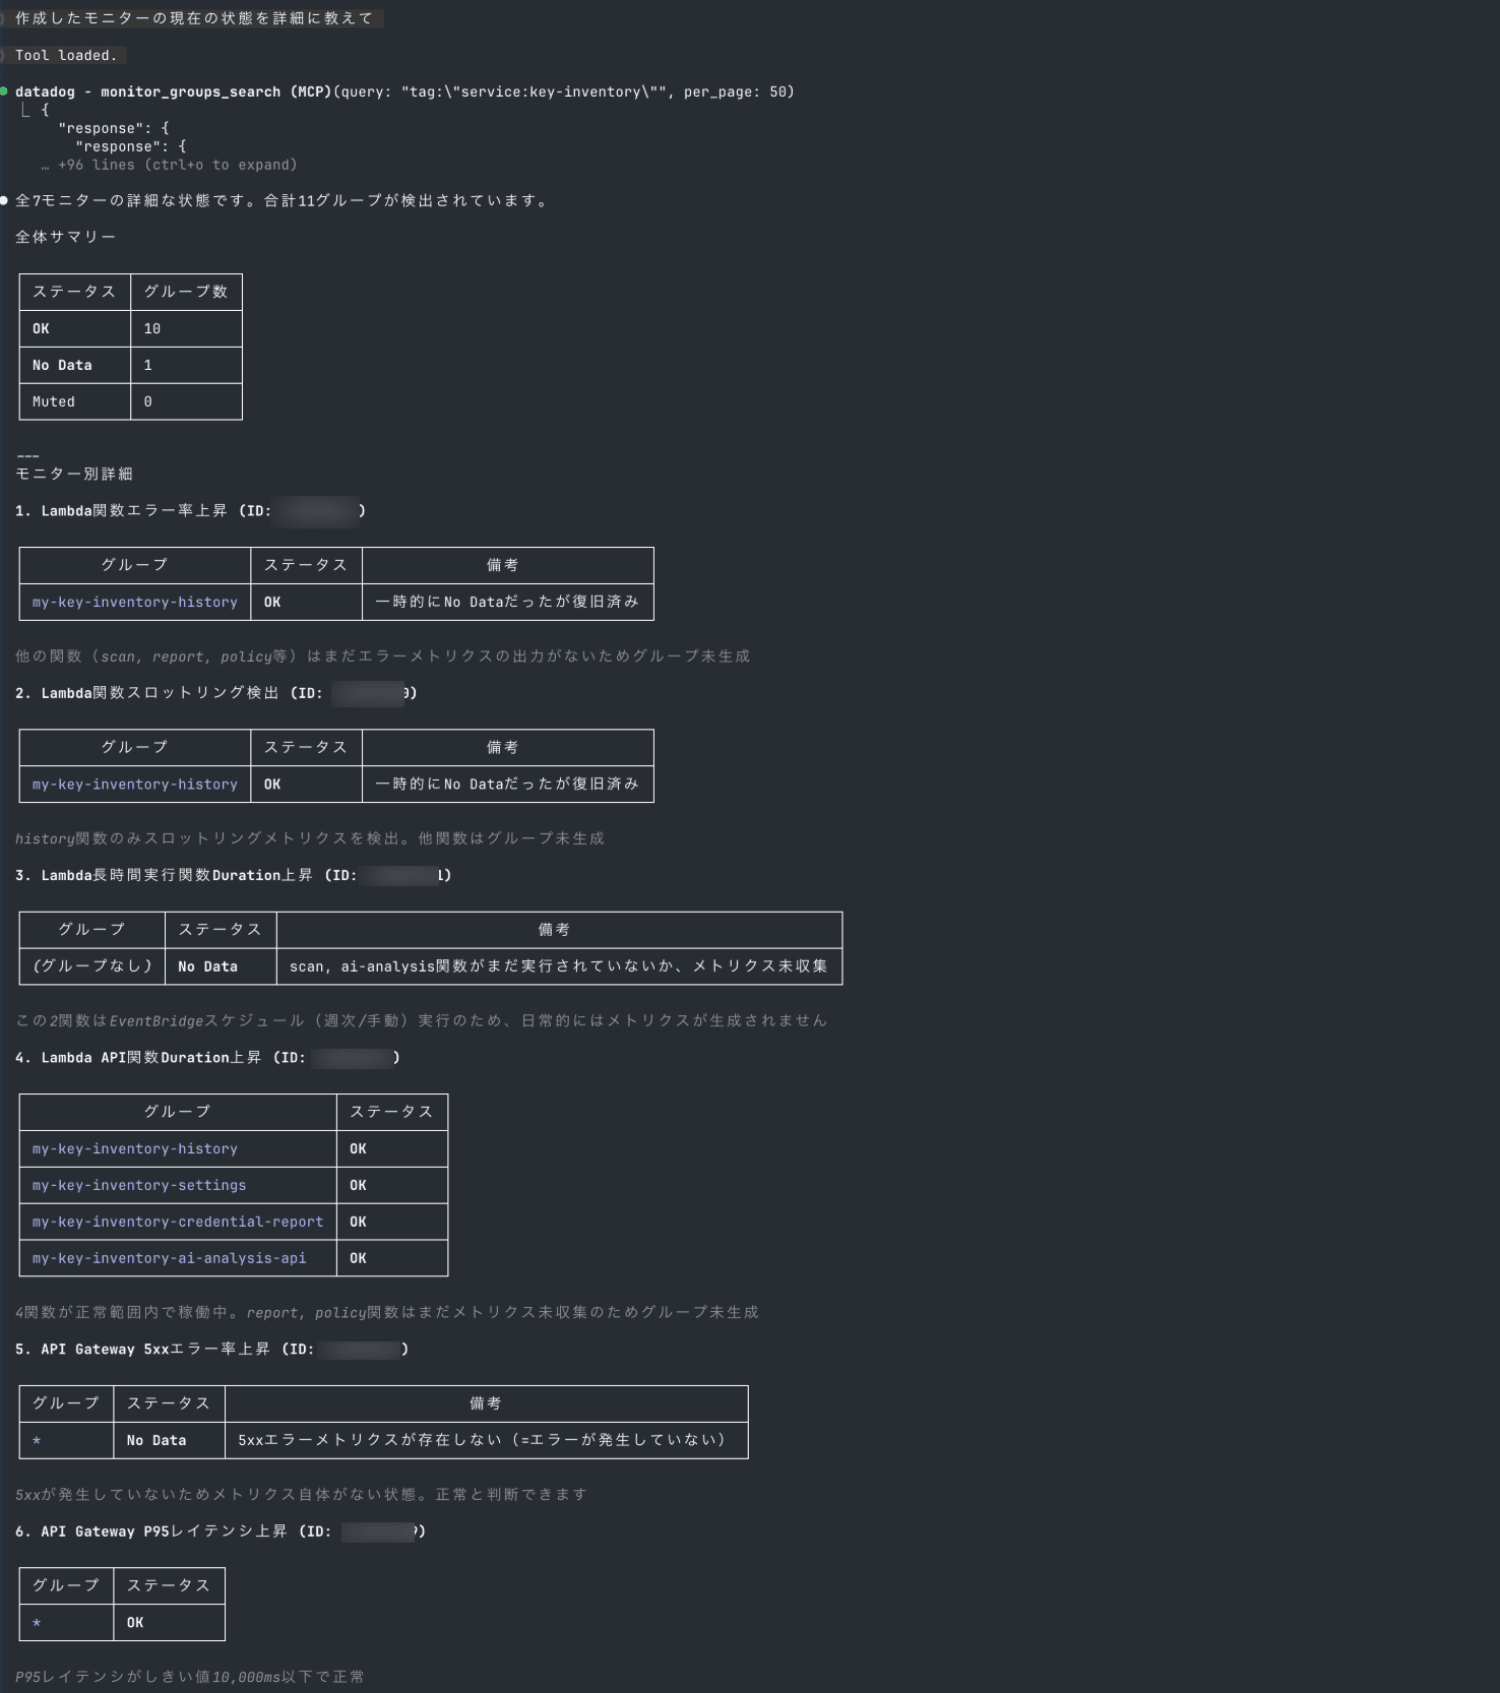
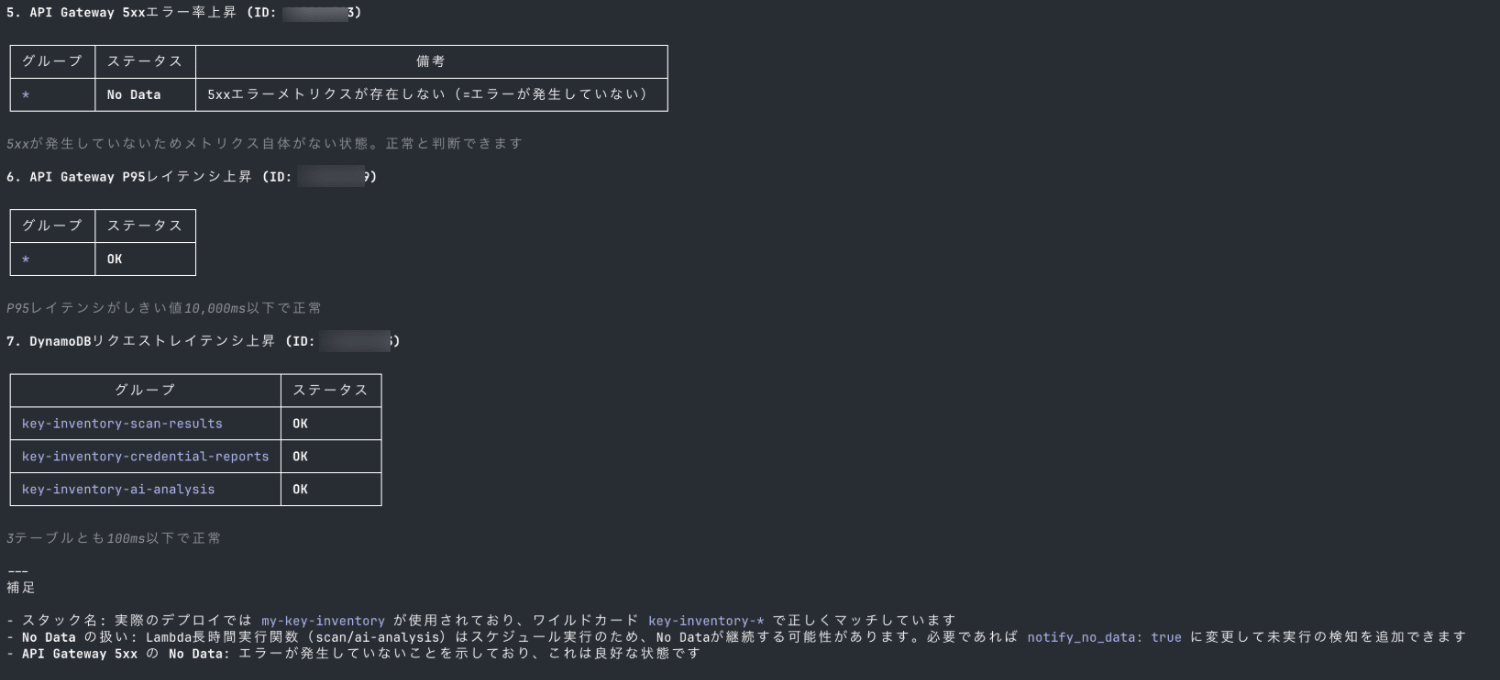
It searched for created monitors using the service:key-inventory tag and retrieved the status of all 7 monitors and 11 groups.
The result shows 10 groups are OK and 1 group is No Data.
Right after creating monitors, seeing "No Data" can make you worry "Is it monitoring properly?"
It's helpful that it explains the reasons for No Data for each monitor.
I confirmed that the monitors are functioning as intended.
Summary
I tried combining the official Datadog MCP server with Claude Code for APM investigation and monitor creation scenarios.
For APM investigation, it completed everything from span analysis to bottleneck identification and root cause estimation with just natural language instructions.
I felt an improvement in efficiency compared to conventional investigations that require navigating multiple screens in the console.
For monitor creation, it read resources from the CloudFormation template and generated monitor definitions following best practices.
Since Datadog's query syntax has unique specifications, it's important to use the validate_monitor_definition tool for validation to prevent hallucination-induced misconfiguration.
I felt enough potential to make observability operations more efficient with AI agents.
I hope this article is helpful.
References