
I tested each of the Grafana Dashboard Links setting options one by one
This page has been translated by machine translation. View original
Introduction
Do you ever want to navigate to related dashboards in Grafana or update variables to specific values?
Grafana has a feature called Dashboard Links that allows you to place links at the top of your dashboard to achieve the above.
In this article, I'll try out all the Dashboard Links options and introduce how I actually use them.
Prerequisites
I used Grafana Cloud version 12.3.0.
As a side note, in Amazon Managed Grafana (v10.4), all options except the "Show in controls menu" option can be used in the same way.
Dashboard Used in This Article
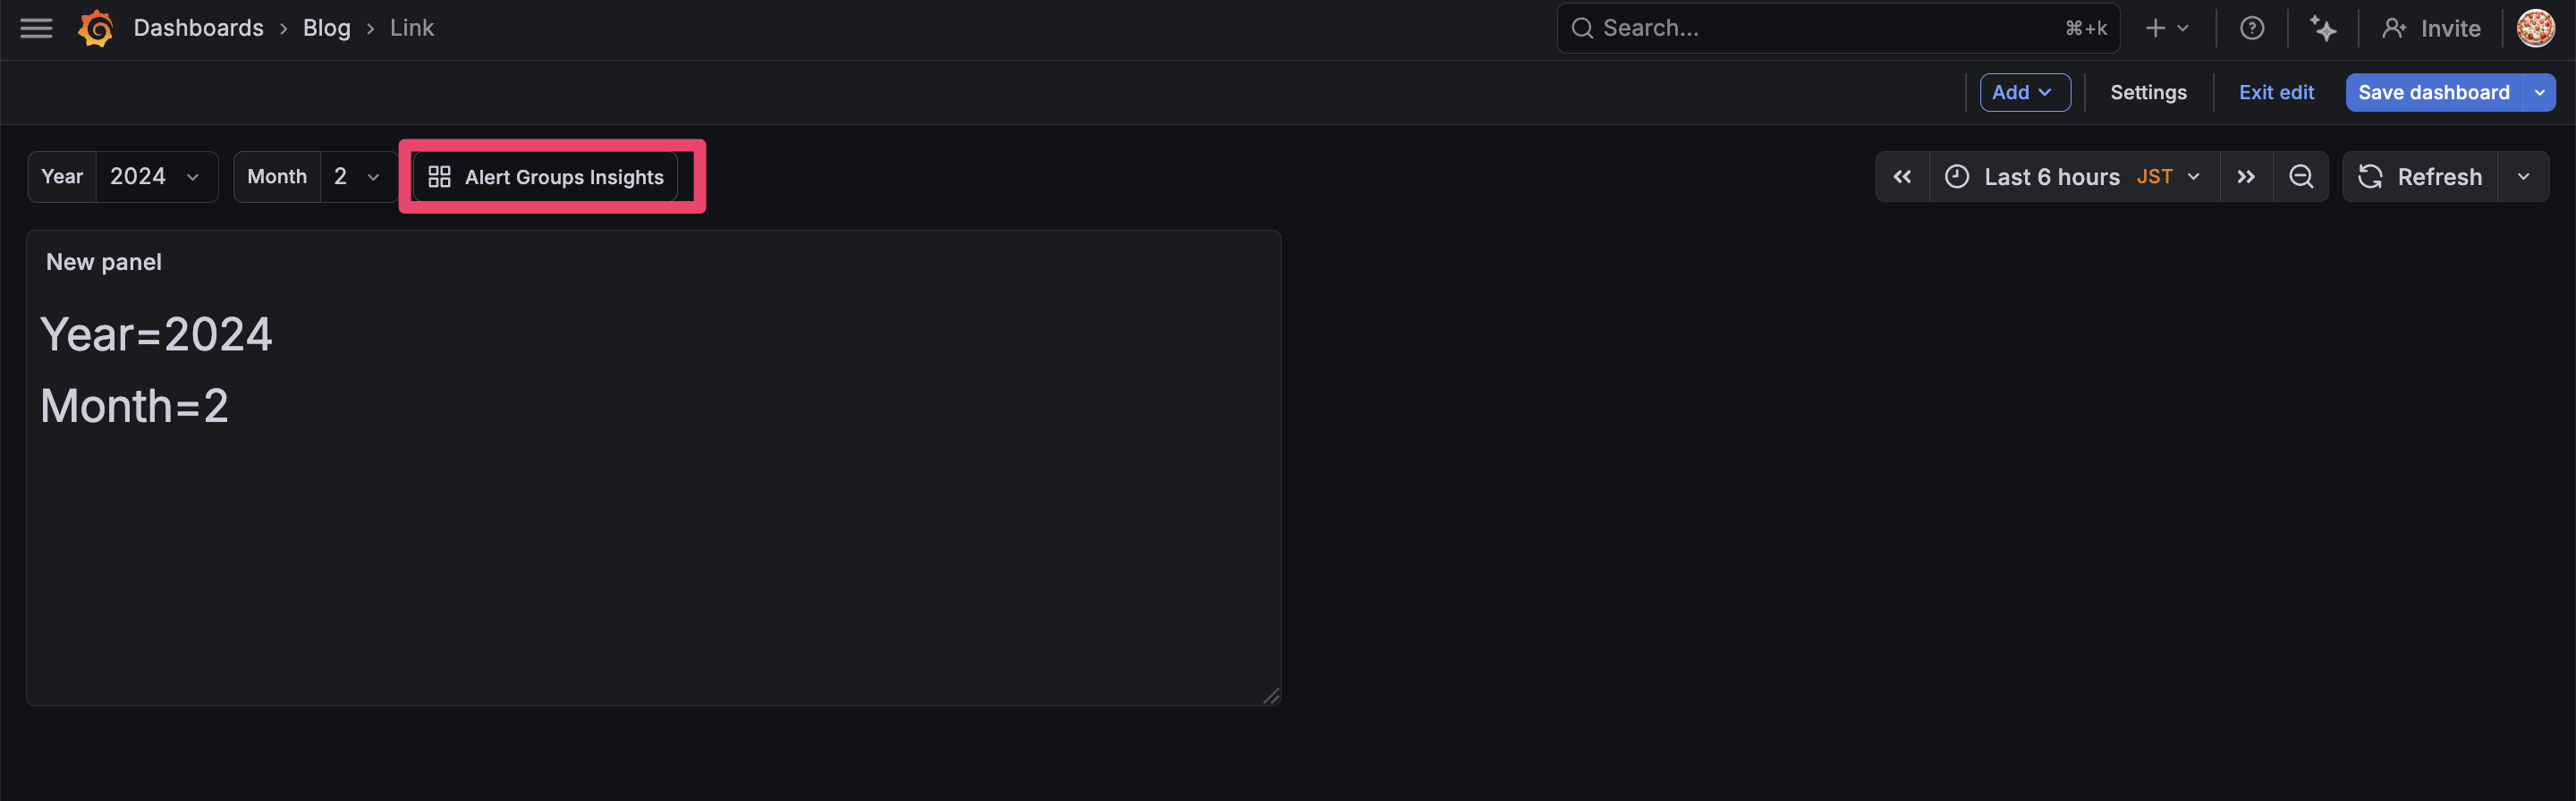
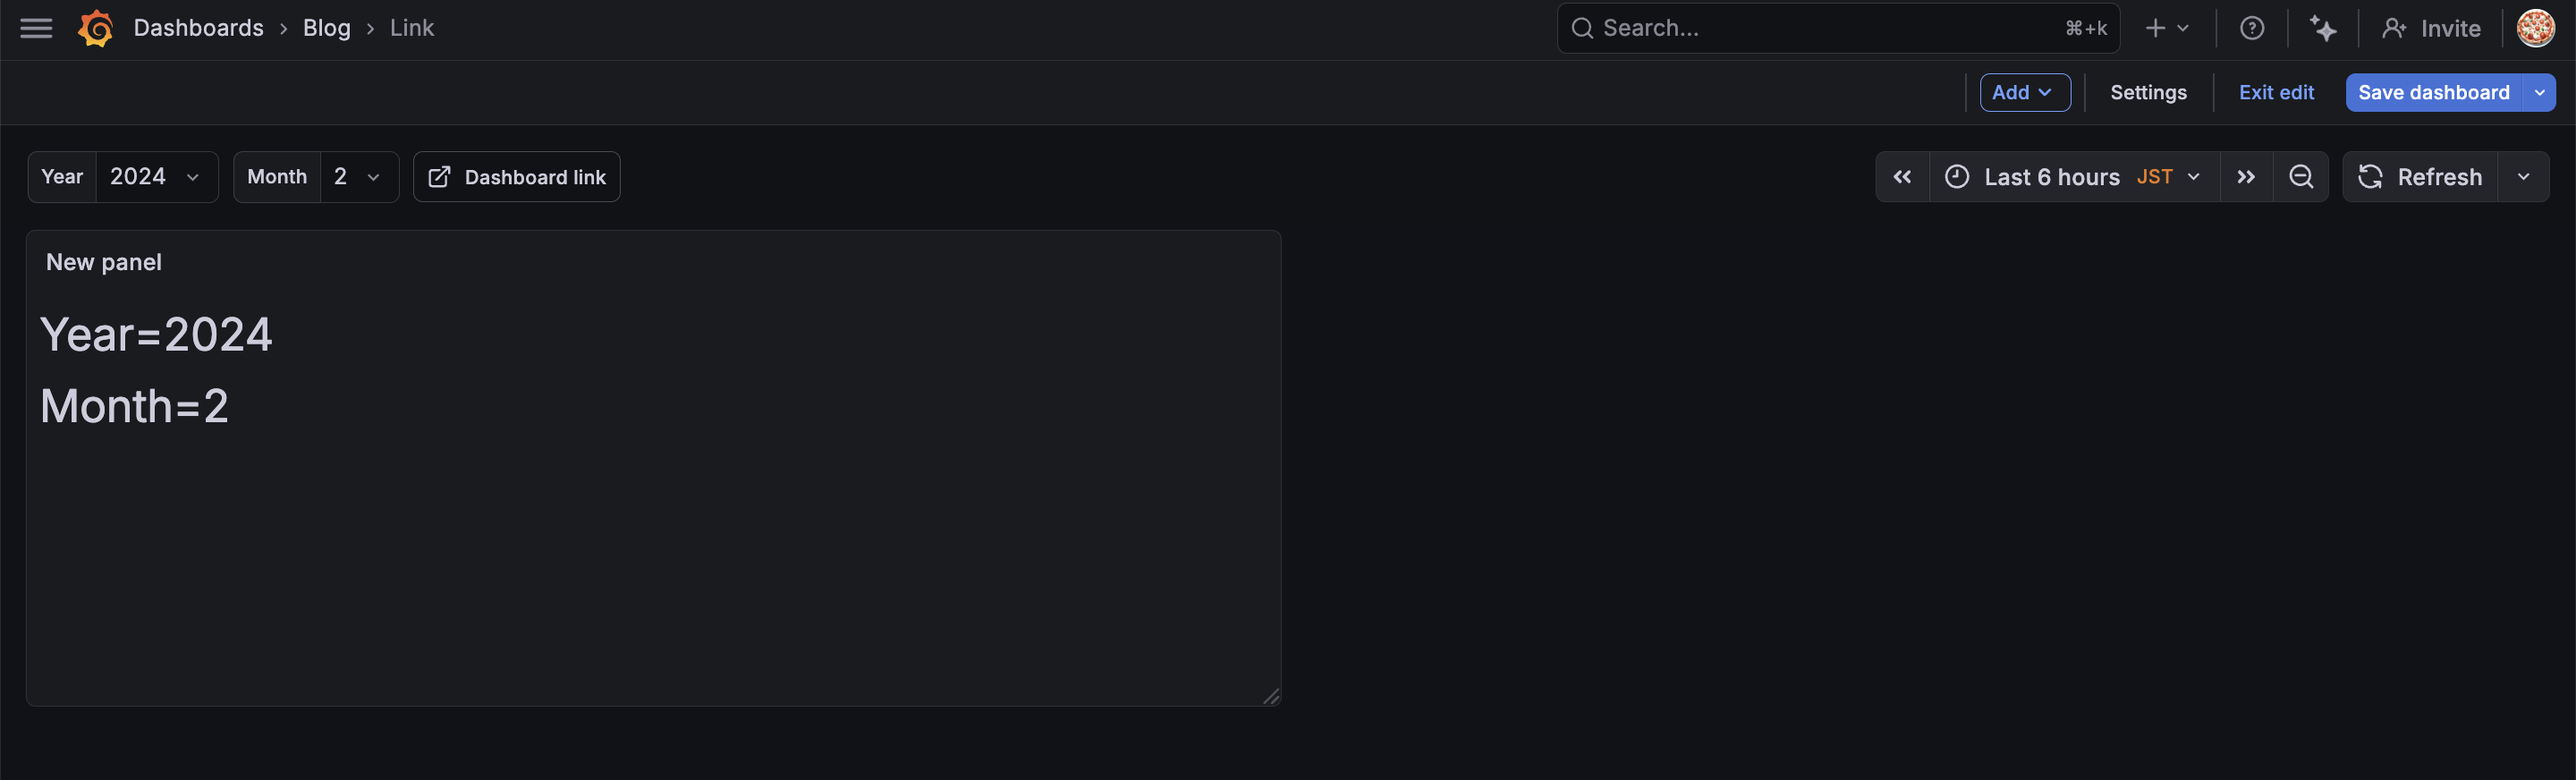
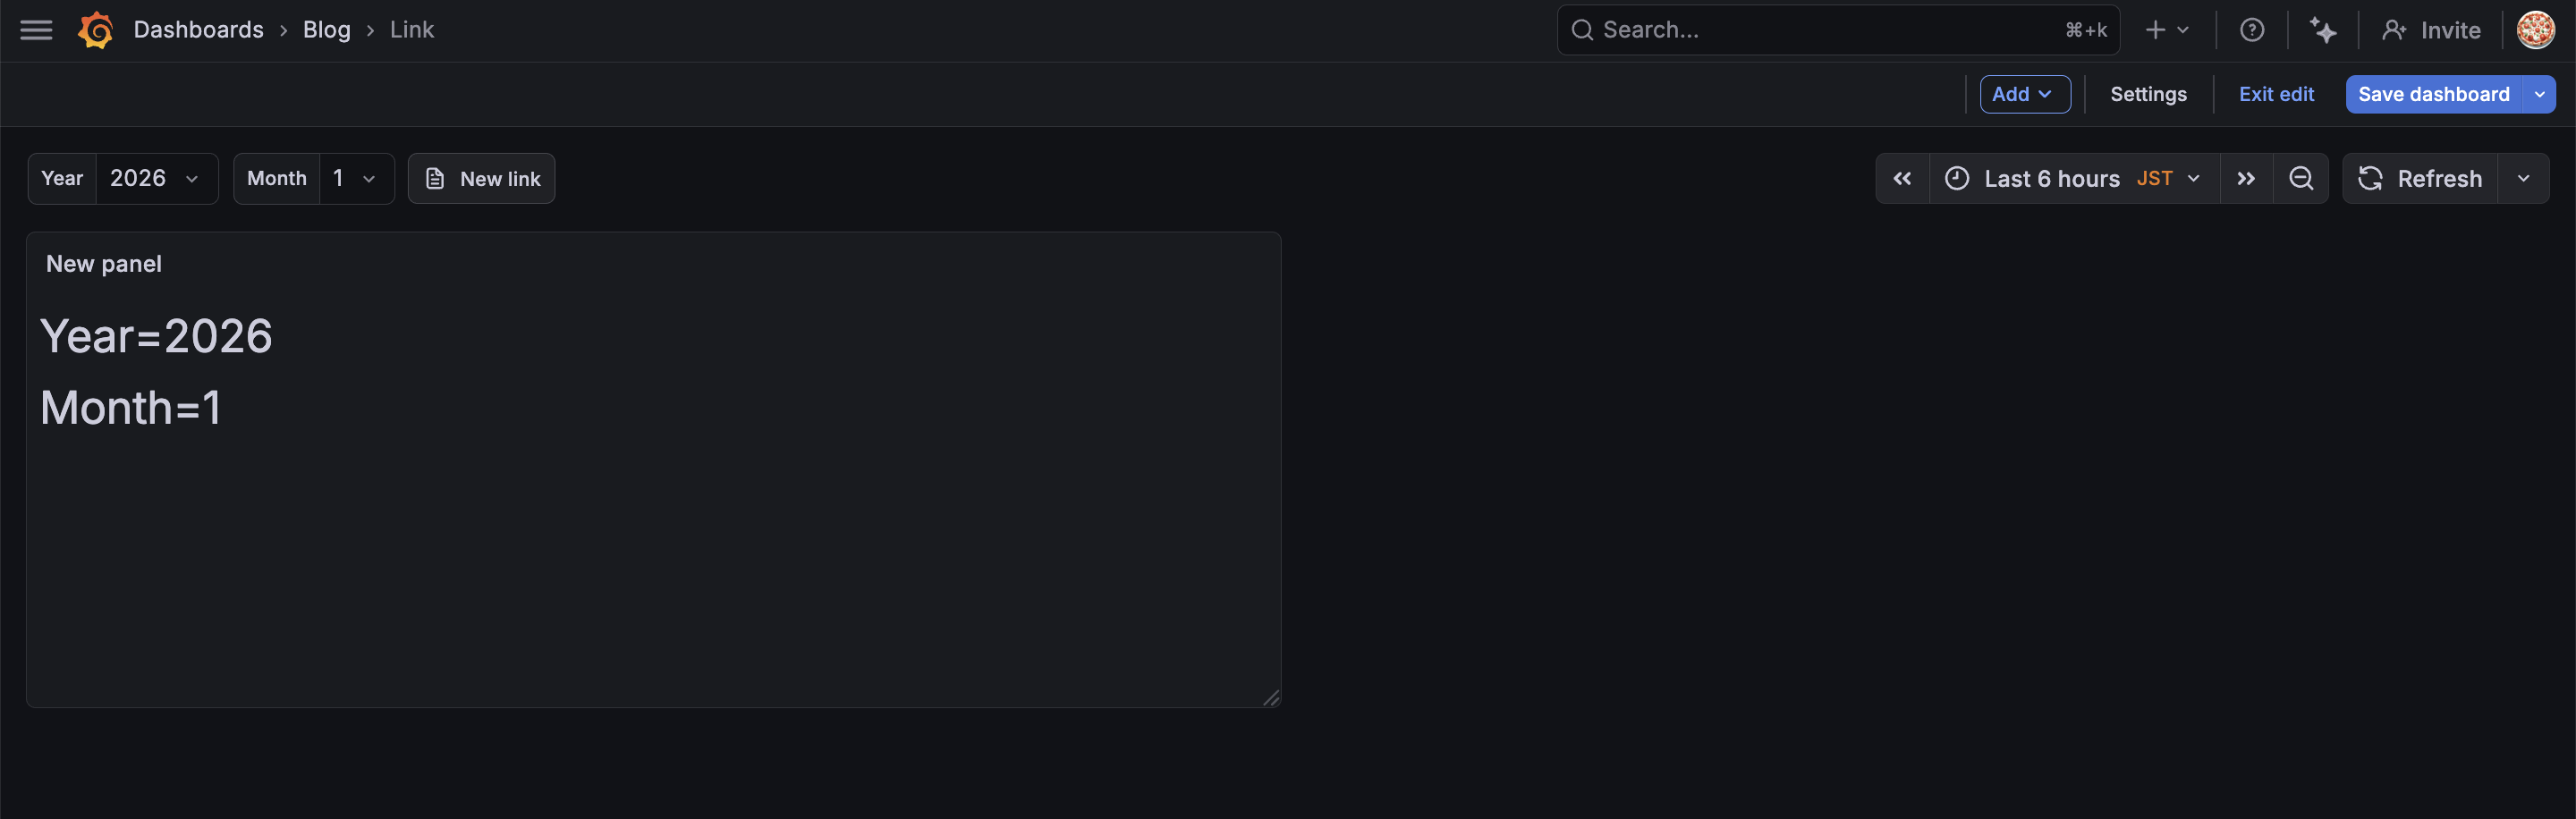
First, here's the dashboard I'll be using.
I prepared a simple dashboard that switches the year and month using variables and displays the selected year and month.
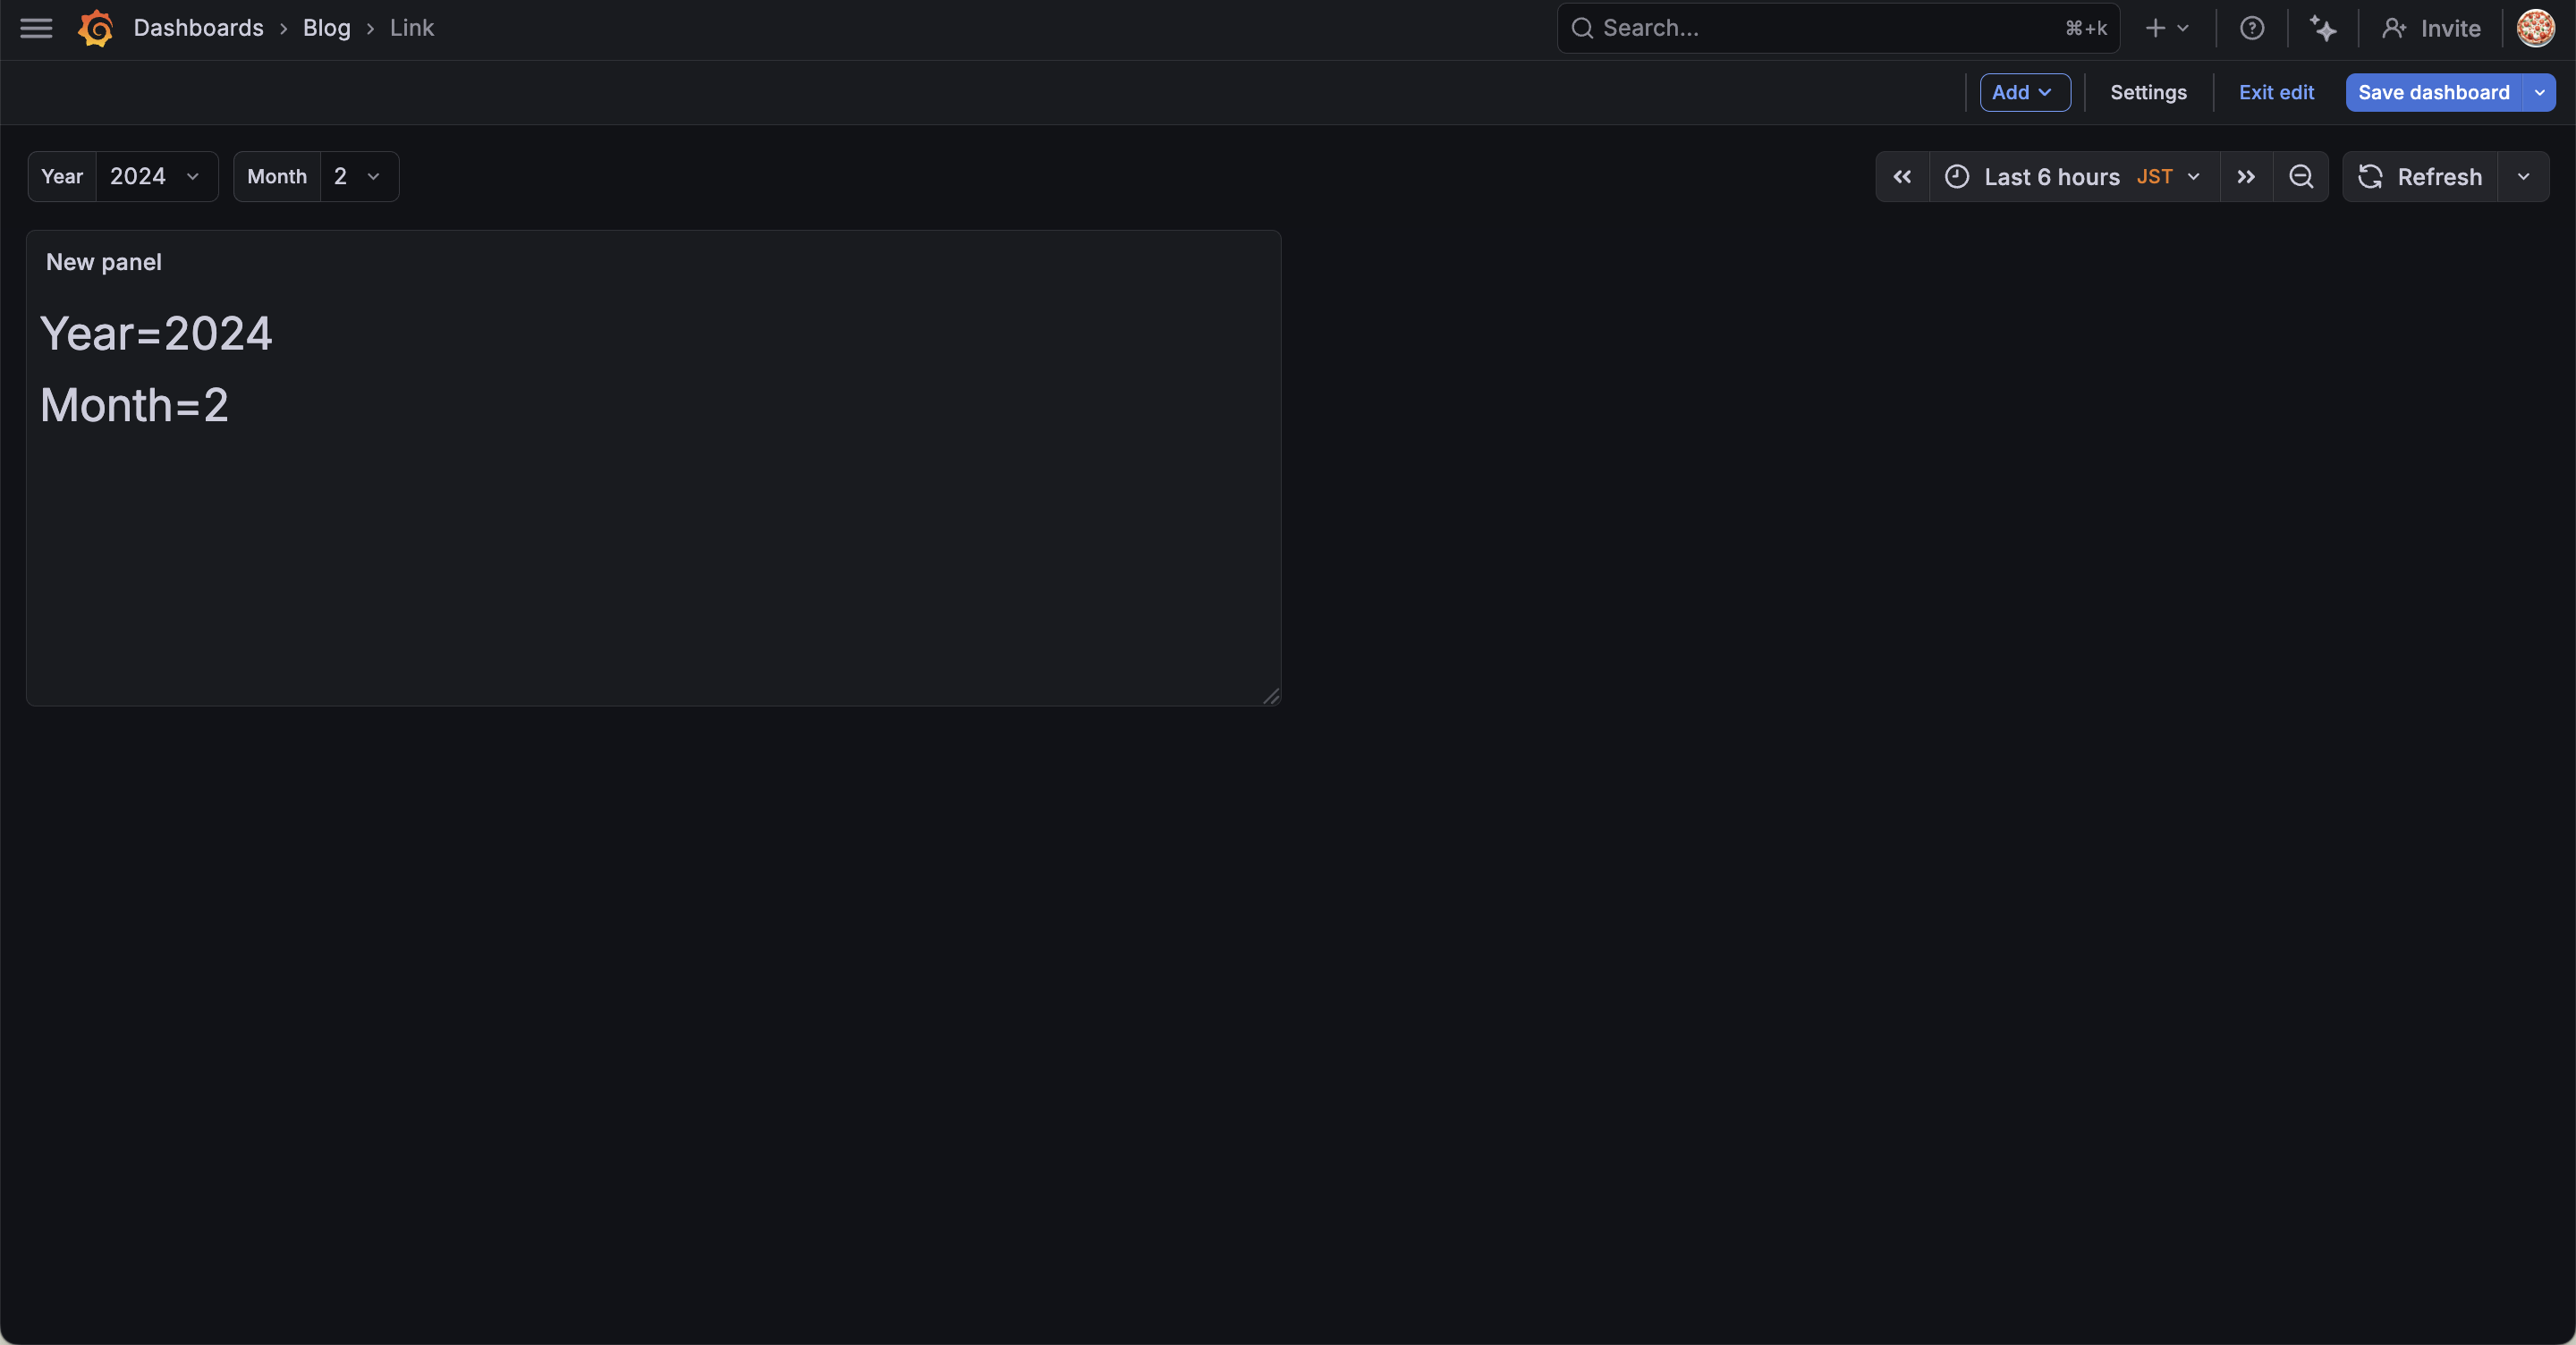
I've set up the following two variables:
| Variable Name | Type | Values |
|---|---|---|
| year | Custom | 2024, 2025, 2026 |
| month | Custom | 1, 2, 3, 4, 5, 6, 7, 8, 9, 10, 11, 12 |
I've displayed Year=${year} and Month=${month} in a Text panel to confirm the currently selected variables.
Now, let's explore the Dashboard Links settings using this dashboard!
Dashboard Links
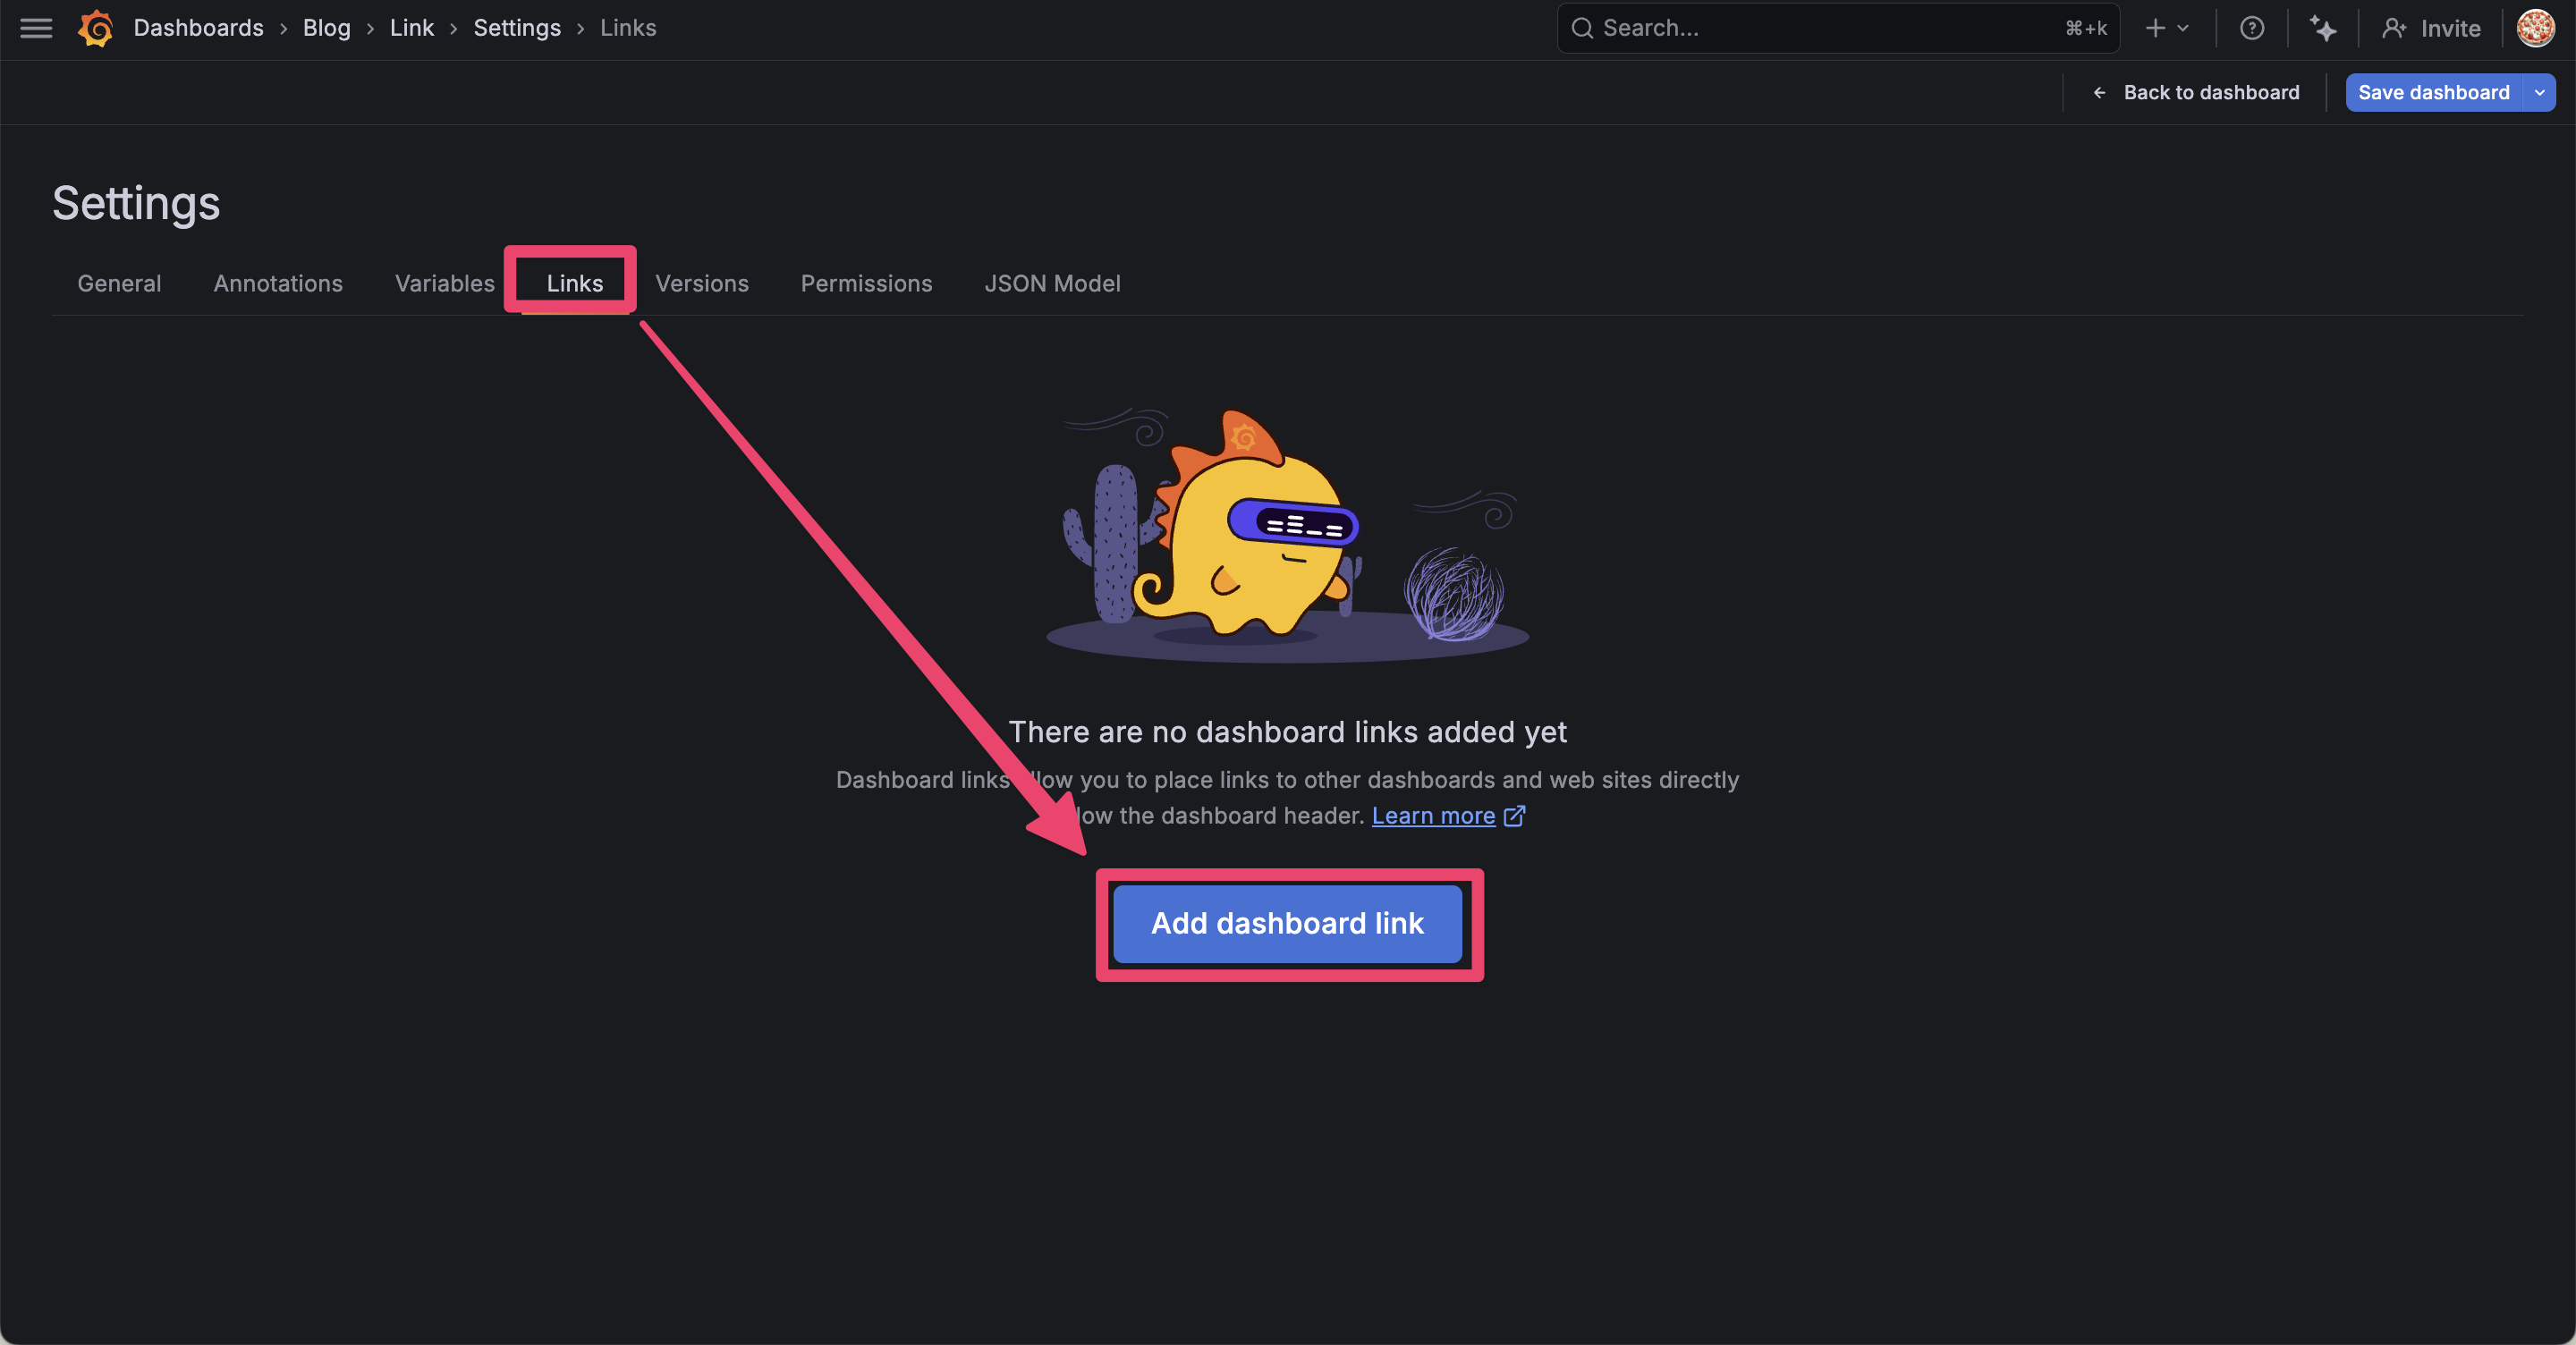
Navigate to Dashboard > Settings > Links to configure links.
Click "Add dashboard link" to add a new link.
Let's look at each configuration item one by one.
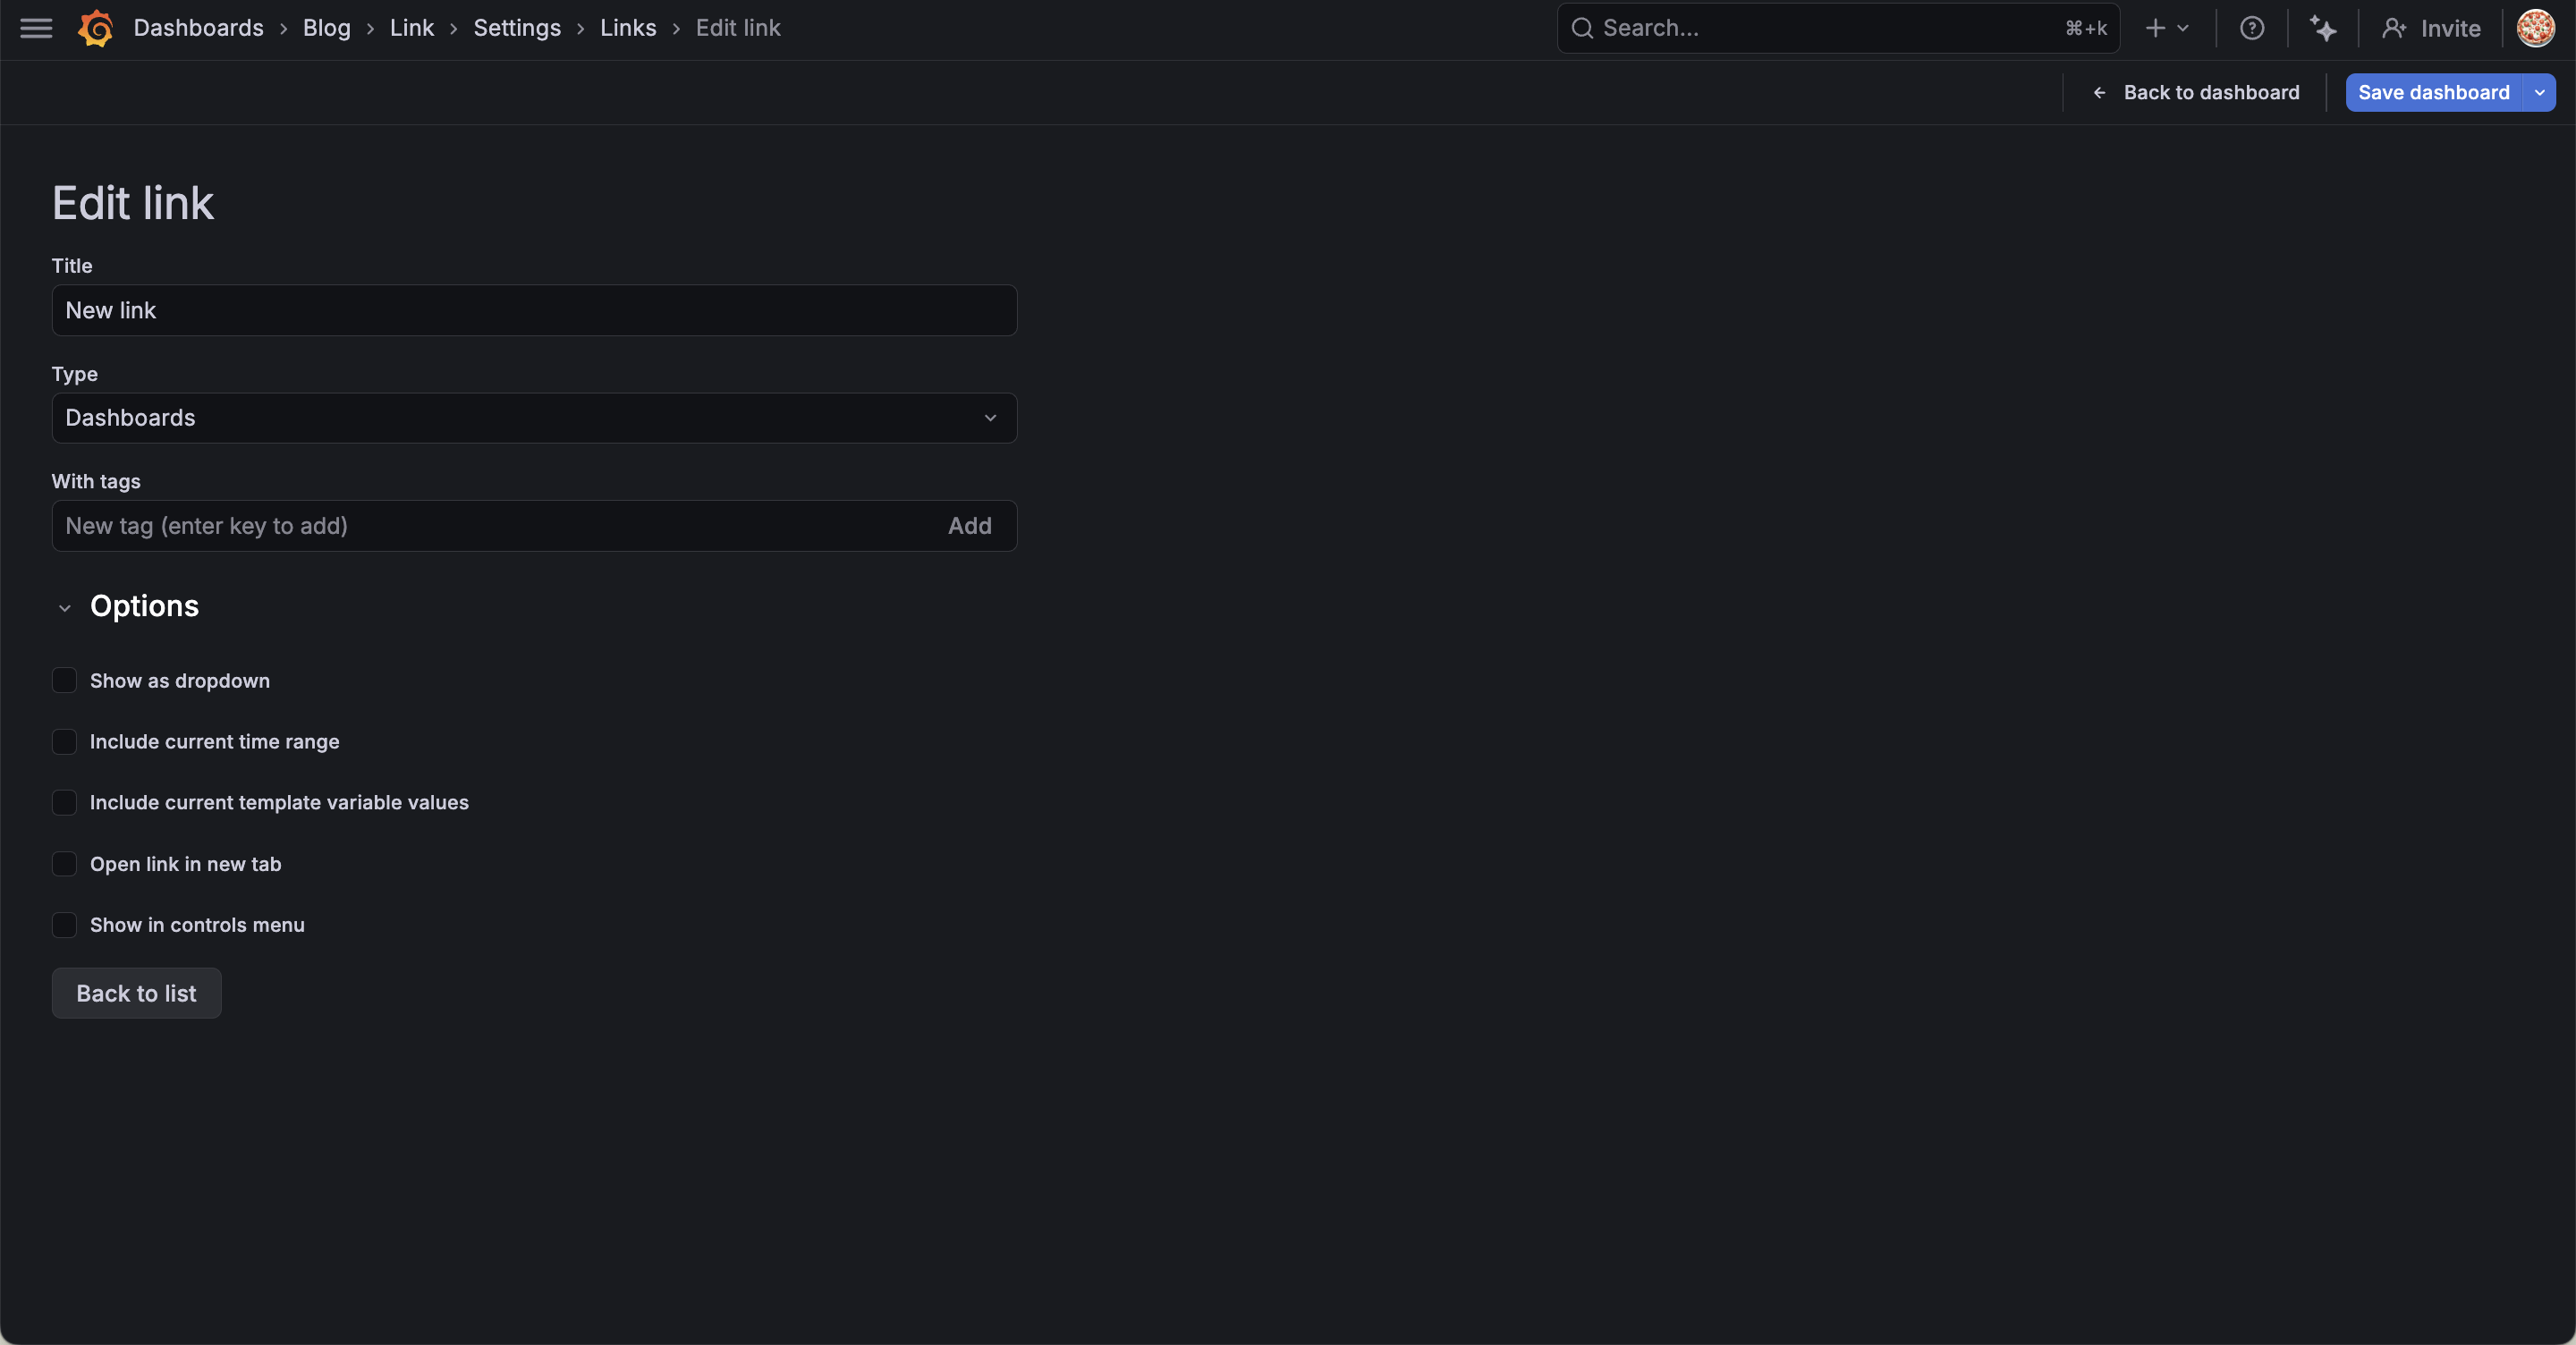
Type
First, there are two main types of Links: "Dashboards" and "Link".
This is what you set with Type.
Dashboards
Selecting Dashboards displays links to dashboards.
Seeing is believing.
Let's create a Dashboards type link without setting any options first.
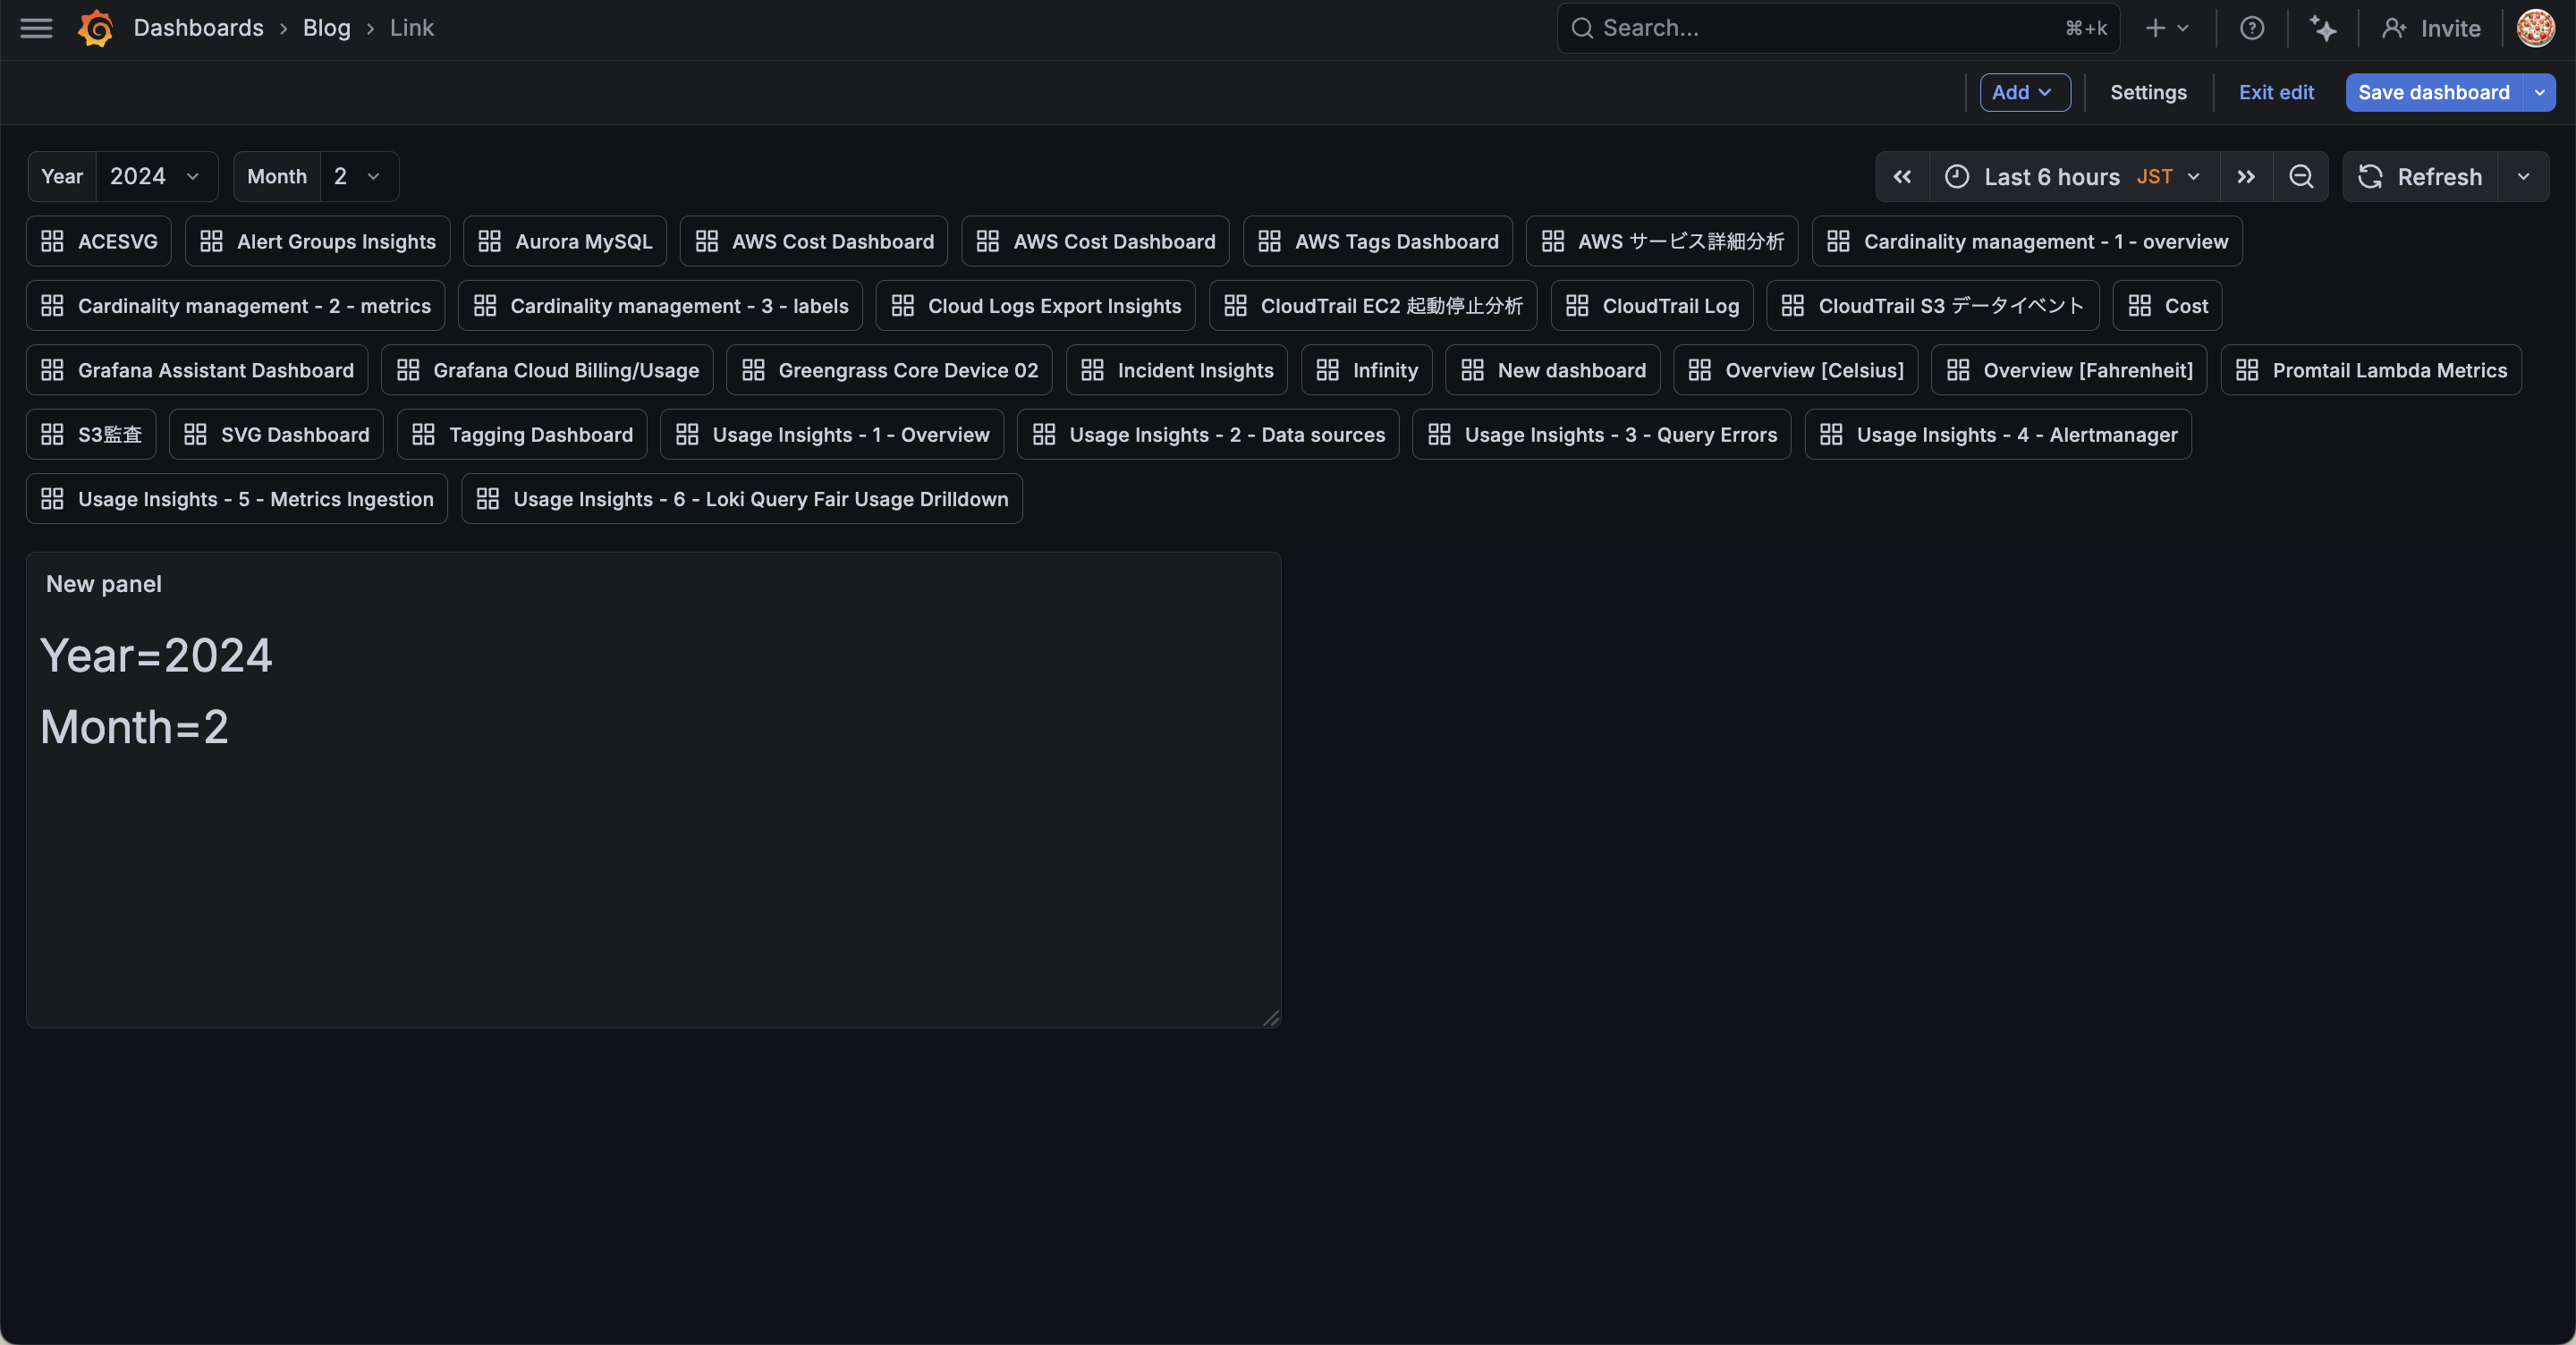
Oh! Other dashboards in my account are displayed at the top of the dashboard!
So this feature displays "Links" to other dashboards.
This seems useful when you want to navigate to related dashboards.
Now let's look at the options for the Dashboards type.
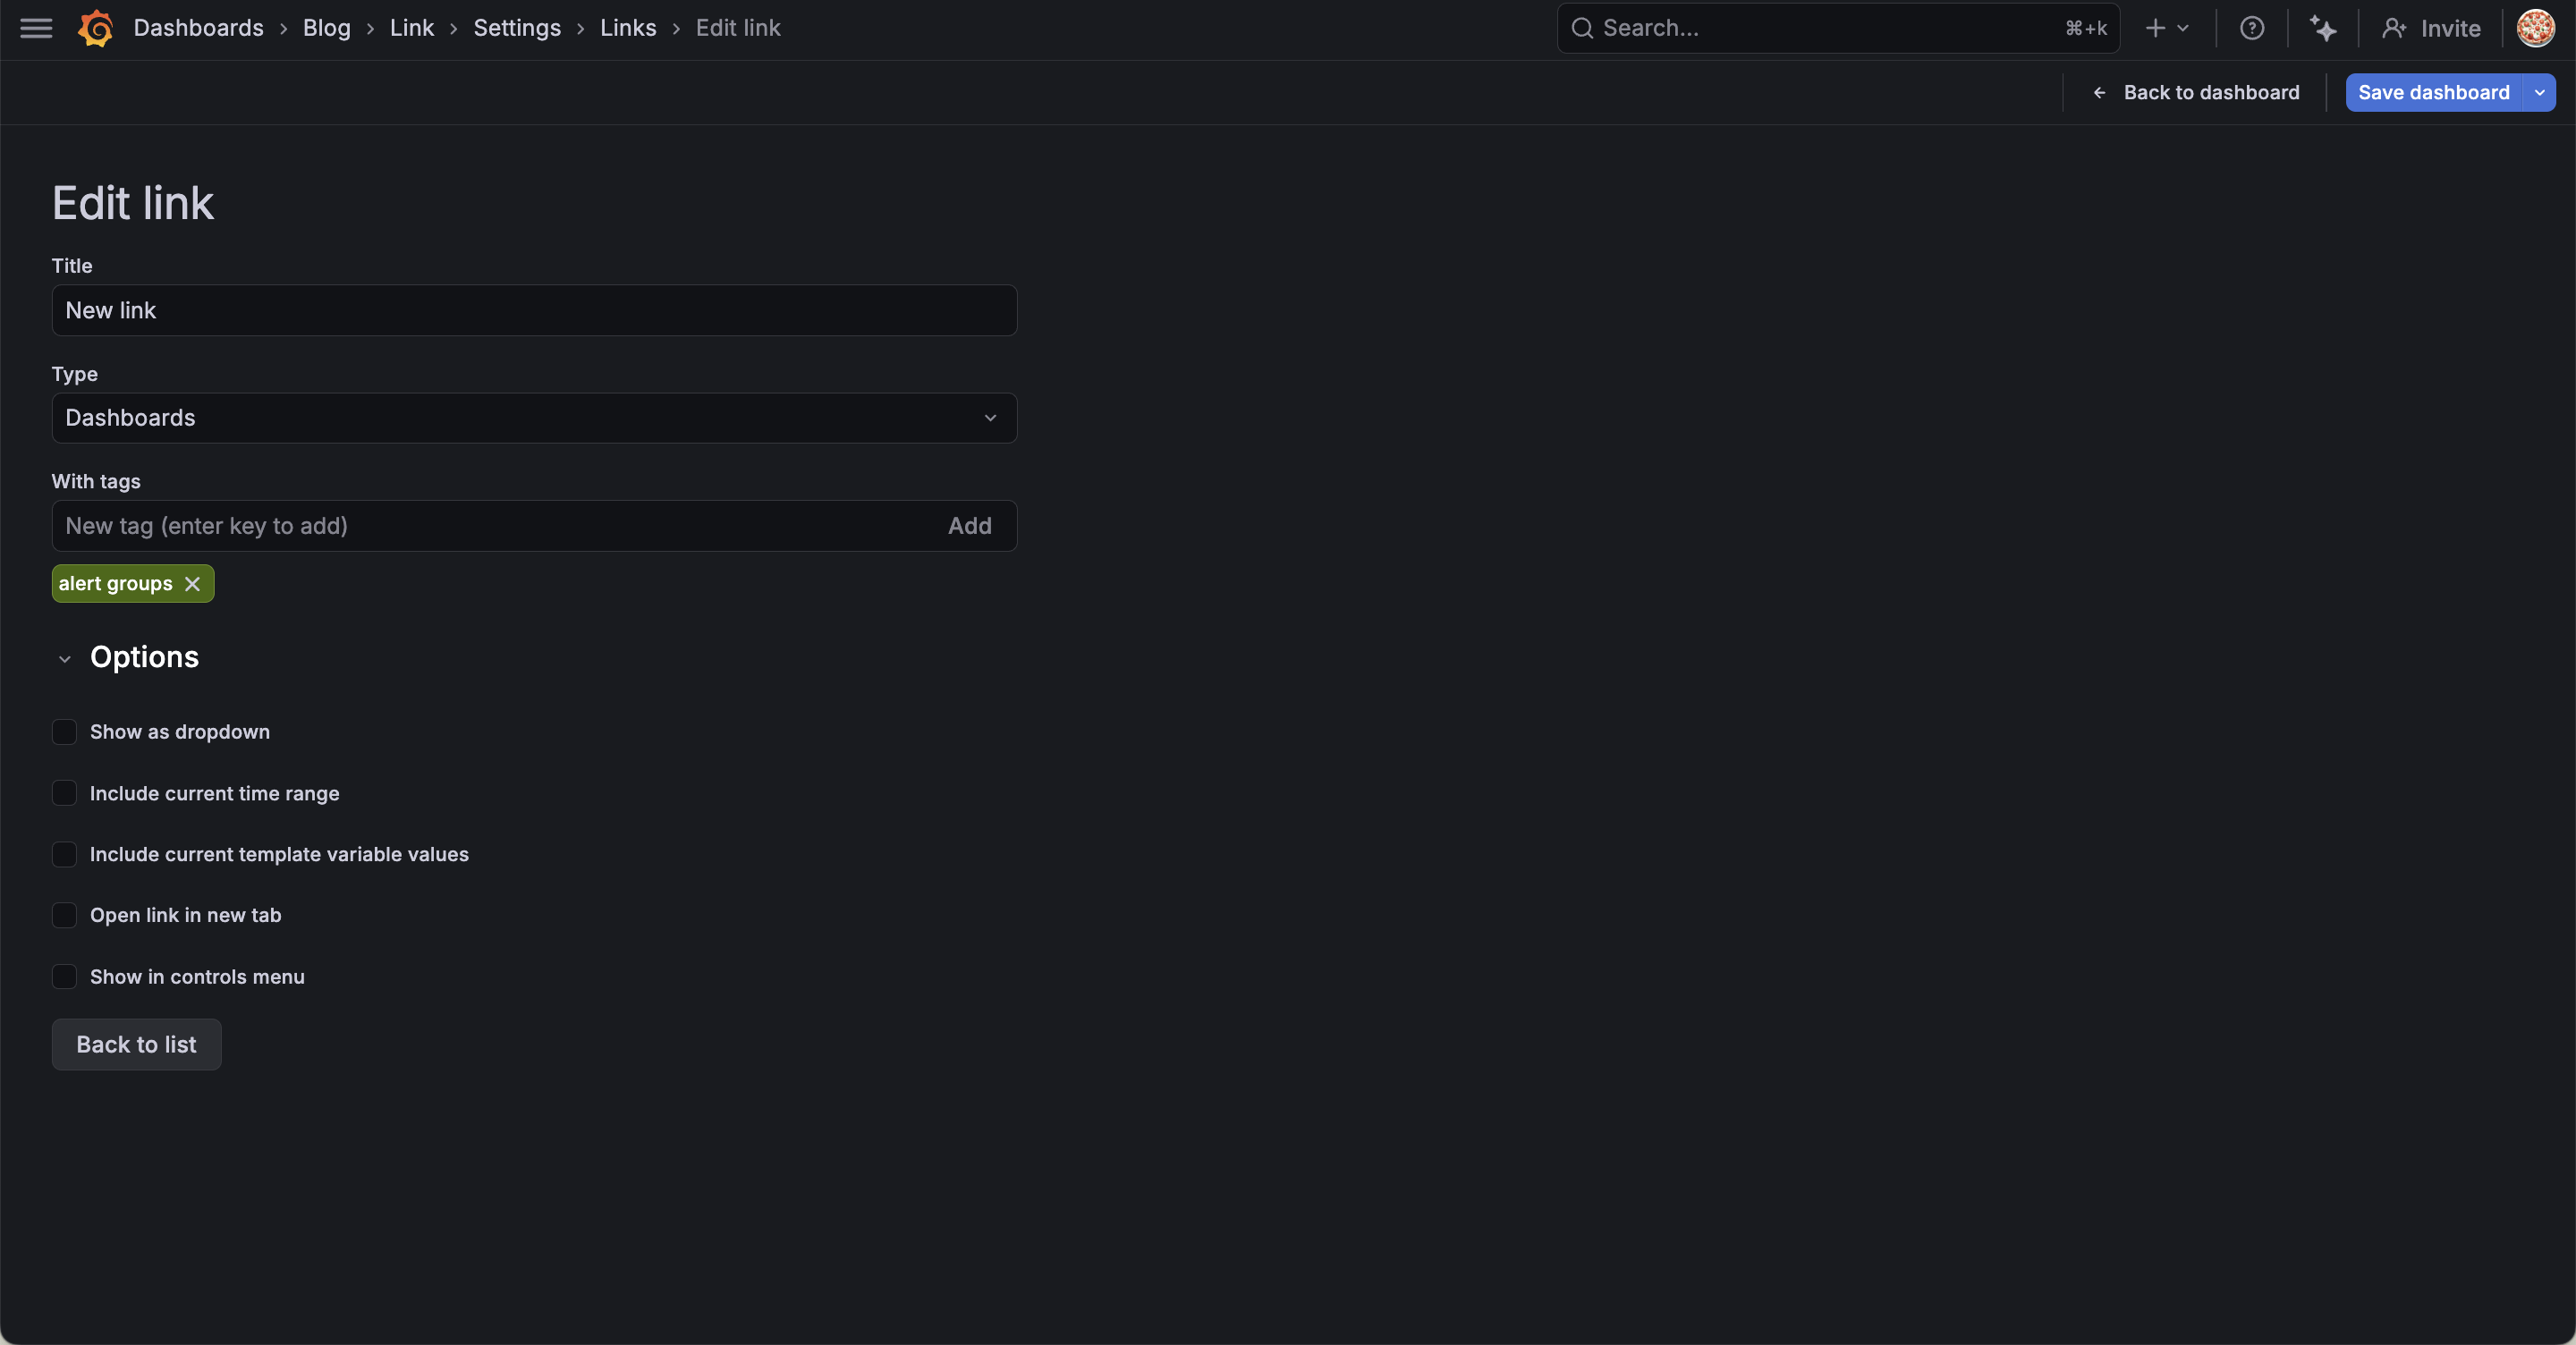
With tags
Using With tags allows you to filter the displayed dashboards by tags.
By default, all dashboards are displayed, but specifying tags narrows it down to only the relevant dashboards.
By the way, you need to add tags to your dashboards beforehand.
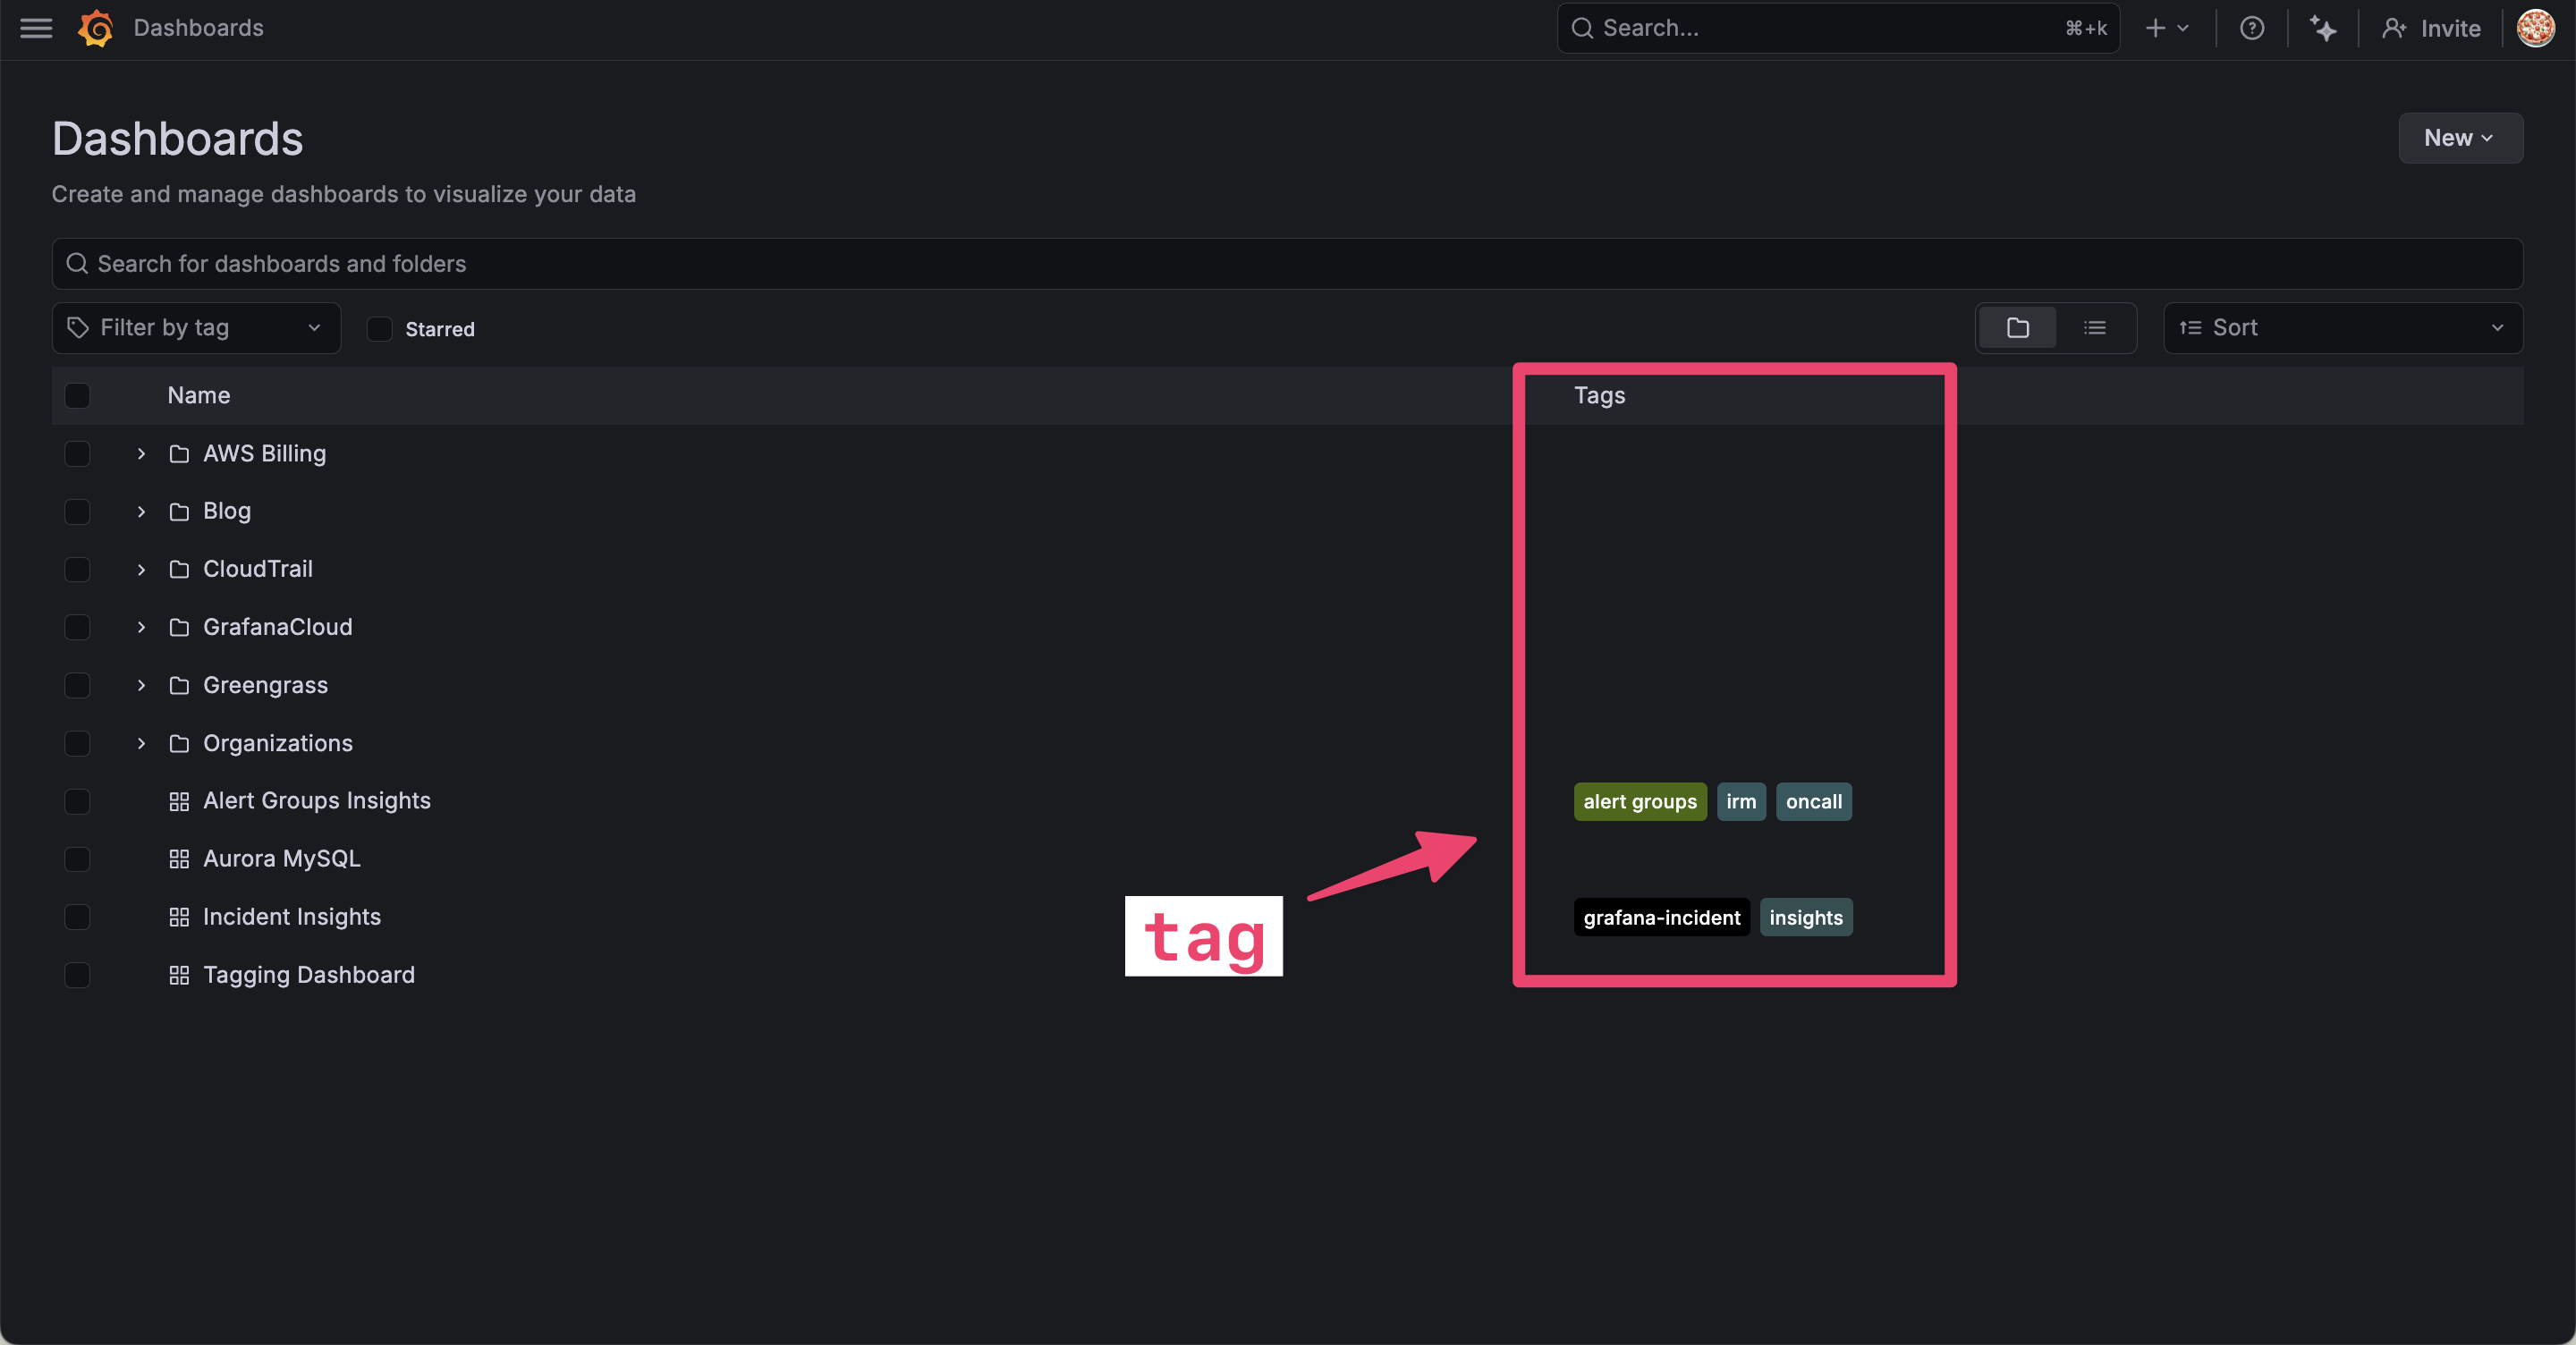
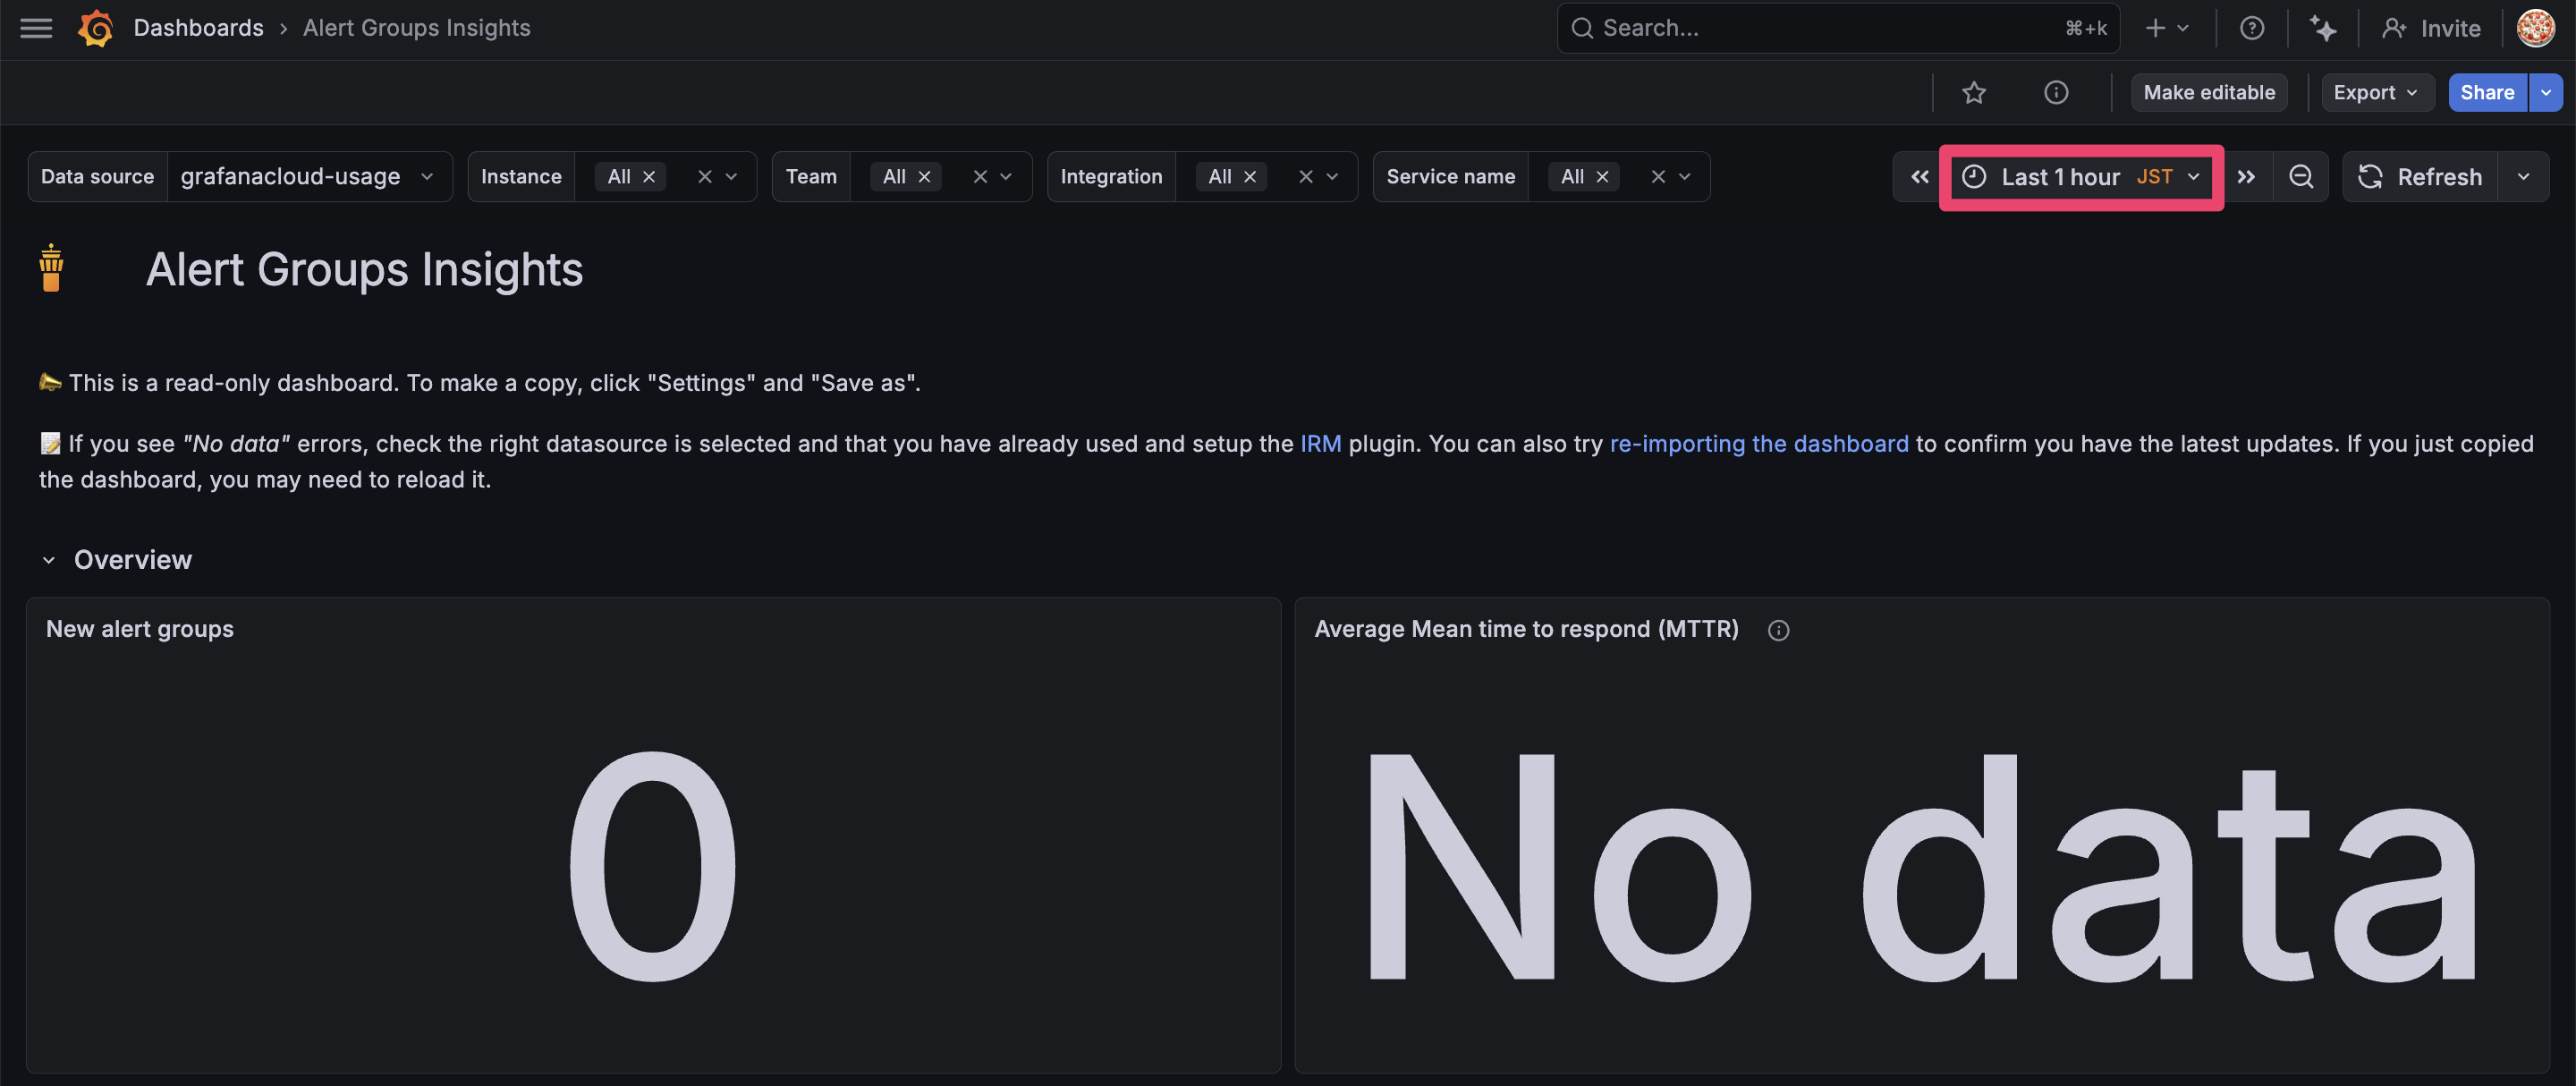
Let's try setting the alert groups tag.
Now only dashboards with the alert groups tag appear in the links.
This is convenient when you want to group and display related dashboards.
Show as dropdown
When enabled, dashboard links are displayed as a dropdown menu.
Let's try it! The list of dashboards that were previously displayed side by side now appears in a dropdown.
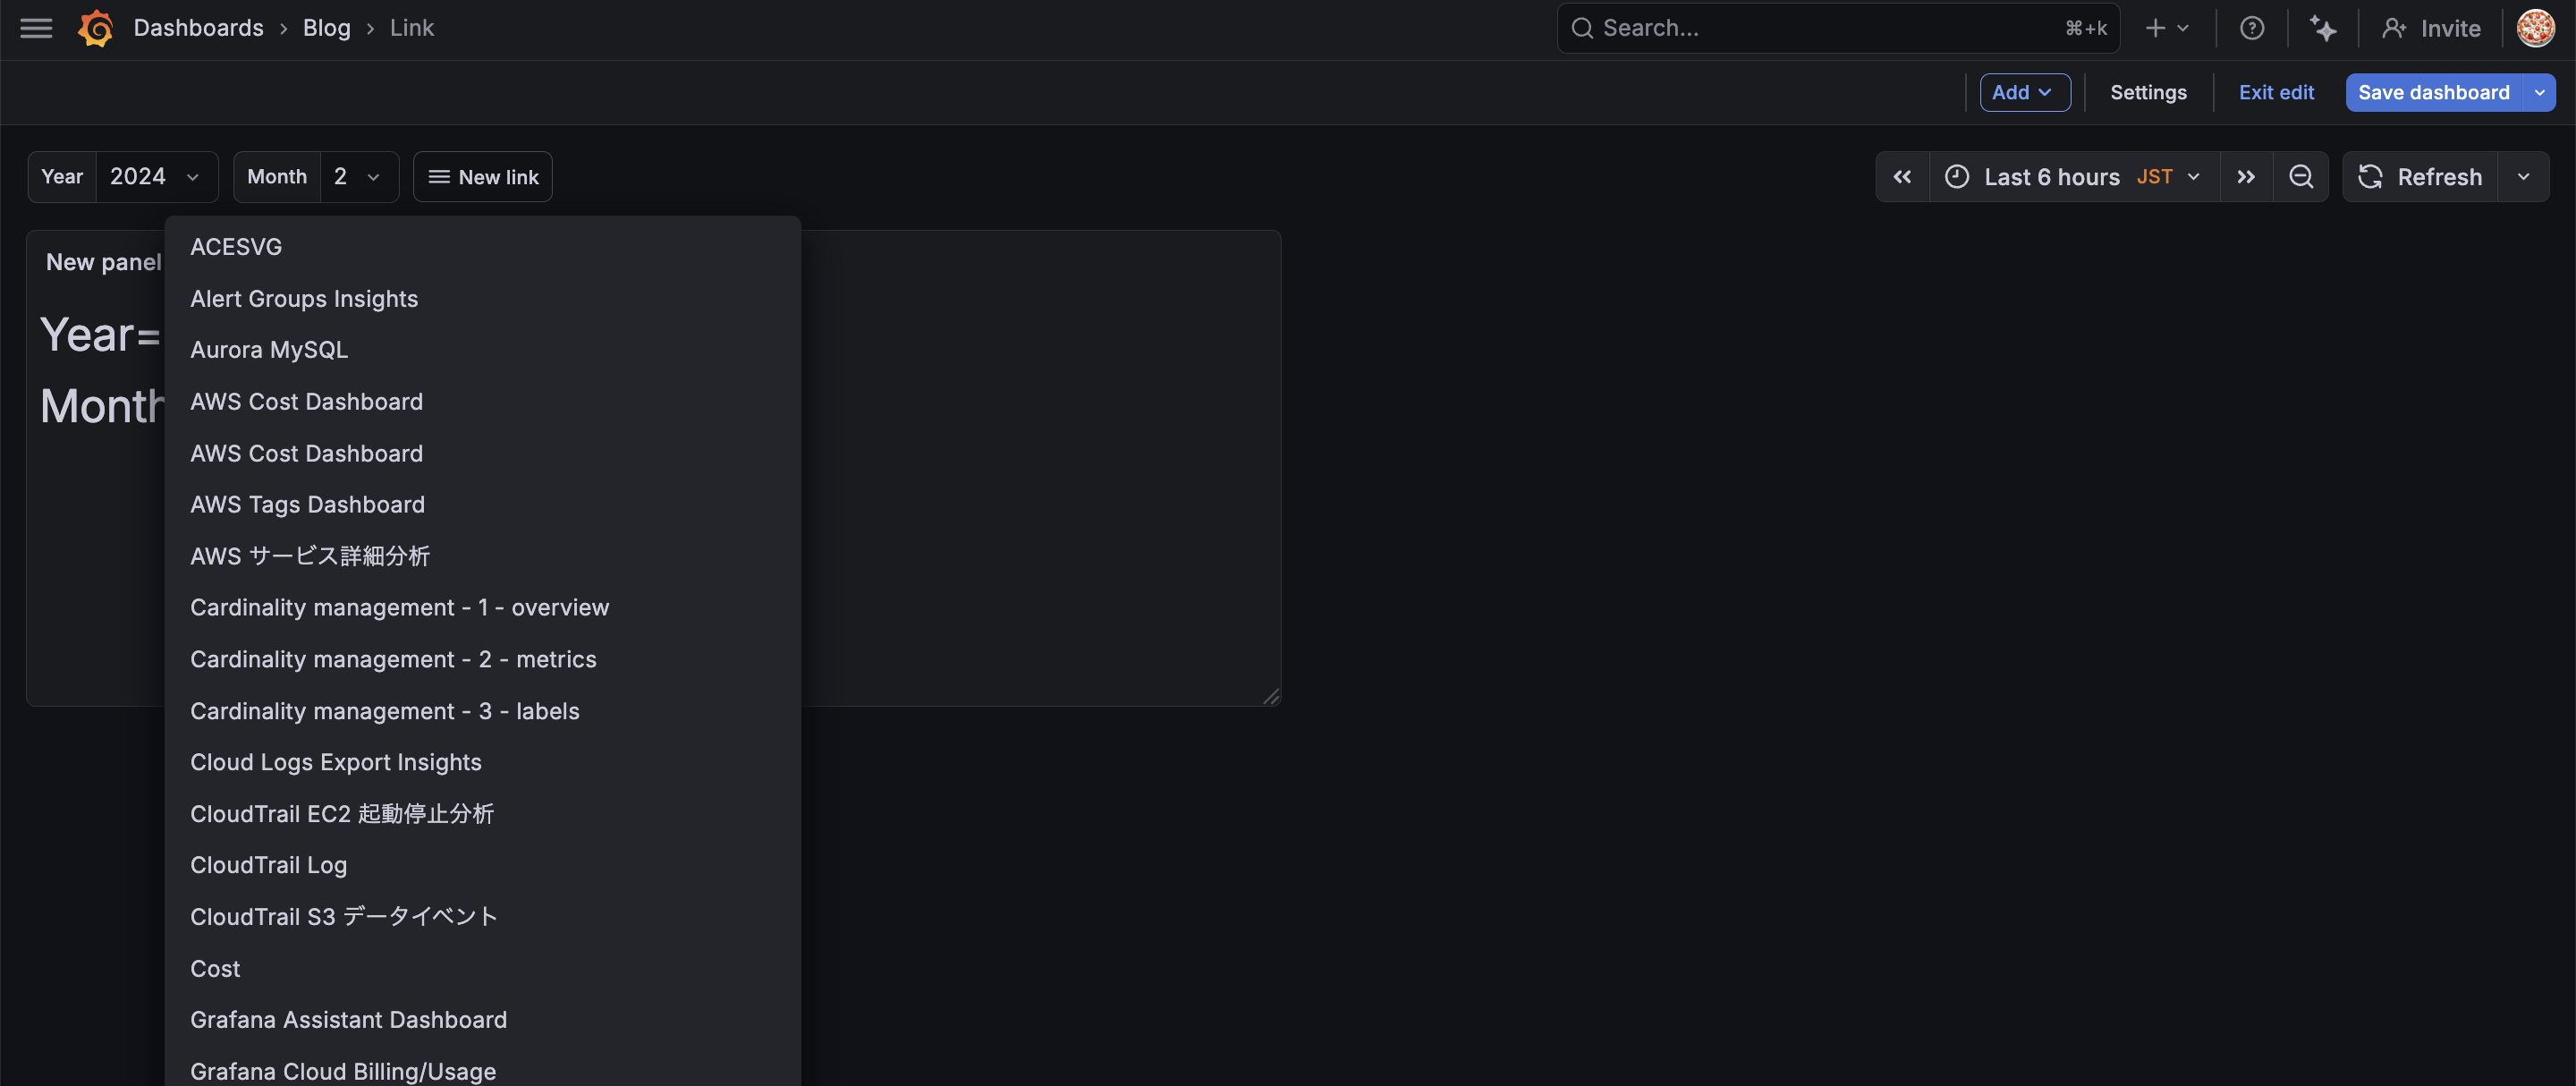
If you have many dashboards, using a dropdown makes things cleaner.
If you have too many dashboards, it's probably best to filter them with tags and use the dropdown format.
Include current time range
When enabled, the current time range is carried over to the destination.
For example, if you select "Last 6 hours" and click a link, the destination will also be set to "Last 6 hours".
Let's try it.
Change the time range from Last 6hour to Last 1hour.
Now open another dashboard in this state.
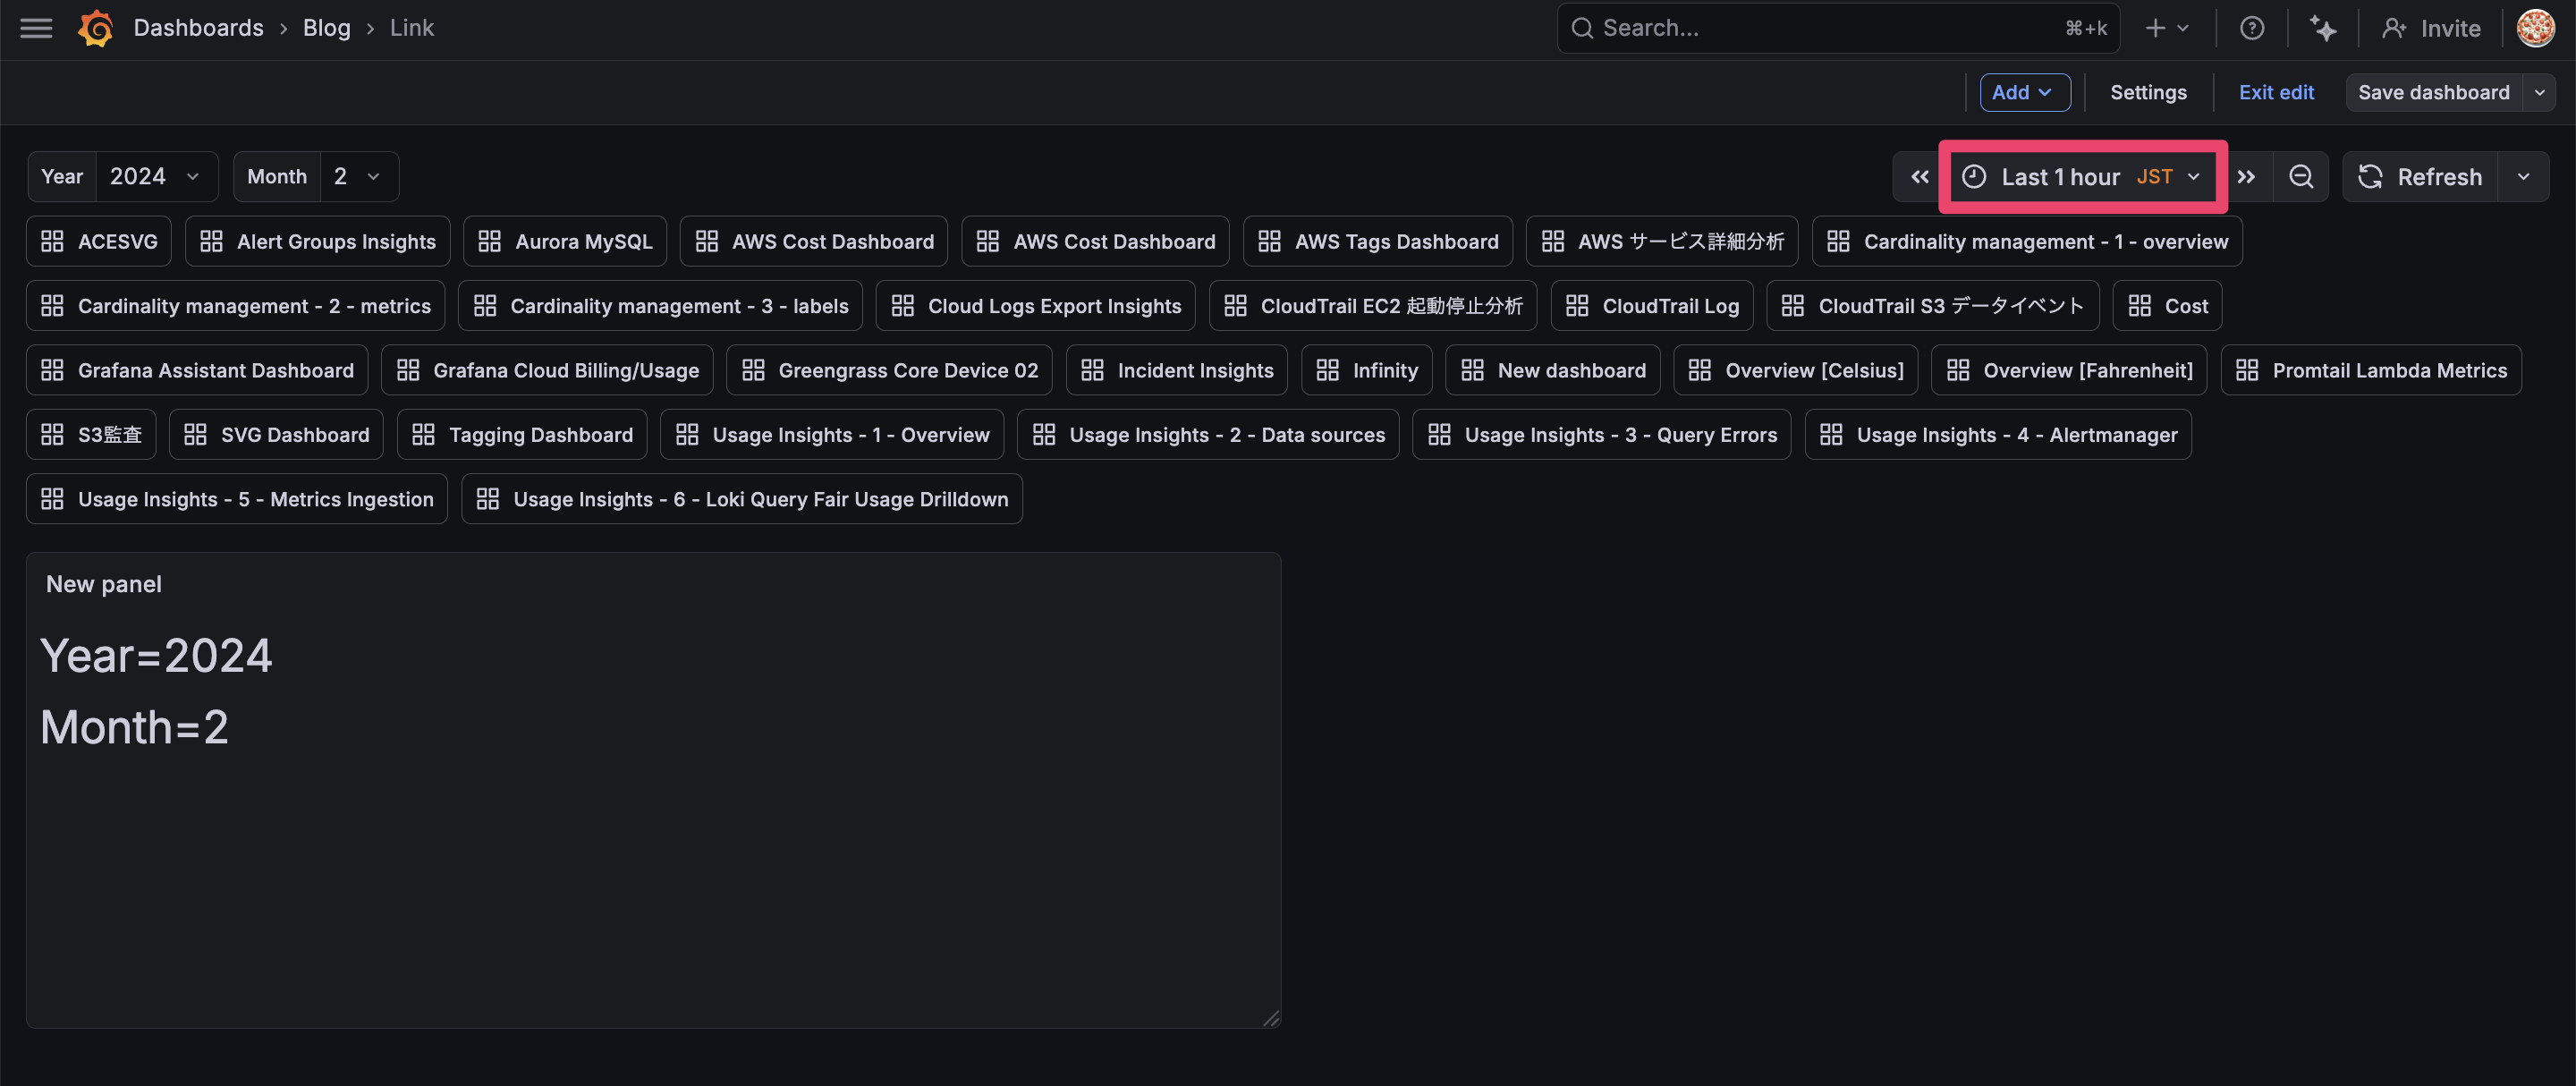
Last 1 hours has been carried over.
Normally, dashboards are displayed with their own configured time ranges, but turning on Include current time range overrides the time range.
This option is useful when drilling down for investigation, as you often want to keep the time range consistent across related dashboards.
Include current template variable values
When enabled, the current variable values are carried over to the destination.
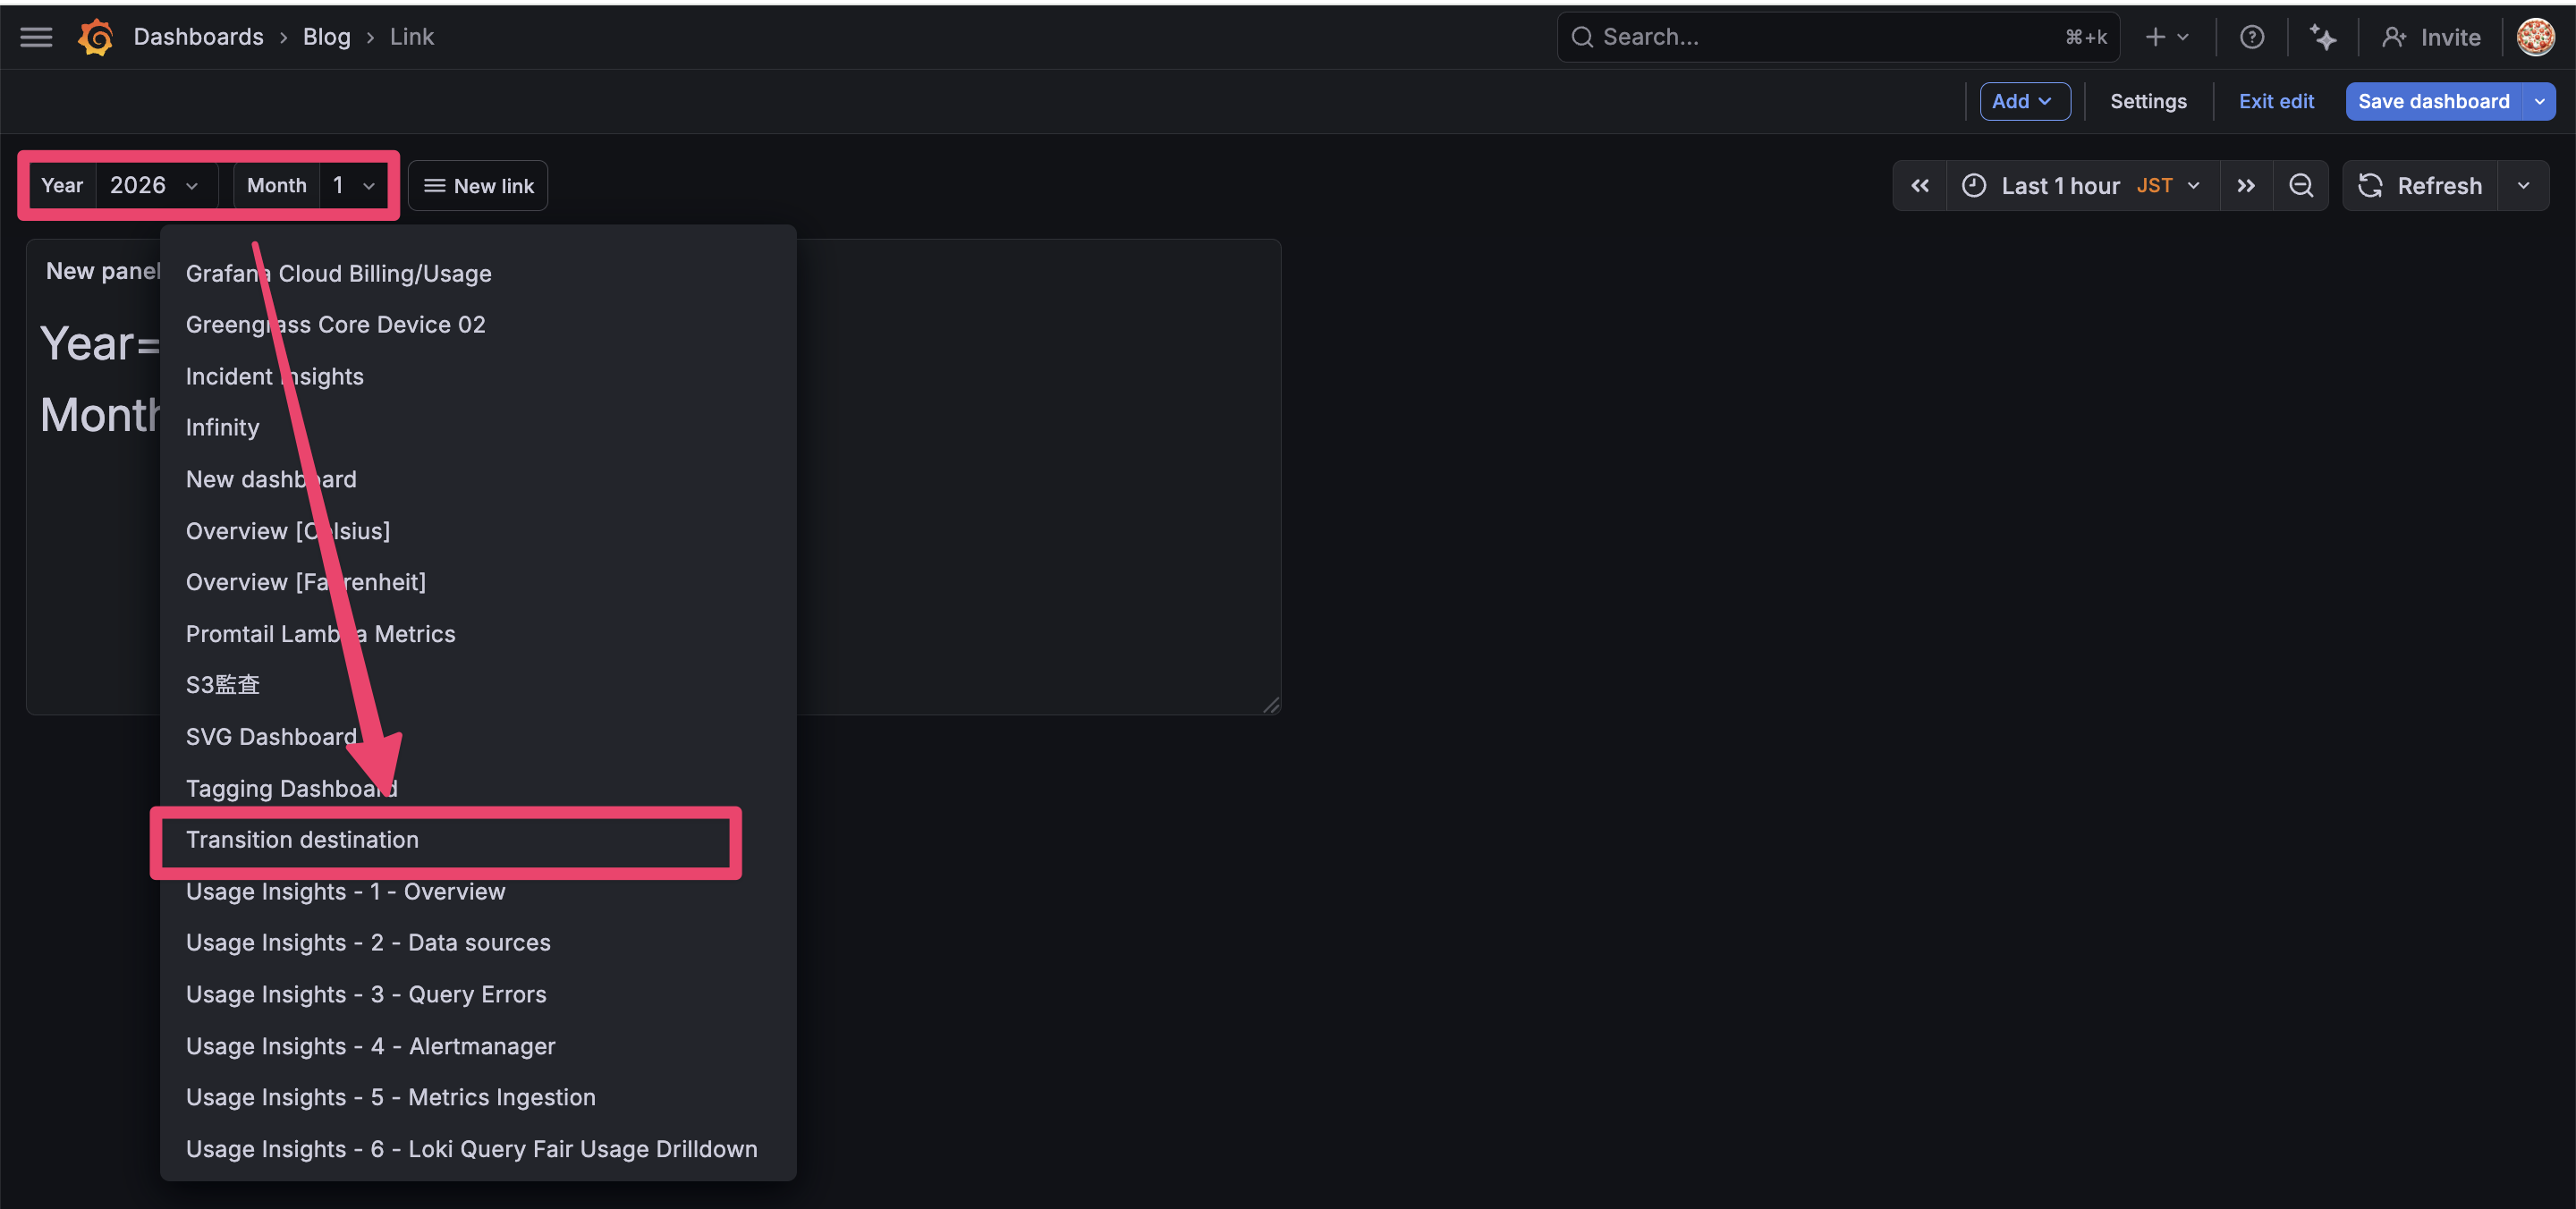
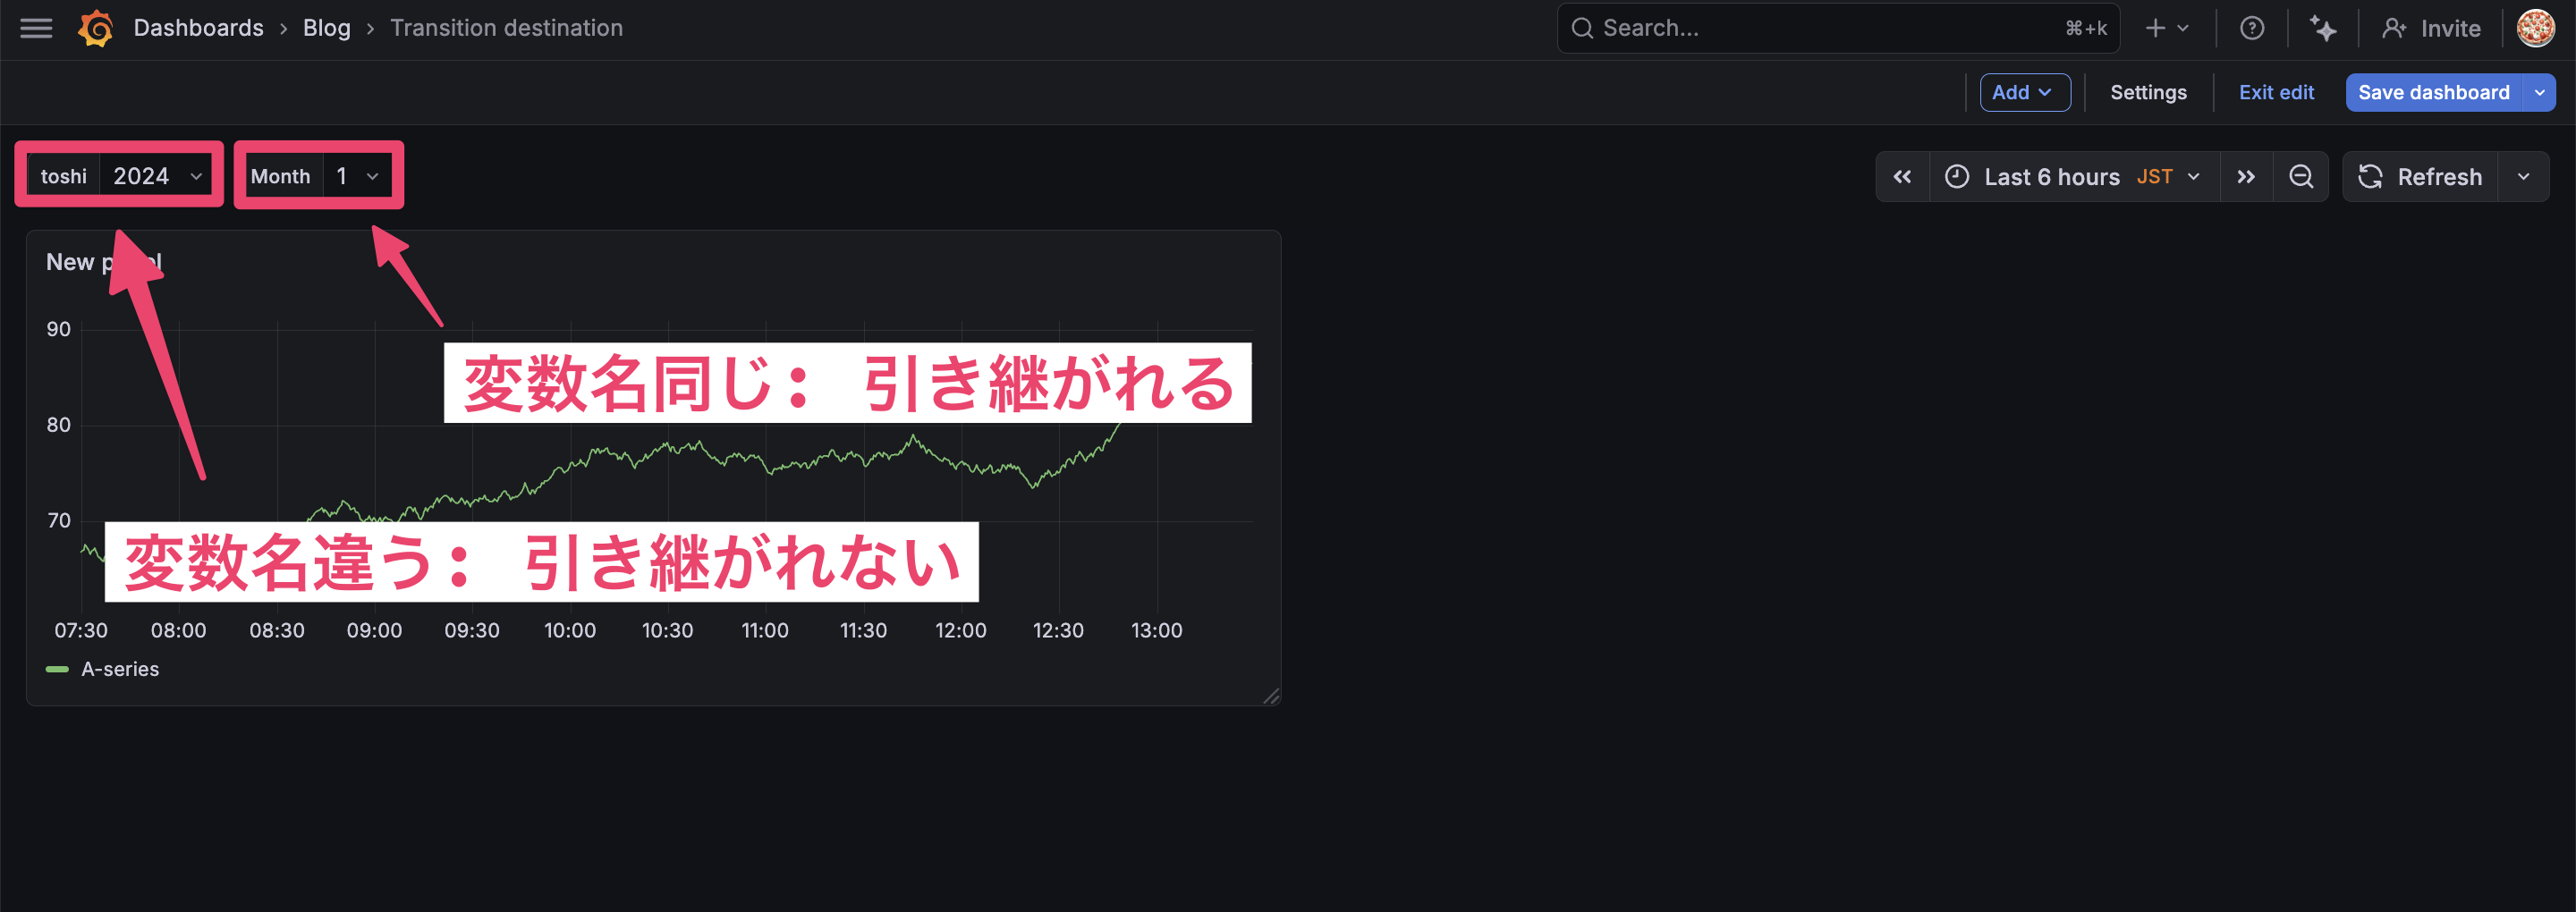
For example, if you select year=2026 and month=1 and click a link, the same values will be applied to variables with the same names in the destination.
Let's try it.
Set the variables in the original dashboard to year=2026 and month=1, and navigate to another dashboard.
Note that I've set up the same variables in the destination dashboard.
The variables have been carried over to the destination dashboard.
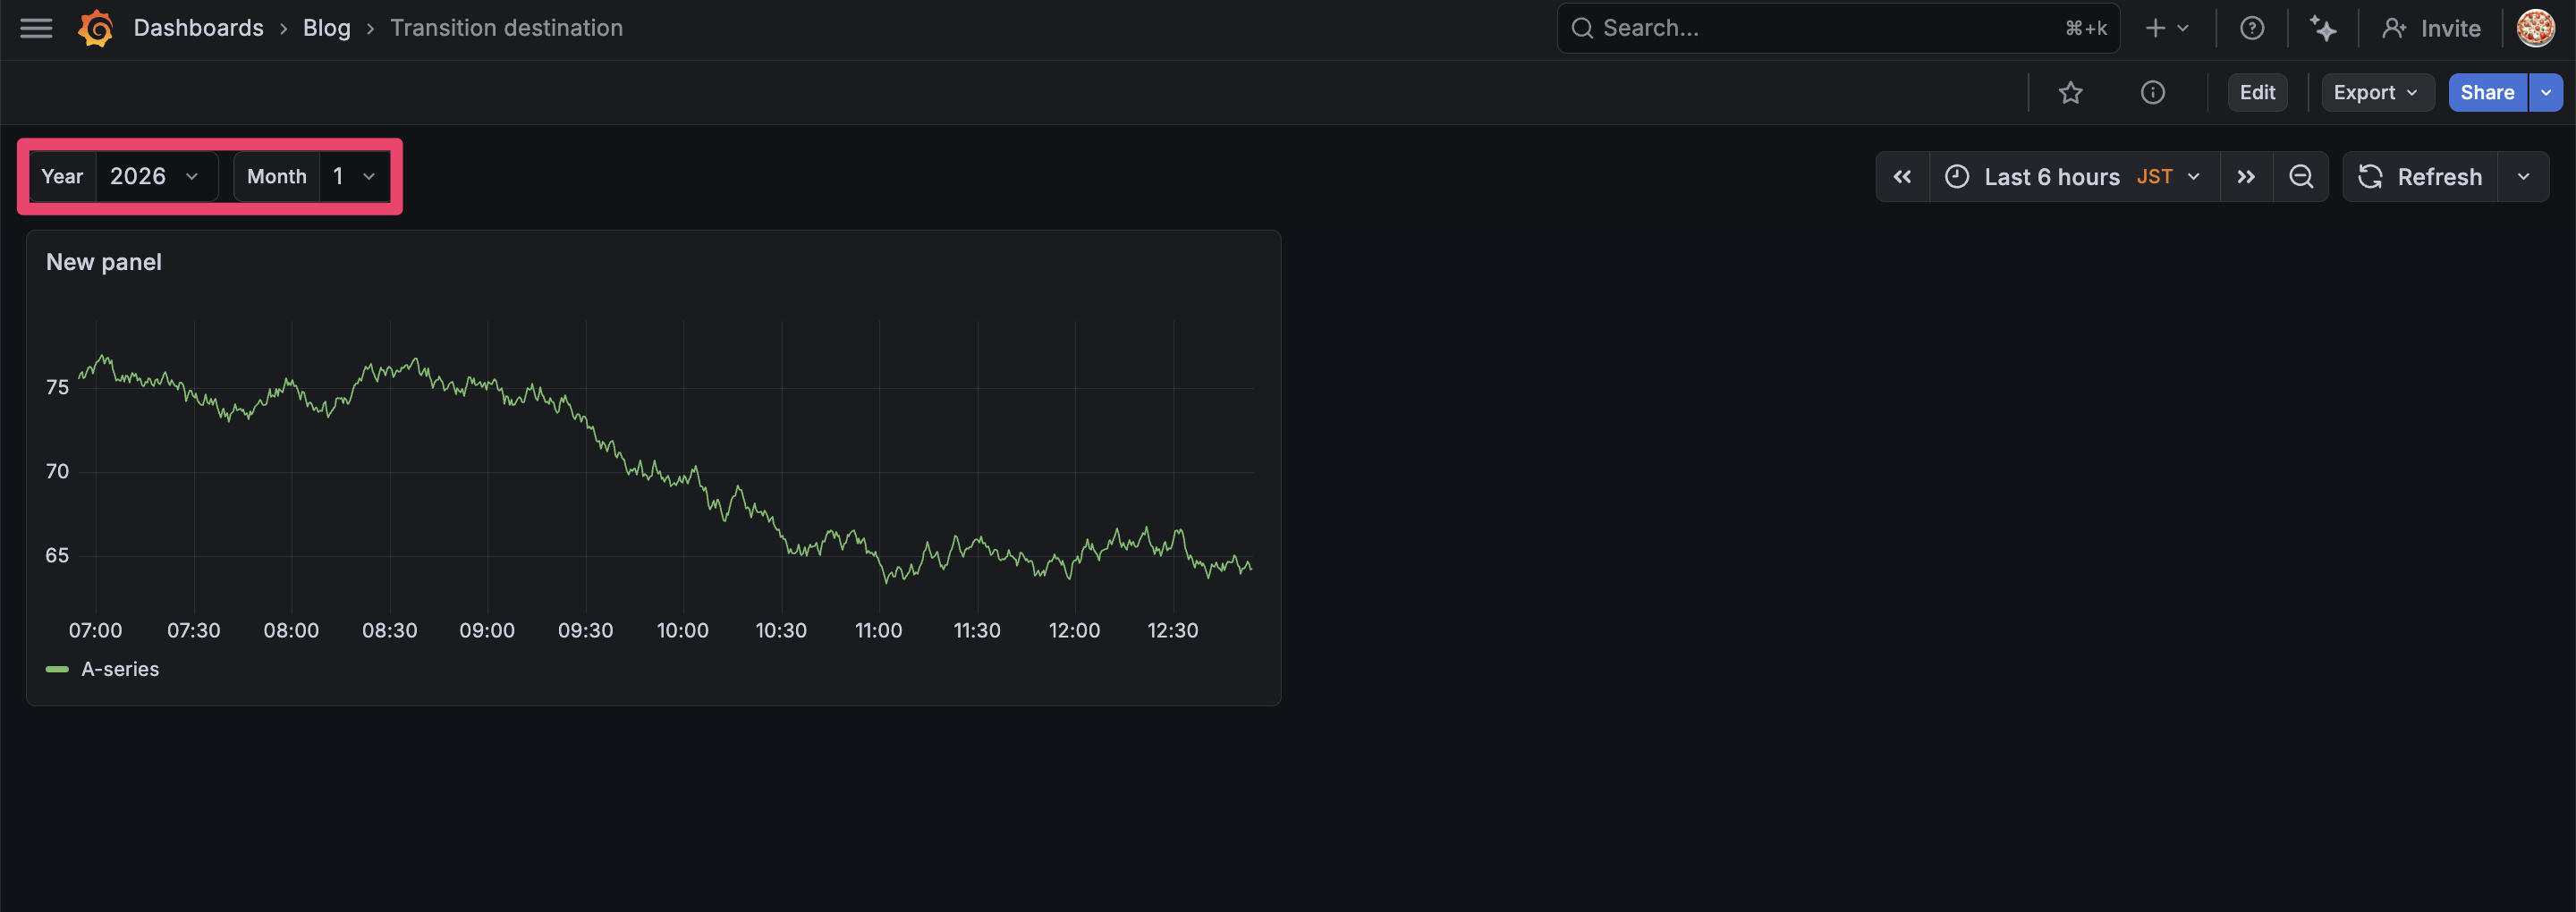
This is useful when you use the same variables across multiple dashboards.
I was curious about what happens when the variable settings differ between the source and destination, so I did some testing.
What happens if the variable names in the source and destination are different?
When I tried it, changing the variable name from Year to toshi in the destination did not carry over the value.
Well, this is as expected.
One more thing, what happens if the variable exists in the destination but the value doesn't?
For example:
- Source Year variable: "2024,2025,2026"
- Destination Year variable: "2024,2025"
Let's set the dashboard variables to year=2026 and month=1 and navigate.
As a result, the value 2026 was set in the destination dashboard's variable even though it shouldn't exist there.
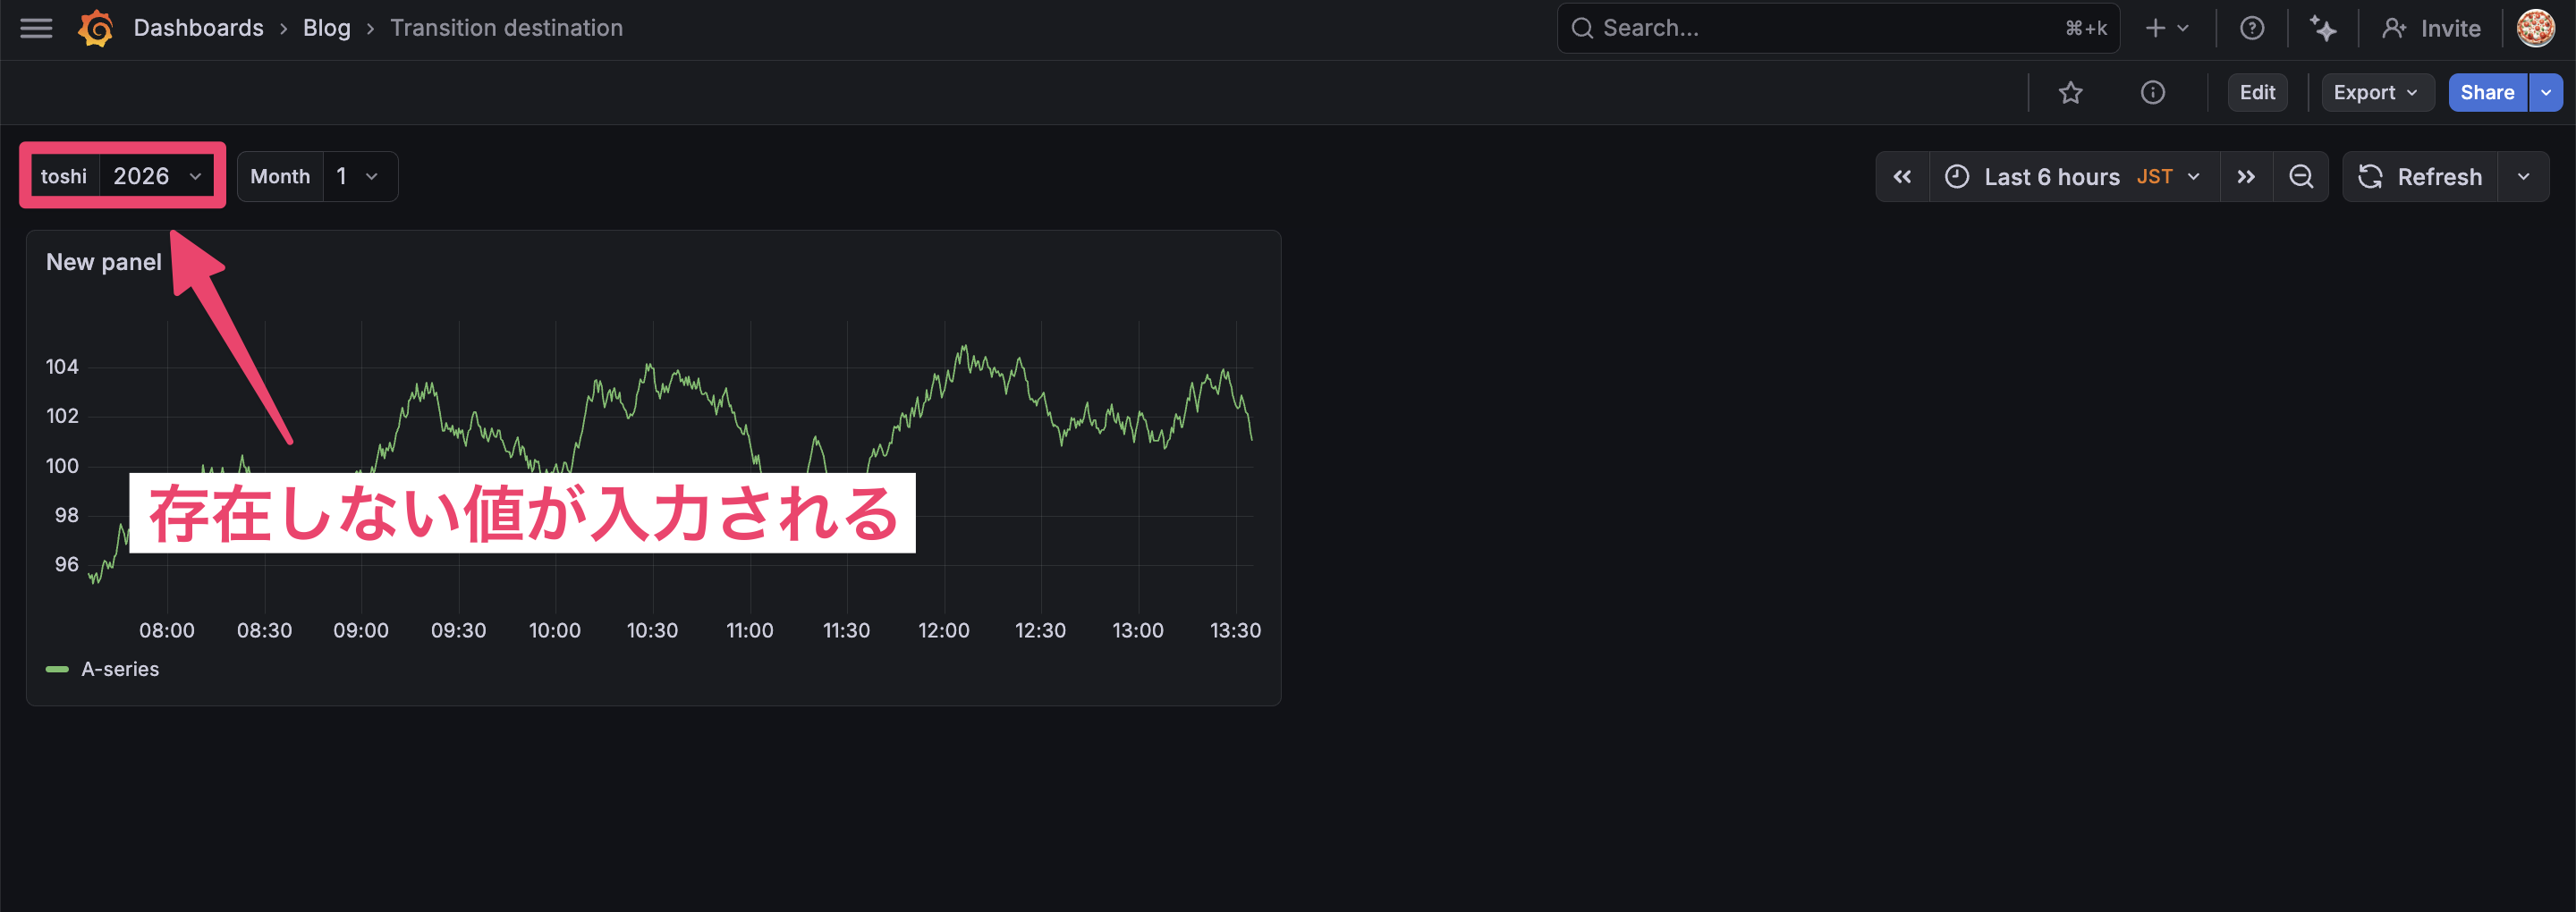
I found that the variable names must be exactly the same, and values are carried over even if they don't exist in the destination.
Open link in new tab
When enabled, the link opens in a new tab.
This is self-explanatory, so I'll skip the image.
It's good to enable this if you want to keep the original dashboard and open a new one in a separate tab.
Show in controls menu
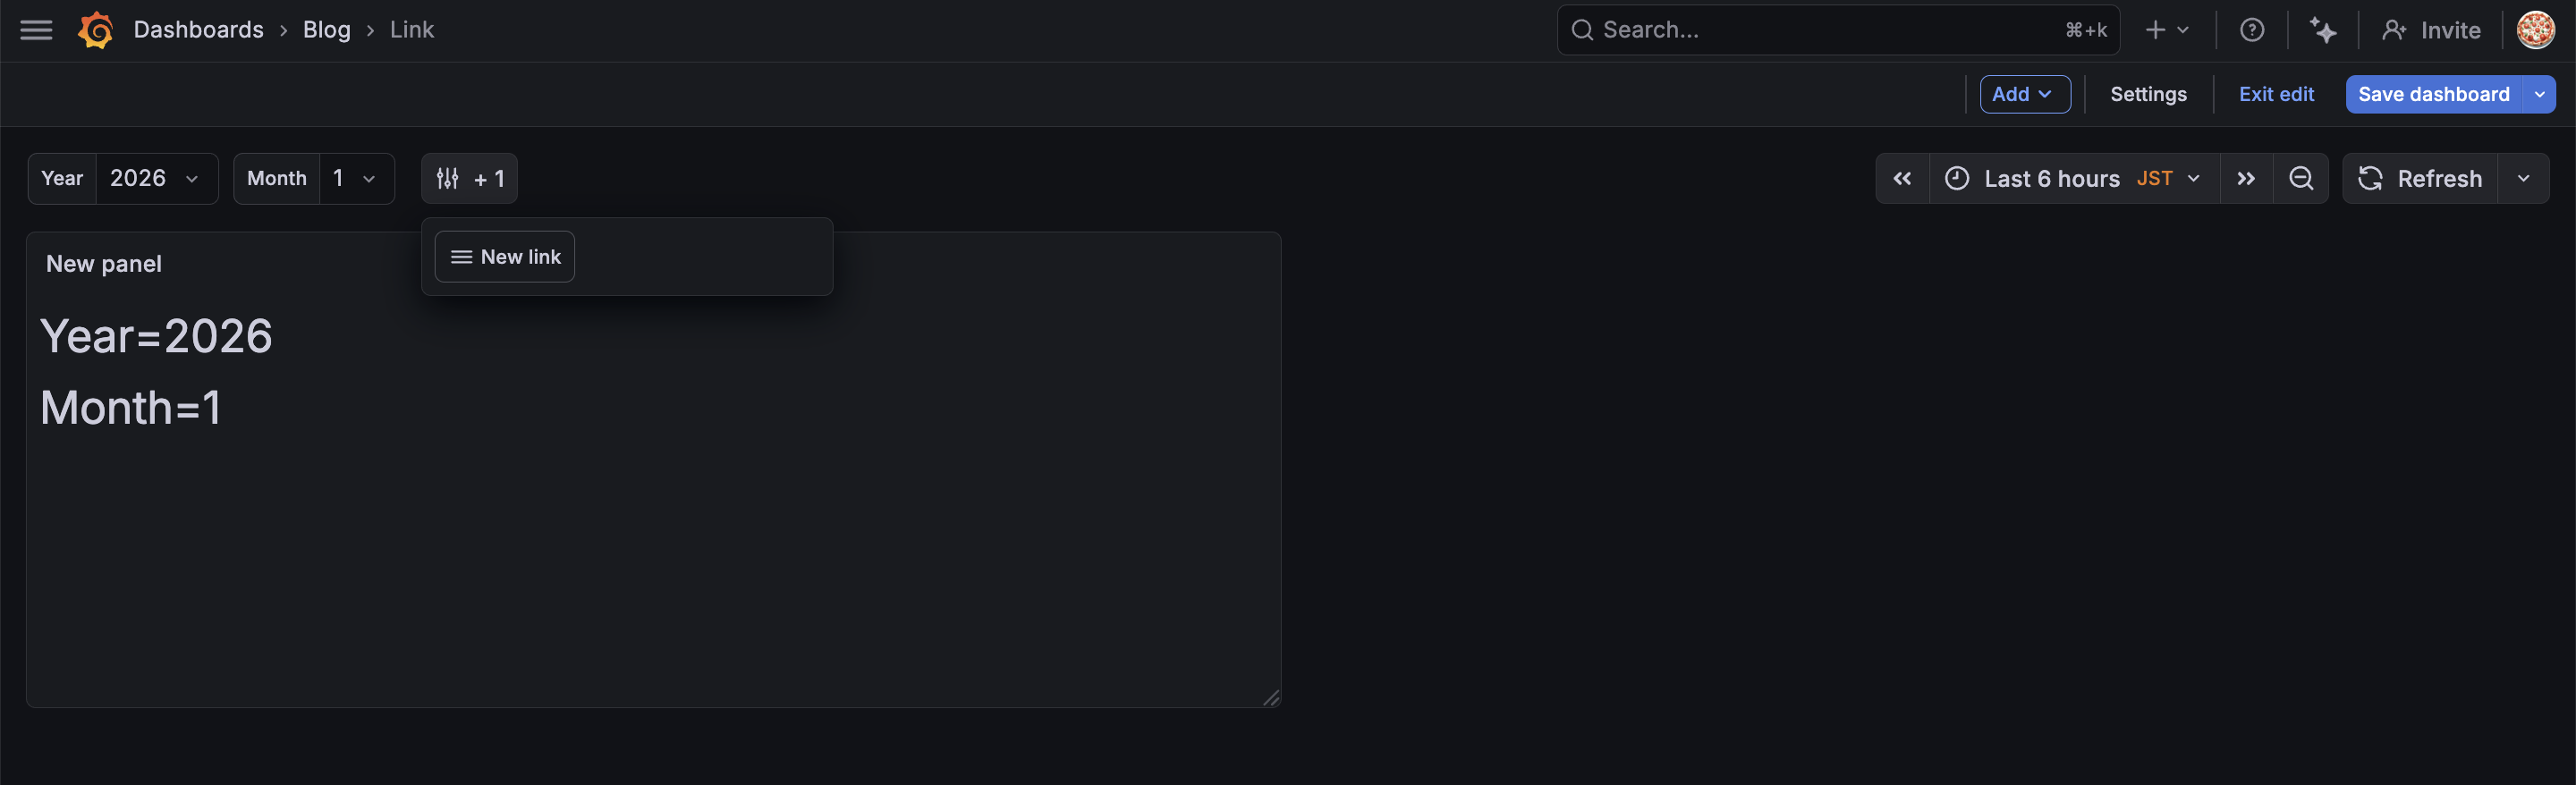
When enabled, the link appears in the controls menu at the top of the dashboard.
Let's try it!
When enabled, a controls menu is created.
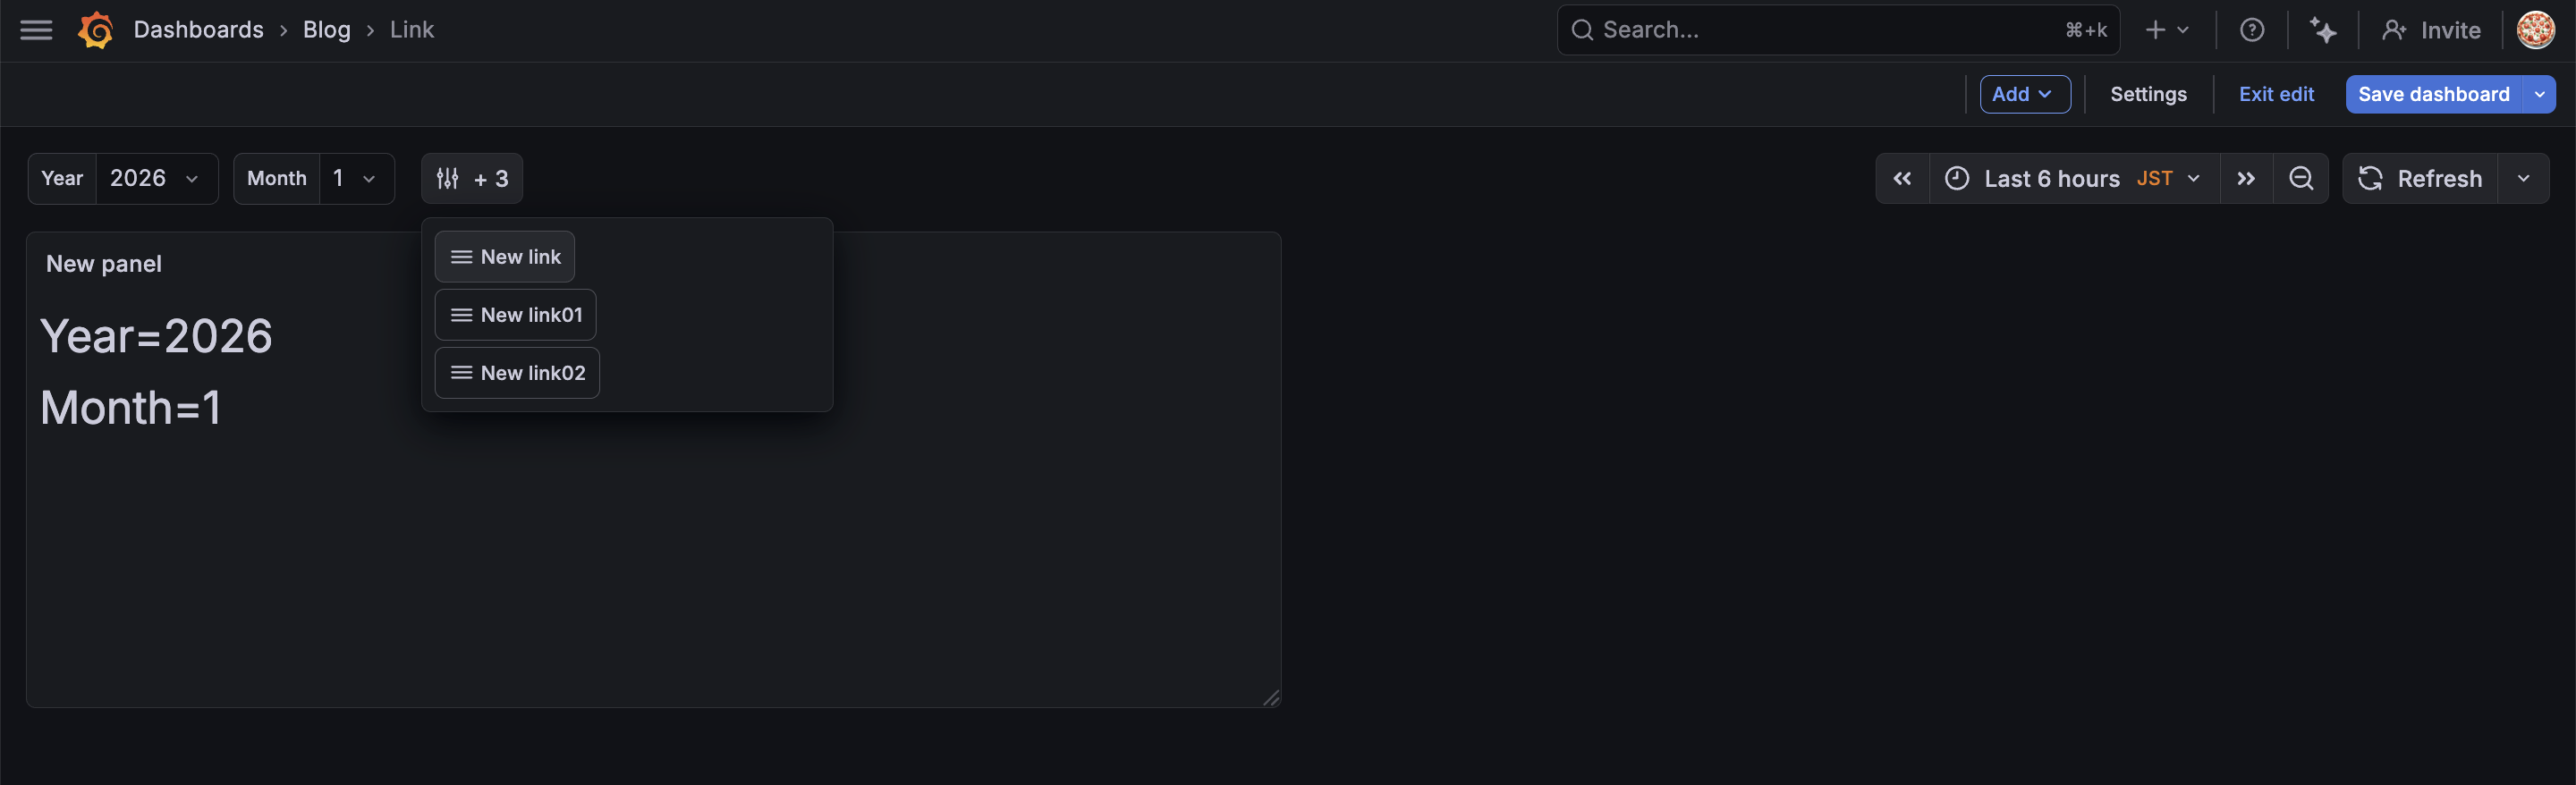
As shown in the image below, if you have multiple links and want to keep the top of the dashboard clean, it's good to enable this.
Link
Now let's look at the other Type, "Link".
Link creates a link to a specified URL.
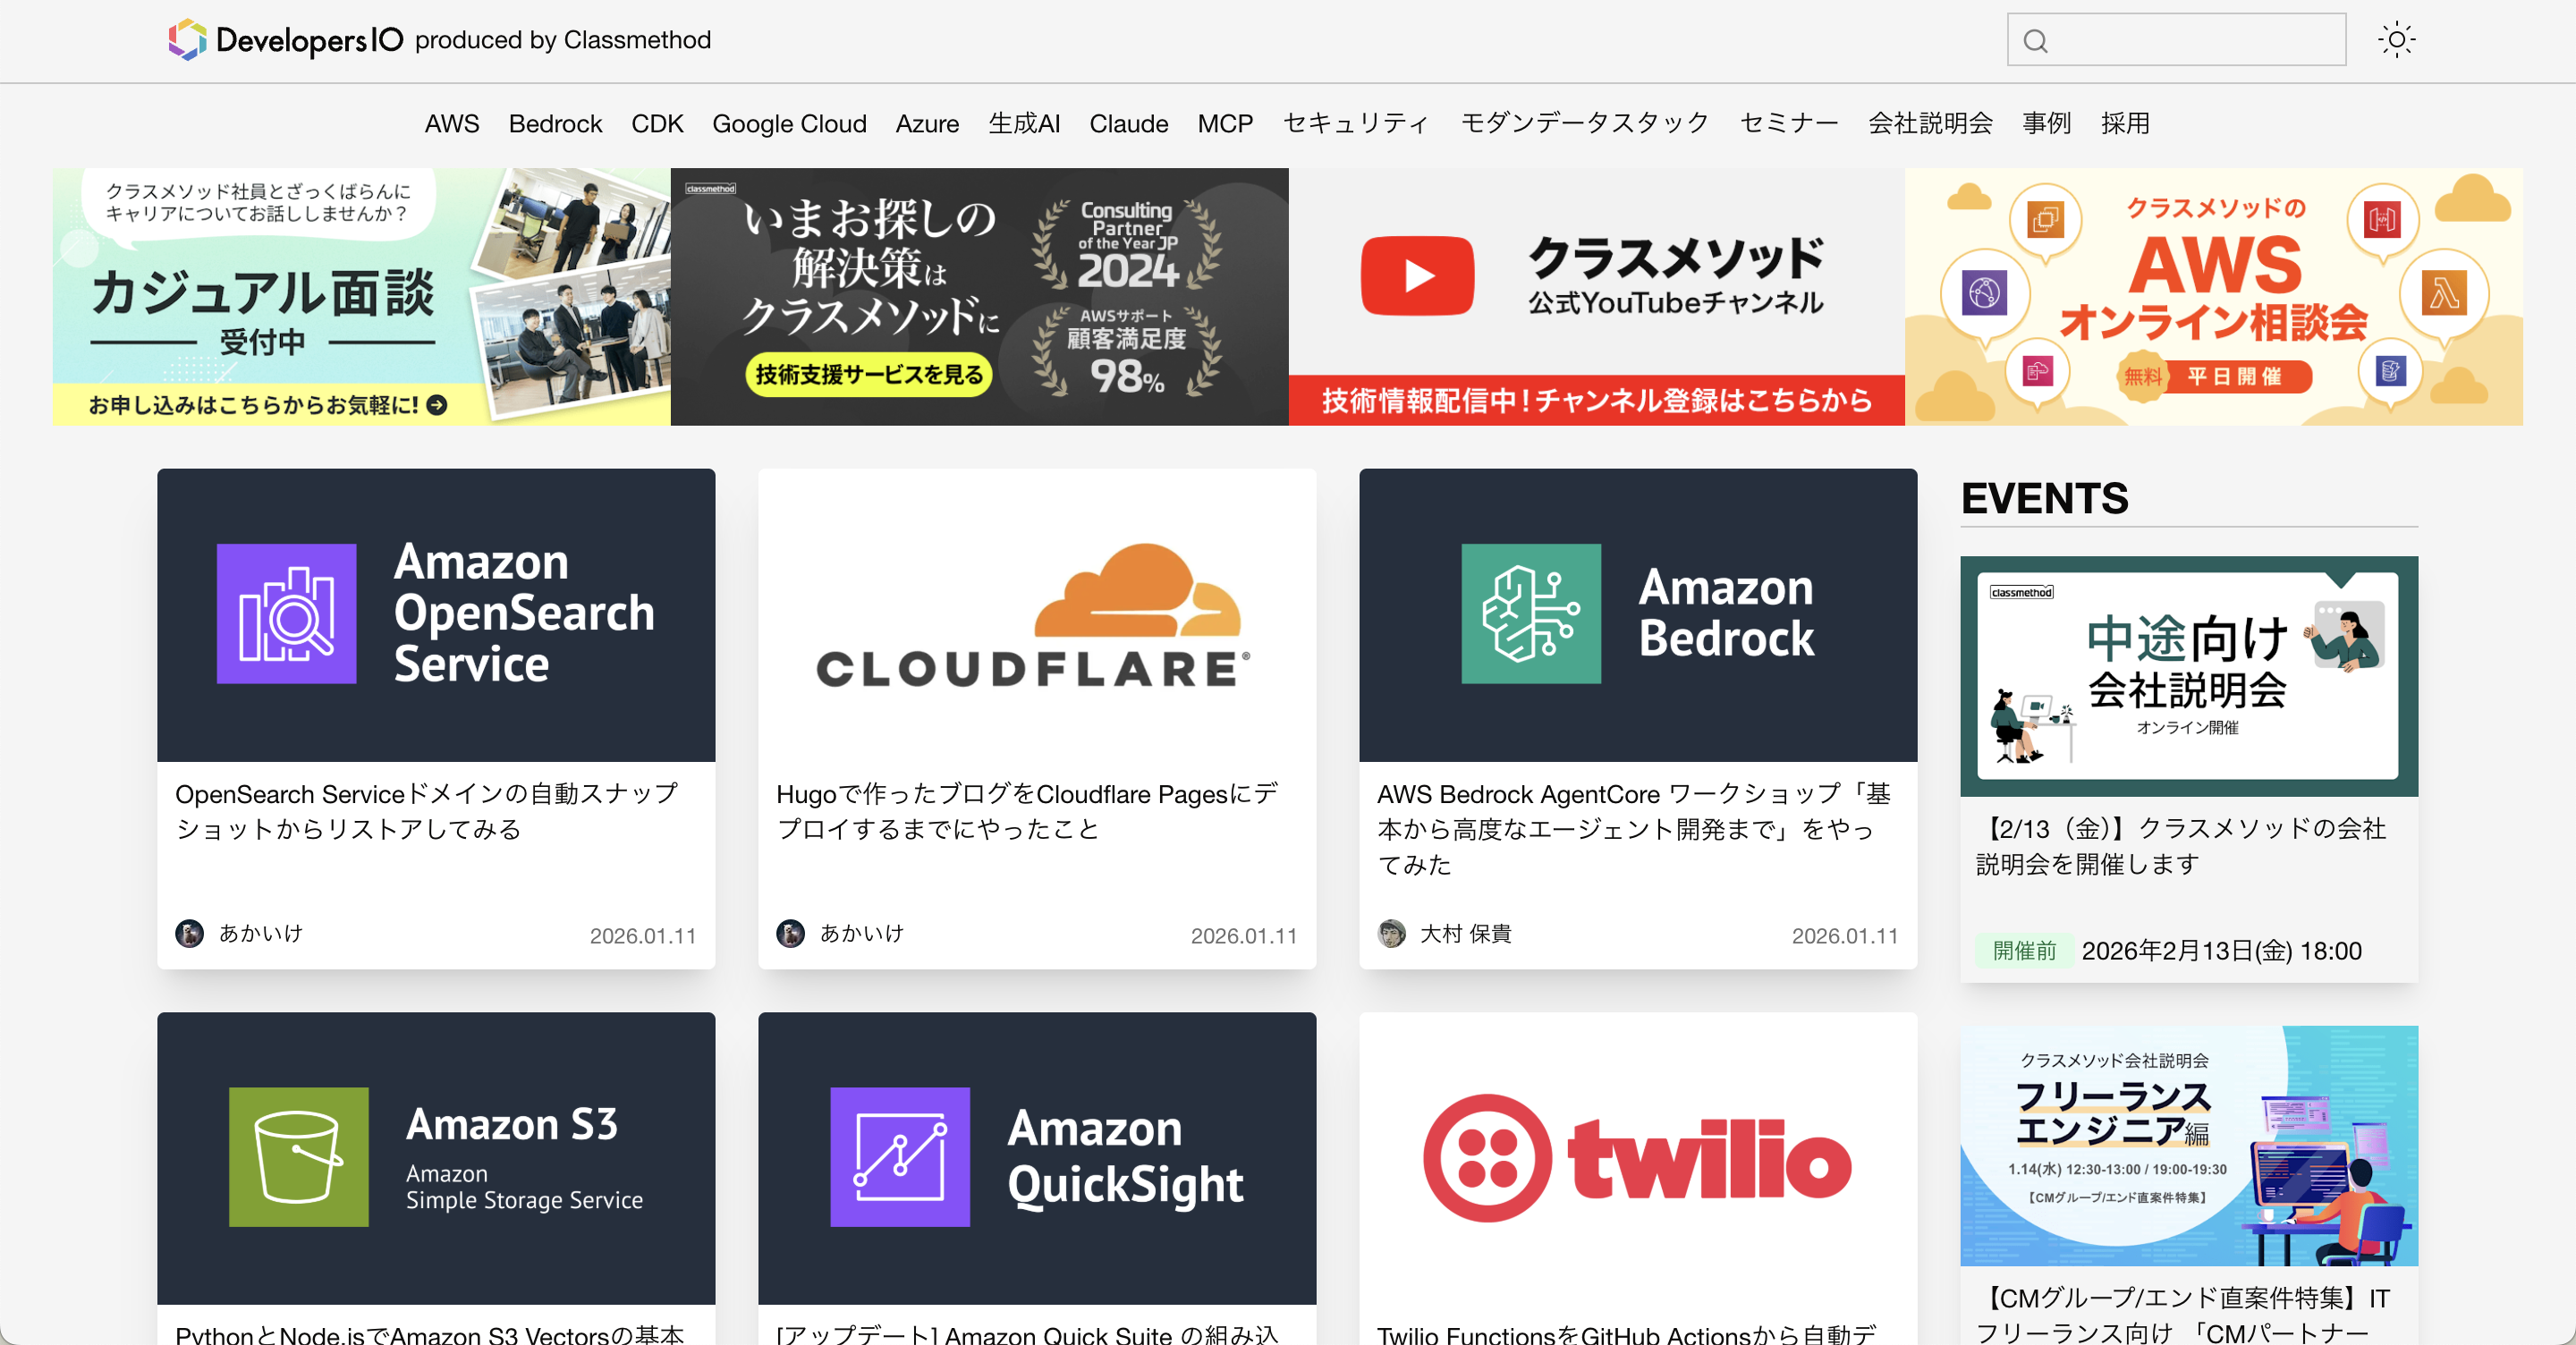
This requires at least a URL, so let's try it with DevelopersIO's URL, https://dev.classmethod.jp/, without setting any options.
When you return to the dashboard screen, a "Dashboard link" button appears at the top of the dashboard!
Let's click it.
DevelopersIO is displayed!
Use Link when you want to create a link to a specific dashboard or external site.
Now let's look at the options.
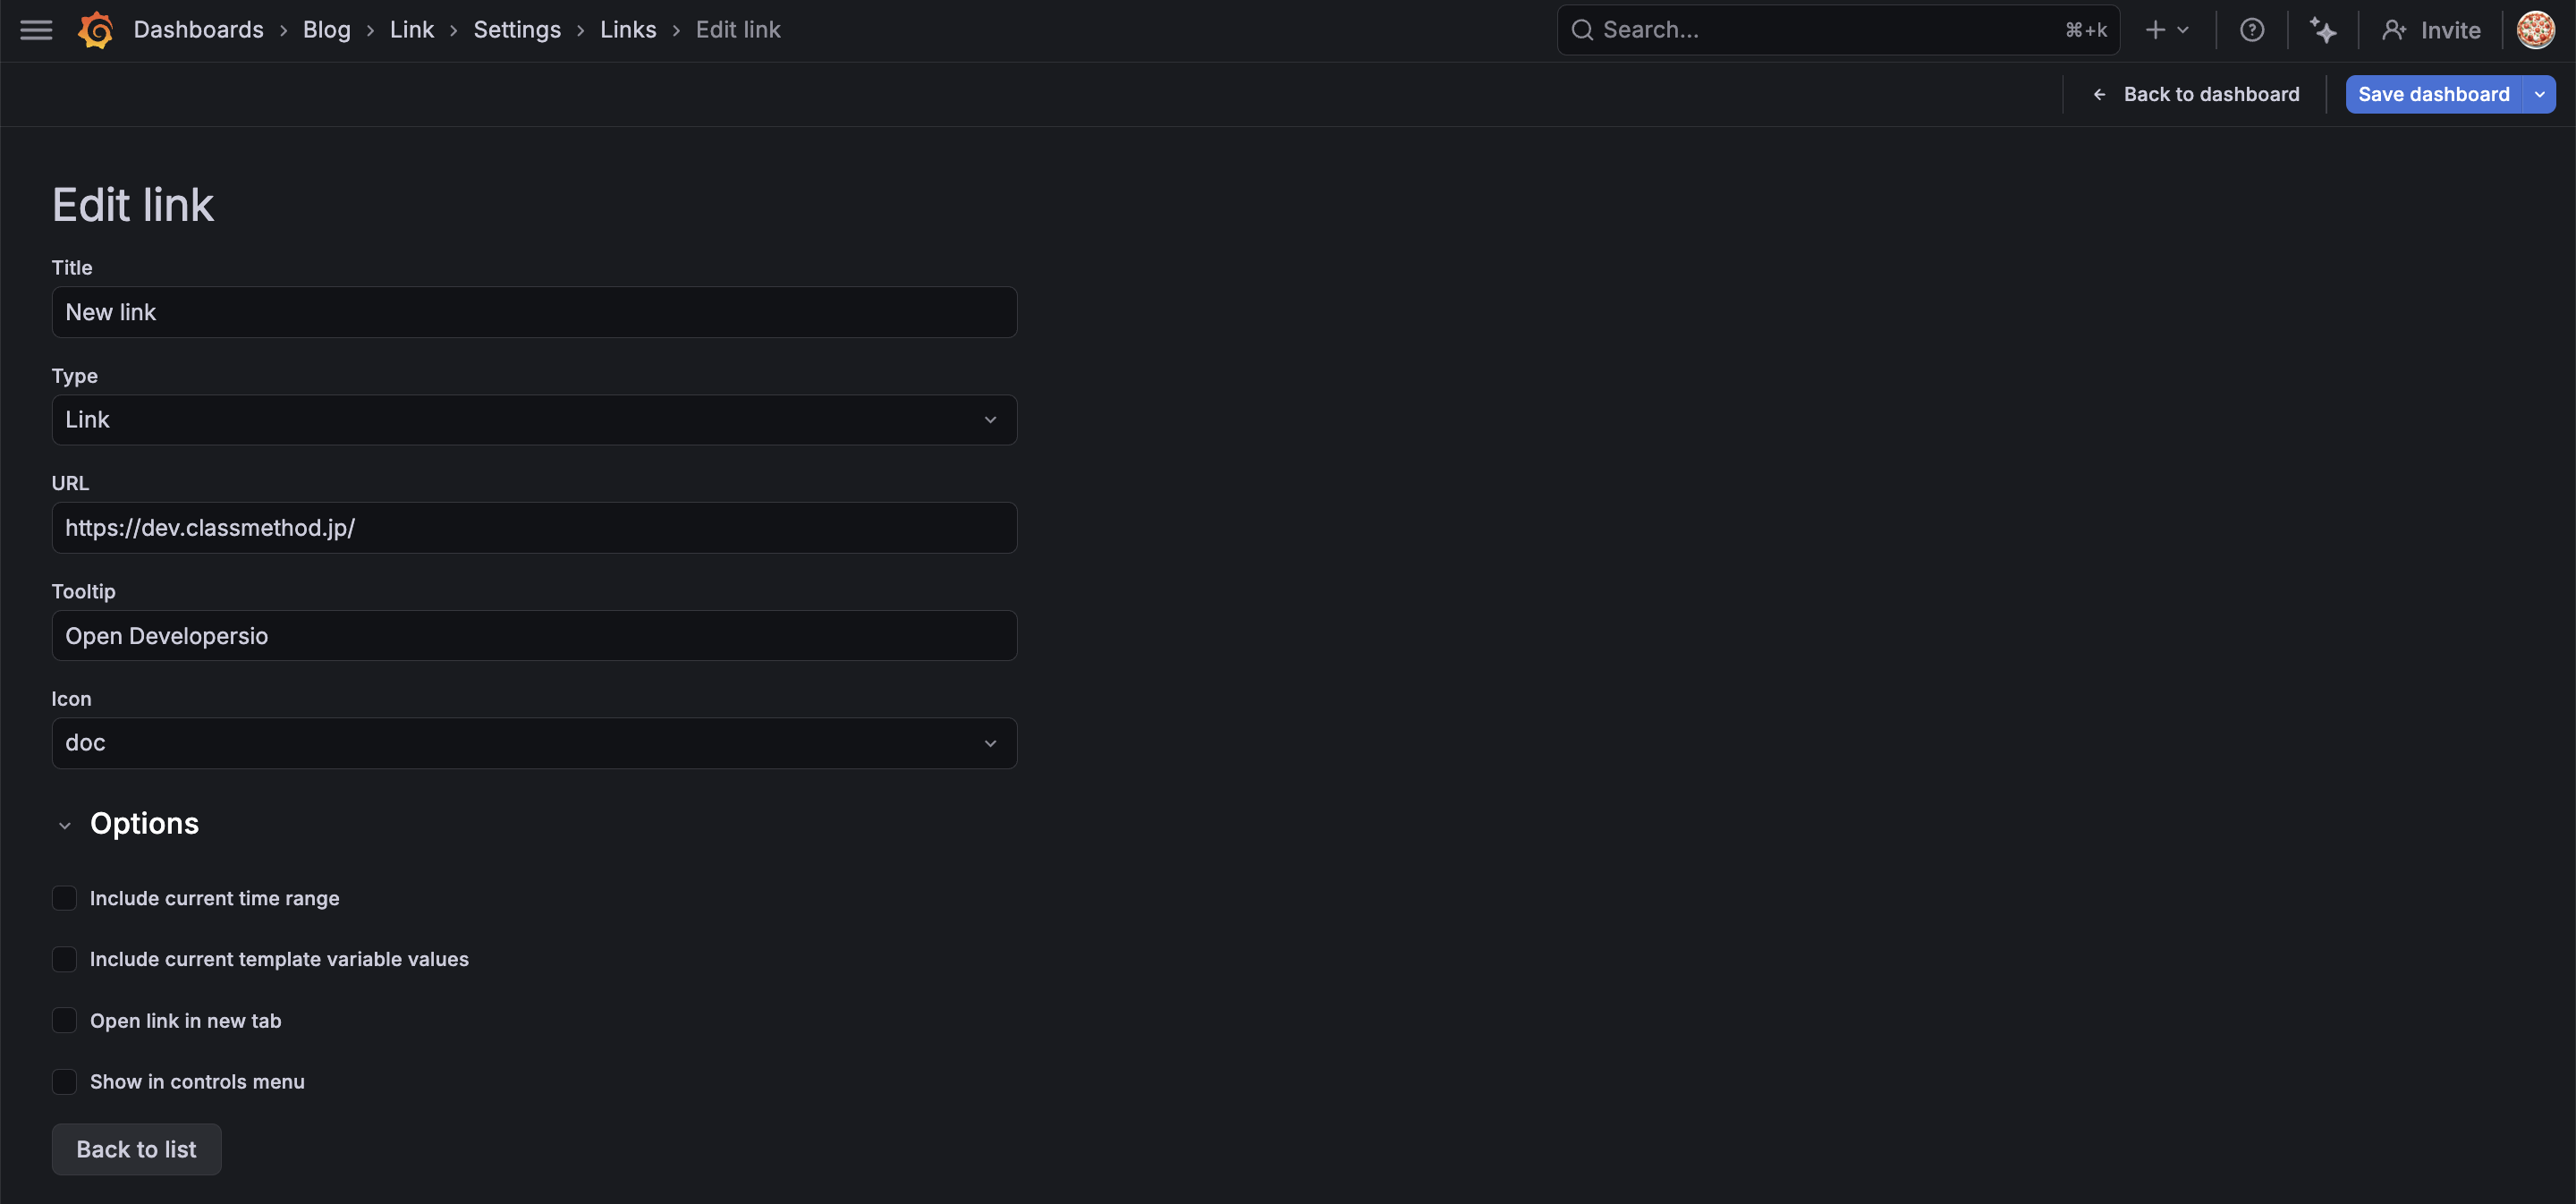
URL
URL specifies the destination URL.
Earlier we specified an external URL for DevelopersIO, but you can also create links to other dashboards within the same Grafana.
When linking to other dashboards, you can use relative paths.
/d/dashboardUID/dashboard-name
You can find the dashboard UID and name from the dashboard URL.
For example, if the URL is https://example.grafana.net/d/abc123/my-dashboard, the UID is abc123 and the dashboard name is my-dashboard.
You might wonder why we would use Link type to navigate to another dashboard when we can do that with the Dashboards type.
The strength of the Link type is that you can customize the URL freely.
For example, as shown in the practical example below, you can dynamically update variables using URL parameters like var-year=${__to:date:YYYY}.
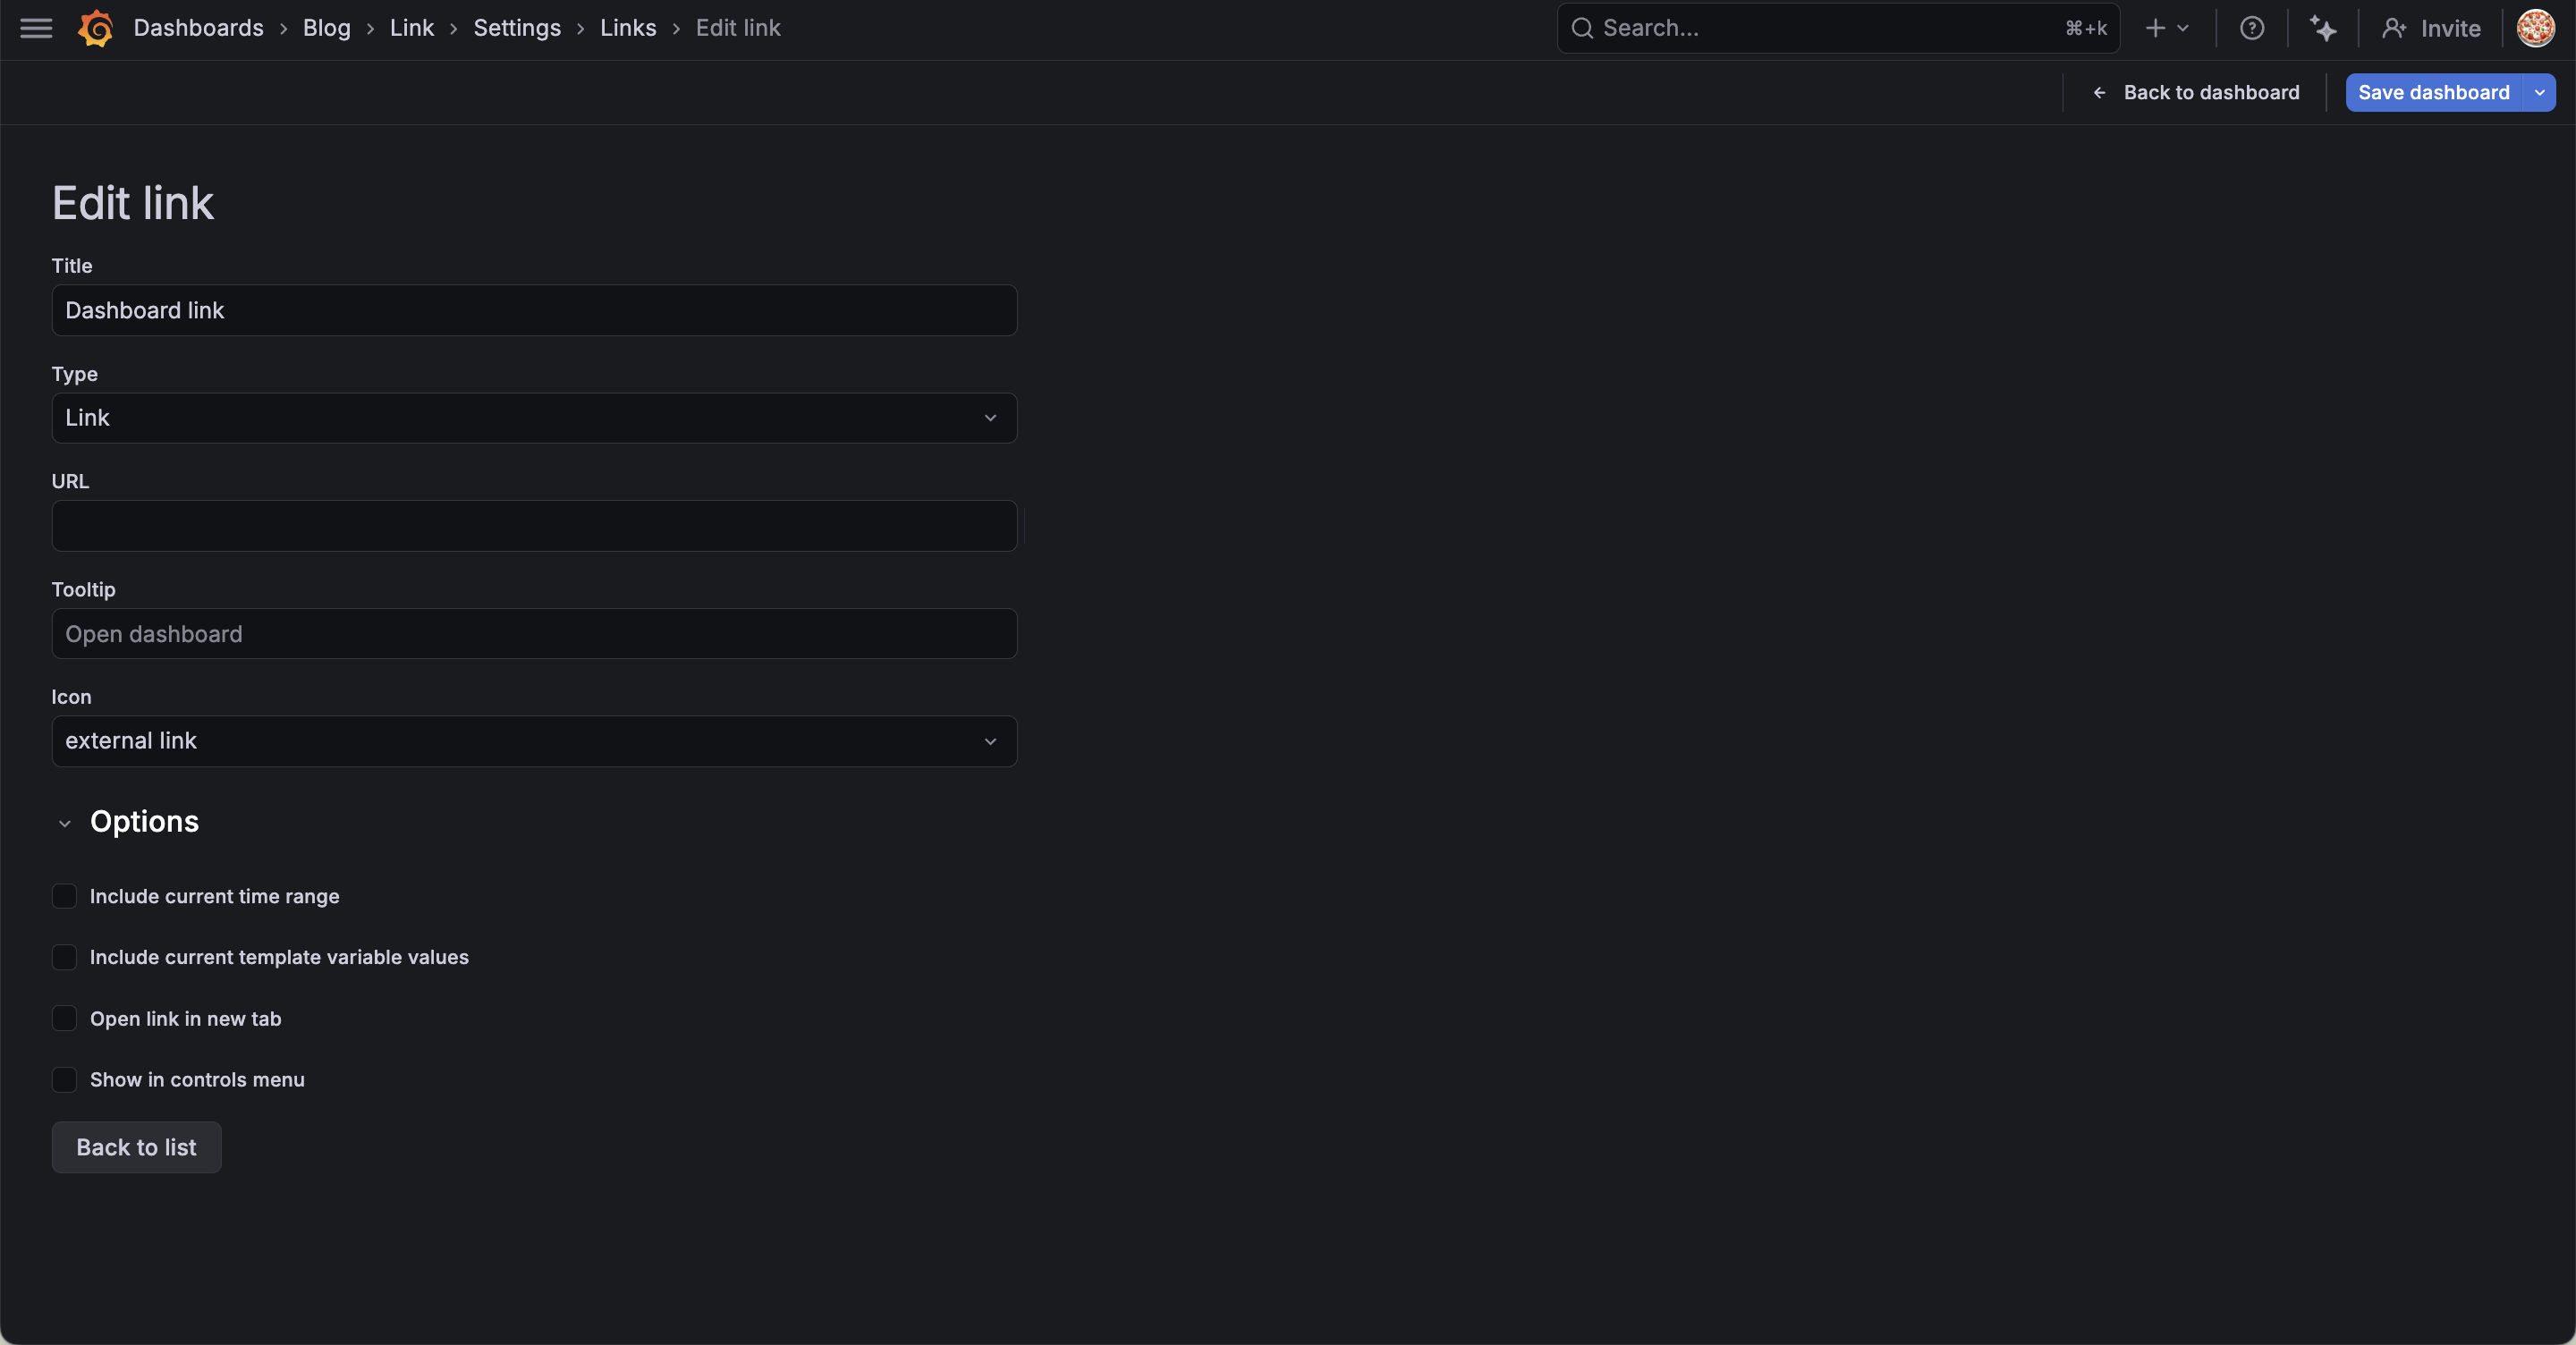
Tooltip, Icon
I'll introduce Tooltip and Icon together.
Tooltip is the explanation displayed when you hover the cursor over the icon on the dashboard.
Icon is the icon on the dashboard.
Let's try it.
It's a small change, but the icon has changed.
I couldn't capture the Tooltip explanation well in a screenshot, but an explanation is displayed when you hover the cursor over the icon.
For other options, refer to the explanations for Dashboard type as they are the same.
Updating Variable Values to Current Year and Month Using Link Type
As a practical example, let's create a "Link to update to the current year and month".
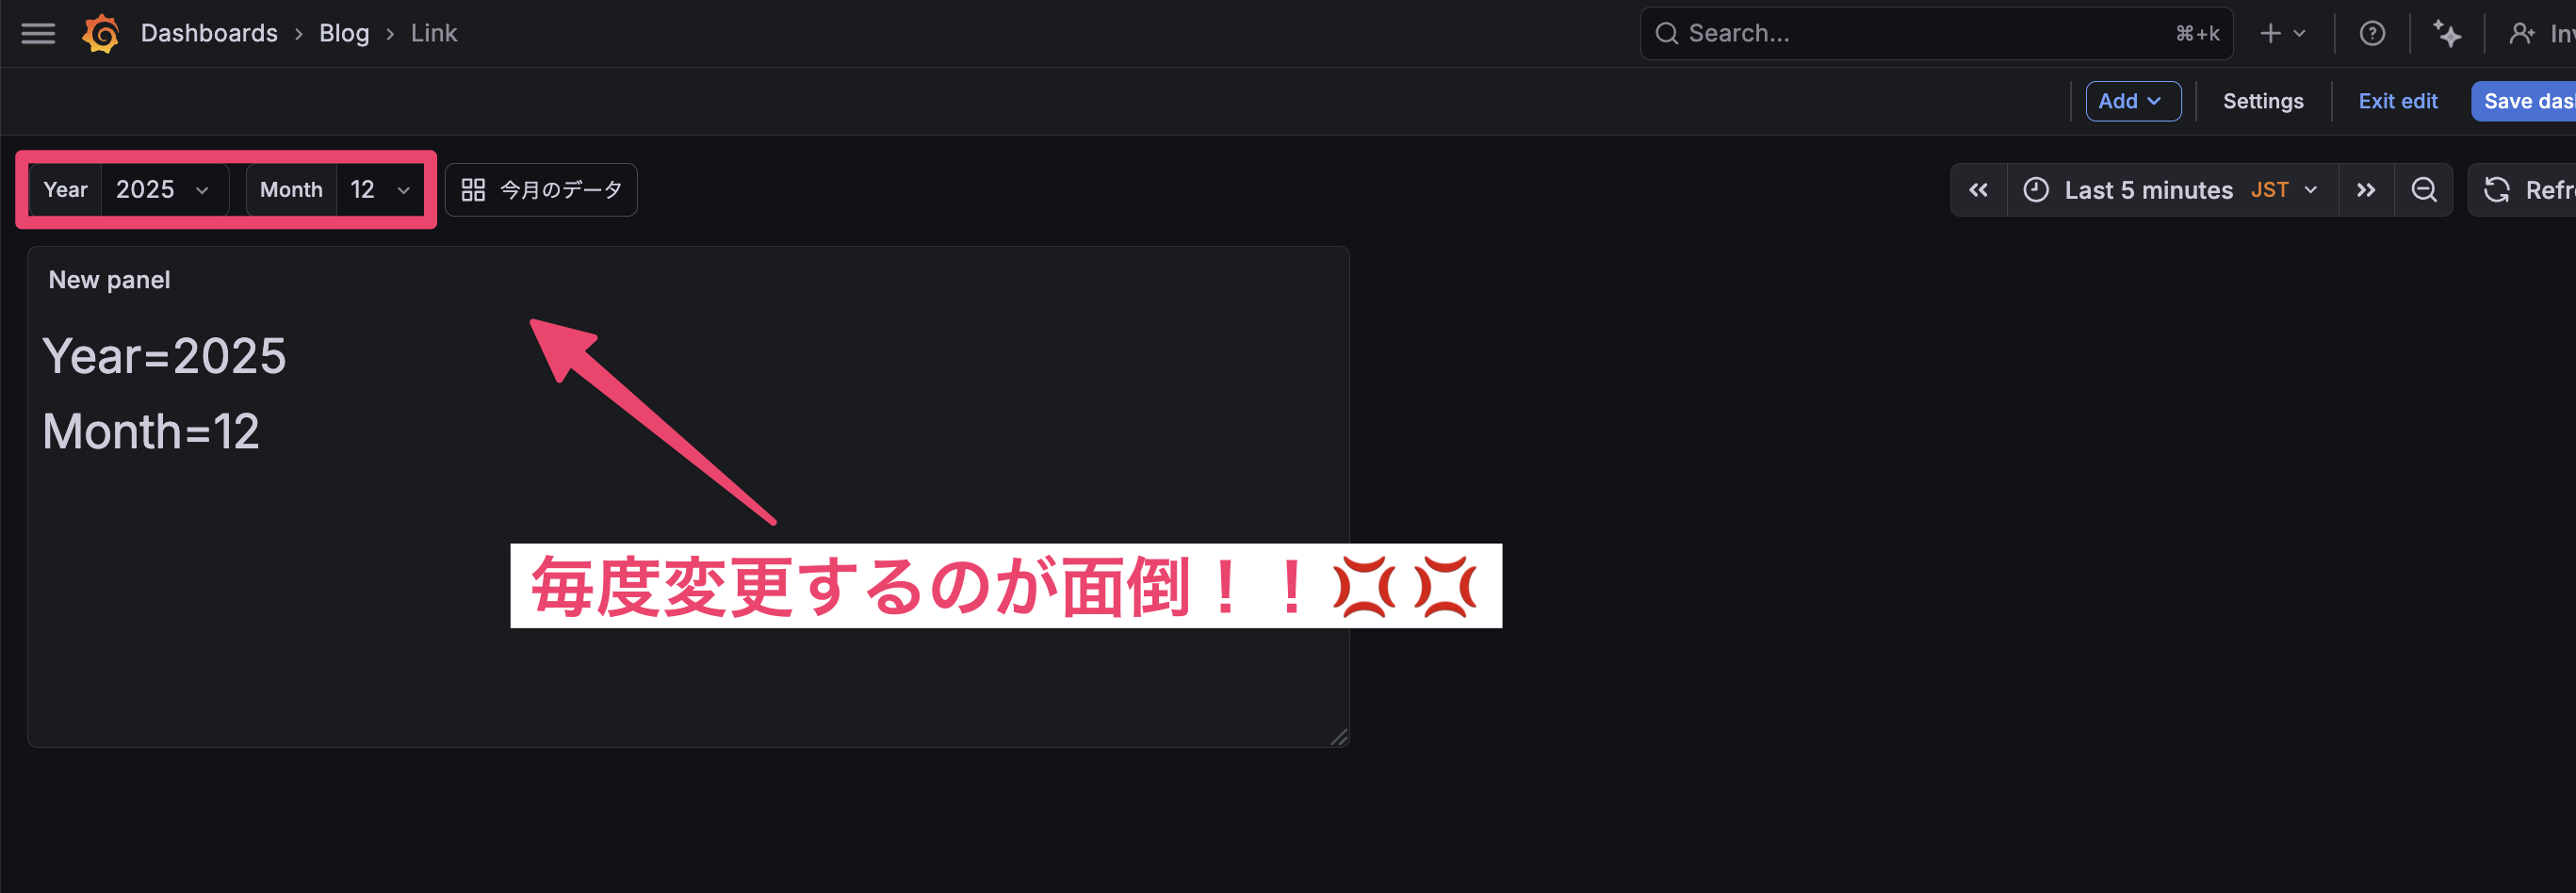
When analyzing data monthly, you often need to switch back and forth between past months and the current month.
Also, it's tedious for users with dashboard editing permissions to override default variables every time the month changes. (Users with only viewing permissions cannot change default variables)
The Link type is useful in such cases.
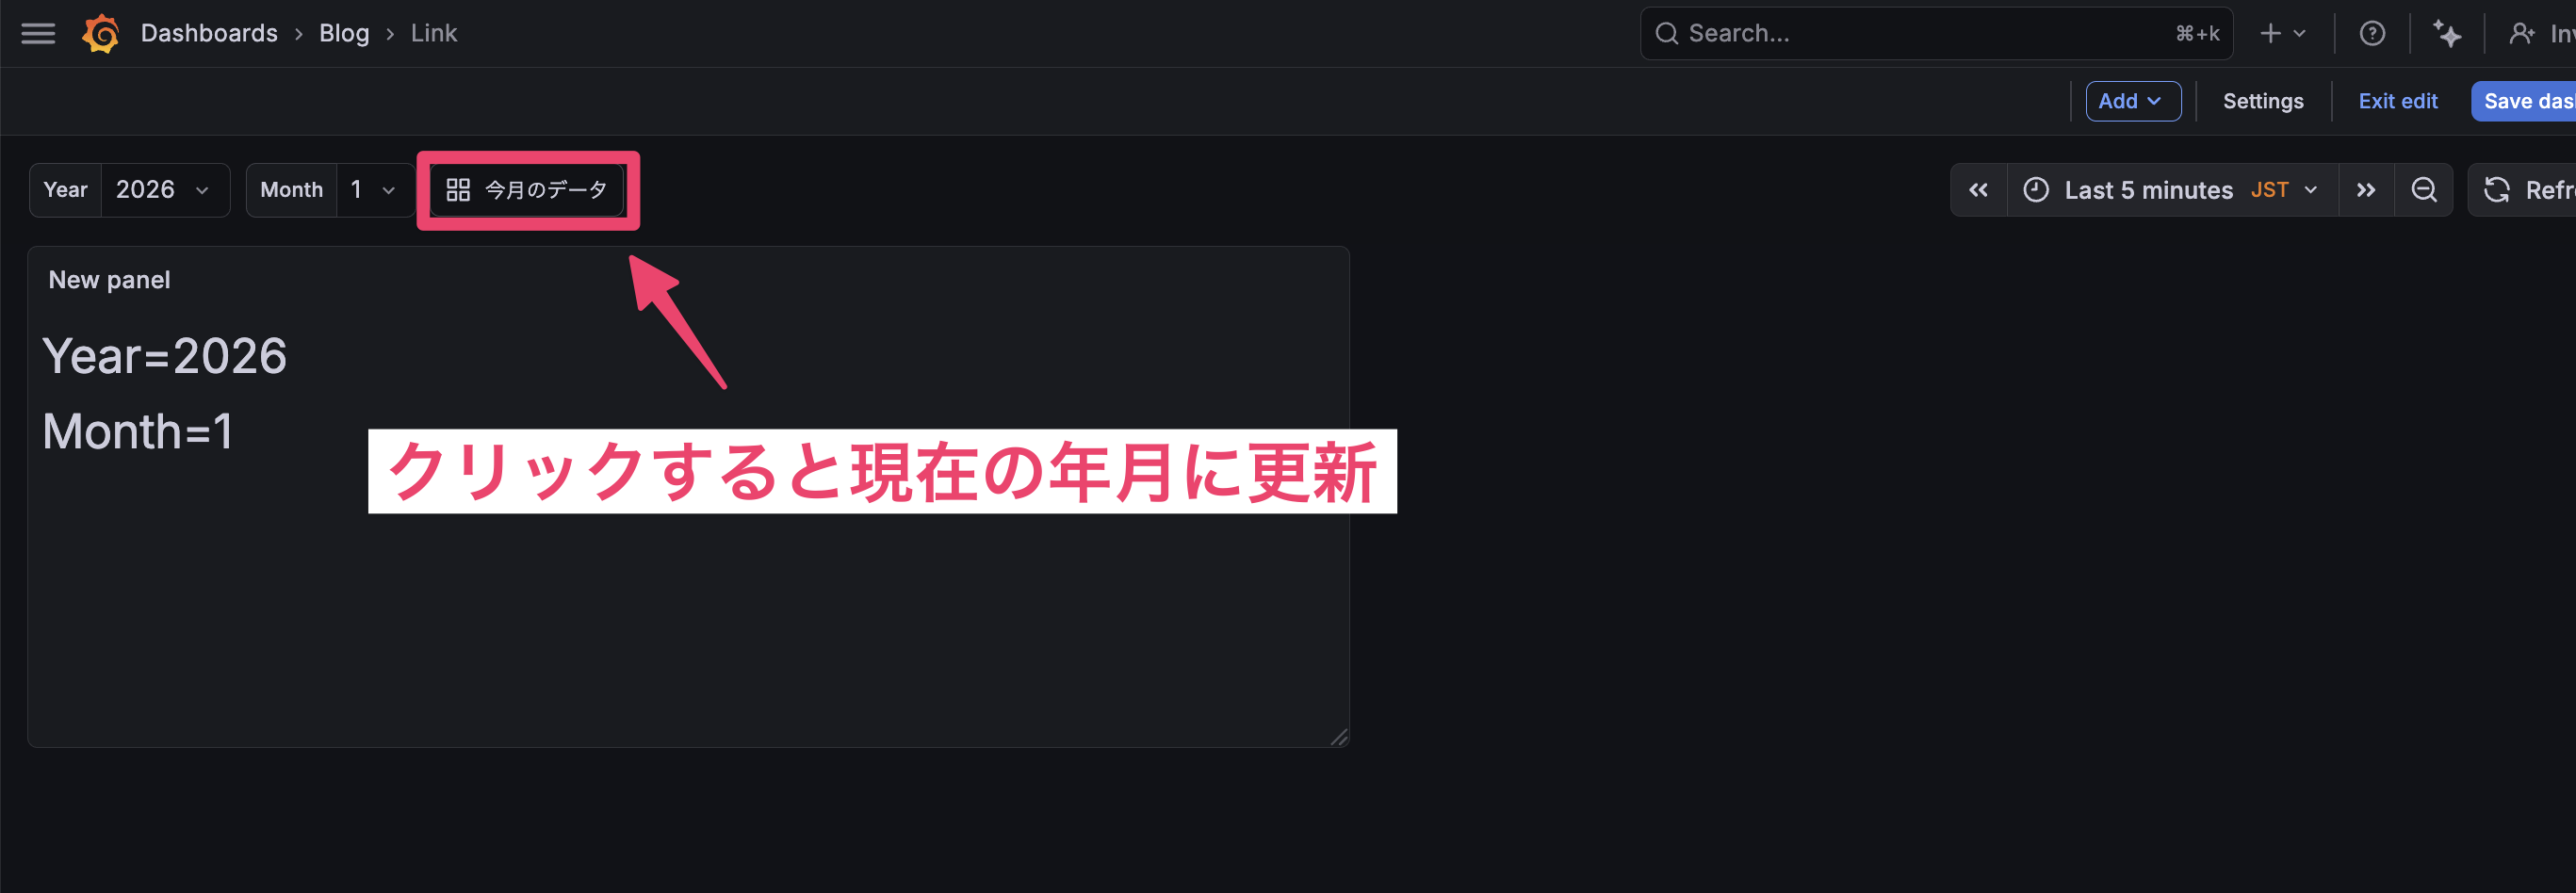
It would be nice to place a Link button next to the variables that updates the variables to the current year and month with just a click.
Let's try it.
Configuration
Add a link to Dashboard Links with the following settings:
| Item | Value |
|---|---|
| Type | Link |
| Title | Update to this month's data |
| URL | /d/dashboardUID/dashboard-name?orgId=1&var-Year=${__to:date:YYYY}&var-Month=${__to:date:M} |
| Tooltip | Updates to this month's data |
| Icon | Any |
| Include time range | On |
| Include variable values | Off |
| Open in new tab | Off |
| Show in controls menu | Off |
URL Explanation
You can update variables from the URL using the format var-variableName=value.
For example, var-Year=2026&var-Month=1 updates the Year variable to 2026 and the Month variable to 1.
To use the current year and month, I'm using Grafana's built-in time range variables to dynamically get the current year and month.
${__to:date:YYYY} gets the year from the end date of the time range.
${__to:date:M} gets the month from the end date of the time range.
If the time range is "Last 6 hours" and the current date is January 12, 2026, ${__to:date:YYYY} will be "2026" and ${__to:date:M} will be "1".
Note that these variables get values from the time range specified in the dashboard, not the absolute current time.
Verification
Let's click the "Update to this month's data" link with year=2025, month=5 selected.
The variables are updated based on the end date of the time range!
Now even users with only editing permissions can easily adjust to the current year and month.
It's nice to be able to update variables with just a button press, without navigating away from the tab.
Since the Dashboards type can't navigate (update) a dashboard by specifying a URL, use the Link type.
Summary
In this article, I've gone through each configuration item for Grafana's Dashboard Links.
If you're using Grafana but always return to the dashboard home to navigate between dashboards, please try using Links.
Also, if you want to dynamically change variables based on URLs without moving your browser tab, consider using the Link type.