![[Update] I tried natural language log analysis with the new "amazon-opensearch-service" skill in Agent Toolkit for AWS](https://images.ctfassets.net/ct0aopd36mqt/wp-thumbnail-b383cfad7452c18278d4772c71cae640/70681da1d5cfd4b8d3a7edcc29830075/amazon-opensearch-service?w=3840&fm=webp)
[Update] I tried natural language log analysis with the new "amazon-opensearch-service" skill in Agent Toolkit for AWS

This page has been translated by machine translation. View original
This is Ishikawa from the Cloud Business Division. The "amazon-opensearch-service" skill in Agent Toolkit for AWS, which supports Amazon OpenSearch Service / Amazon OpenSearch Serverless, covers five functional areas: Migration, Operations, Search, Log analytics, and Trace analytics. This time, I tried out "Log analytics" in a Claude Code + OpenSearch Serverless NextGen environment.
Amazon OpenSearch Service has announced support for Agent Toolkit for AWS. The AWS MCP Server, a managed remote MCP server, handles AWS API calls, while the amazon-opensearch-service skill, a curated knowledge package, routes natural language requests to the appropriate functional area, enabling AI coding agents such as Claude Code, Kiro, and Cursor to build, manage, and query OpenSearch domains and OpenSearch Serverless collections.
In the previous article, I tried skill retrieval at runtime (search_documentation → retrieve_skill) and building a next-generation (NextGen) OpenSearch Serverless vector search environment. This is the sequel to that article. I will introduce the skill using the officially recommended aws-data-analytics plugin, and verify how accurately the skill guides responses by actually sending natural language prompts to each functional area against the environment built previously.
What is the amazon-opensearch-service skill?
The skill itself is a Markdown package that bundles routing definitions (SKILL.md) and references for each functional area (procedures, PPL query templates, report templates). The agent evaluates the request in the first "Step 0" and determines which of the 5 capabilities it belongs to, then loads only the entry point for that capability to perform the work. This design minimizes the agent's context consumption relative to the breadth of 5 areas.
The skill also defines guardrails called "universal rules" across the entire skill. These include prohibitions on cost estimation (directing users to https://calculator.aws instead), prohibitions on outputting credentials and account IDs, always selecting one primary recommendation in A/B decisions, and prohibitions on marketing-style vocabulary.
Let's try it out
Prerequisites
- Test environment: ap-northeast-1, Claude Code + aws-data-analytics plugin v1.1.0 (mcp-proxy-for-aws@1.6.3)
- Pre-built OpenSearch Serverless NextGen environment (collection group: blog-nextgen-cg, VECTORSEARCH collection: blog-nextgen-vec, 40 AWS service descriptions + 1024-dimensional vectors using Titan Text Embeddings V2 already ingested, scale-to-zero configuration)
The following materials were also prepared for log analytics verification.
- Logs: 387 application log entries for a mock e-commerce Web API. An incident is embedded where /api/checkout returns 500 errors due to lock contention on payment-db, occurring from 2026-07-20 17:00 to 17:30 UTC.
Installing the skill and verifying connectivity
Install the plugin using the command described in the official documentation and reload.
/plugin install aws-data-analytics@claude-plugins-official
/reload-plugins
✔ Successfully installed plugin: aws-data-analytics@claude-plugins-official (scope: user)
Reloaded: 3 plugins · 7 agents · 1 plugin MCP server
This alone installs 8 skills including amazon-opensearch-service along with the connection settings for the AWS MCP Server. As a connectivity check, I sent the following prompt.
List the OpenSearch Serverless collections in ap-northeast-1
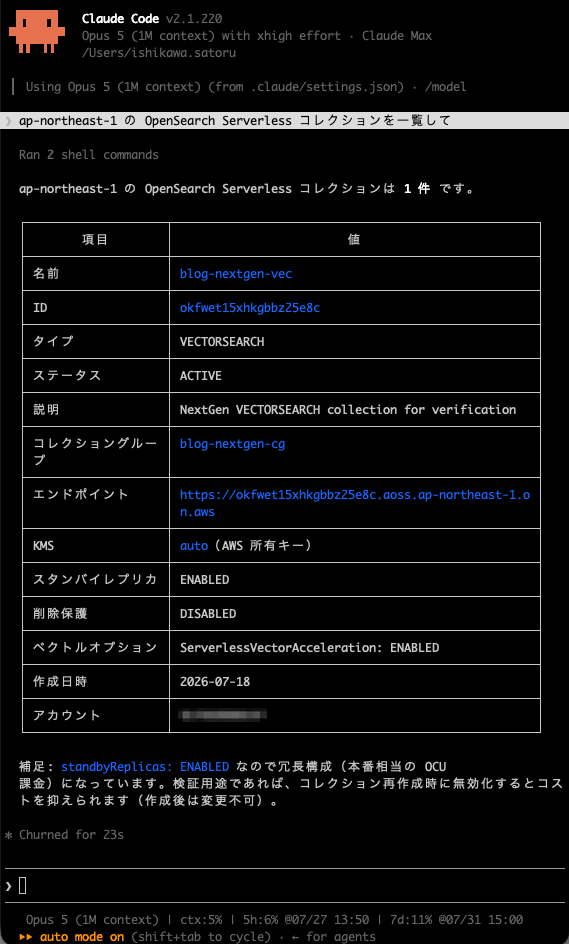
The API call with SigV4 authentication was executed via the MCP call_aws tool. I also confirmed that even without the plugin installed, runtime retrieval works by discovering the skill with search_documentation and loading it with retrieve_skill.
Log analytics: Investigating an incident with PPL (Piped Processing Language)
Prompt
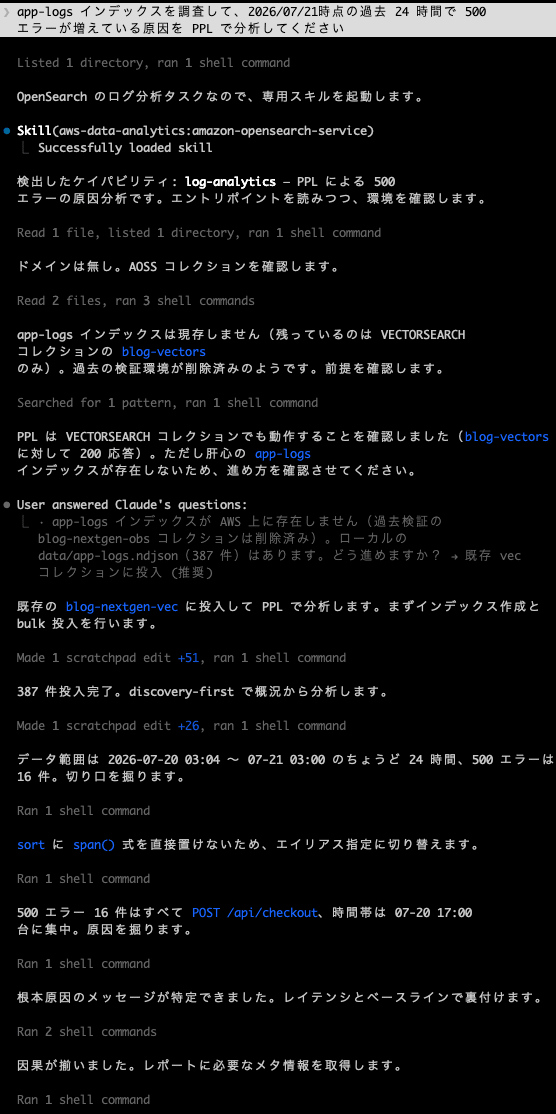
Please analyze the app-logs index using PPL to identify the cause of the increase in 500 errors over the past 24 hours as of 2026/07/21
app-logs incident analysis report
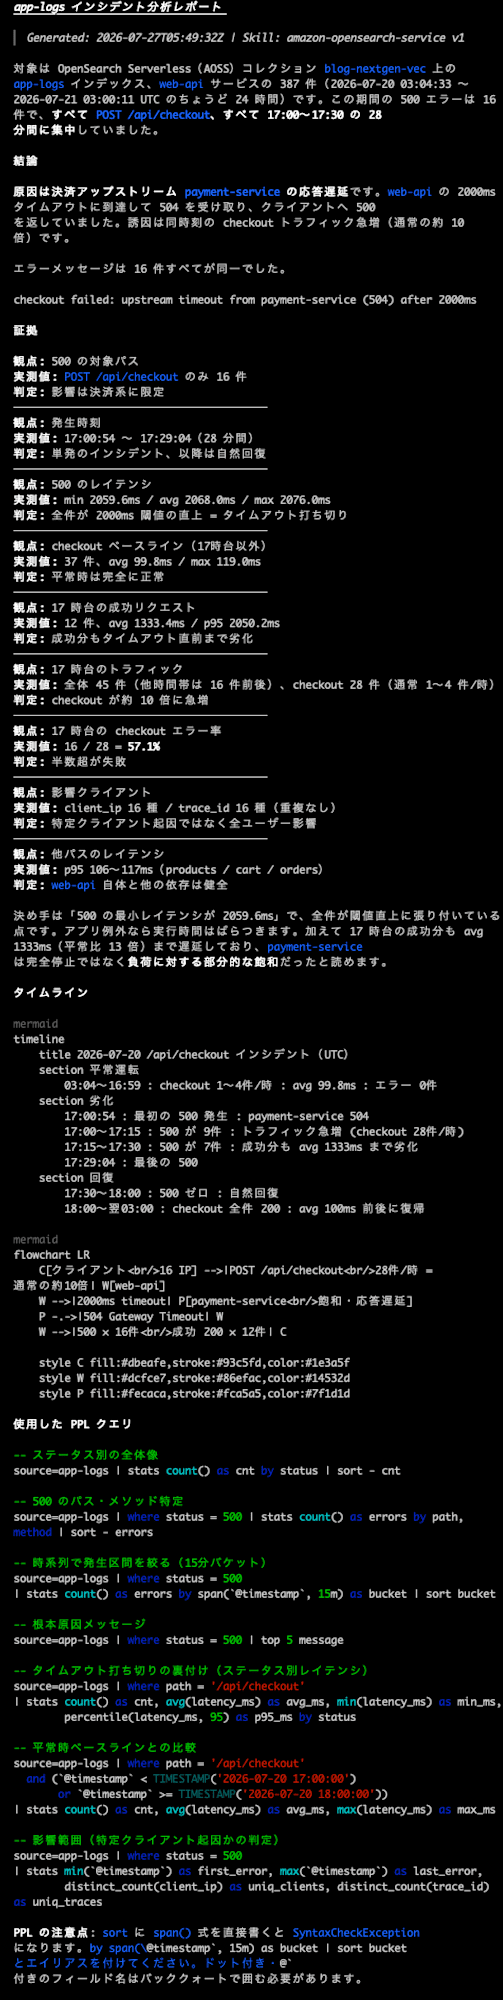
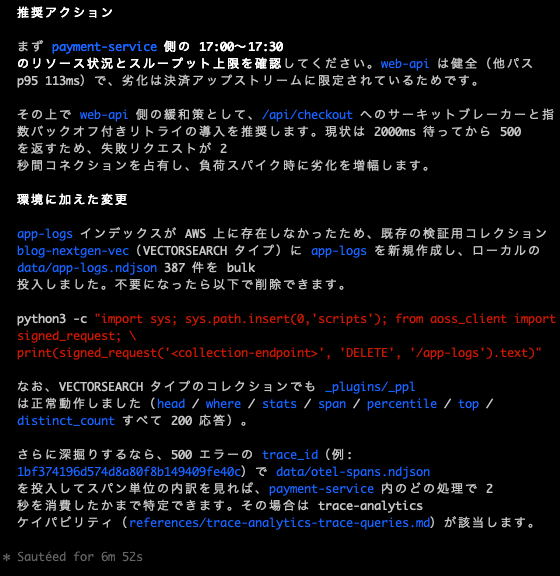
The capability is LOG-ANALYTICS. The log-analytics-guide.md is structured around a discovery-first workflow — "first discover the index, confirm the mapping, examine samples, then build queries" — along with a PPL query recipe collection. Whether PPL (_plugins/_ppl) works on OpenSearch Serverless was a key point of interest, and it operated as described in the skill. I bulk-ingested 387 sample log entries and applied the recipes in sequence.
PPL: source=app-logs | stats count() by status
  [353, 200] [5, 400] [13, 404] [16, 500]

PPL: source=app-logs | where status = 500 | stats count() as errors by path
  [16, '/api/checkout']

PPL: source=app-logs | where status = 500
     | stats count() as errors by span(@timestamp, 15m) | sort - errors
  [9, '2026-07-20 17:00:00']
  [7, '2026-07-20 17:15:00']

PPL: source=app-logs | stats avg(latency_ms) as avg_ms,
     percentile(latency_ms, 95) as p95_ms by path
  [812.05, 2072.4, '/api/checkout']   ← p95 stands out
  [65.07,   117.2, '/api/cart']
  [64.68,   112.5, '/api/products']
All 16 of the 500 errors were for /api/checkout, concentrated between 17:00 and 17:30, with p95 latency approximately 20 times higher than other paths — the embedded incident was identified using only the PPL recipes. All 16 ERROR log messages were identical.
PPL: source=app-logs | where status = 500 | top 5 message
  [16, 'checkout failed: upstream timeout from payment-service (504) after 2000ms']
What was interesting was that it didn't stop there — it went on to verify numerically whether it was truly a timeout.
PPL: source=app-logs | where path = '/api/checkout'
     | stats count() as cnt, avg(latency_ms) as avg_ms, min(latency_ms) as min_ms,
       percentile(latency_ms, 95) as p95_ms by status
  [49,  401.9,   86.9, 1960.6, 200]
  [16, 2068.0, 2059.6, 2076.0, 500]
The decisive evidence was that the minimum latency for 500 errors was 2059.6ms. All 16 entries clustered just above the 2000ms threshold, whereas if it were an application exception, execution times would vary more. It also compared against normal periods.
PPL: source=app-logs | where path = '/api/checkout'
       and (`@timestamp` < TIMESTAMP('2026-07-20 17:00:00')
            or `@timestamp` >= TIMESTAMP('2026-07-20 18:00:00'))
     | stats count() as cnt, avg(latency_ms) as avg_ms, max(latency_ms) as max_ms
  [37, 99.8, 119.0]
All 37 checkout requests outside the 17:00 window were within 119.0ms, confirming the degradation was limited to that one hour. Meanwhile, the 12 successful requests during the 17:00 window were also slow at an average of 1333.4ms (13 times the normal rate), leading to the interpretation that this was partial saturation under load rather than a complete outage.
Traffic-side changes were also captured. The 17:00 window had 45 total requests (compared to around 16 for other hours), of which 28 were to checkout — approximately 10 times the normal rate of 1 to 4 per hour. The error rate was 16/28, or 57.1%. All 16 entries had distinct client_ip and trace_id values, confirming the impact was not caused by a specific client but affected all users.
However, this is the limit of what can be determined from logs alone. "payment-service is slow" is only the nearest hop from the web-api perspective, and what happens beyond that is not captured in the application logs. This next layer is where Trace analytics comes in.
On the other hand, I tried the ad command (anomaly detection) from the recipes just to see, and got the following error:
PPL: ... | ad time_field='@timestamp'
HTTP 500: "failed to find action ...MLTrainAndPredictionTaskAction"
Since OpenSearch Serverless does not include the ML plugin, commands that depend on ML such as ad are considered to be exclusive to managed domains.
Assessment: The PPL recipes worked on OpenSearch Serverless for all major commands (head / where / stats / span / percentile / top / sort / match / distinct_count) and proved practical. The fact that the skill even includes a branch for "since AOSS doesn't support the _cat API, use PPL as an alternative" was a thoughtful touch. Running through the recipes mechanically narrows things down to the target path and time window, but what comes after — proving the cutoff from the minimum latency of 500 errors, comparing against a baseline of normal-period requests, and concluding "partial saturation" from the fact that even successful requests were 13 times slower than usual — these steps of evidence accumulation lie outside the recipe collection. The recipes are a starting point; the skill does not describe how to build the case.
Observations
After going through Log analytics end to end, here is what I observed, organized from the perspectives of skill design and practical use.
You can start log analysis without knowing how to write PPL
What I submitted was a single line of natural language prompt. I arrived at the results without knowing PPL syntax, how to write span() or percentile(), or the fact that @timestamp needs to be enclosed in backticks. The skill and agent effectively absorbed the "learning cost of the query language" that normally stands between a user and log analysis.
It also pairs well with permission design. Since PPL only supports read-only commands, investigations can be completed while keeping the permissions granted to the agent limited to read access. This fits well with the use case of initial triage during an incident. Furthermore, since the skill includes branches for environment-specific differences such as "AOSS doesn't support the _cat API, so use PPL as an alternative," the agent never wasted attempts calling unavailable APIs.
What the skill guarantees is only the "template"
The results clearly separate what the skill guaranteed from what the agent worked out. The skill's guaranteed scope is the discovery-first workflow and the PPL recipe collection — running through them mechanically narrows things down to the target path /api/checkout and the time window 17:00–17:30.
On the other hand — proving from the minimum latency of 2059.6ms for 500 errors that it was a 2000ms cutoff rather than an application exception, establishing a baseline from the 37 requests outside the 17:00 window (max 119.0ms), and concluding "partial saturation" from the fact that even successful requests were 13 times slower than normal — this accumulation of evidence lies outside the recipe collection.
Reproducibility is guaranteed only up to "where is broken," and "why can we say so" depends on the agent's reasoning quality. Conversely, one could also say that because the recipes reduced the number of exploratory steps, the agent was able to devote more to reasoning.
Assume some commands will not work on Serverless
The anomaly detection ad command resulted in a 500 error because the ML plugin is not loaded. ML-dependent commands are considered exclusive to managed domains.
What to be aware of here is that the skill documentation has a mix of places where environment-specific branches are described and places where they are not. While the _cat API case is explicitly noted — "not available in AOSS, use PPL instead" — there is no mention that ad does not work on Serverless. The practical approach is to avoid treating skill documentation as absolute truth, and instead treat failures as environmental information to factor back in.
Since the skill is a snapshot of knowledge at a certain point in time, it is inevitable that environment differences and service updates will eventually outpace it. Rather than verifying the availability of every command upfront, it is more efficient in practice to run through the recipes and record which ones fail.
In closing
I tried analyzing application logs on OpenSearch Serverless using PPL with the amazon-opensearch-service skill from Agent Toolkit for AWS. By simply installing one plugin and submitting a natural language prompt, a continuous sequence of operations was executed — from index discovery, mapping verification, PPL-based error aggregation, latency distribution analysis, and comparison against normal periods — reaching the location, time window, and nature of the embedded incident. The fact that you can get started without any prior experience writing PPL struck me as a significant advantage as an entry point into log analysis.
For those operating OpenSearch, I recommend starting with read-only operations such as environment investigation and log search with PPL. Since the agent can execute anything within the scope of the credentials provided, please also review the security considerations in the official documentation (least privilege, separation of production and test environments, confirmation before execution).