![[Update] I tried out Amazon Redshift's newly supported concurrent scaling for streaming ingestion from Amazon Kinesis Data Streams](https://images.ctfassets.net/ct0aopd36mqt/wp-thumbnail-63f1274931b942e9a92e601c1127ad73/cfe87ec6d62fa2fc3c474ed4cb2f6c2e/amazon-redshift?w=3840&fm=webp)
[Update] I tried out Amazon Redshift's newly supported concurrent scaling for streaming ingestion from Amazon Kinesis Data Streams

This page has been translated by machine translation. View original
I am Ishikawa from the Cloud Business Division. Starting with Amazon Redshift patch P203, refresh of streaming materialized views connected to Amazon Kinesis Data Streams has become eligible for concurrency scaling, so I tried it out.
Since the refresh processing of streaming ingestion can now be offloaded from the main cluster to scaling clusters, this is expected to be effective in configurations where real-time data ingestion competes for resources with workloads such as BI and ETL.
What is Amazon Redshift Streaming Ingestion
Amazon Redshift Streaming Ingestion is a feature that ingests data with low latency and at high speed from Amazon Kinesis Data Streams and Amazon Managed Streaming for Apache Kafka.
Without going through a temporary relay area such as Amazon S3, stream data is written directly to materialized views. This enables quick access to external data, reducing data access time and storage costs. It can be configured with a small number of SQL commands on both provisioned clusters and Amazon Redshift Serverless workgroups.
Update Details
Previous Challenges
Streaming materialized views have two refresh methods: manual refresh by explicitly executing REFRESH MATERIALIZED VIEW, and automatic refresh by specifying AUTO REFRESH.
The official documentation states the following about automatic refresh:
Auto refresh queries for a materialized view or views are treated as any other user workload.
In other words, refresh queries that run each time data arrives from the stream were consuming the same resources as user queries on the main Amazon Redshift cluster. In streaming workloads where ingestion occurs continuously, this becomes a source of contention with other jobs such as dashboards and ETL.
What Changed
Starting with patch P203, Amazon Redshift supports concurrency scaling for refreshes of streaming materialized views connected to Amazon Kinesis Data Streams.
The main changes are as follows:
- Refreshes of streaming materialized views connected to Amazon Kinesis Data Streams are now eligible for concurrency scaling
- If concurrency scaling is enabled, streaming workloads automatically scale
- By offloading refresh processing, the main Amazon Redshift cluster can be dedicated to running other high-priority workloads
Note that concurrency scaling previously supported write statements such as COPY, INSERT, DELETE, UPDATE, CREATE TABLE AS (CTAS), and VACUUM, as well as manual refreshes of materialized views. This update adds refreshes of streaming materialized views connected to Amazon Kinesis Data Streams to that list.
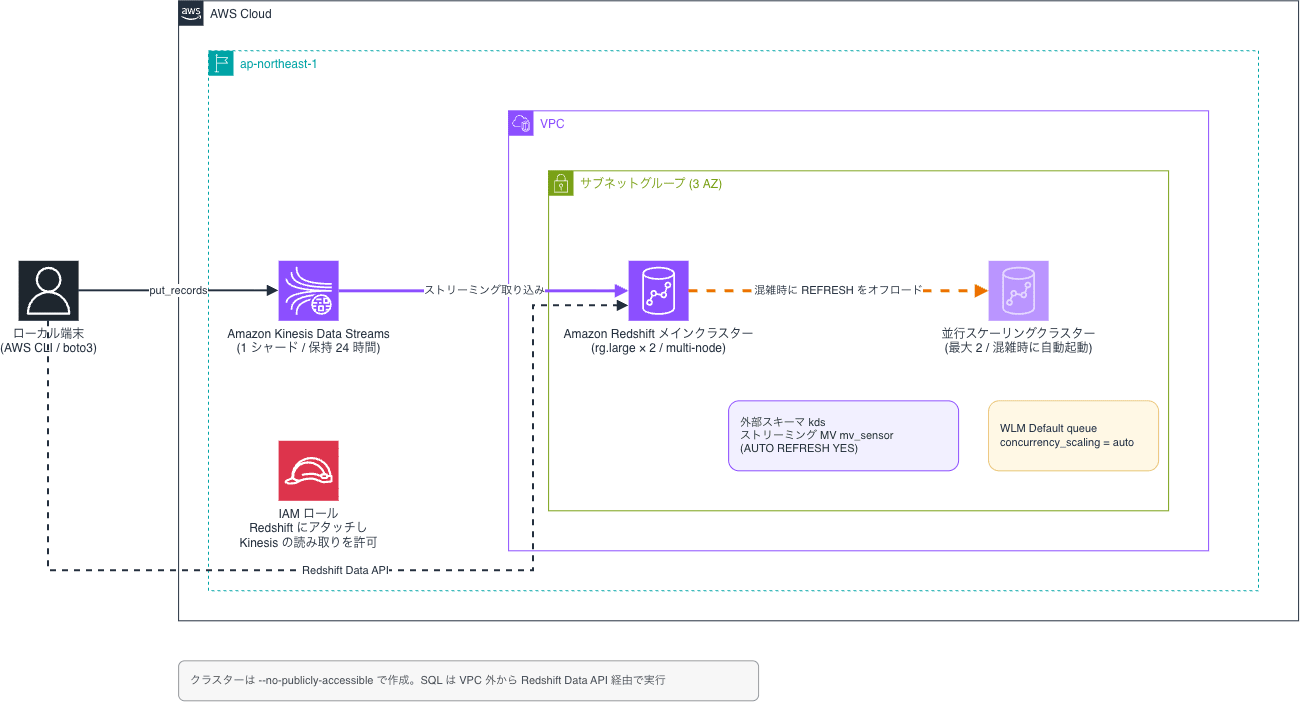
The data flow is as follows:
Supported Regions
AWS What's New states: "Available immediately in all AWS Regions where Amazon Redshift is available."
On the other hand, concurrency scaling itself has a list of supported regions defined in the official documentation, covering major regions including the Tokyo region (ap-northeast-1) and Osaka region (ap-northeast-3). Since this feature builds on top of concurrency scaling, it is safe to verify beforehand that your own region is included in the concurrency scaling supported regions.
Pricing Impact
The announcement contains no mention of additional charges for the feature itself. The standard concurrency scaling pricing applies.
- For every 24 hours the main cluster is running, one hour of concurrency scaling cluster credits is added
- Free credits can accumulate up to 30 hours per active cluster
- Usage of concurrency scaling clusters beyond the free credits is billed at per-second on-demand rates
Streaming ingestion often involves always-on use cases, and if refreshes are frequently routed to the concurrency scaling cluster, the free credits may be exhausted. We recommend considering the max_concurrency_scaling_clusters limit setting described later together with cost monitoring.
Trying It Out
Prerequisites
- Verification region: ap-northeast-1 (Tokyo)
- Amazon Redshift provisioned cluster: rg.large × 2 nodes (multi-node)
- Amazon Kinesis Data Streams: 1 shard
Concurrency scaling is available for read queries on node types including DC2, but write operations are only supported on RG and RA3 nodes. Streaming materialized view refreshes are write operations, as they are internally INSERT operations into the materialized view's underlying table as described later, so this condition applies. Also, since being eligible for concurrency scaling requires a non-single-node cluster, a 2-node configuration was used.
System Architecture Diagram
Enabling Concurrency Scaling in WLM
Using Auto WLM, set concurrency_scaling to auto. Also specify the maximum number of concurrency scaling clusters as 2.
% aws redshift modify-cluster-parameter-group \
  --region ap-northeast-1 \
  --parameter-group-name blog-20260825-e9fba1eb-wlm \
  --parameters '[
    {"ParameterName":"wlm_json_configuration",
     "ParameterValue":"[{\"auto_wlm\":true,\"concurrency_scaling\":\"auto\"},{\"short_query_queue\":true}]"},
    {"ParameterName":"max_concurrency_scaling_clusters","ParameterValue":"2"}
  ]'
{
    "ParameterGroupName": "blog-20260825-e9fba1eb-wlm",
    "ParameterGroupStatus": "Your parameter group has been updated. If you changed only dynamic parameters, associated clusters are being modified now. If you changed static parameters, all updates, including dynamic parameters, will be applied when you reboot the associated clusters."
}
Verify that the settings have been applied.
$ aws redshift describe-cluster-parameters \
  --region ap-northeast-1 \
  --parameter-group-name blog-20260825-e9fba1eb-wlm \
  --query 'Parameters[?ParameterName==`wlm_json_configuration`||ParameterName==`max_concurrency_scaling_clusters`].{N:ParameterName,V:ParameterValue}' \
  --output json
[
    {
        "N": "max_concurrency_scaling_clusters",
        "V": "2"
    },
    {
        "N": "wlm_json_configuration",
        "V": "[{\"auto_wlm\":true,\"concurrency_scaling\":\"auto\"},{\"short_query_queue\":true}]"
    }
]
Creating the Cluster
Specify the created IAM role to create an Amazon Redshift multi-node cluster (rg.large, 2 nodes).
Creating the Cluster
$ aws redshift create-cluster \
  --region ap-northeast-1 \
  --cluster-identifier cs-kds-e9fba1eb \
  --node-type rg.large \
  --number-of-nodes 2 \
  --cluster-type multi-node \
  --master-username awsuser \
  --master-user-password '<master password>' \
  --db-name dev \
  --cluster-subnet-group-name blog-20260825-e9fba1eb-subnets \
  --cluster-parameter-group-name blog-20260825-e9fba1eb-wlm \
  --iam-roles arn:aws:iam::123456789012:role/blog-20260825-e9fba1eb-rs-streaming-role \
  --no-publicly-accessible \
  --tags Key=run_id,Value=blog-20260825-e9fba1eb \
         Key=owner,Value=blog \
         Key=purpose,Value=blog-verification
{
    "Cluster": {
        "ClusterIdentifier": "cs-kds-e9fba1eb",
        "NodeType": "rg.large",
        "ClusterStatus": "creating",
        "ClusterAvailabilityStatus": "Modifying",
        "MasterUsername": "awsuser",
        "DBName": "dev",
        "AutomatedSnapshotRetentionPeriod": 1,
        "ManualSnapshotRetentionPeriod": -1,
        "ClusterSecurityGroups": [],
        "VpcSecurityGroups": [
            {
                "VpcSecurityGroupId": "sg-0548ccd1499215c3e",
                "Status": "active"
            }
        ],
        "ClusterParameterGroups": [
            {
                "ParameterGroupName": "blog-20260825-e9fba1eb-wlm",
                "ParameterApplyStatus": "in-sync"
            }
        ],
        "ClusterSubnetGroupName": "blog-20260825-e9fba1eb-subnets",
        "VpcId": "vpc-0b0642bd5008af386",
        "PreferredMaintenanceWindow": "thu:17:00-thu:17:30",
        "PendingModifiedValues": {
            "MasterUserPassword": "****"
        },
        "ClusterVersion": "1.0",
        "AllowVersionUpgrade": true,
        "NumberOfNodes": 2,
        "PubliclyAccessible": false,
        "Encrypted": true,
        "Tags": [
            {
                "Key": "owner",
                "Value": "blog"
            },
            {
                "Key": "run_id",
                "Value": "blog-20260825-e9fba1eb"
            },
            {
                "Key": "purpose",
                "Value": "blog-verification"
            }
        ]
    }
}
How to Execute SQL
Since the cluster was created with --no-publicly-accessible, a direct TCP connection from a local machine is not possible. Therefore, the Amazon Redshift Data API was used. The Data API works through an AWS-managed endpoint, so it can be reached from outside the VPC, and using --db-user for temporary authentication means there is no need to store the master password.
The Data API is asynchronous. When SQL is submitted, a statement ID is returned immediately, and the result is retrieved after polling the status.
SQL Execution via Data API
runsql() {
  local sql="$1"
  local id
  # 1. Submit SQL and receive the statement ID
  id=$(aws redshift-data execute-statement --region ap-northeast-1 \
        --cluster-identifier cs-kds-e9fba1eb --database dev --db-user awsuser \
        --sql "$sql" --query 'Id' --output text)

  # 2. Poll every 2 seconds until FINISHED / FAILED / ABORTED
  local st="" n=0
  while [ $n -lt 150 ]; do
    st=$(aws redshift-data describe-statement --region ap-northeast-1 --id "$id" --query 'Status' --output text)
    case "$st" in FINISHED|FAILED|ABORTED) break;; esac
    sleep 2; n=$((n+1))
  done

  # 3. Retrieve result set if available
  aws redshift-data get-statement-result --region ap-northeast-1 --id "$id" --output json
}
get-statement-result returns JSON split into ColumnMetadata and Records, which is hard to read as-is, so the results shown below have been formatted into text tables with aligned column widths.
Checking the Patch Version
This feature is available from patch P203 onwards. First, check the cluster version.
SELECT version();
version
--------------------------------------------------------------------------------------------------------------------------
PostgreSQL 8.0.2 on i686-pc-linux-gnu, compiled by GCC gcc (GCC) 3.4.2 20041017 (Red Hat 3.4.2-6.fc3), Redshift 1.0.400034
(1 rows)
1.0.400034 is a version included in patch 203 in the official documentation's cluster version list. This confirms that the feature is enabled in this environment.
Loading Verification Data
2,000 records of JSON simulating sensor data were loaded.
Loading 2,000 records
import boto3, json, random

k = boto3.client('kinesis', region_name='ap-northeast-1')
random.seed(42)
devices = [f"device-{i:03d}" for i in range(1, 21)]
total = 0
for batch in range(4):
    recs = []
    for i in range(500):
        n = batch * 500 + i
        payload = {
            "device_id": random.choice(devices),
            "seq": n,
            "temperature": round(random.uniform(15.0, 35.0), 2),
            "humidity": round(random.uniform(30.0, 80.0), 2),
            "status": random.choice(["ok", "ok", "ok", "warn", "error"]),
        }
        recs.append({"Data": json.dumps(payload).encode(), "PartitionKey": payload["device_id"]})
    r = k.put_records(StreamName='blog-20260825-e9fba1eb-stream', Records=recs)
    total += len(recs) - r.get('FailedRecordCount', 0)
    print(f"batch {batch}: sent={len(recs)} failed={r.get('FailedRecordCount', 0)}")
print(f"TOTAL_OK={total}")
batch 0: sent=500 failed=0
batch 1: sent=500 failed=0
batch 2: sent=500 failed=0
batch 3: sent=500 failed=0
TOTAL_OK=2000
Creating the External Schema and Streaming Materialized View
Create an external schema referencing Amazon Kinesis Data Streams.
CREATE EXTERNAL SCHEMA kds
FROM KINESIS
IAM_ROLE 'arn:aws:iam::123456789012:role/blog-20260825-e9fba1eb-rs-streaming-role';
Next, create a streaming materialized view on this external schema. AUTO REFRESH YES was specified to enable automatic refresh.
CREATE MATERIALIZED VIEW mv_sensor AUTO REFRESH YES AS
SELECT approximate_arrival_timestamp,
       partition_key,
       shard_id,
       sequence_number,
       JSON_PARSE(kinesis_data) AS payload
FROM kds."blog-20260825-e9fba1eb-stream";
The official documentation recommends first ingesting data as a SUPER type using JSON_PARSE and then extracting individual values later with PartiQL, rather than repeatedly using JSON_EXTRACT_PATH_TEXT per column, which causes the JSON to be re-parsed for each extracted column and increases ingestion latency. This approach was followed here as well.
Verifying Ingestion
Apply a manual refresh.
REFRESH MATERIALIZED VIEW mv_sensor;
Verify the ingestion results.
SELECT COUNT(*) AS ingested_rows FROM mv_sensor;
ingested_rows
-------------
2000
(1 rows)
Expand the payload stored in SUPER type using PartiQL.
SELECT partition_key,
       payload.device_id::VARCHAR AS device_id,
       payload.temperature::DECIMAL(5,2) AS temperature,
       payload.status::VARCHAR AS status
FROM mv_sensor
ORDER BY sequence_number
LIMIT 5;
partition_key | device_id  | temperature | status
--------------+------------+-------------+-------
device-004    | device-004 | 15.50       | ok
device-005    | device-005 | 29.73       | error
device-003    | device-003 | 26.81       | ok
device-007    | device-007 | 19.65       | error
device-007    | device-007 | 29.32       | warn
(5 rows)
Ingestion is working correctly.
Checking WLM Settings
Verify that concurrency scaling is enabled.
SELECT service_class, num_query_tasks, name, concurrency_scaling
FROM stv_wlm_service_class_config
WHERE service_class >= 5
ORDER BY service_class;
service_class | num_query_tasks | name                                                             | concurrency_scaling
--------------+-----------------+------------------------------------------------------------------+---------------------
5             | 1               | Service class for super user                                     | off
14            | 6               | Short query queue                                                | off
15            | 0               | Service class for vacuum/analyze                                 | off
100           | -1              | Default queue                                                    | auto
(4 rows)
The Default queue (service_class 100) is set to auto. Since Auto WLM is used, num_query_tasks is -1 (dynamic).
Checking Where Refreshes Were Executed
Verify whether the queries up to this point were executed on the main cluster or the concurrency scaling cluster.
SELECT query,
       concurrency_scaling_status,
       TRIM(SUBSTRING(querytxt,1,45)) AS query_text,
       starttime
FROM stl_query
WHERE userid > 1
ORDER BY starttime DESC
LIMIT 12;
query | concurrency_scaling_status | query_text                                    | starttime
------+----------------------------+-----------------------------------------------+---------------------------
3186  | 6                          | SELECT service_class, num_query_tasks, name,  | 2026-08-25 05:34:45.958598
3173  | 0                          | SELECT partition_key, payload.device_id::VARC | 2026-08-25 05:34:23.805455
3168  | 0                          | SELECT COUNT(*) AS ingested_rows FROM mv_sens | 2026-08-25 05:34:21.386898
3163  | 0                          | INSERT INTO "public"."mv_tbl__mv_sensor__0"   | 2026-08-25 05:34:17.099753
3157  | 0                          | INSERT INTO "public"."mv_tbl__mv_sensor__0"   | 2026-08-25 05:34:10.342018
3153  | 0                          | INSERT INTO "public"."mv_tbl__mv_sensor__0"   | 2026-08-25 05:34:08.428581
3148  | 5                          | CREATE MATERIALIZED VIEW mv_sensor AUTO REFRE | 2026-08-25 05:34:00.92326
(7 rows)
It can be seen that streaming materialized view refreshes are recorded as INSERT INTO "public"."mv_tbl__mv_sensor__0" operations on the underlying table. At this point, concurrency_scaling_status is 0 for all entries, meaning execution on the main cluster.
The official documentation explains that concurrency_scaling_status = 1 indicates execution on the concurrency scaling cluster. For values such as 5 and 6 appearing above, no list could be found in the documentation. The documentation's sample query also uses the form CASE WHEN concurrency_scaling_status = 1 THEN ... ELSE 'main cluster' END, judging by whether the value is 1 or not.
Refresh history can also be checked with SVL_MV_REFRESH_STATUS.
SELECT TRIM(db_name) AS db, TRIM(mv_name) AS mv, status,
       TRIM(refresh_type) AS refresh_type, starttime
FROM svl_mv_refresh_status
ORDER BY starttime DESC LIMIT 10;
db  | mv        | status                                                                     | refresh_type | starttime
----+-----------+----------------------------------------------------------------------------+--------------+---------------------------
dev | mv_sensor | Refresh successfully updated MV incrementally. Stream returned no new data | Manual       | 2026-08-25 05:34:16.976869
dev | mv_sensor | Refresh successfully updated MV incrementally. Stream returned no new data | Auto         | 2026-08-25 05:34:10.16889
dev | mv_sensor | Refresh successfully updated MV incrementally                              | Auto         | 2026-08-25 05:34:08.246986
(3 rows)
Interestingly, looking at this, Auto (automatic refresh) ran first and ingested the data, and the manual REFRESH executed afterwards showed "Stream returned no new data." Since AUTO REFRESH YES was specified, ingestion had already completed without the need to explicitly run REFRESH.
Verifying AUTO REFRESH Behavior
Let's examine the automatic refresh behavior a bit more. Without executing a manual REFRESH, 3,000 additional records were loaded into the stream.
Loading an additional 3,000 records into the stream
import boto3, json, random

k = boto3.client('kinesis', region_name='ap-northeast-1')
random.seed(7)
devices = [f"device-{i:03d}" for i in range(1, 21)]
total = 0
for b in range(6):
    recs = []
    for i in range(500):
        n = 100000 + b*500 + i
        p = {"device_id": random.choice(devices), "seq": n,
             "temperature": round(random.uniform(15, 35), 2),
             "humidity": round(random.uniform(30, 80), 2),
             "status": random.choice(["ok", "warn", "error"])}
        recs.append({"Data": json.dumps(p).encode(), "PartitionKey": p["device_id"]})
    r = k.put_records(StreamName='blog-20260825-e9fba1eb-stream', Records=recs)
    total += 500 - r.get('FailedRecordCount', 0)
print(f"ADDED_OK={total}")
ADDED_OK=3000
After waiting a while, check the record count.
SELECT COUNT(*) AS rows_now FROM mv_sensor;
rows_now
--------
5000
(1 rows)
As specified with AUTO REFRESH YES, the additional records have been automatically ingested.
Attempting to Trigger Concurrency Scaling Under Load
Concurrency scaling is triggered when a queue builds up. A table was prepared for load generation. A table of 1 million rows is created by cross joining streaming materialized views.
Note that Amazon Redshift CTAS does not support IF NOT EXISTS, so it is written as follows:
CREATE TABLE load_seed AS
SELECT a.sequence_number AS sn,
       b.partition_key AS pk,
       a.payload.temperature::DECIMAL(5,2) AS temp
FROM mv_sensor a CROSS JOIN mv_sensor b
LIMIT 1000000;
SELECT COUNT(*) AS seed_rows FROM load_seed;
seed_rows
---------
1000000
(1 rows)
20 queries, each taking about 13 seconds, are submitted simultaneously against this table. Since the Data API is asynchronous and returns immediately, they can be submitted in parallel using the shell's &.
Submitting 20 queries simultaneously, each taking about 13 seconds
HEAVY='SELECT a.pk, b.pk AS pk2, COUNT(*) AS c FROM load_seed a JOIN load_seed b ON a.sn = b.sn GROUP BY 1,2 ORDER BY 3 DESC LIMIT 20;'

for i in $(seq 1 20); do
  aws redshift-data execute-statement --region ap-northeast-1 \
    --cluster-identifier cs-kds-e9fba1eb --database dev --db-user awsuser \
    --sql "${HEAVY}" --statement-name "cs-probe-${i}" --query 'Id' --output text >/dev/null &
done
wait
STV_INFLIGHT was polled immediately after submission, but no execution on the concurrency scaling cluster was observed.
poll 1 [05:41:35Z]: cs_cluster=0 inflight_total=14
poll 2 [05:41:43Z]: cs_cluster=0 inflight_total=13
poll 3 [05:41:51Z]: cs_cluster=0 inflight_total=13
poll 4 [05:41:59Z]: cs_cluster=0 inflight_total=13
poll 5 [05:42:07Z]: cs_cluster=0 inflight_total=13
poll 6 [05:42:15Z]: cs_cluster=0 inflight_total=13
The number of running queries was capped at 13–14, and the rest should have been waiting in the queue. Even after aggregating once the processing settled, there were 0 executions on the concurrency scaling cluster.
SELECT CASE WHEN q.concurrency_scaling_status = 1
            THEN 'concurrency scaling cluster' ELSE 'main cluster' END AS run_on,
       COUNT(*) AS queries,
       SUM(ROUND(w.total_queue_time::NUMERIC/1000000,2)) AS queue_secs,
       SUM(ROUND(w.total_exec_time::NUMERIC/1000000,2)) AS exec_secs
FROM stl_query q JOIN stl_wlm_query w USING (userid, query)
WHERE q.userid > 1 AND q.starttime > DATEADD(minute, -10, GETDATE())
GROUP BY 1 ORDER BY 1;
run_on       | queries | queue_secs | exec_secs
-------------+---------+------------+----------
main cluster | 55      | 1.31       | 64.39
(1 rows)
The total queue wait time is only 1.31 seconds. It appears that Auto WLM dynamically adjusted the concurrency and handled the load entirely on its own.
Limiting Slot Count with Manual WLM
Since queues are less likely to back up with Auto WLM, I switched to manual WLM and explicitly reduced the slot count to 2.
% aws redshift modify-cluster-parameter-group \
  --region ap-northeast-1 \
  --parameter-group-name blog-20260825-e9fba1eb-wlm \
  --parameters '[
    {"ParameterName":"wlm_json_configuration",
     "ParameterValue":"[{\"query_group\":[],\"query_group_wild_card\":0,\"user_group\":[],\"user_group_wild_card\":0,\"concurrency_scaling\":\"auto\",\"query_concurrency\":2,\"max_execution_time\":0,\"memory_percent_to_use\":100},{\"short_query_queue\":false}]"},
    {"ParameterName":"max_concurrency_scaling_clusters","ParameterValue":"2"}
  ]'
Switching auto_wlm is a static parameter, so a restart is required.
% aws redshift reboot-cluster \
  --region ap-northeast-1 \
  --cluster-identifier cs-kds-e9fba1eb \
  --query 'Cluster.{Status:ClusterStatus,PG:ClusterParameterGroups[0].ParameterApplyStatus}' \
  --output json
{
    "Status": "available",
    "PG": "pending-reboot"
}
After waiting a moment, it becomes in-sync.
{
    "Status": "available",
    "PG": "in-sync"
}
Let's verify the slot count.
SELECT service_class, num_query_tasks AS slots, TRIM(name) AS name, concurrency_scaling
FROM stv_wlm_service_class_config WHERE service_class >= 5 ORDER BY service_class;
service_class | slots | name                             | concurrency_scaling
--------------+-------+----------------------------------+---------------------
5             | 1     | Service class for super user     | off
6             | 2     | Default queue                    | auto
15            | 0     | Service class for vacuum/analyze | off
(3 rows)
The Default queue slot count is now 2. With Auto WLM it was service_class 100, but with manual WLM it is 6.
Observing Concurrency Scaling Activation with Manual WLM (Retry)
I added 3,000 records to the stream to trigger auto-refresh, then submitted 10 queries simultaneously. With 2 slots, 8 queries were expected to be waiting in the queue.
Adding 3,000 records to the stream
for i in $(seq 1 10); do
  aws redshift-data execute-statement --region ap-northeast-1 \
    --cluster-identifier cs-kds-e9fba1eb --database dev --db-user awsuser \
    --sql "${HEAVY}" --statement-name "mwlm-${i}" --query 'Id' --output text >/dev/null &
done
wait
Here are the polling results.
poll 1 [06:01:15Z]: The verification query itself has status=STARTED (waiting in queue)
poll 2 [06:01:24Z]: cs_cluster=0  inflight=2
poll 3 [06:01:34Z]: The verification query itself has status=STARTED (waiting in queue)
poll 4 [06:01:43Z]: The verification query itself has status=STARTED (waiting in queue)
poll 5 [06:01:53Z]: cs_cluster=5  inflight=7
poll 6 [06:02:03Z]: cs_cluster=0  inflight=2
poll 7 [06:02:13Z]: cs_cluster=0  inflight=1
poll 8 [06:02:22Z]: cs_cluster=0  inflight=1
At poll 5, it was observed that 5 out of 7 running queries were routed to the concurrency scaling cluster. Note that at polls 1, 3, and 4, the verification query itself was waiting in the queue and no results were returned. Since monitoring queries go through the same WLM queue, when the main cluster is congested, the monitoring itself gets stuck.
Aggregating Execution Locations
Once the processing settles down, I run the aggregation again.
SELECT CASE WHEN q.concurrency_scaling_status = 1
            THEN 'concurrency scaling cluster' ELSE 'main cluster' END AS run_on,
       COUNT(*) AS queries,
       SUM(ROUND(w.total_queue_time::NUMERIC/1000000,2)) AS queue_secs,
       SUM(ROUND(w.total_exec_time::NUMERIC/1000000,2)) AS exec_secs
FROM stl_query q JOIN stl_wlm_query w USING (userid, query)
WHERE q.userid > 1 AND q.starttime > DATEADD(minute, -6, GETDATE())
GROUP BY 1 ORDER BY 1;
run_on                      | queries | queue_secs | exec_secs
----------------------------+---------+------------+----------
concurrency scaling cluster | 5       | 226.95     | 51.27
main cluster                | 17      | 209.53     | 122.15
(2 rows)
Concurrency scaling usage can be verified with SVCS_CONCURRENCY_SCALING_USAGE.
SELECT start_time, end_time, queries, usage_in_seconds
FROM svcs_concurrency_scaling_usage ORDER BY start_time DESC LIMIT 5;
start_time                 | end_time                   | queries | usage_in_seconds
---------------------------+----------------------------+---------+-----------------
2026-08-25 06:01:41.6675   | 2026-08-25 06:01:52.372099 | 5       | 11
2026-08-25 05:42:55.814568 | 2026-08-25 05:42:57.20169  | 1       | 2
2026-08-25 05:42:28.936983 | 2026-08-25 05:42:38.691135 | 4       | 10
2026-08-25 05:42:13.815229 | 2026-08-25 05:42:25.166128 | 5       | 12
(4 rows)
Here I noticed something. 3 usage records are logged in the 05:42 timeframe. This is the period when load was being applied with Auto WLM still active. In other words, concurrency scaling was not failing to activate — it was activating, but I had failed to observe it. The concurrency scaling cluster was running for around 10 seconds, which was too short to capture with STV_INFLIGHT polling.
The timeframe I was aggregating when I earlier concluded "0 queries executed on the concurrency scaling cluster" (using DATEADD(minute, -10, GETDATE())) turned out to be before these activations occurred.
Where Was the Streaming Materialized View Refresh Executed?
Now for the main topic. Let's check which cluster executed the ingestion queries for the streaming materialized view.
SELECT query,
       concurrency_scaling_status AS cs_status,
       TRIM(SUBSTRING(querytxt,1,42)) AS query_text,
       starttime
FROM stl_query
WHERE userid > 1 AND querytxt ILIKE '%mv_tbl__mv_sensor%'
ORDER BY starttime DESC LIMIT 20;
query  | cs_status | query_text                                | starttime
-------+-----------+-------------------------------------------+---------------------------
409377 | 0         | INSERT INTO "public"."mv_tbl__mv_sensor__ | 2026-08-25 06:03:11.812773
409365 | 0         | INSERT INTO "public"."mv_tbl__mv_sensor__ | 2026-08-25 06:02:40.959074
409341 | 0         | INSERT INTO "public"."mv_tbl__mv_sensor__ | 2026-08-25 06:02:10.896532
409321 | 0         | INSERT INTO "public"."mv_tbl__mv_sensor__ | 2026-08-25 06:01:51.65466
409279 | 0         | INSERT INTO "public"."mv_tbl__mv_sensor__ | 2026-08-25 06:01:08.968543
3803   | 0         | INSERT INTO "public"."mv_tbl__mv_sensor__ | 2026-08-25 05:44:28.778121
3797   | 0         | INSERT INTO "public"."mv_tbl__mv_sensor__ | 2026-08-25 05:43:58.888783
3784   | 0         | INSERT INTO "public"."mv_tbl__mv_sensor__ | 2026-08-25 05:43:26.83914
3765   | 1         | INSERT INTO "public"."mv_tbl__mv_sensor__ | 2026-08-25 05:42:55.78917
3722   | 1         | INSERT INTO "public"."mv_tbl__mv_sensor__ | 2026-08-25 05:41:53.838842
3609   | 0         | INSERT INTO "public"."mv_tbl__mv_sensor__ | 2026-08-25 05:41:22.78361
3604   | 0         | INSERT INTO "public"."mv_tbl__mv_sensor__ | 2026-08-25 05:40:51.913177
3577   | 0         | INSERT INTO "public"."mv_tbl__mv_sensor__ | 2026-08-25 05:40:23.294678
3573   | 0         | INSERT INTO "public"."mv_tbl__mv_sensor__ | 2026-08-25 05:40:20.843386
3458   | 0         | INSERT INTO "public"."mv_tbl__mv_sensor__ | 2026-08-25 05:39:18.923916
3444   | 0         | INSERT INTO "public"."mv_tbl__mv_sensor__ | 2026-08-25 05:38:47.910329
3347   | 0         | INSERT INTO "public"."mv_tbl__mv_sensor__ | 2026-08-25 05:38:16.806437
3331   | 0         | INSERT INTO "public"."mv_tbl__mv_sensor__ | 2026-08-25 05:37:48.332626
3327   | 0         | INSERT INTO "public"."mv_tbl__mv_sensor__ | 2026-08-25 05:37:45.898323
3163   | 0         | INSERT INTO "public"."mv_tbl__mv_sensor__ | 2026-08-25 05:34:17.099753
(20 rows)
query 3722 (05:41:53) and query 3765 (05:42:55) show cs_status = 1. This confirms that the streaming materialized view auto-refresh was executed on the concurrency scaling cluster. This is precisely the behavior introduced by this update.
Looking at the timestamps, they align with the activations recorded in SVCS_CONCURRENCY_SCALING_USAGE in the 05:42 timeframe. Refreshes during the less congested early 05:40 period and from 06:01 onward were all executed on the main cluster (cs_status = 0). This suggests that queries are being routed based on load.
Finally, let's check the number of refreshes and the final row count.
SELECT TRIM(refresh_type) AS refresh_type, COUNT(*) AS n, MAX(starttime) AS latest
FROM svl_mv_refresh_status GROUP BY 1 ORDER BY 2 DESC;
refresh_type | n  | latest
-------------+----+---------------------------
Auto         | 21 | 2026-08-25 06:03:11.681697
Manual       | 1  | 2026-08-25 05:34:16.976869
(2 rows)
SELECT COUNT(*) AS total_rows FROM mv_sensor;
total_rows
----------
12000
(1 rows)
21 auto-refreshes and 1 manual refresh ingested a total of 12,000 rows.
Discussion
Here is a summary of what was confirmed in this verification and points to keep in mind.
What was confirmed
- In a patch P203 environment, the auto-refresh of a streaming materialized view connected to Amazon Kinesis Data Streams is executed on the concurrency scaling cluster
- It does not always route to concurrency scaling — it is only routed during periods when the main cluster is congested
- Since the auto-refresh is recorded as an
INSERTinto the base table inSTL_QUERY, the execution location can be tracked viaconcurrency_scaling_status
Notes on observation
The concurrency scaling cluster runs for around 10 seconds, which is too short to capture by polling STV_INFLIGHT every few seconds. In fact, this time I almost incorrectly concluded that it had not activated. It is more reliable to cross-reference SVCS_CONCURRENCY_SCALING_USAGE with STL_QUERY after the fact.
Also, since verification queries themselves enter the WLM queue, results will not be returned when the main cluster is congested. It is practical to use monitoring through a separate channel — for example, in combination with Amazon CloudWatch metrics such as ConcurrencyScalingSeconds or ConcurrencyScalingActiveClusters.
Cost considerations
With concurrency scaling, 1 hour of credit is added every 24 hours that the main cluster is running, accumulating up to a maximum of 30 hours per active cluster. Usage beyond the free credits is billed at on-demand rates per second.
Streaming ingestion often involves always-on use cases, and configurations where refreshes frequently route to concurrency scaling may exhaust the free credits. It is worth considering setting an upper limit with max_concurrency_scaling_clusters alongside cost monitoring.
Limitations
- Concurrency scaling for write operations is only supported on RA3 and RG nodes. This is not a limitation specific to Amazon Kinesis Data Streams integration — it is a condition common to all write operations including COPY, INSERT, DELETE, UPDATE, CTAS, VACUUM, and others (read queries can use concurrency scaling even on DC2)
- Single-node clusters are not eligible for concurrency scaling
Closing
Starting with patch P203, the refresh of streaming materialized views connected to Amazon Kinesis Data Streams became eligible for concurrency scaling. Testing on a cluster with rg.large × 2 nodes confirmed that during periods of main cluster congestion, auto-refresh is offloaded to the concurrency scaling cluster.
In near-real-time analytics platforms, ingestion processing and dashboard queries tend to compete for resources. Enabling concurrency scaling makes it easier to achieve both low ingestion latency and responsive query times.
If you are already running streaming ingestion, consider checking your cluster's patch version and node type, enabling concurrency scaling on your WLM queue, and using SVCS_CONCURRENCY_SCALING_USAGE to review actual usage and the rate at which free credits are being consumed.