![[AgentCore CLI] Agent Inspector Web UI has been added when running the agentcore dev command!](https://images.ctfassets.net/ct0aopd36mqt/7M0d5bjsd0K4Et30cVFvB6/5b2095750cc8bf73f04f63ed0d4b3546/AgentCore2.png?w=3840&fm=webp)
[AgentCore CLI] Agent Inspector Web UI has been added when running the agentcore dev command!
This page has been translated by machine translation. View original
Introduction
Hello, I'm Jinno from the consulting department, and I'm also a big fan of ramen.
AgentCore CLI v0.9.0 has been released, adding an Agent Inspector Web UI that launches when running the agentcore dev command!
Until now, running agentcore dev would start a server and allow testing via command line, but I had been wishing for a visual interface, so this is great news.
With this update, we can now do the following via a rich UI in the web browser:
- Chat with agents (managed by session)
- Check Resources (registered agents and Memory)
- Timeline display of Traces (OpenTelemetry based)
- View extracted long-term memories
In this article, I'll walk you through the process from creating a project to launching the Web UI!
For more about AgentCore CLI itself, please check out the blog post below.
The speed of updates is remarkable. More and more features are being added, making it increasingly convenient.
Prerequisites
Here's the environment I used:
| Item | Version |
|---|---|
| AgentCore CLI | 0.9.0 |
| Node.js | 25.9.0 |
| Python | 3.12 |
Install AgentCore CLI globally using npm.
npm install -g @aws/agentcore@0.9.0
What's Been Added
Looking at the description for PR #871, these major features have been added:
Launch agent inspector when user runs
agentcore dev, a web UI that allows users to test their agents locally
To enable collection of traces for local agents, this PR adds a local OTLP/HTTP collector that receives OpenTelemetry traces/logs from the agent runtime, persists them to disk, and serves them to the agent inspector frontend
In other words, the setup looks like this:
- Web UI server: A Node.js HTTP server that delivers the static frontend for Agent Inspector
- OTEL collector: A local collector that receives traces and logs from the agent runtime via OTLP/HTTP and persists them as JSONL
The idea is that telemetry from running agents is stored locally and can be viewed from the Web UI. This is very helpful.
In the next section, let's try it out starting from creating a project!
Creating a Project and Agent
Let's start by creating a project and agent using agentcore create!
agentcore create
When the wizard launches, I selected the following options in the interactive prompts. For Memory, I chose Long-term and short-term so that memories will be retained across sessions.
| Item | Selected option |
|---|---|
| Project name | sampleMyProject |
| Agent name | MyAgent_test_ui |
| Agent type | Create new agent |
| Language | Python |
| Build | Direct Code Deploy |
| Protocol | HTTP |
| Framework | Strands Agents SDK |
| Model Provider | Amazon Bedrock (Claude Sonnet 4.5) |
| Memory | Long-term and short-term |
| Advanced | Default settings |
After confirming these selections, the project directory, Python environment, and agentcore/ directory are initialized.
Created:
  sampleMyProject/
    app/MyAgent_test_ui/  Python agent (Strands Agents SDK)
    agentcore/            Config and CDK project

Model: us.anthropic.claude-sonnet-4-5-20250514-v1:0 via Bedrock

Next: Run agentcore dev to run agent locally, or agentcore deploy to deploy to aws
The project and agent have been successfully created! Let's try it out right away.
Deploy with agentcore deploy
While I'd like to jump straight to agentcore dev, I first want to run agentcore deploy to deploy to the cloud, since I want to test with Memory in the Agent Inspector.
Let's move to the project directory and deploy:
cd sampleMyProject
agentcore deploy
Here's what the output looks like:
AgentCore Deploy

Project: sampleMyProject
Target: ap-northeast-1:xxxxxxxxxxxx

[done]    Validate project
[done]    Check dependencies
[done]    Build CDK project
[done]    Synthesize CloudFormation
[done]    Check stack status
[done]    Publish assets

╭────────────────────────────────────────────────╮
│ ✓ Deploy to AWS Complete                       │
│                                                │
│ [████████████████████] 7/7                     │
╰────────────────────────────────────────────────╯
Resources like Runtime and Memory have been created on the AWS side, so the Agent Inspector can now access Memory.
Launch Agent Inspector with agentcore dev
Now let's run agentcore dev on the deployed project!
agentcore dev
When you run the command, a browser automatically launches and displays the Agent Inspector screen.
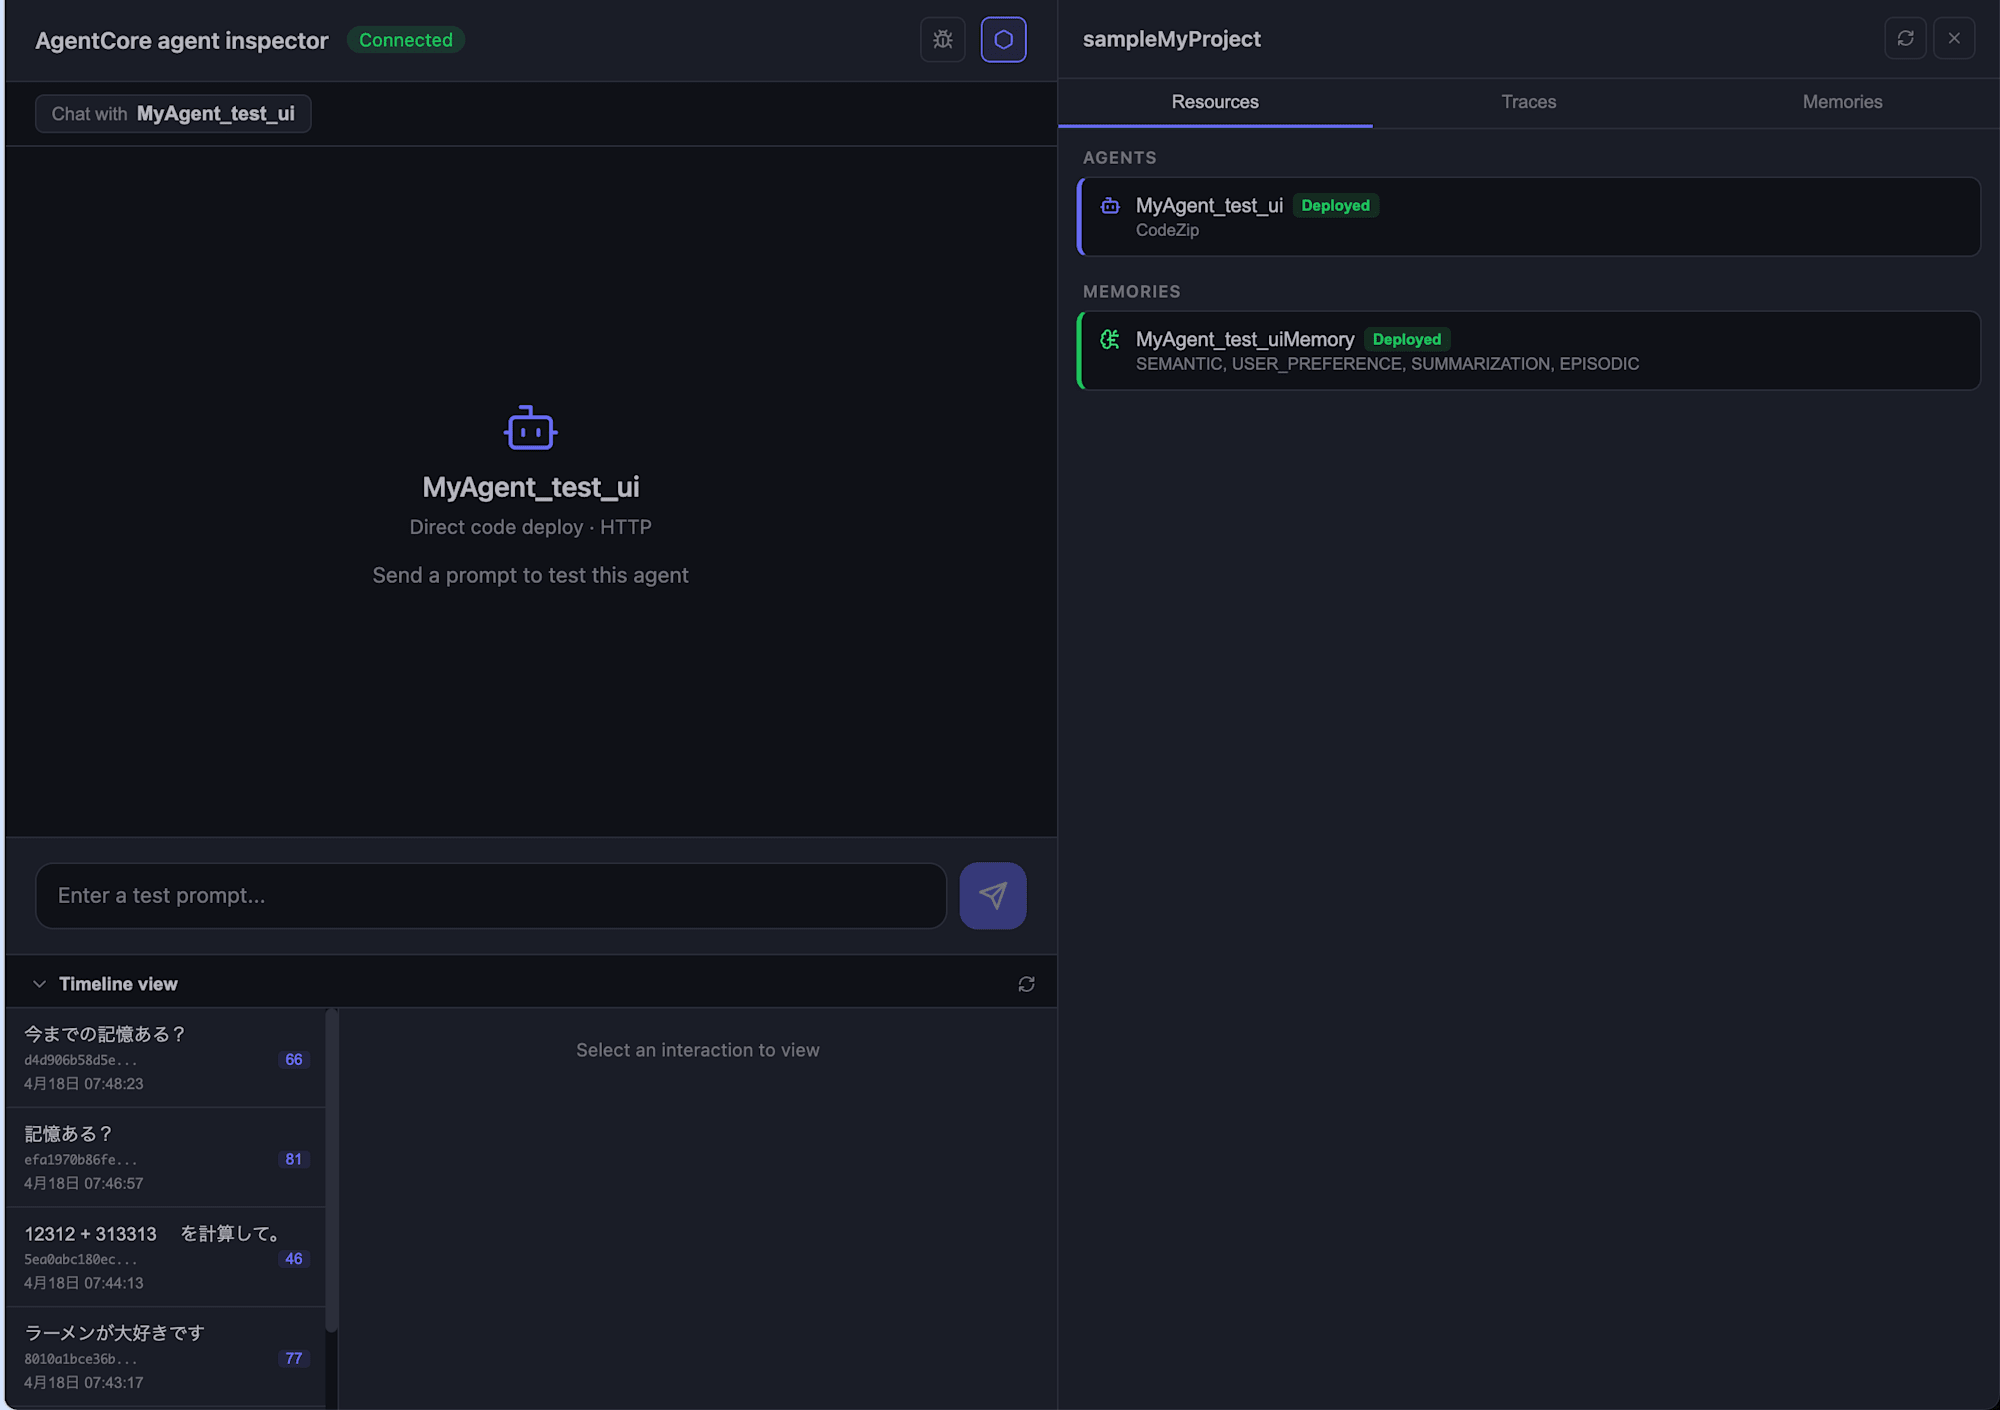
The interface looks nice! It's similar to Mastra.
The left side is the chat area, and the right side can switch between Resources / Traces / Memories.
The Resources tab on the right shows the agent we're currently working with. Since we've already deployed it, the agent name appears as a deployed agent. It's useful that we can see the deployment status during local development.
Let's Chat
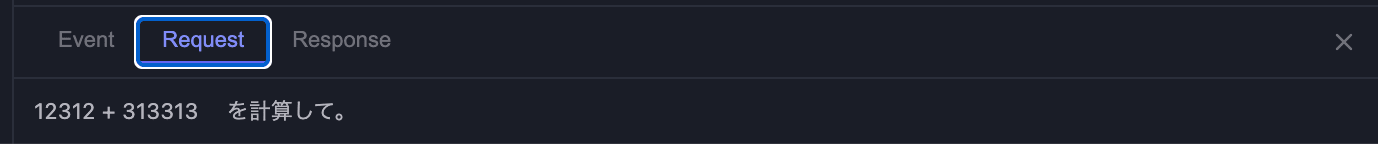
Let's send a message by typing in the input field at the bottom. I decided to ask for a simple calculation.
12312 + 313313 を計算して。
The agent returned the calculation result!
12312 + 313313 = 325625 です!
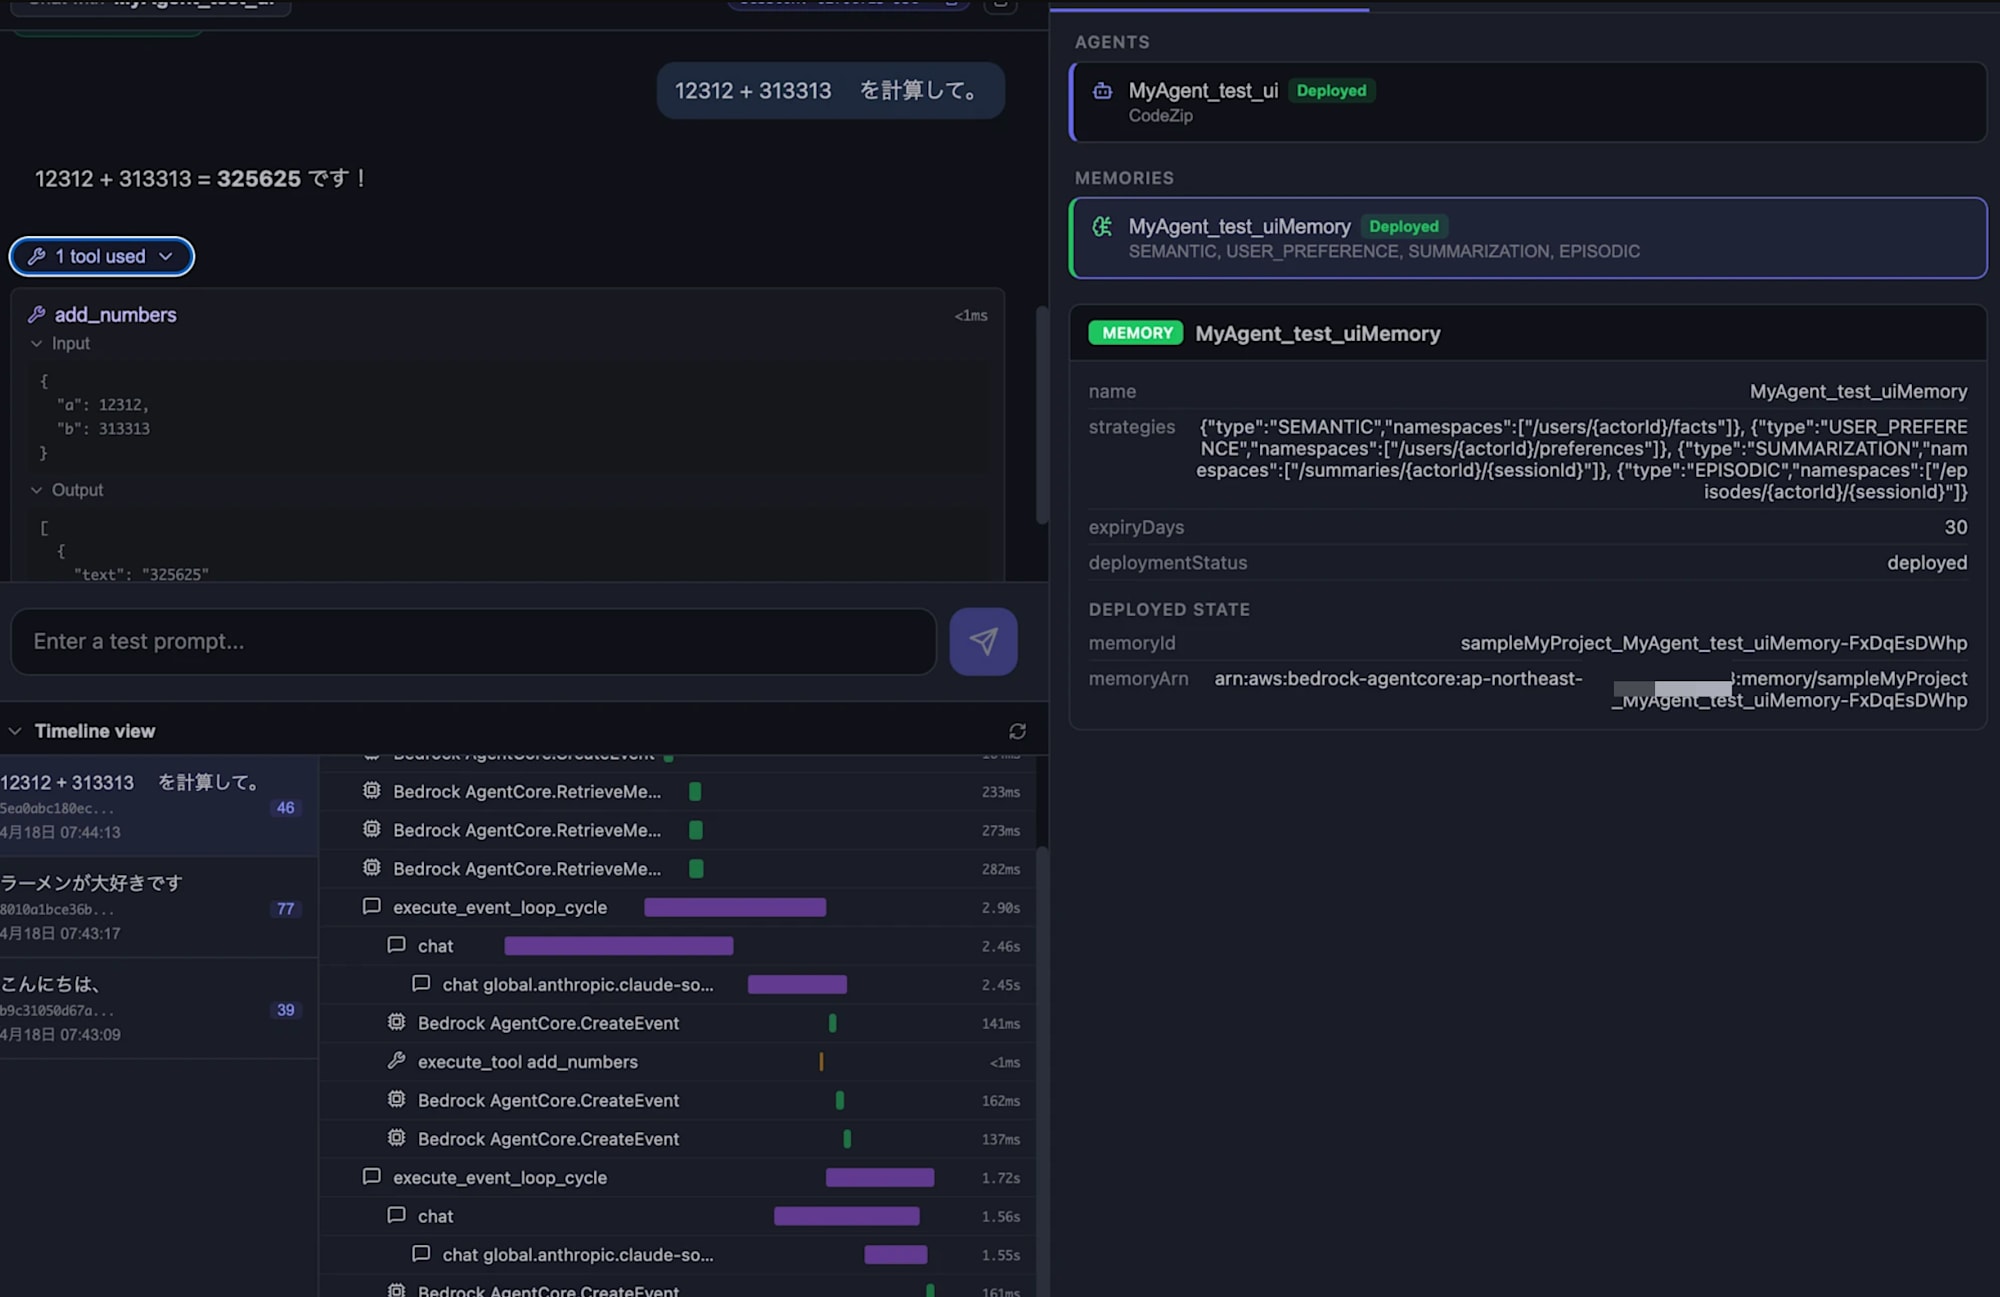
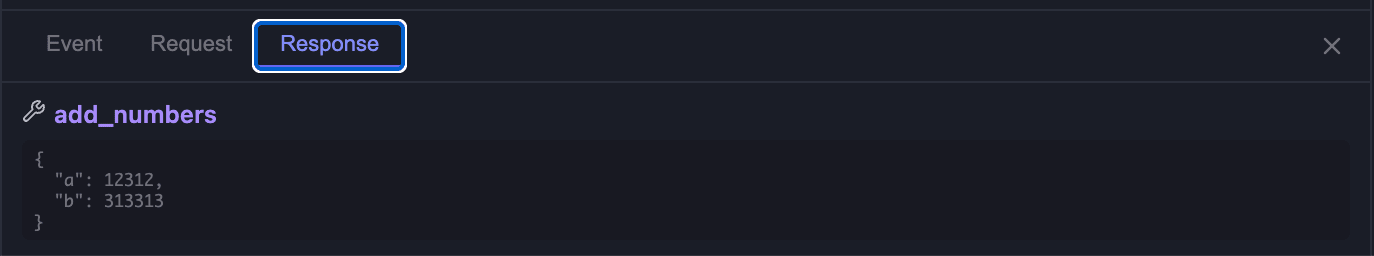
Looking further at the screen, we can see that the agent called a tool called add_numbers, and we can check both the Input and Output.
{
  "a": 12312,
  "b": 313313
}
[
  {
    "text": "325625"
  }
]
It's great that we can visualize what the tool received and returned right in the chat area. This should be sufficient for basic testing.
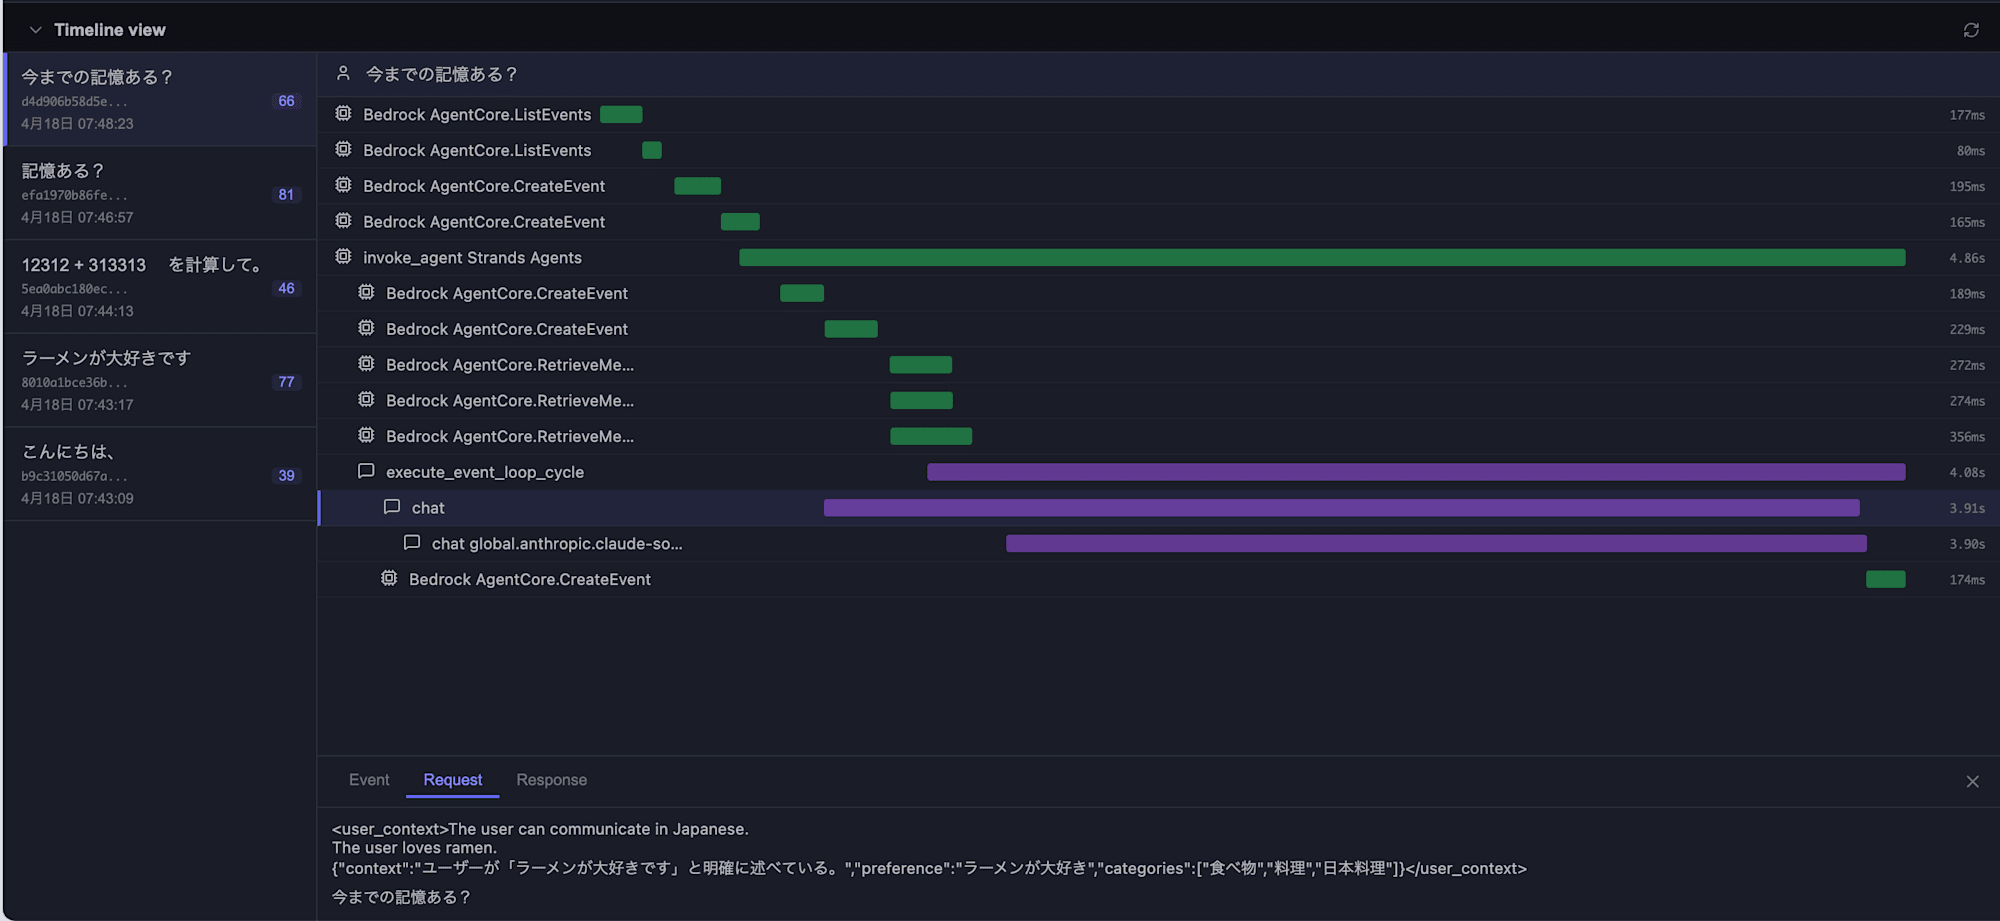
Check Traces in Timeline view
Looking at the Timeline view at the bottom of the screen, you can see the agent's processing flow displayed like a Gantt chart. It's similar to AgentCore Observability. My execution showed the following spans:
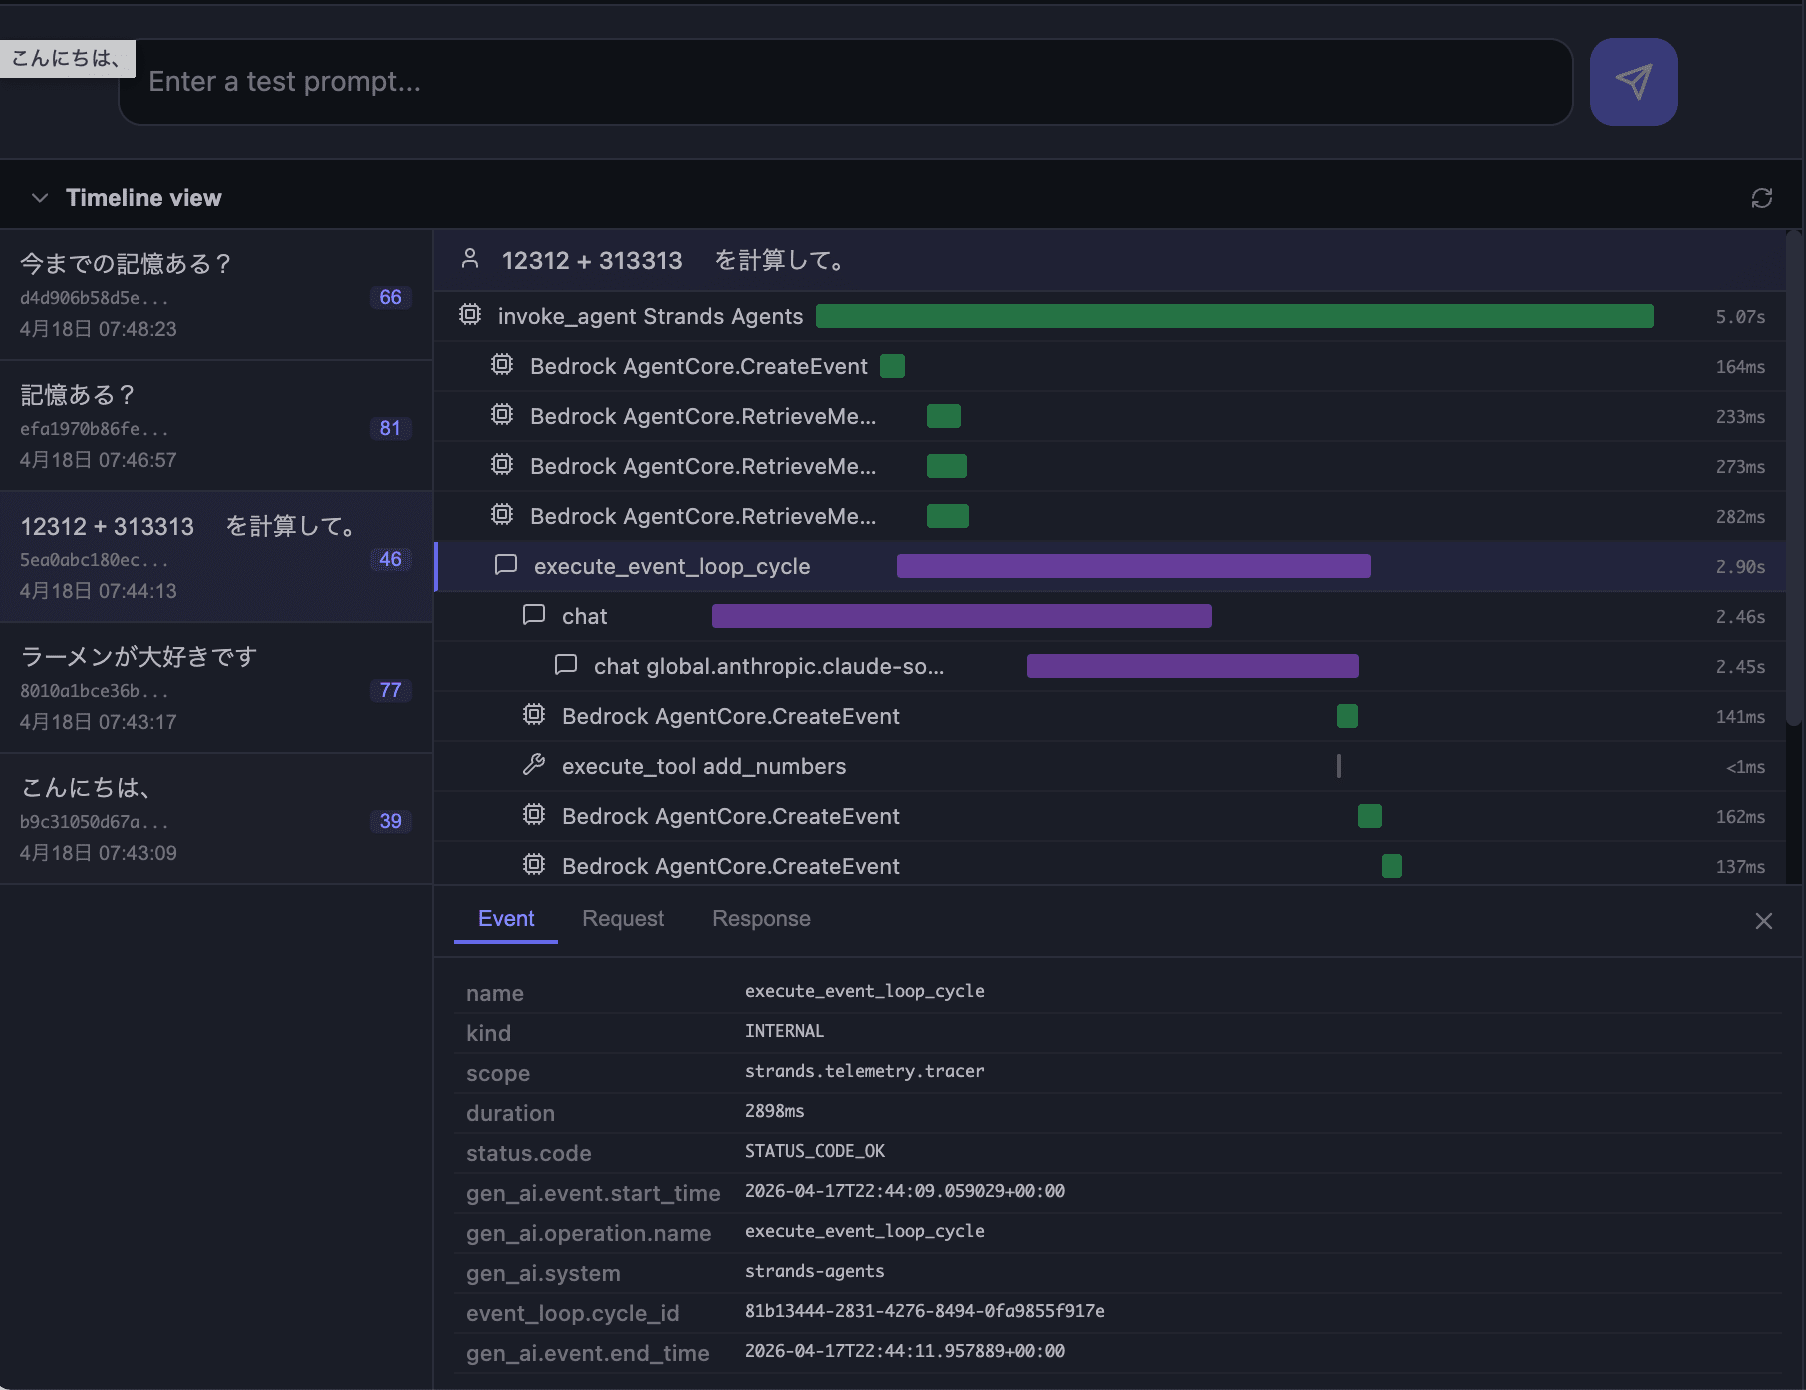
Being able to track the agent's internal operations in detail is helpful! Also, from the session list on the left, you can select past sessions, making it easy to compare behaviors between different sessions.
You can check details in the same way in the "Traces" tab on the right.
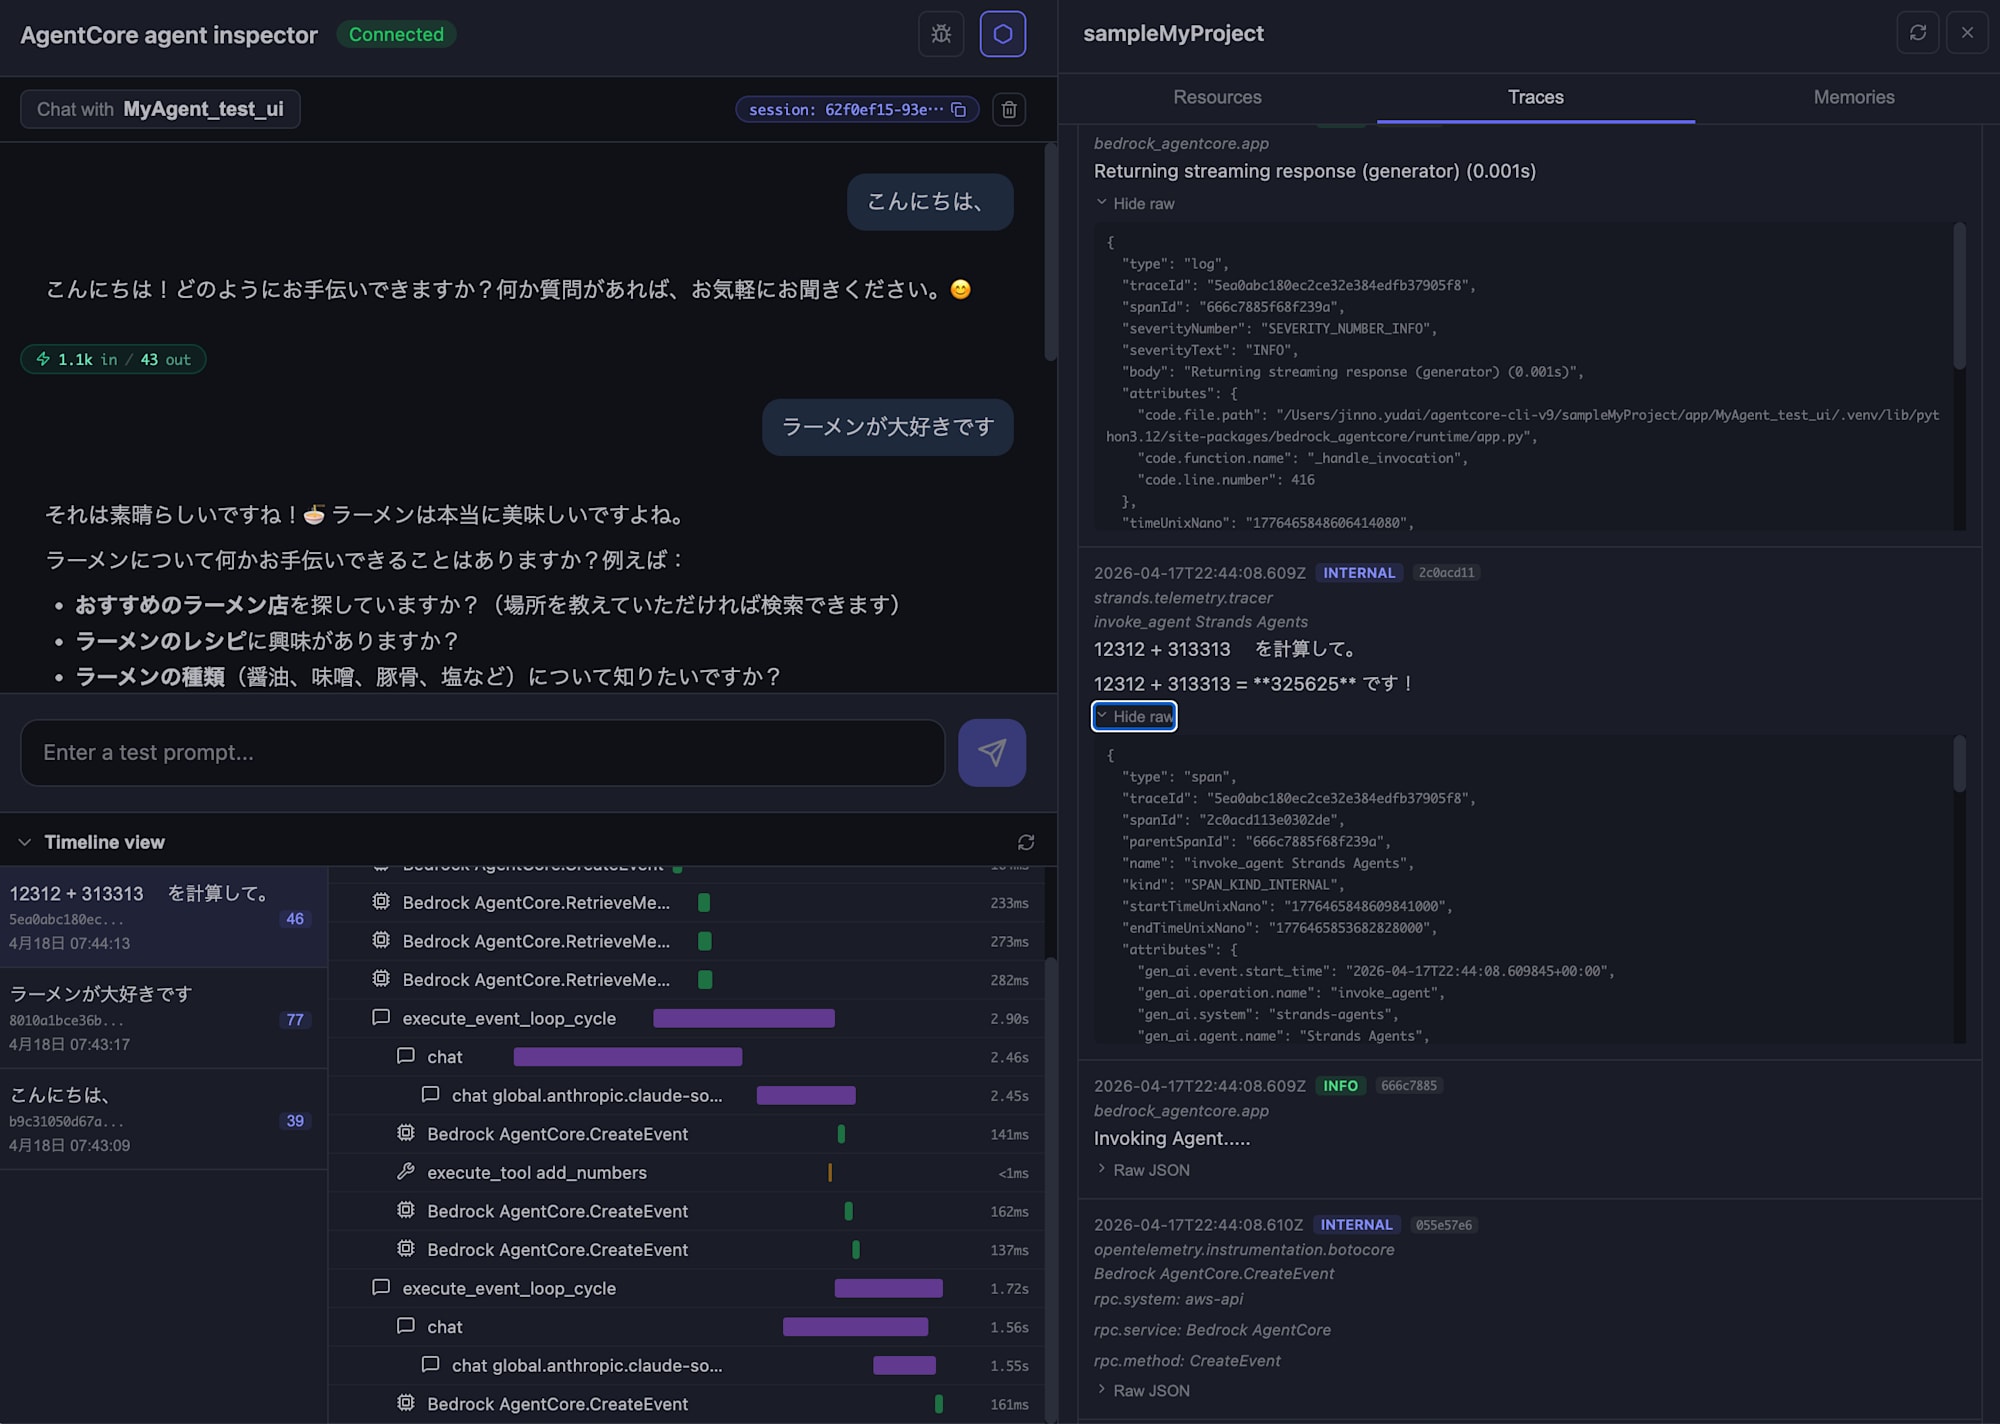
In the Traces tab, collected spans/logs are displayed chronologically, and expanding "Hide raw" for each entry shows the raw OpenTelemetry data (traceId / spanId / parentSpanId / attributes, etc.).
Since I set up Memory, let's check if the agent remembers our conversation!
Confirming Memory Retention
Memory Within the Same Session (Short-term Memory)
In the same session where we've been chatting, I asked "Do you remember?" to check short-term memory.
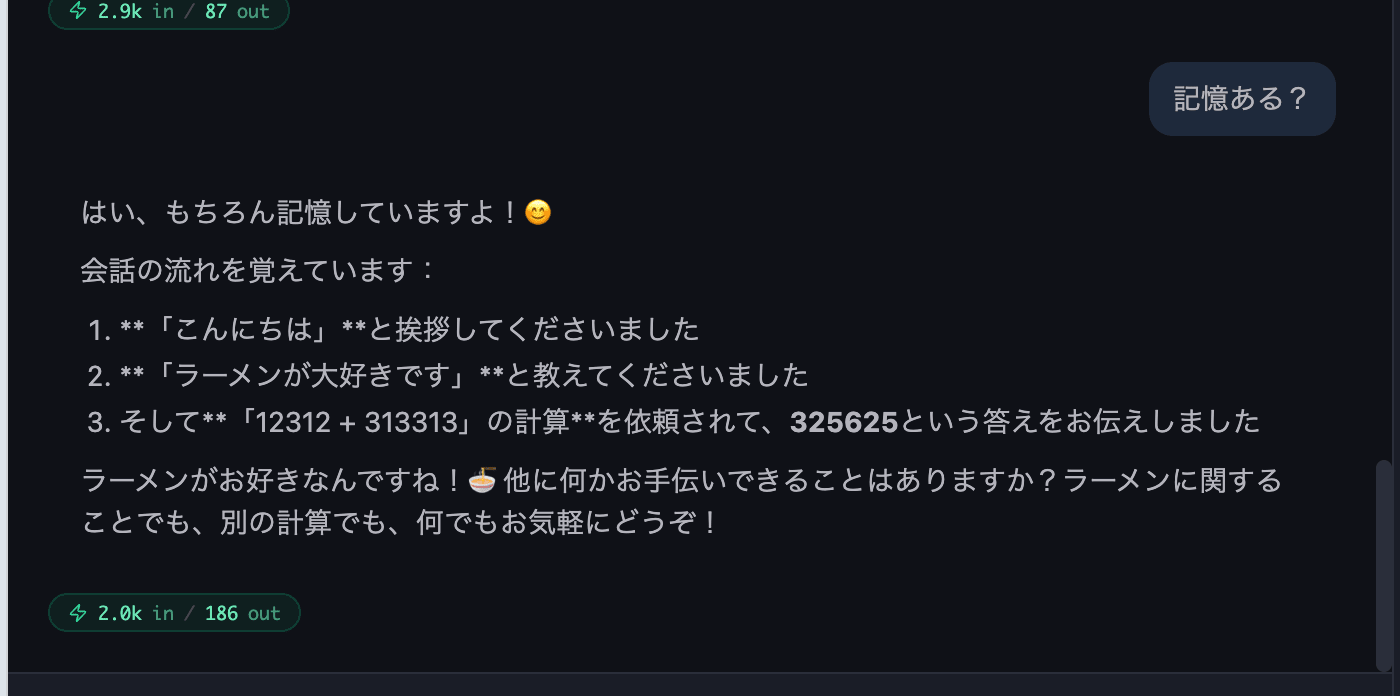
This falls under short-term memory, so I confirmed that the agent correctly remembered the recent exchanges within the same session.
Memory That Persists After Discarding Sessions (Long-term Memory)
Next, I discarded the session using the trash icon in the top-right of the chat, started a new session, and asked "Do you remember our previous conversations?"
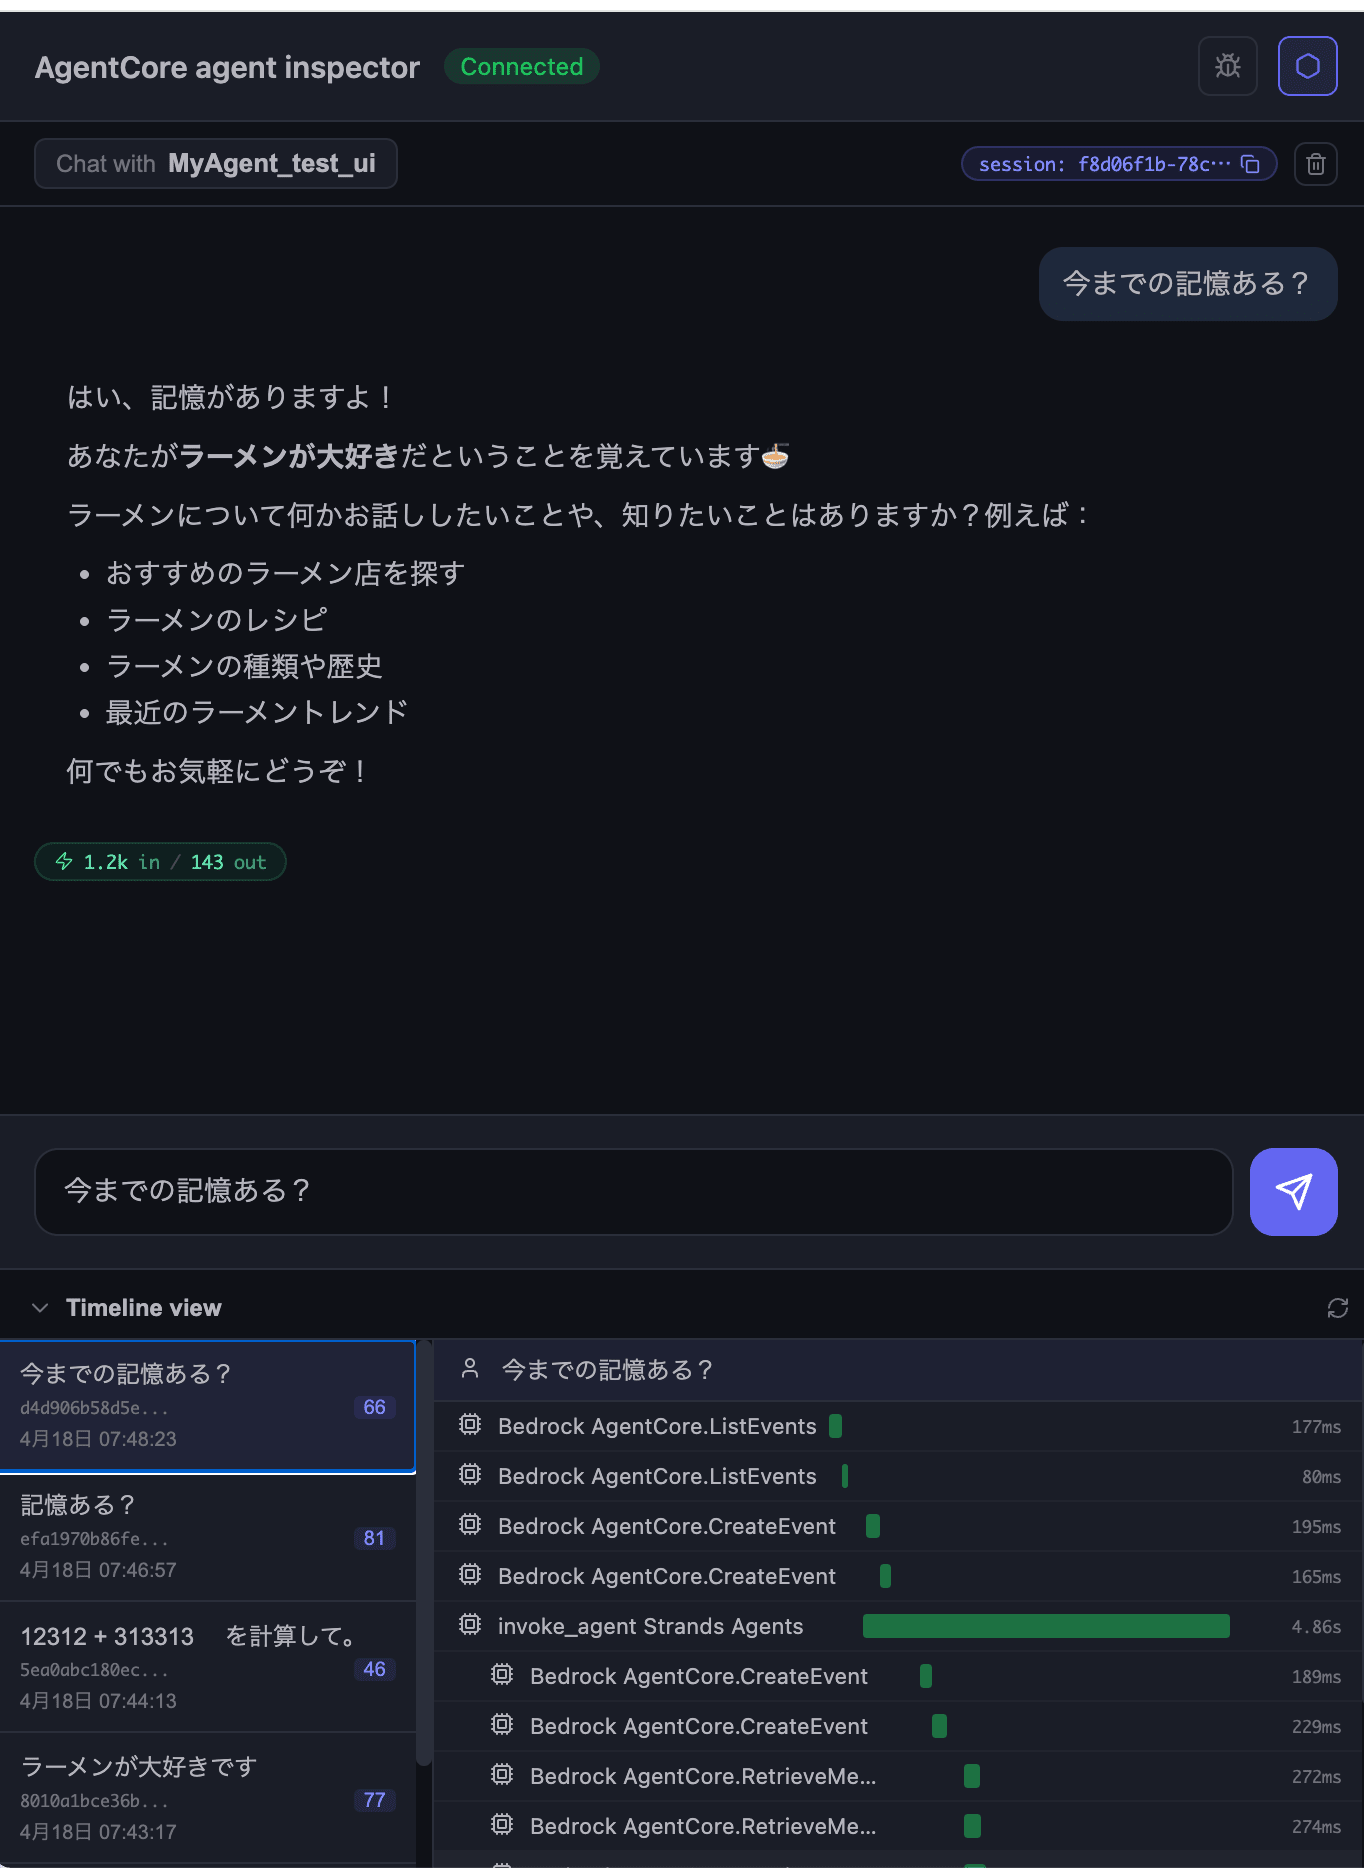
Long-term memory is working properly too! It's great that we can also see in the Timeline view how it's retrieving from Memory behind the scenes.
Checking Saved Memories in the Memories Tab
Finally, let's open the "Memories" tab on the right. Here we can specify a Strategy to directly examine memory records stored in the deployed Memory.
Specify the following at the top of the screen and press "List" to see the records:
| Item | Content |
|---|---|
| MEMORY | Target Memory resource (e.g., MyAgent_test_uiMemory) |
| STRATEGY | Strategy to reference (SEMANTIC / USER_PREFERENCE / SUMMARIZATION / EPISODIC) |
| ACTORID | Target actor (e.g., default-user) |
| SEARCH | Semantic search query (optional) |
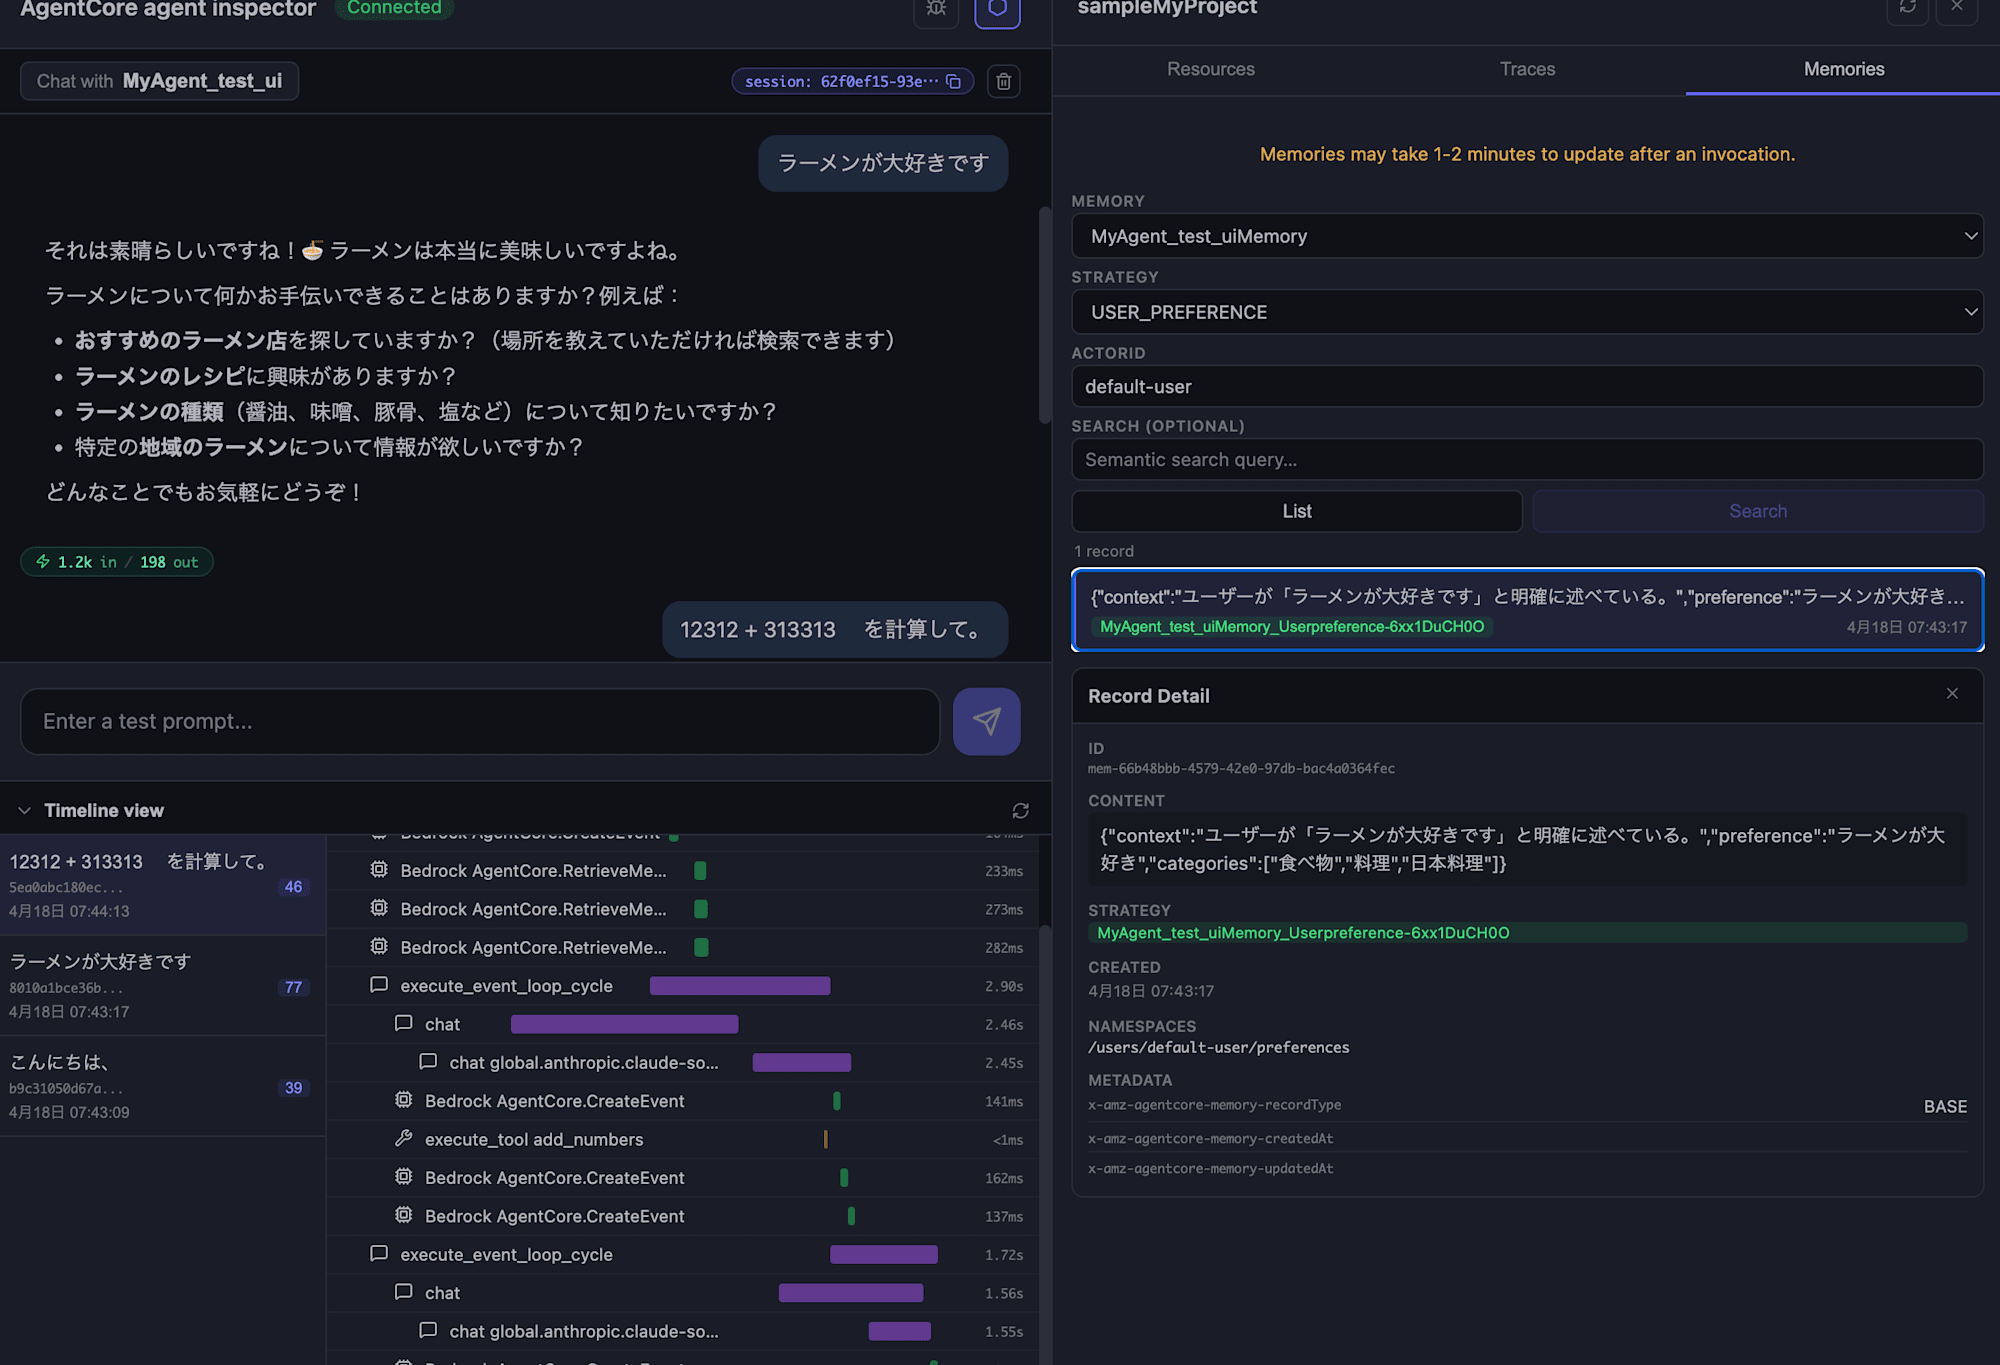
I chose USER_PREFERENCE and found the following record:
{
  "context": "ユーザーが「ラーメンが大好きです」と明確に述べている。",
  "preference": "ラーメンが大好き",
  "categories": ["食べ物", "料理", "日本料理"]
}
I could also select "Search" to enter queries and search. The relevance score display makes it very understandable.
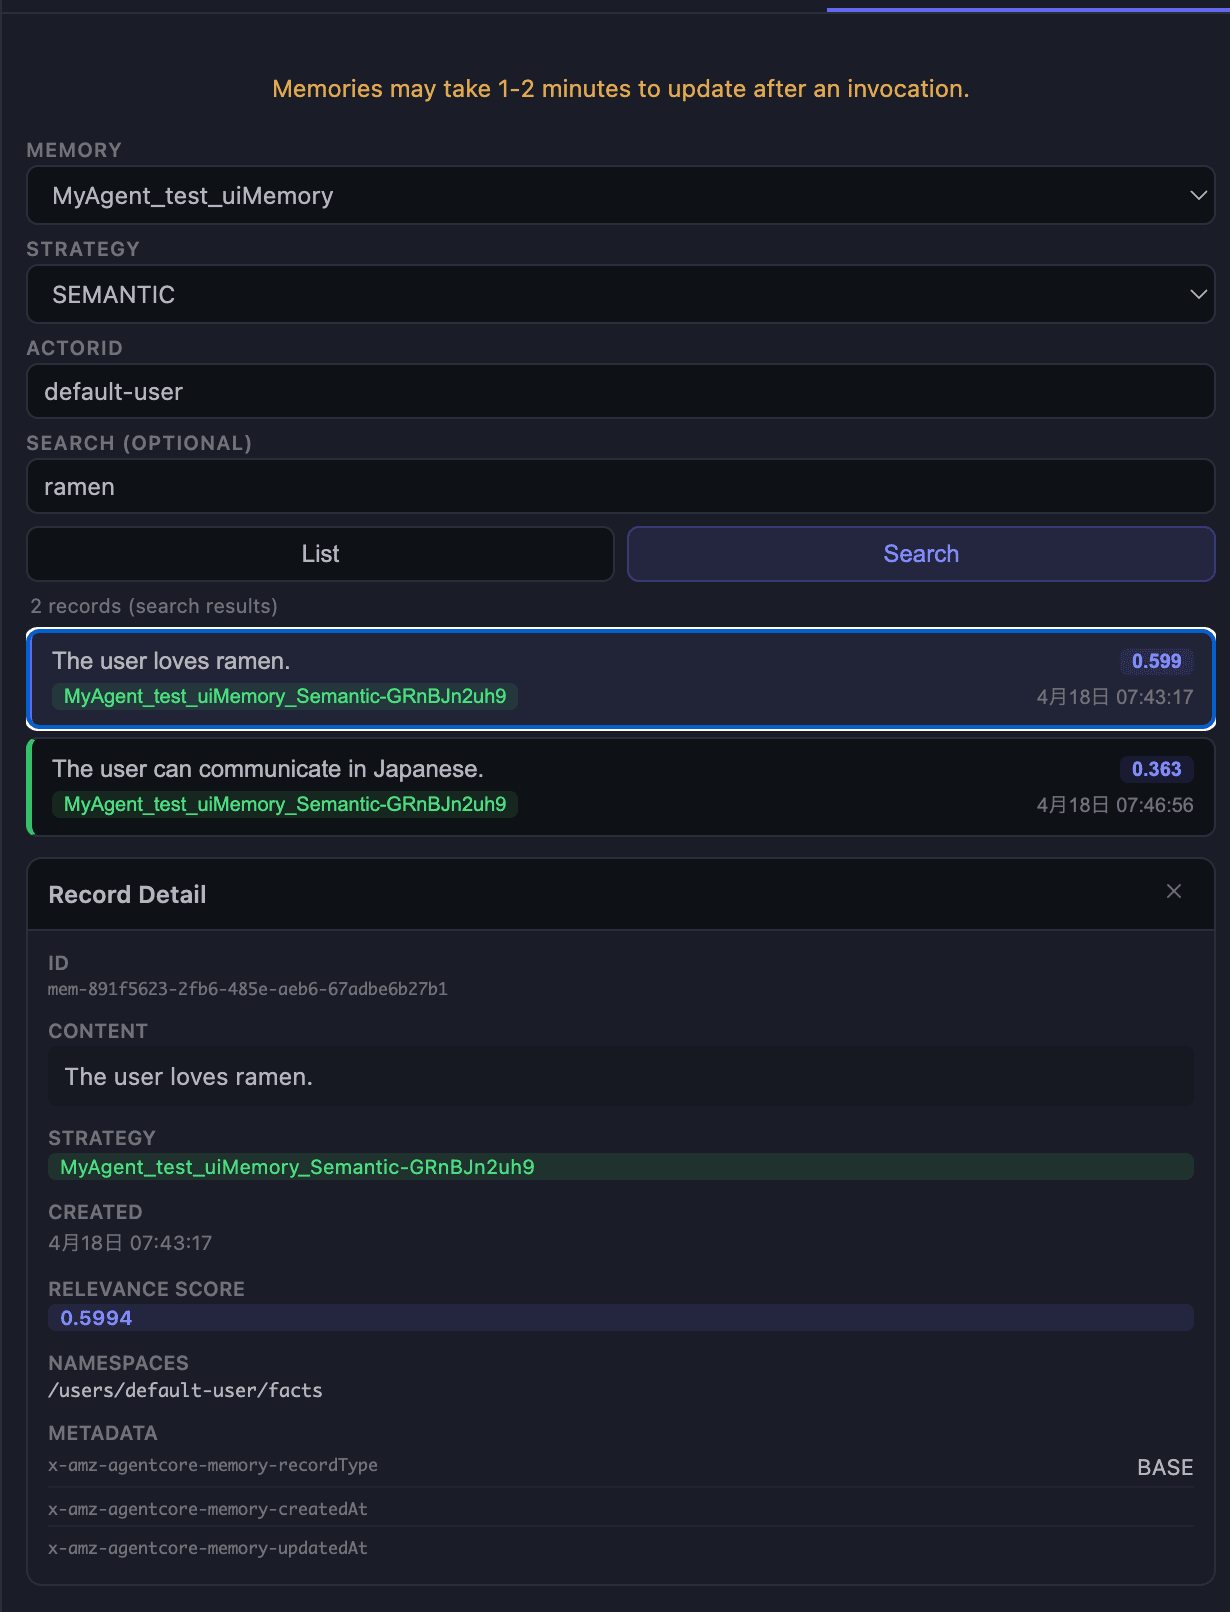
Until now, I had to use CLI or scripts to check what kind of long-term memories were being retrieved, so being able to check this on the screen is very helpful.
While the Timeline view keeps a record of all interactions, there doesn't seem to be a way to restore the chat itself yet. It would be nice to have a feature to resume conversations in the future.
Conclusion
Being able to easily test in a browser is quite helpful. It feels like having AgentCore Observability locally, and being able to track tool calls in the Timeline is very convenient. I'm looking forward to seeing more features added in the future!
I hope this article was helpful. Thank you for reading until the end!
Additional Note
Bug Reports Can Be Sent From the Screen
There's a bug icon for "Report an issue" in the top right of the Agent Inspector screen.
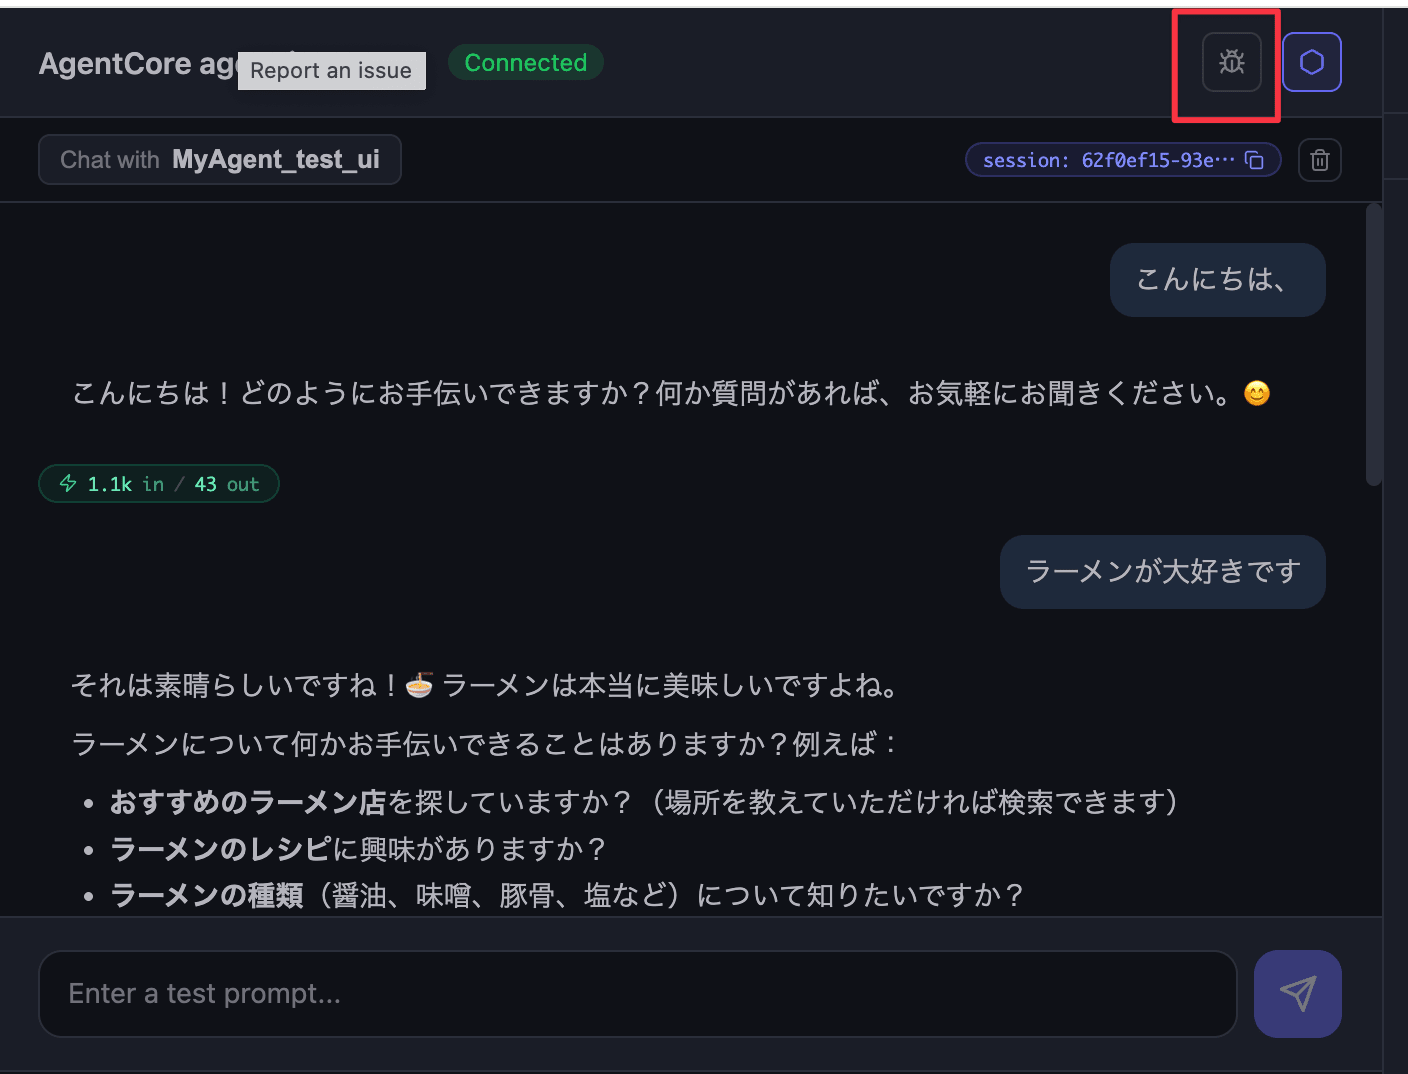
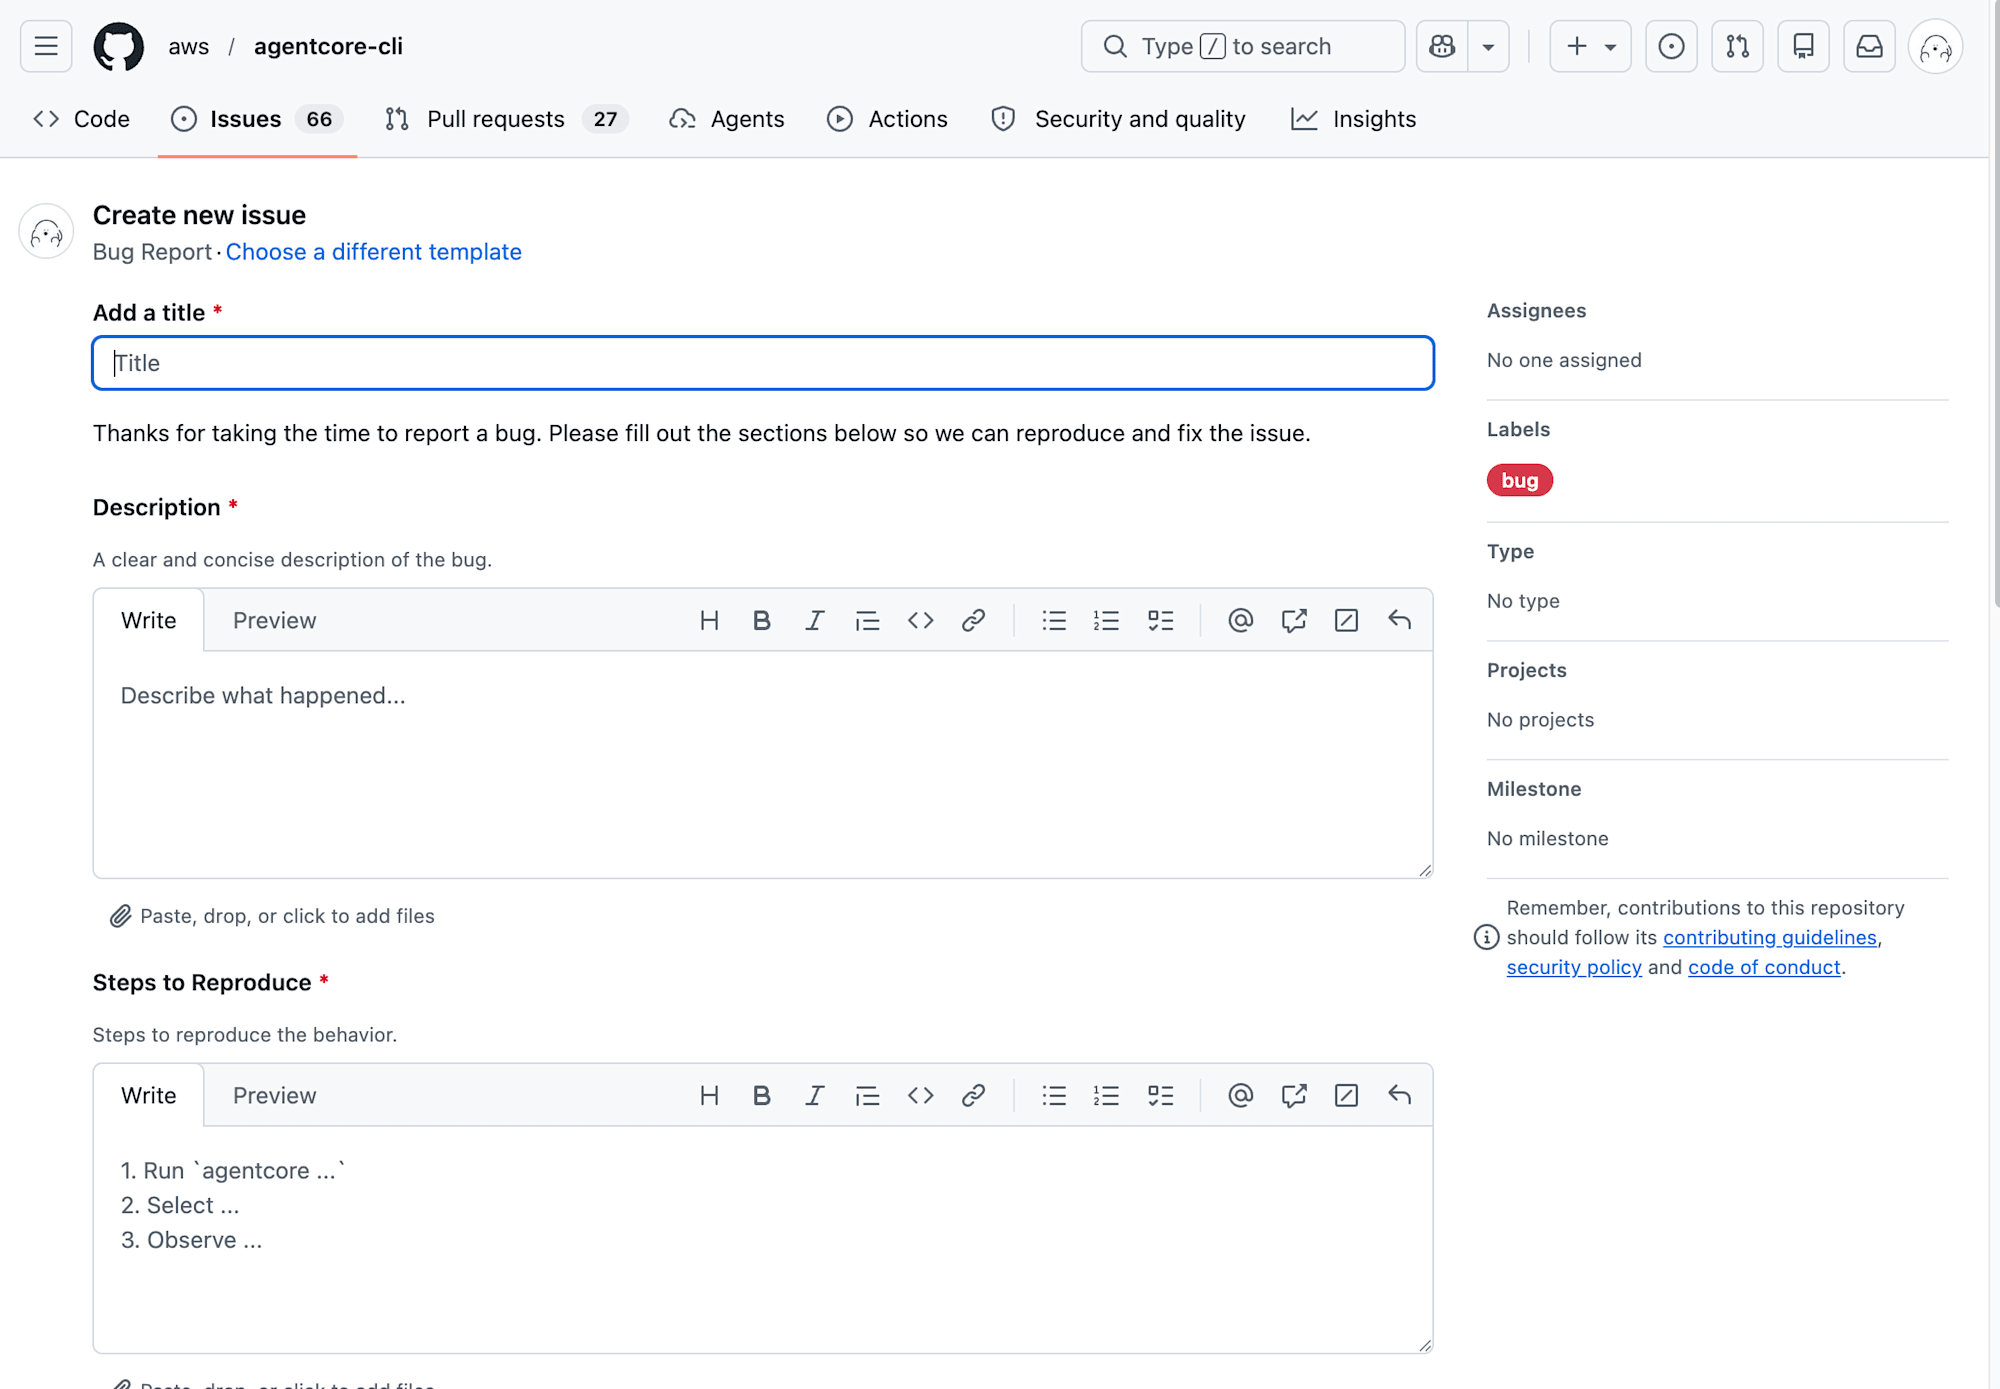
It's great to be able to report issues directly from the screen when you notice something odd! I think I'll submit an issue about messages being sent when pressing Enter after text conversion!
