I tried AgentCore Observability across accounts

This page has been translated by machine translation. View original
Introduction
Hello, I'm Jinno from the Consulting Department, currently practicing driving.
I got nervous getting on the expressway after a long time.
Now, changing the subject — are you all using AgentCore Observability?
It's convenient to have the behavior of AI agents visualized, isn't it? You might have cases where you want to consolidate the visualized information into a single account...
In that context, I found in the official documentation that AgentCore Observability supports CloudWatch cross-account observability.
It seems that by preparing one monitoring account, you can check metrics, traces, and sessions of agents deployed across multiple source accounts from a single location.
I referenced the official documentation steps and tried it out using two actual accounts!
Overview of the Architecture
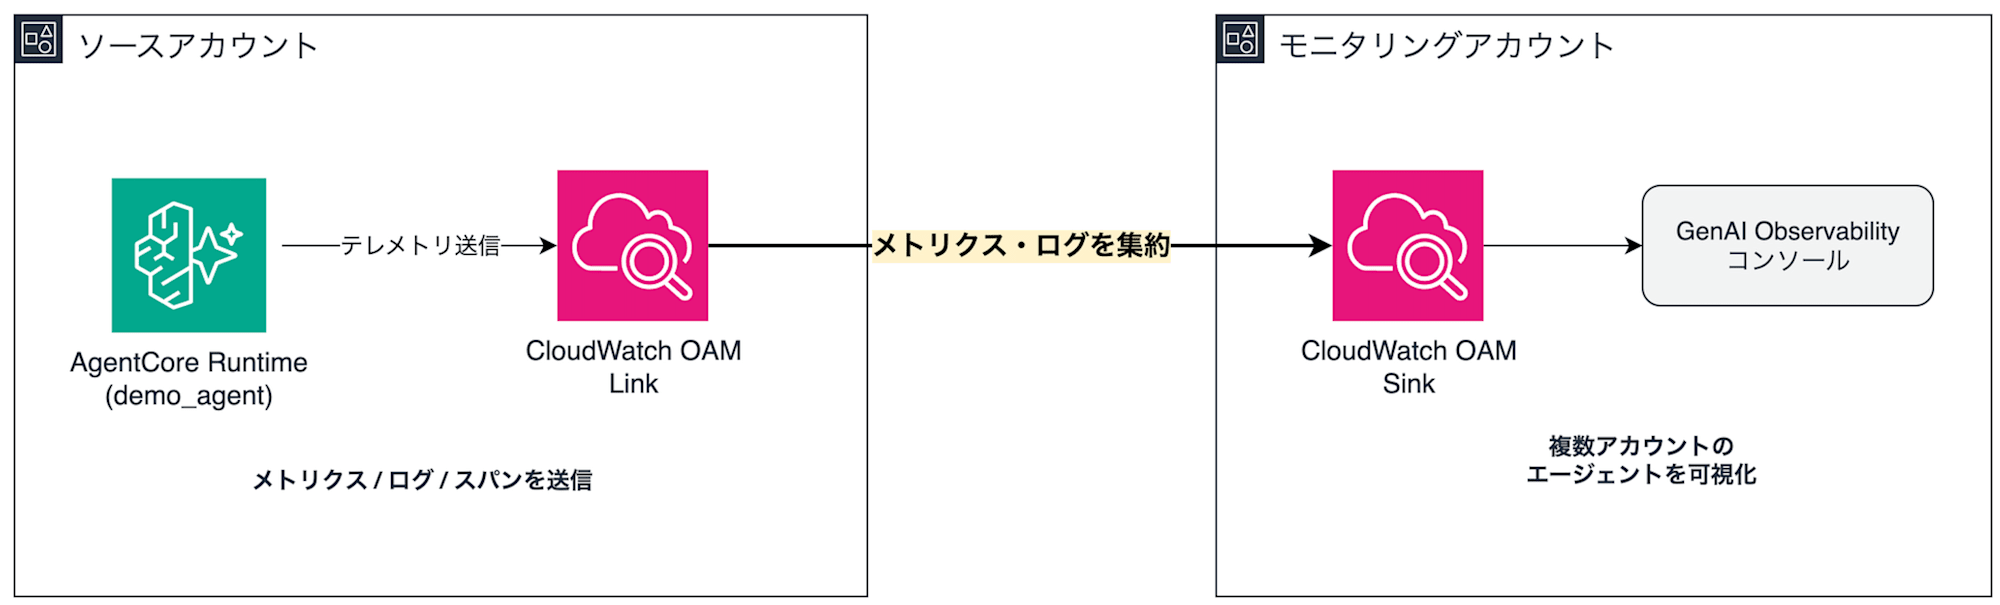
Cross-account observability is achieved using CloudWatch's Observability Access Manager (OAM) mechanism.
| Resource | Where to Create | Role |
|---|---|---|
| Sink | Monitoring account | Entry point for accepting telemetry from source accounts |
| Link | Source account | Connection that specifies the Sink ARN to share telemetry |
By creating one Sink in the monitoring account and establishing Links from each source account, data from source accounts is automatically displayed in the AgentCore Observability console of the monitoring account.
For details on this mechanism, Kawahara-san has written a thorough explanation, so please refer to it as needed.
The telemetry types required for AgentCore observability are Metrics and Logs. Since trace and session data is stored in a log group called aws/spans, it is included as part of Logs sharing.
The configuration we will build this time is as follows.
Prerequisites
The verification environment for this time is as follows. (Account IDs are dummies)
| Item | Details |
|---|---|
| Monitoring account | 111111111111 |
| Source account | 222222222222 |
| Region | us-east-1 |
| Agent | Strands agent created with AgentCore CLI |
We'll start by creating the source-side agent using the AgentCore CLI (agentcore command). If you haven't installed the CLI yet, you can install it with the following. The version used this time is 1.0.0-preview.16.
npm install -g @aws/agentcore
Setup
The OAM setup can also be done from the console, but this time we'll build it as IaC using the CloudFormation template described in the official documentation. The steps are the following 4 steps.
- Deploy an agent to the source account using AgentCore CLI
- Enable Transaction Search in both accounts
- Create an OAM Sink in the monitoring account
- Create an OAM Link in the source account
Deploy an Agent to the Source Account
First, let's create the agent to be monitored. Running agentcore create from the AgentCore CLI allows you to create a project in an interactive format. This time I went with a simple Strands framework configuration.
agentcore create --project-name crossacctdemo --name demo_agent \
  --framework Strands --model-provider Bedrock --memory none
[done]  Create crossacctdemo/ project directory
[done]  Prepare agentcore/ directory
[done]  Add agent to project
[done]  Set up Python environment

Created:
  crossacctdemo/
    app/demo_agent/  Python agent (Strands)
    agentcore/       Config and CDK project

Project created successfully!
The agent body (app/demo_agent/main.py) and CDK deployment settings are generated together. Let's look at the entry point section of the generated main.py. Since I wanted to check application logs cross-account later, I added one line to output the received prompt as a log.
app = BedrockAgentCoreApp()
log = app.logger

# Simple tool that adds numbers
@tool
def add_numbers(a: int, b: int) -> int:
    """Return the sum of two numbers"""
    return a+b

@app.entrypoint
async def invoke(payload, context):
    log.info("Invoking Agent.....")

    agent = get_or_create_agent()

    prompt = _extract_prompt(payload)
    log.info("Received prompt: %s", prompt)  # Added: for checking application logs

    async for event in agent.stream_async(prompt):
        ...
Logs output with app.logger are recorded as application logs in the AgentCore runtime log group. After that, simply run agentcore deploy with the source account credentials.
cd crossacctdemo
agentcore deploy -y
✓ Deployed to 'default' (stack: AgentCore-crossacctdemo-default)

Outputs:
  ...RuntimeArnOutput...: arn:aws:bedrock-agentcore:us-east-1:222222222222:runtime/crossacctdemo_demo_agent-XXXXXXXXXX
  ...RuntimeIdOutput...: crossacctdemo_demo_agent-XXXXXXXXXX
  StackNameOutput: AgentCore-crossacctdemo-default

Note: Transaction search enabled. It takes ~10 minutes for transaction search
to be fully active and for traces from invocations to be indexed.
Next: agentcore invoke | agentcore status
The runtime and IAM roles were deployed together as a CDK stack.
Enabling Transaction Search
To check AgentCore traces and sessions in the console, CloudWatch transaction search (a setting that changes the X-Ray trace destination to CloudWatch Logs) must be enabled.
To allow span ingestion, enable transaction search once per account. Open the Transaction Search screen in the CloudWatch console and click the "Enable Transaction Search" button below to enable it.
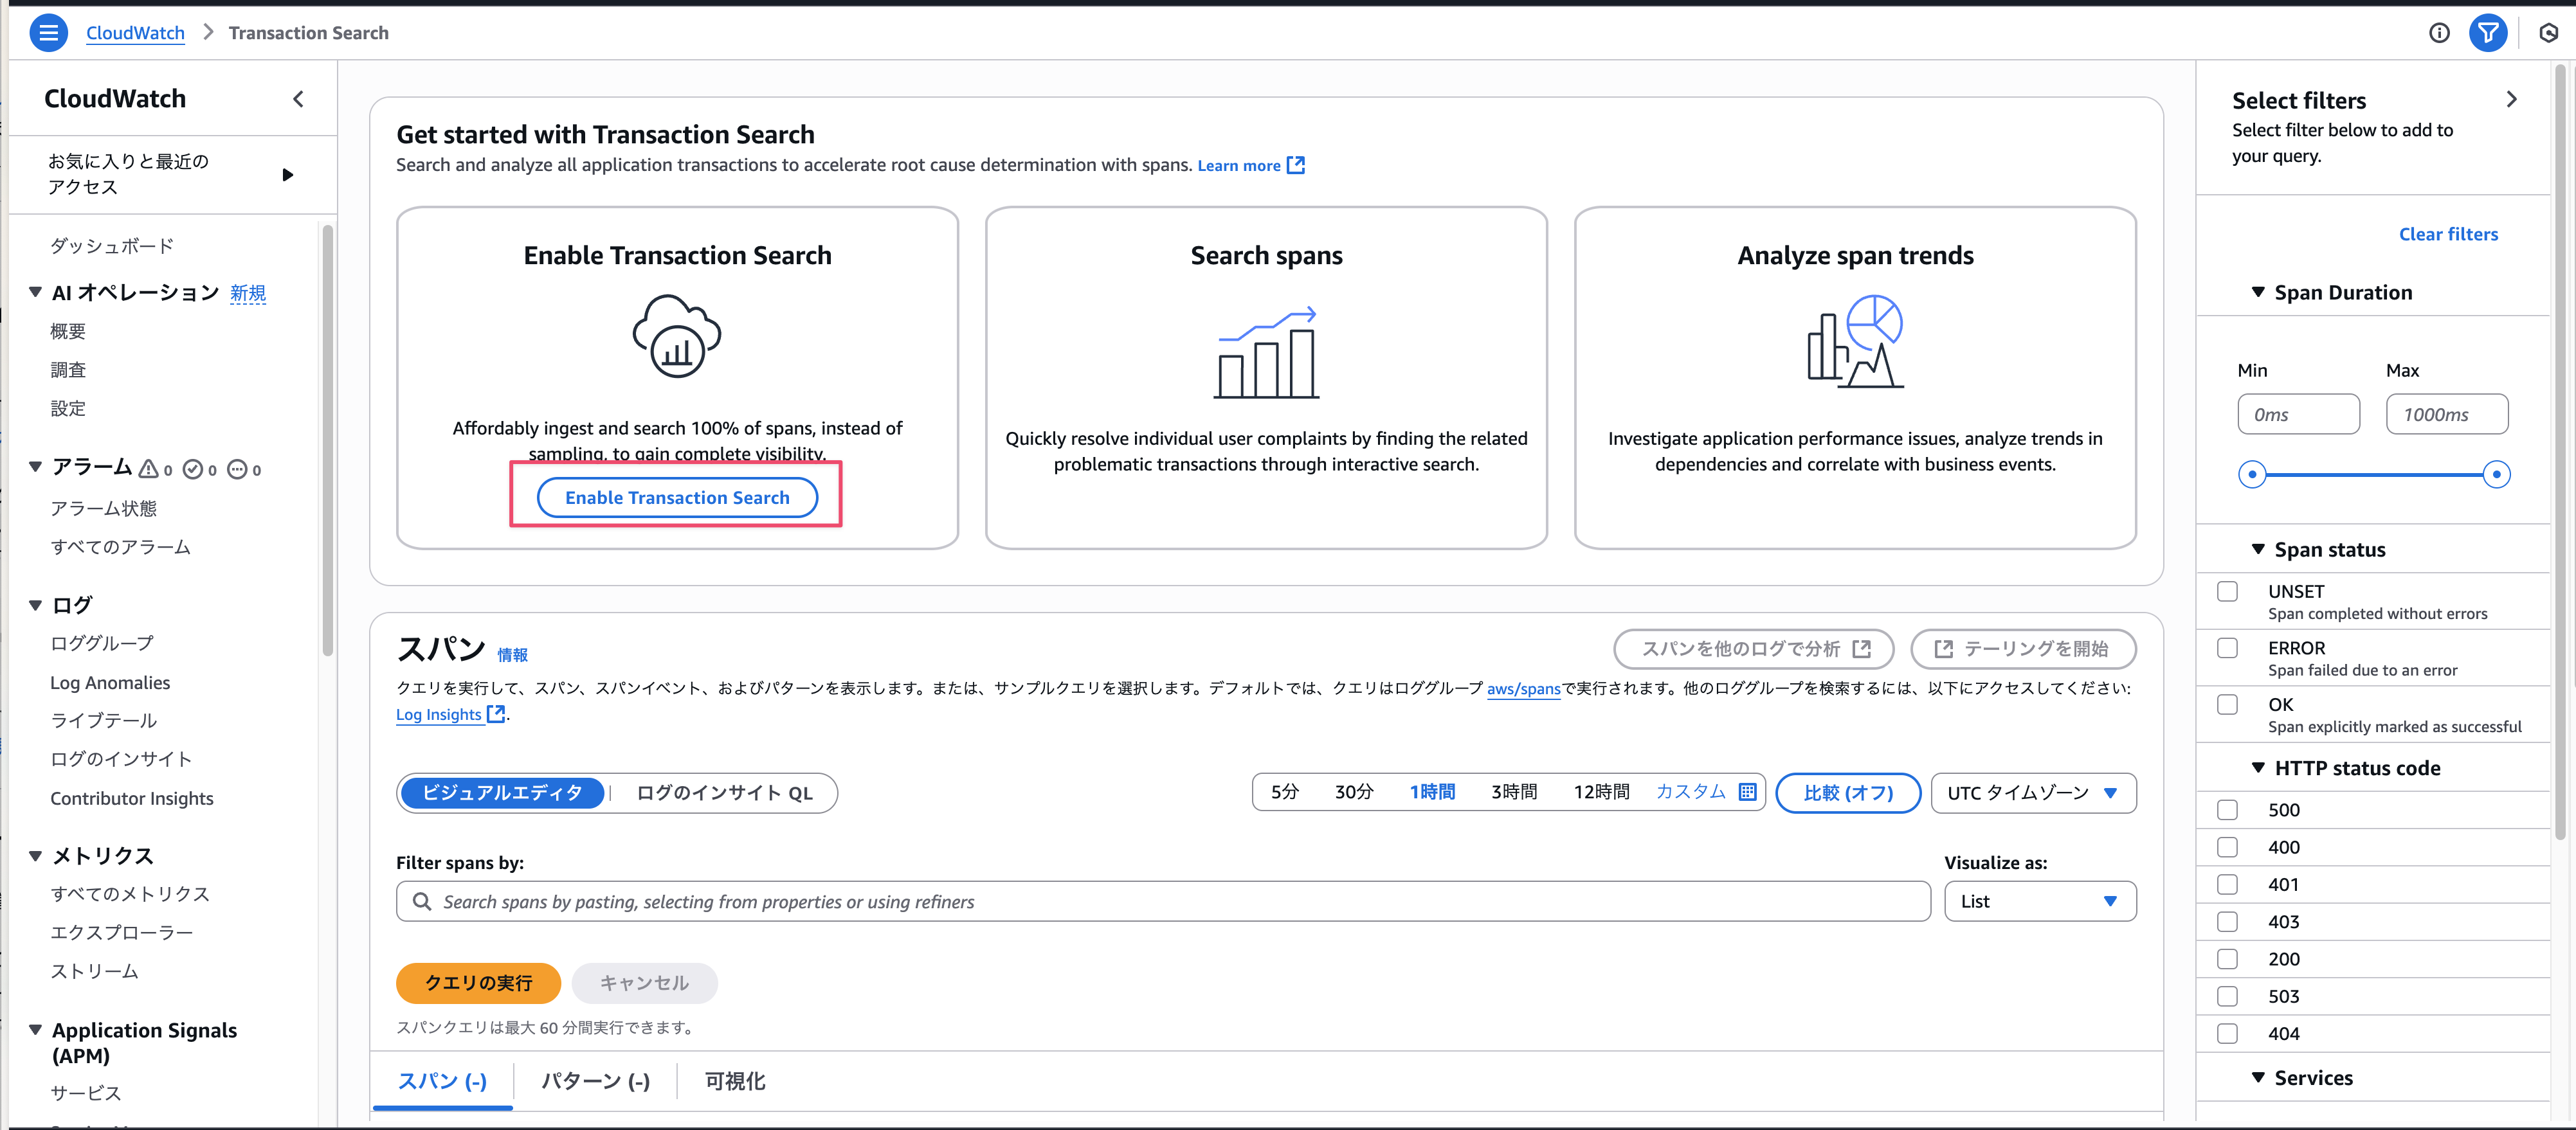
Perform this operation for both the monitoring account and the source account. Note that as shown by the "Transaction search enabled" display in the earlier agentcore deploy output, when deploying with the AgentCore CLI, enabling on the source account side is done automatically, so in practice only the monitoring account side needs to be handled.
Creating an OAM Sink in the Monitoring Account
Next is the monitoring account side. We'll create a Sink to accept Link creation from source accounts. Here is a version based on the official documentation template, with the source account ID parameterized.
AWSTemplateFormatVersion: '2010-09-09'
Description: OAM Sink for cross-account AgentCore Observability (specific accounts)

Parameters:
  SourceAccountId:
    Type: String
    Description: Source account ID to allow linking

Resources:
  ObservabilitySink:
    Type: AWS::Oam::Sink
    Properties:
      Name: AgentCoreObservabilitySink
      Policy:
        Version: '2012-10-17'
        Statement:
          - Effect: Allow
            Principal:
              AWS:
                - !Ref SourceAccountId
            Action:
              - 'oam:CreateLink'
              - 'oam:UpdateLink'
            Resource: '*'
            Condition:
              ForAllValues:StringEquals:
                oam:ResourceTypes:
                  - 'AWS::Logs::LogGroup'
                  - 'AWS::CloudWatch::Metric'
      Tags:
        Purpose: AgentCoreObservability

Outputs:
  SinkArn:
    Value: !GetAtt ObservabilitySink.Arn
    Description: Share this ARN with source accounts to create links
The Sink policy controls which accounts are allowed to create Links. Since the Condition on oam:ResourceTypes restricts sharing to only Logs and Metrics, there is no concern about unintended telemetry types being shared.
Deploy with the monitoring account credentials.
aws cloudformation deploy \
  --template-file monitoring-sink.yaml \
  --stack-name agentcore-observability-sink \
  --parameter-overrides SourceAccountId=222222222222 \
  --region us-east-1
Once the deployment is complete, note down the Sink ARN from the Outputs.
aws cloudformation describe-stacks \
  --stack-name agentcore-observability-sink \
  --query 'Stacks[0].Outputs[0].OutputValue' \
  --output text \
  --region us-east-1
arn:aws:oam:us-east-1:111111111111:sink/556e6669-6692-4950-86dc-18276be0c5a3
Creating an OAM Link in the Source Account
Next is the source account side. We'll create a Link specifying the Sink ARN noted earlier.
AWSTemplateFormatVersion: '2010-09-09'
Description: OAM Link for cross-account AgentCore Observability

Parameters:
  SinkArn:
    Type: String
    Description: Sink ARN from the monitoring account

Resources:
  ObservabilityLink:
    Type: AWS::Oam::Link
    Properties:
      LabelTemplate: '$AccountName'
      ResourceTypes:
        - 'AWS::Logs::LogGroup'
        - 'AWS::CloudWatch::Metric'
      SinkIdentifier: !Ref SinkArn
      Tags:
        Purpose: AgentCoreObservability
LabelTemplate is the display name used to identify the source account on the monitoring account side. Specifying $AccountName uses the account name directly as the label. The ResourceTypes must match the range allowed by the Sink policy.
This time, ResourceTypes is set to share Logs and Metrics. Since no filtering by LinkConfiguration is configured, log groups and CloudWatch metrics within the source account will be broadly shared. If you want to limit to specific log groups or metric namespaces, you can filter with LinkConfiguration on the Link side.
Deploy with the source account credentials.
aws cloudformation deploy \
  --template-file source-link.yaml \
  --stack-name agentcore-observability-link \
  --parameter-overrides SinkArn=arn:aws:oam:us-east-1:111111111111:sink/556e6669-6692-4950-86dc-18276be0c5a3 \
  --region us-east-1
Let's check if the Link was created successfully.
aws oam list-links --region us-east-1
{
    "Items": [
        {
            "Arn": "arn:aws:oam:us-east-1:222222222222:link/8d09e5f3-0884-44b0-a235-54d7e87837ab",
            "Id": "8d09e5f3-0884-44b0-a235-54d7e87837ab",
            "Label": "sandbox",
            "ResourceTypes": [
                "AWS::Logs::LogGroup",
                "AWS::CloudWatch::Metric"
            ],
            "SinkIdentifier": "arn:aws:oam:us-east-1:111111111111:sink/556e6669-6692-4950-86dc-18276be0c5a3"
        }
    ]
}
The Link has been created successfully! The setup is now complete.
Let's verify it right away!
Verification
Generating Telemetry
First, let's invoke the deployed agent to generate telemetry. We'll call it with agentcore invoke.
agentcore invoke '{"prompt": "What is 123 plus 456? Please calculate using a tool."}'
Session: b96f6616-36fb-46bd-b226-c3c0ea52ea12

--- RESPONSE ---
{
  "success": true,
  "response": "123 plus 456 equals **579**."
}
A response was returned after calculating using the add_numbers tool. Behind the scenes, metrics, logs, and spans are now being generated.
Checking from the Monitoring Account via CLI
From here, all operations are performed with monitoring account credentials. First, let's check the list of Links connected to the Sink.
aws oam list-attached-links \
  --sink-identifier arn:aws:oam:us-east-1:111111111111:sink/556e6669-6692-4950-86dc-18276be0c5a3 \
  --region us-east-1
{
    "Items": [
        {
            "Label": "sandbox",
            "LinkArn": "arn:aws:oam:us-east-1:222222222222:link/8d09e5f3-0884-44b0-a235-54d7e87837ab",
            "ResourceTypes": [
                "AWS::Logs::LogGroup",
                "AWS::CloudWatch::Metric"
            ]
        }
    ]
}
The source account is properly linked! Next, let's check the metrics. By adding the --include-linked-accounts option, you can also list metrics from linked accounts.
aws cloudwatch list-metrics \
  --include-linked-accounts \
  --owning-account 222222222222 \
  --region us-east-1 \
  --query 'Metrics[].[Namespace,MetricName]' \
  --output text | sort -u | head
AWS/Bedrock-AgentCore	Duration
AWS/Bedrock-AgentCore	Invocations
AWS/Bedrock-AgentCore	Latency
AWS/Bedrock-AgentCore	Sessions
AWS/Bedrock-AgentCore	SystemErrors
AWS/Bedrock-AgentCore	Throttles
AWS/Bedrock-AgentCore	UserErrors
The metrics from the source account's AWS/Bedrock-AgentCore namespace are visible from the monitoring account!!
Let's also retrieve the actual metric data. To get cross-account metric values, specify AccountId in get-metric-data.
[
  {
    "Id": "inv",
    "AccountId": "222222222222",
    "MetricStat": {
      "Metric": {
        "Namespace": "AWS/Bedrock-AgentCore",
        "MetricName": "Invocations",
        "Dimensions": [
          {"Name": "Resource", "Value": "arn:aws:bedrock-agentcore:us-east-1:222222222222:runtime/crossacctdemo_demo_agent-XXXXXXXXXX"},
          {"Name": "Operation", "Value": "InvokeAgentRuntime"},
          {"Name": "Name", "Value": "crossacctdemo_demo_agent::DEFAULT"}
        ]
      },
      "Period": 3600,
      "Stat": "Sum"
    }
  }
]
aws cloudwatch get-metric-data \
  --metric-data-queries file://metric-query.json \
  --start-time 2026-07-11T00:00:00Z \
  --end-time 2026-07-11T02:00:00Z \
  --region us-east-1
{
    "MetricDataResults": [
        {
            "Id": "inv",
            "Label": "Invocations",
            "Timestamps": [
                "2026-07-11T08:32:00+09:00"
            ],
            "Values": [
                1.0
            ],
            "StatusCode": "Complete"
        }
    ],
    "Messages": []
}
The earlier agent invocation was counted as an Invocation and was retrieved from the monitoring account!
Let's also check the logs. describe-log-groups has a similar option.
aws logs describe-log-groups \
  --include-linked-accounts \
  --account-identifiers 222222222222 \
  --region us-east-1 \
  --query 'logGroups[?contains(logGroupName, `agentcore`) || contains(logGroupName, `spans`)].logGroupName' \
  --output text
/aws/bedrock-agentcore/runtimes/crossacctdemo_demo_agent-XXXXXXXXXX-DEFAULT aws/spans
In addition to the agent's runtime logs, the aws/spans log group where trace data is stored is also visible.
Let's verify whether the application logs output by the agent itself can be read cross-account. We'll look for the output of log.info("Received prompt: ...") added to main.py from the monitoring account.
aws logs filter-log-events \
  --log-group-identifier "arn:aws:logs:us-east-1:222222222222:log-group:/aws/bedrock-agentcore/runtimes/crossacctdemo_demo_agent-XXXXXXXXXX-DEFAULT" \
  --filter-pattern 'prompt' \
  --max-items 1 \
  --region us-east-1 \
  --query 'events[].message' \
  --output text
{"resource":{"attributes":{"service.name":"crossacctdemo_demo_agent.DEFAULT",
"cloud.platform":"aws_bedrock_agentcore","cloud.region":"us-east-1",...}},
"severityText":"INFO",
"body":"Received prompt: {\"prompt\": \"What is 123 plus 456? Please calculate using a tool.\"}",
...}
The application logs output by the agent's code were confirmed from the monitoring account as well! Since OAM Logs sharing is at the log group level, not only AgentCore's standard telemetry but also application-specific logs are shared together.
Let's also check the trace span data in the same way.
aws logs filter-log-events \
  --log-group-identifier "arn:aws:logs:us-east-1:222222222222:log-group:aws/spans" \
  --filter-pattern 'crossacctdemo' \
  --max-items 1 \
  --region us-east-1 \
  --query 'events[].message' \
  --output text
{"resource":{"attributes":{"aws.local.service":"crossacctdemo_demo_agent.DEFAULT",
"cloud.region":"us-east-1","aws.service.type":"gen_ai_agent",
"cloud.platform":"aws_bedrock_agentcore",...}},
"traceId":"...","spanId":"...","kind":"CLIENT",...}
The OpenTelemetry span data generated by the agent could also be read! Successfully confirmed that all of metrics, application logs, and traces can be checked cross-account!
Checking via the Console
Since only checking via CLI feels a bit plain, let's also look at the main attraction — the AgentCore Observability console. Open the CloudWatch console in the monitoring account and select GenAI Observability from the left pane.
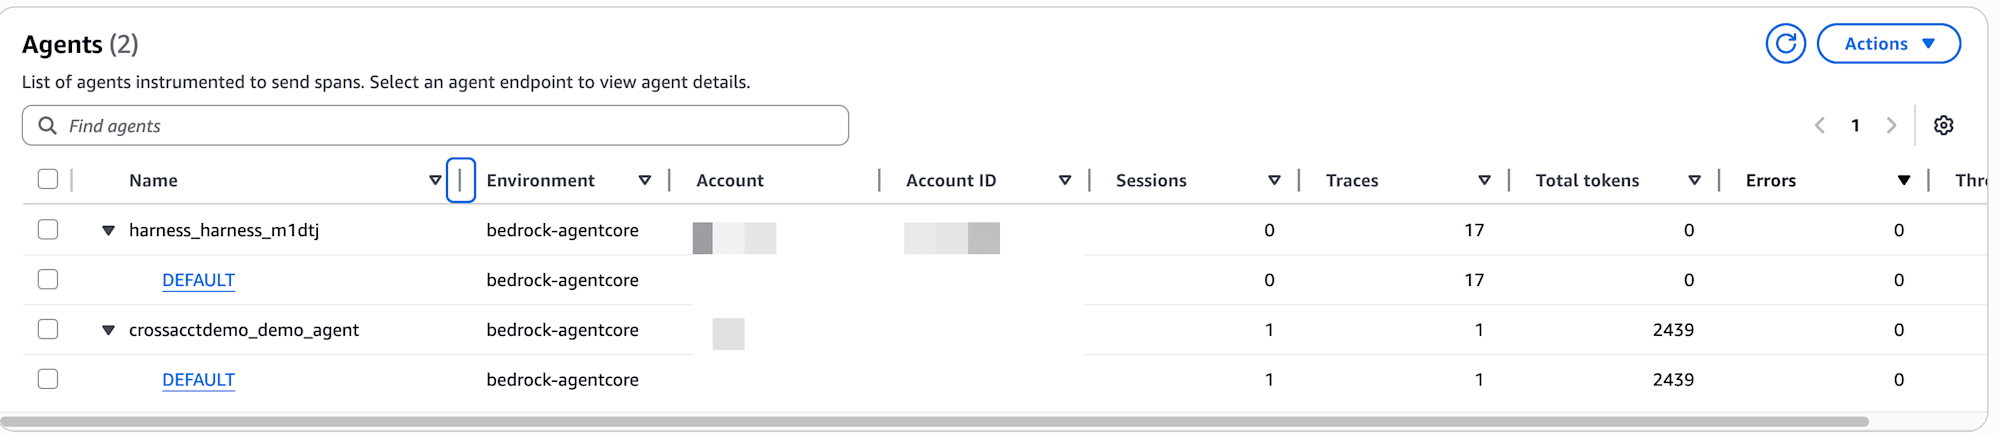
The source account's agent is automatically displayed in the monitoring account's console! After configuring cross-account, Account / Account ID columns are added to the list, making it easy to see at a glance which account each agent belongs to.
Let's also open the trace detail screen.
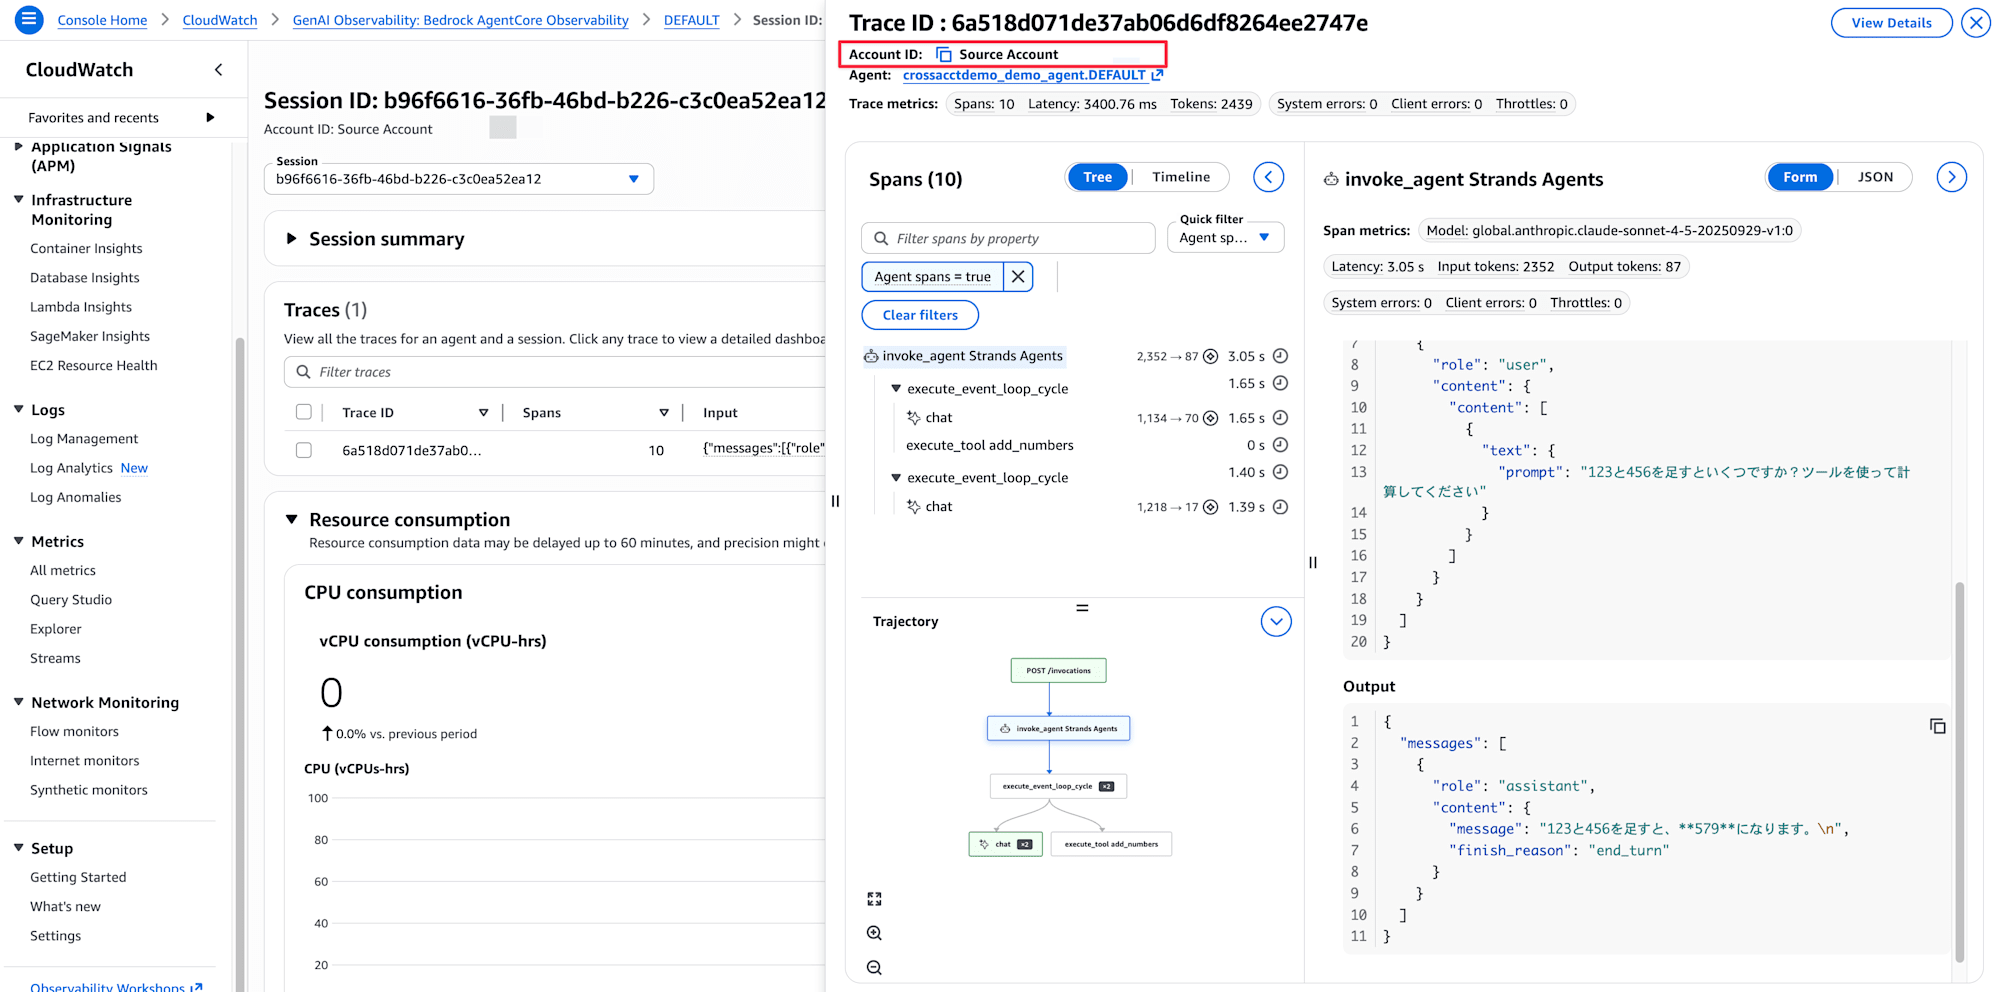
In the trace details, it is explicitly shown as Account ID: Source Account, indicating it is data from the source account. The span tree of the add_numbers tool call and LLM call, Trajectory, and even the contents of inputs and outputs could all be confirmed directly from the monitoring account!
Limitations
Here is a summary of the limitations described in the official documentation.
| Limitation | Details |
|---|---|
| Region | Works only within a single region. Monitoring and source must be in the same region |
| Link maintenance | If the OAM Link is deleted, cross-account data will no longer be visible |
| Telemetry types | Both Metrics and Logs sharing is required. If only one is set, data will be missing |
| Resource operations | Some operations such as navigation to the Bedrock console are not possible cross-account. Signing into the source account is required |
It is also good to be aware of the limitations and specifications of the underlying CloudWatch cross-account observability (OAM) itself.
| Item | Details |
|---|---|
| Number of Sinks | Up to 1 per account per region |
| Number of Links | A monitoring account can link with up to 100,000 source accounts. A source account can link to up to 5 monitoring accounts |
| Telemetry type consistency | If the source side selects more telemetry types than the monitoring side, Link creation itself will fail |
| Metrics display | Metric names will not appear in the monitoring account until new data points are published after Link creation |
| Deletion order | All Links must be deleted before a Sink can be deleted |
| Pricing | No additional charge for cross-account sharing itself. However, charges for the underlying features such as span ingestion for Transaction Search apply separately |
Conclusion
This feature seems useful for cases where you operate agents in a multi-account setup and want to visualize them using the operations team's account as the monitoring account! Going forward, I thought it would be worth exploring operational designs that combine this with alarms and dashboards.
I hope this article has been helpful in some way. Thank you for reading to the end!
Supplement: Cleaning Up the Verification Environment
Once verification is done, you can revert by deleting in the following order.
- Delete the Link stack in the source account (
aws cloudformation delete-stack --stack-name agentcore-observability-link) - Delete the Sink stack in the monitoring account (
aws cloudformation delete-stack --stack-name agentcore-observability-sink) - Delete the agent in the source account. Remove the agent from the project settings using the AgentCore CLI and redeploy to delete the runtime via CDK.
agentcore remove agent --name demo_agent -y
agentcore deploy -y
To completely delete including the CDK stack itself, run aws cloudformation delete-stack --stack-name AgentCore-crossacctdemo-default.