
I tried out CloudWatch Database Insights supported by Amazon Aurora DSQL

This page has been translated by machine translation. View original
Introduction
On August 20, 2026, an update was announced that Amazon Aurora DSQL now supports Amazon CloudWatch Database Insights.
DSQL Active Session History (DASH) automatically collects database load information at 1-minute intervals, and can be viewed from the console at no additional charge.
In this article, we verified the Database Insights console display, CloudWatch standard metrics retrieval, and DASH data retrieval via the PromQL API against a running Aurora DSQL cluster.
Verification Details
Console Display
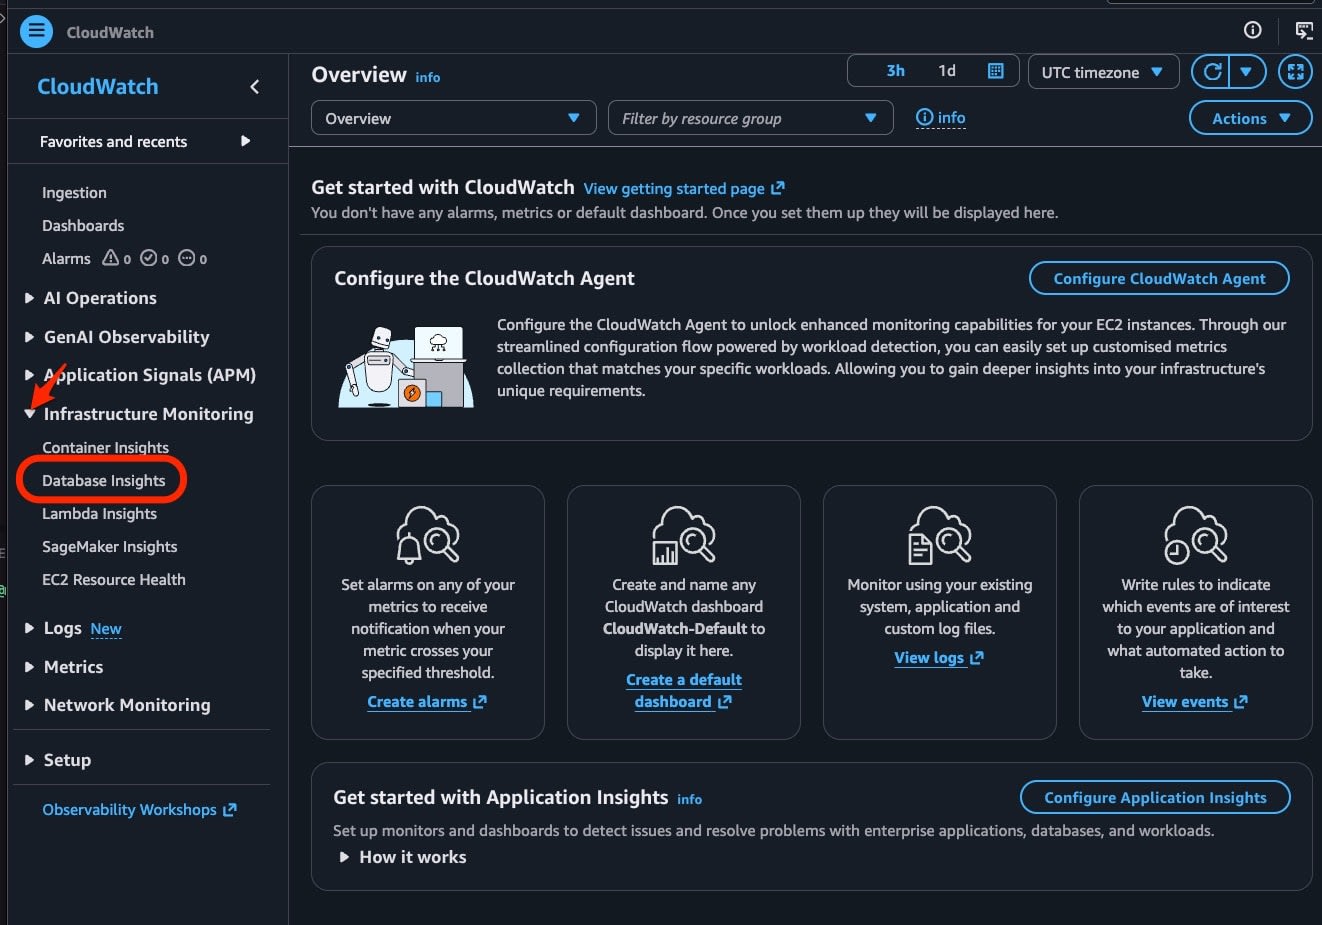
In the CloudWatch console, there was a Database Insights item under Infrastructure Monitoring in the left navigation. Simply by creating an Aurora DSQL cluster, you can access DASH data from here.
When you open the Database Instance Dashboard, a Database load chart is displayed at the top. The breakdown of Average active sessions can be switched between Waits or SQL Text, and the graph can be displayed as either Bar or Line.
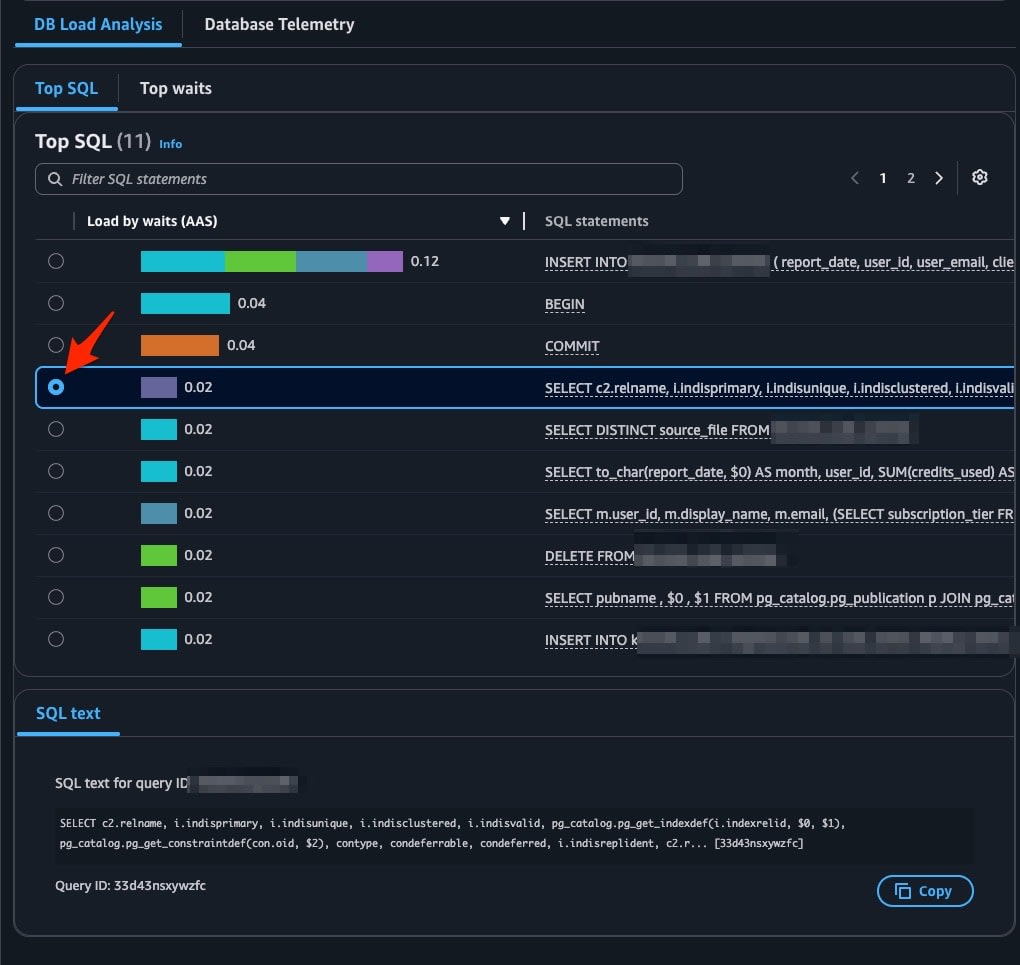
The DB Load Analysis section at the bottom has tabs for Top SQL and Top waits. In the Top SQL tab, the AAS per SQL statement is displayed as Load by waits (AAS), along with a list of SQL statements. When you select a SQL statement, the full query text and Query ID are displayed in the SQL text section at the bottom. The Engine field showed Aurora DSQL.
The Database Telemetry tab has 10 metric widgets arranged on it.
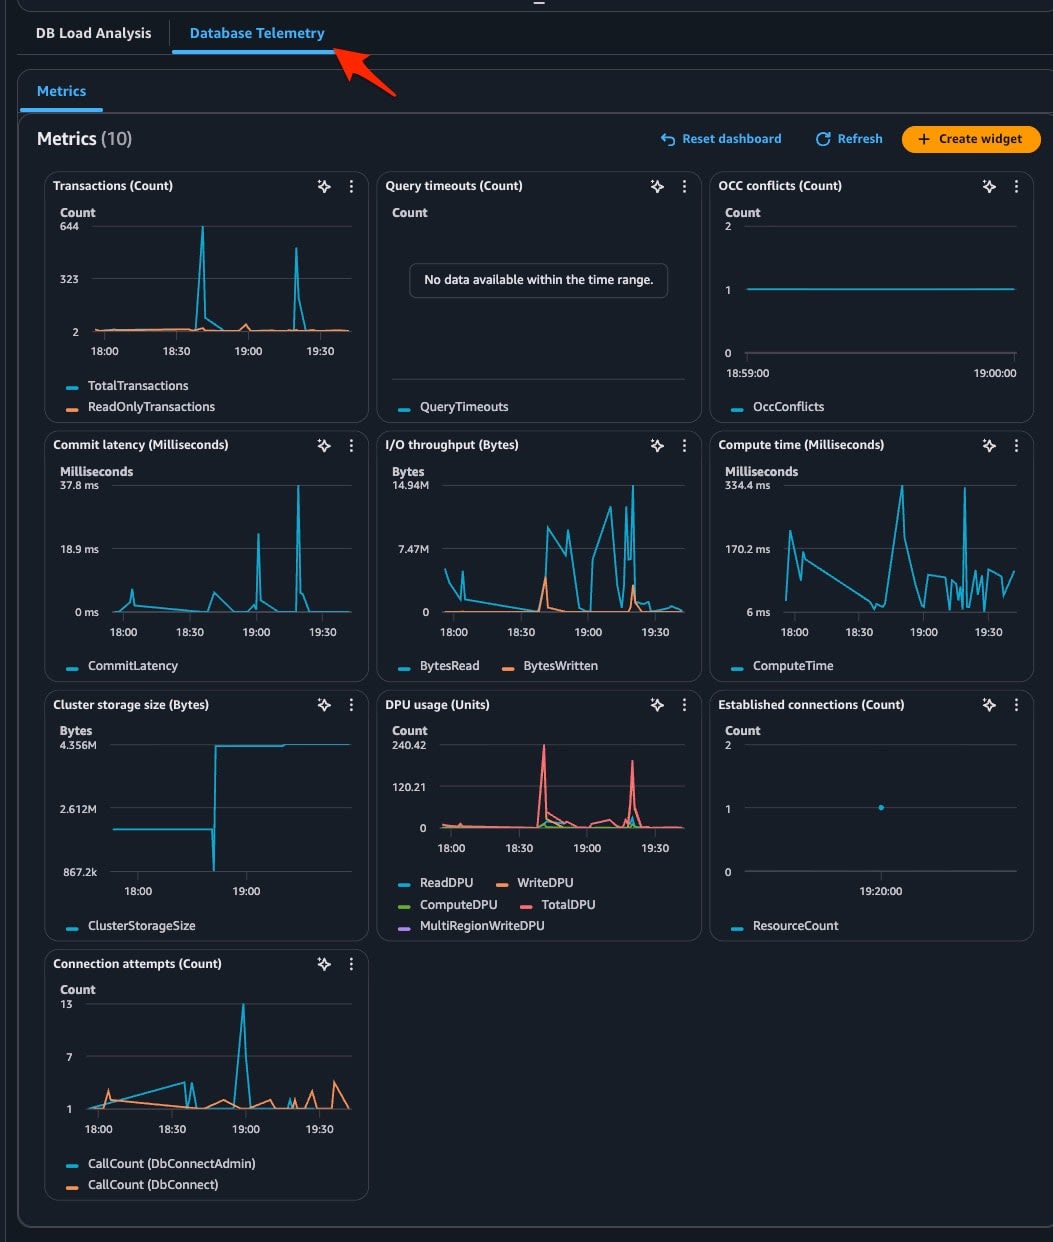
| Widget | Metrics | Unit |
|---|---|---|
| Transactions | TotalTransactions, ReadOnlyTransactions | Count |
| Query timeouts | QueryTimeouts | Count |
| OCC conflicts | OccConflicts | Count |
| Commit latency | CommitLatency | Milliseconds |
| I/O throughput | BytesRead, BytesWritten | Bytes |
| Compute time | ComputeTime | Milliseconds |
| Cluster storage size | ClusterStorageSize | Bytes |
| DPU usage | ReadDPU, WriteDPU, ComputeDPU, TotalDPU, MultiRegionWriteDPU | Units |
| Established connections | ResourceCount | Count |
| Connection attempts | CallCount (per DbConnectAdmin / DbConnect) | Count |
Standard Metrics Retrieval
We verified whether the metrics displayed in the console's Database Telemetry could be retrieved from the CloudWatch metrics API.
aws cloudwatch list-metrics --namespace AWS/AuroraDSQL --region us-east-1
{
    "Metrics": [
        {
            "Namespace": "AWS/AuroraDSQL",
            "MetricName": "OccConflicts",
            "Dimensions": [{"Name": "ClusterId", "Value": "<cluster-id>"}]
        },
        {
            "Namespace": "AWS/AuroraDSQL",
            "MetricName": "ClusterStorageSize",
            "Dimensions": [{"Name": "ClusterId", "Value": "<cluster-id>"}]
        },
        {
            "Namespace": "AWS/AuroraDSQL",
            "MetricName": "ComputeTime",
            "Dimensions": [{"Name": "ClusterId", "Value": "<cluster-id>"}]
        },
        {
            "Namespace": "AWS/AuroraDSQL",
            "MetricName": "TotalTransactions",
            "Dimensions": [{"Name": "ClusterId", "Value": "<cluster-id>"}]
        },
        {
            "Namespace": "AWS/AuroraDSQL",
            "MetricName": "ComputeDPU",
            "Dimensions": [{"Name": "ClusterId", "Value": "<cluster-id>"}]
        },
        {
            "Namespace": "AWS/AuroraDSQL",
            "MetricName": "ReadDPU",
            "Dimensions": [{"Name": "ClusterId", "Value": "<cluster-id>"}]
        },
        {
            "Namespace": "AWS/AuroraDSQL",
            "MetricName": "WriteDPU",
            "Dimensions": [{"Name": "ClusterId", "Value": "<cluster-id>"}]
        },
        {
            "Namespace": "AWS/AuroraDSQL",
            "MetricName": "ReadOnlyTransactions",
            "Dimensions": [{"Name": "ClusterId", "Value": "<cluster-id>"}]
        },
        {
            "Namespace": "AWS/AuroraDSQL",
            "MetricName": "BytesWritten",
            "Dimensions": [{"Name": "ClusterId", "Value": "<cluster-id>"}]
        },
        {
            "Namespace": "AWS/AuroraDSQL",
            "MetricName": "BytesRead",
            "Dimensions": [{"Name": "ClusterId", "Value": "<cluster-id>"}]
        },
        {
            "Namespace": "AWS/AuroraDSQL",
            "MetricName": "TotalDPU",
            "Dimensions": [{"Name": "ClusterId", "Value": "<cluster-id>"}]
        },
        {
            "Namespace": "AWS/AuroraDSQL",
            "MetricName": "CommitLatency",
            "Dimensions": [{"Name": "ClusterId", "Value": "<cluster-id>"}]
        }
    ]
}
12 metrics were returned, and the only dimension was ClusterId. QueryTimeouts, MultiRegionWriteDPU, ResourceCount, and CallCount, which were displayed in the console's Database Telemetry, do not appear in this list. Metrics without data points in the past two weeks are not included in the list by design. Since QueryTimeouts has never occurred, it not appearing in the list is expected behavior.
We retrieved DPU consumption at 5-minute intervals for the time period when the daily data loading process was running.
aws cloudwatch get-metric-statistics \
  --namespace AWS/AuroraDSQL \
  --metric-name TotalDPU \
  --dimensions Name=ClusterId,Value=<cluster-id> \
  --start-time 2026-08-23T07:00:00Z \
  --end-time 2026-08-23T11:00:00Z \
  --period 300 \
  --statistics Sum Maximum \
  --region us-east-1
The following is an excerpt of data points from time periods where values were confirmed in the output.
{
    "Label": "TotalDPU",
    "Datapoints": [
        {
            "Timestamp": "2026-08-23T18:40:00+09:00",
            "Sum": 286.66901874707025,
            "Maximum": 40.81532766992188,
            "Unit": "None"
        },
        {
            "Timestamp": "2026-08-23T19:20:00+09:00",
            "Sum": 257.6313710976563,
            "Maximum": 18.65125854589844,
            "Unit": "None"
        },
        {
            "Timestamp": "2026-08-23T19:15:00+09:00",
            "Sum": 113.22324524414063,
            "Maximum": 71.276387875,
            "Unit": "None"
        }
    ]
}
Standard metrics, as opposed to DASH, can be retrieved via the AWS CLI. Transaction counts were also retrieved for the same time period.
aws cloudwatch get-metric-statistics \
  --namespace AWS/AuroraDSQL \
  --metric-name TotalTransactions \
  --dimensions Name=ClusterId,Value=<cluster-id> \
  --start-time 2026-08-23T07:00:00Z \
  --end-time 2026-08-23T11:00:00Z \
  --period 300 \
  --statistics Sum Average \
  --region us-east-1
{
    "Label": "TotalTransactions",
    "Datapoints": [
        {
            "Timestamp": "2026-08-23T18:40:00+09:00",
            "Average": 1.0,
            "Sum": 727.0,
            "Unit": "None"
        },
        {
            "Timestamp": "2026-08-23T19:20:00+09:00",
            "Average": 1.0,
            "Sum": 717.0,
            "Unit": "None"
        }
    ]
}
In both time periods where DPU was elevated, over 700 transactions were processed within 5 minutes. Commit latency was also retrieved.
CommitLatency retrieval command and output
aws cloudwatch get-metric-statistics \
  --namespace AWS/AuroraDSQL \
  --metric-name CommitLatency \
  --dimensions Name=ClusterId,Value=<cluster-id> \
  --start-time 2026-08-23T07:00:00Z \
  --end-time 2026-08-23T11:00:00Z \
  --period 300 \
  --statistics Average Maximum \
  --region us-east-1
{
    "Label": "CommitLatency",
    "Datapoints": [
        {
            "Timestamp": "2026-08-23T19:15:00+09:00",
            "Average": 8.602227272727273,
            "Maximum": 189.249,
            "Unit": "Milliseconds"
        },
        {
            "Timestamp": "2026-08-23T17:20:00+09:00",
            "Average": 8.161930232558138,
            "Maximum": 104.103,
            "Unit": "Milliseconds"
        }
    ]
}
The unit is Milliseconds, with a maximum value of 189.2ms at 19:15 JST and 104.1ms at 17:20 JST.
Retrieval via PromQL API
The DASH core data, which corresponds to DB Load and the breakdown of wait events, uses a different path than standard metrics. db.active_sessions.avg is accessible only via PromQL, and there is no corresponding CLI subcommand for the QueryMetrics API. In AWS CLI 2.36.29, it was not accepted as a subcommand.
aws: [ERROR]: An error occurred (ParamValidation): argument operation: Found invalid choice 'query-metrics'
QueryMetrics is provided as a Prometheus-compatible REST endpoint (https://monitoring.<region>.amazonaws.com/api/v1/query and /api/v1/query_range). You need to send HTTP requests directly, signed with Signature Version 4. The official documentation's PromQL querying page also explicitly states that requests should be signed with Signature Version 4 using monitoring as the service name.
Therefore, we installed version 0.33 of the third-party OSS tool awscurl, which handles SigV4 signing and sends HTTP requests, via pip install awscurl, and retrieved AAS broken down by wait event.
awscurl --service monitoring --region us-east-1 \
    -X POST 'https://monitoring.us-east-1.amazonaws.com/api/v1/query_range' \
    -H 'Content-Type: application/x-www-form-urlencoded' \
    -d 'query=avg by ("db.wait.event") ({"db.active_sessions.avg", "@resource.aws.auroradsql.cluster_id"="<cluster-id>"})&start=2026-08-23T09:00:00Z&end=2026-08-23T11:00:00Z&step=1m'
{
  "status": "success",
  "data": {
    "resultType": "matrix",
    "result": [
      {
        "metric": {"db.wait.event": "Commit"},
        "values": [[1787478060.0, "0.06666666666666667"], [1787478120.0, "0.06666666666666667"]]
      },
      {
        "metric": {"db.wait.event": "OnCpu"},
        "values": [[1787478000.0, "0.016666666666666666"], [1787478060.0, "0.016666666666666666"]]
      },
      {
        "metric": {"db.wait.event": "SequentialScanRead"},
        "values": [[1787478000.0, "0.016666666666666666"], [1787478060.0, "0.016666666666666666"]]
      }
    ]
  }
}
The PromQL query was included in the request body and sent via POST. Six wait events were retrieved: ClientRead, Commit, OnCpu, ScatteredBatchRead, SequentialScanRead, and UniqueConstraintCheck.
The response structure differs from the MetricDataResults array returned by the standard CloudWatch GetMetricData, and instead has a structure with status and data. This is the same format as the Prometheus query API.
Next, we retrieved the breakdown by SQL statement. The results were grouped using normalized SQL statements as labels and filtered to the top 5 by AAS.
awscurl --service monitoring --region us-east-1 \
    -X POST 'https://monitoring.us-east-1.amazonaws.com/api/v1/query_range' \
    -H 'Content-Type: application/x-www-form-urlencoded' \
    -d 'query=topk(5, avg by ("db.query.normalized_text") ({"db.active_sessions.avg", "@resource.aws.auroradsql.cluster_id"="<cluster-id>"}))&start=2026-08-23T09:00:00Z&end=2026-08-23T11:00:00Z&step=1m'
{
  "status": "success",
  "data": {
    "resultType": "matrix",
    "result": [
      {
        "metric": {"db.query.normalized_text": "BEGIN"},
        "values": [[1787478060.0, "0.03333333333333333"], [1787480340.0, "0.05"]]
      },
      {
        "metric": {"db.query.normalized_text": "COMMIT"},
        "values": [[1787478060.0, "0.06666666666666667"], [1787480340.0, "0.06666666666666667"]]
      },
      {
        "metric": {"db.query.normalized_text": "DELETE FROM public.sample_activity"},
        "values": [[1787480340.0, "0.016666666666666666"]]
      }
    ]
  }
}
AAS was returned for each normalized SQL statement such as BEGIN, COMMIT, DELETE FROM ..., INSERT INTO .... The same type of information as in the console's Top SQL tab could also be retrieved via the API.
IAM permissions required to call the PromQL API
To execute PromQL queries, you need both cloudwatch:GetMetricData and cloudwatch:ListMetrics permissions.
Enabling and Cost
In the verification up to this point, no changes were made to the cluster settings. The official documentation also explicitly states that no setup is required.
You don't need to set up DASH. It is automatically enabled for every Aurora DSQL cluster, and per-minute aggregated data is available through Amazon CloudWatch Database Insights and through Prometheus Query Language (PromQL) queries run against CloudWatch OTel metrics at no additional cost.
Regarding pricing, details are available on the CloudWatch pricing page.
Upto 15 months of per-minute standard database metrics are included at no additional cost.
Querying OpenTelemetry metrics via the PromQL API is charged at $0.01 per million samples scanned. A sample is one data point for one metric series at one timestamp. Queries executed through the CloudWatch console, including dashboards, are free of charge.
15 months of standard metrics are retained at no additional charge. Regarding query execution, queries via the console are free, but queries via the PromQL API are charged based on the number of samples scanned.
Summary
Database Insights, now supported by DSQL, is effective for understanding the operational state of the database, similar to Database Insights (formerly: Performance Insights) for Aurora (RDS).
DASH is enabled without any additional configuration. Since there is no additional cost for checking load from the console, if you are using Aurora DSQL, please try opening Database Insights.
What we verified this time was the normal load during daily data loading operations. No high-load testing such as load testing was performed. If we have the opportunity to conduct load testing on a workload using DSQL, we would like to introduce the results in a separate article.