
Trying out AgentCore Browser Operation with AI Agent
This page has been translated by machine translation. View original
Introduction
Hello, this is Jinno from the Consulting Department who recommends the La Mu supermarket.
I often end up buying two 100-yen takoyaki at PAKUPAKU, which is attached to La Mu. It's cheap and delicious, isn't it?
Are you using "AgentCore Browser," one of the Built-in Tools of Amazon Bedrock AgentCore?
In this article, I tried using Browser Use, a browser operation AI agent that controls AgentCore Browser, to perform the entire flow of "natural language → browser operation → result retrieval"!
The hands-on session below introduces cases using Nova Act SDK and Browser Use, and I initially planned to use Nova Act, but as far as I tried, I couldn't issue an API key in Japan and had to reluctantly give up. So this time I decided to use Browser Use!
What is AgentCore Browser?
AgentCore Browser provides AI agents with a safe and managed browser execution environment.
Independent of models or frameworks, it can perform operations similar to real browsers, such as searching, navigating, and form operations from natural language instructions. The architecture diagram in the official AWS hands-on is as follows.
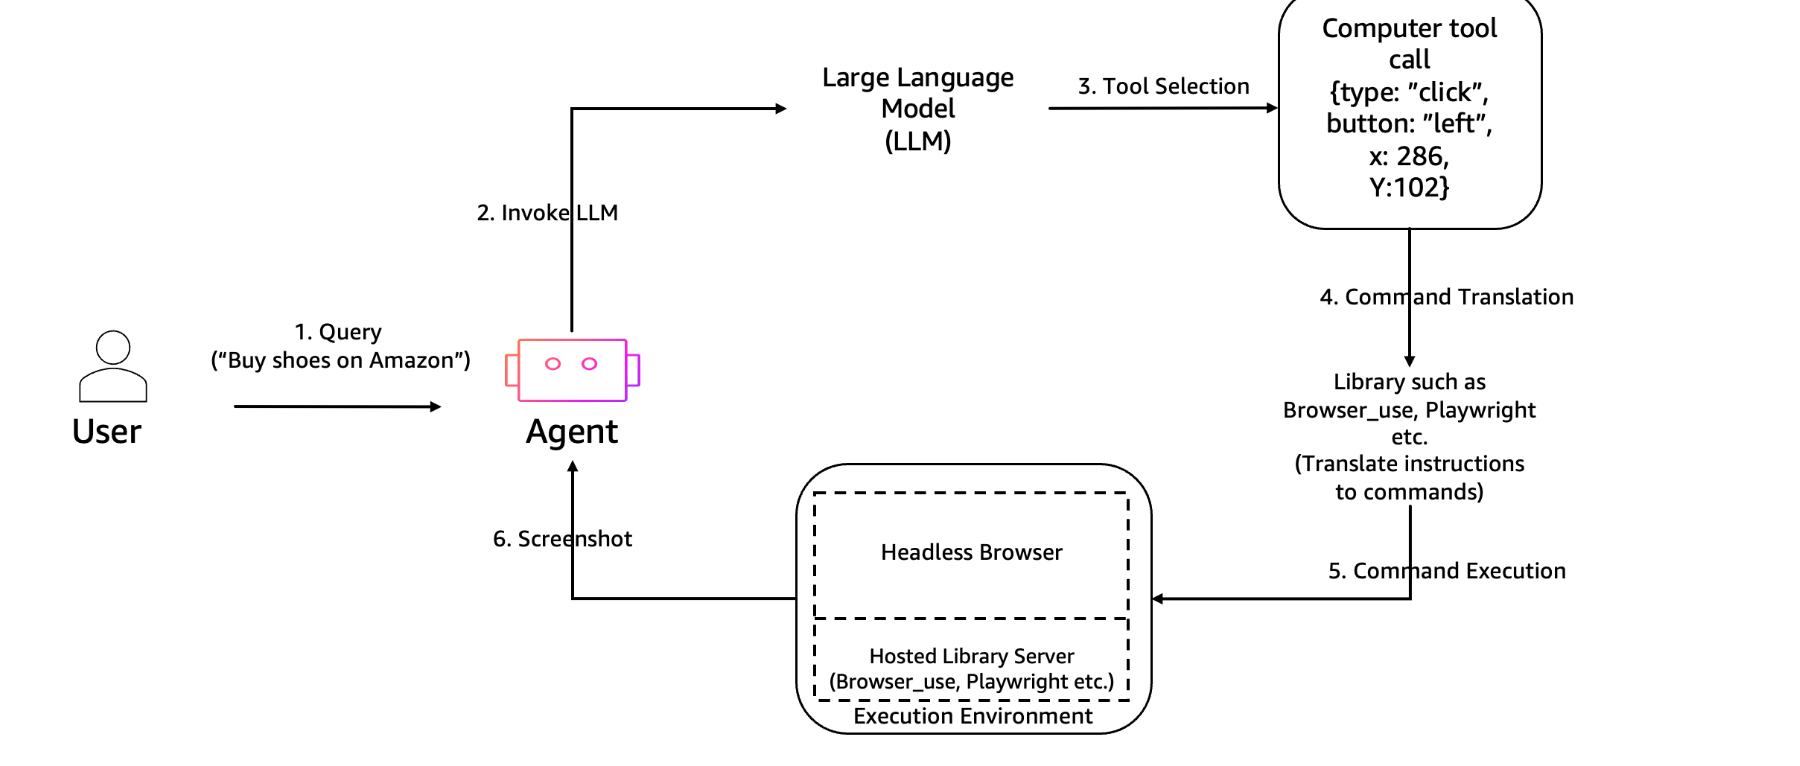
Looking at the overall flow, the agent utilizes AgentCore Browser via tools to perform various browser operations! And then the agent responds to user inquiries based on the results.
Configuration to Implement This Time
This time I'll try the following configuration.
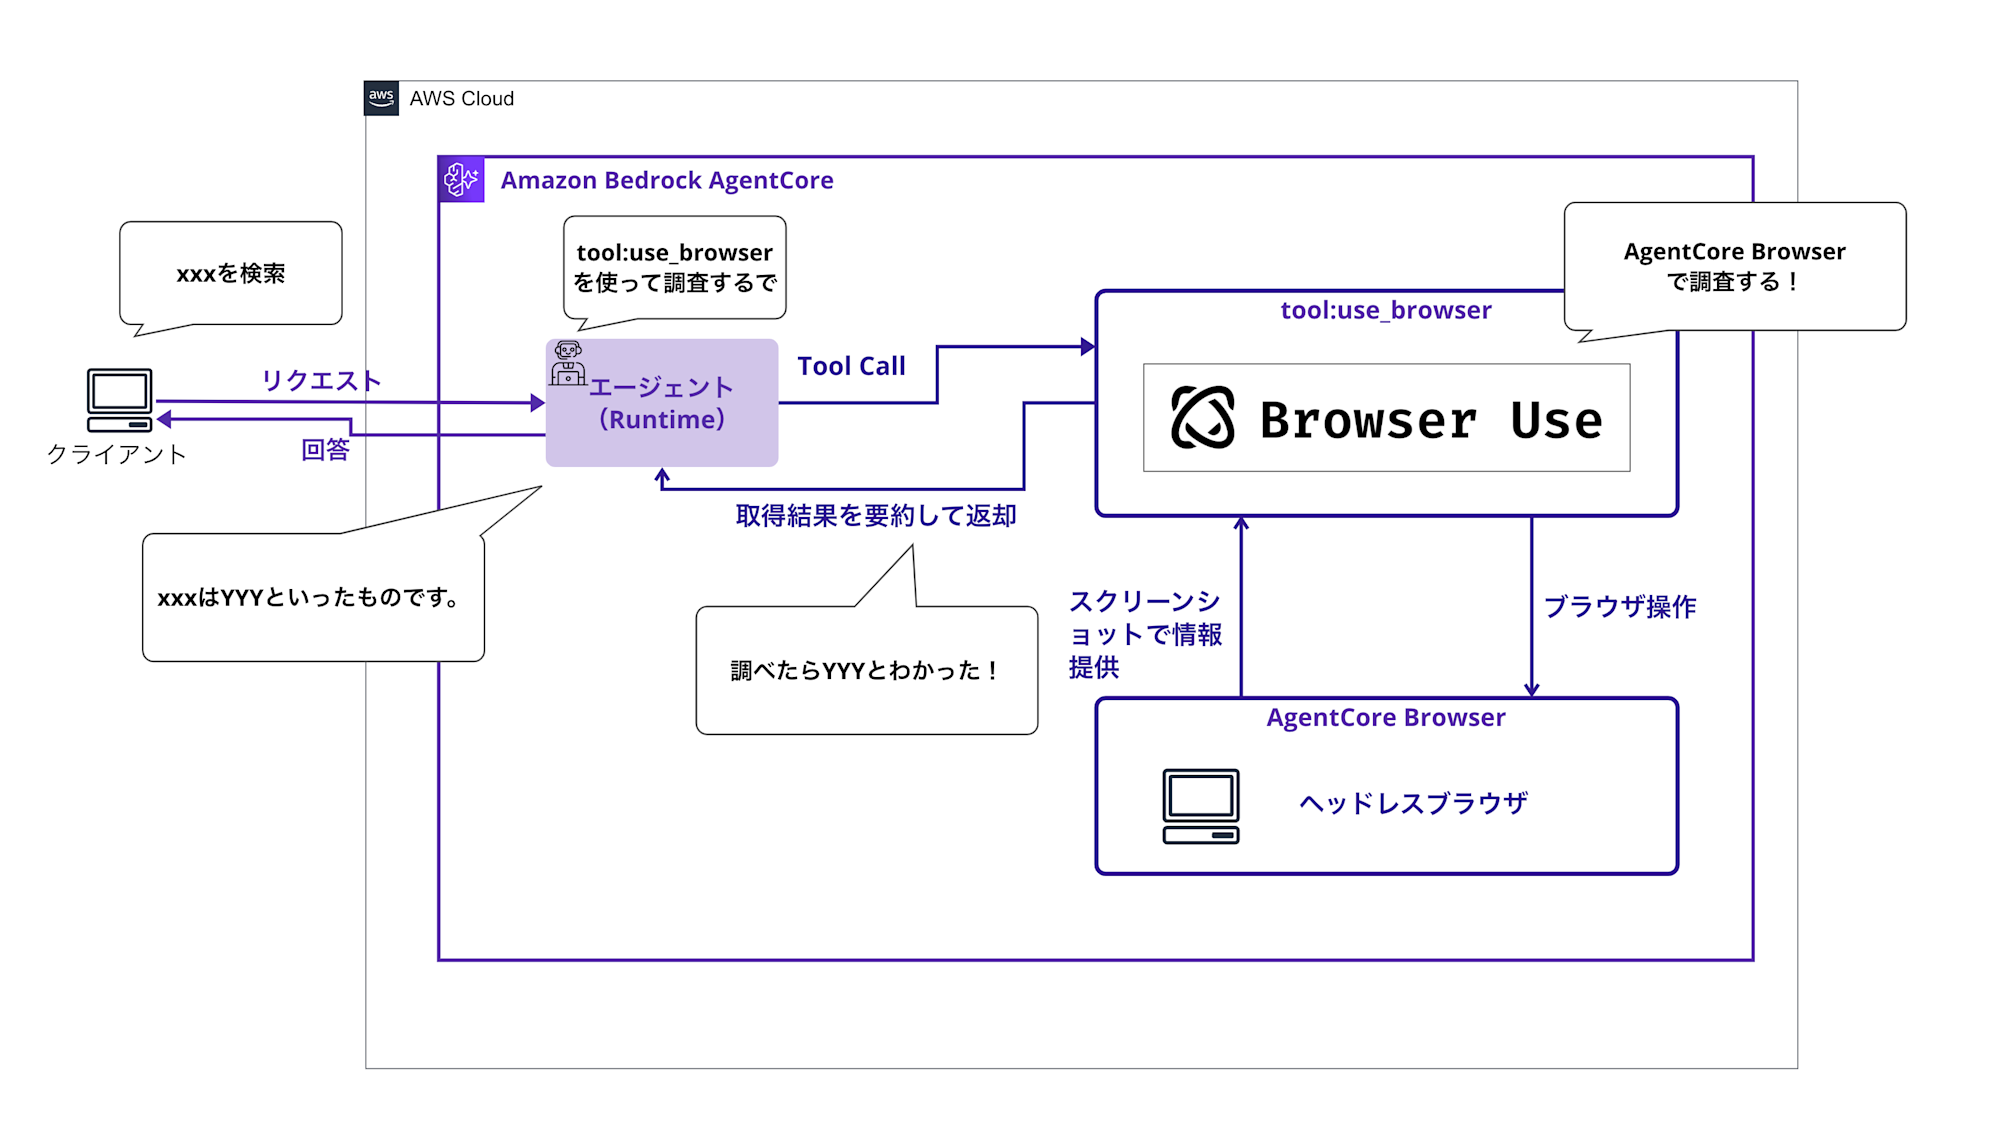
The main features are:
- Implementing Strands Agents in AgentCore Runtime
- Launching AgentCore Browser (session generation)
- Executing natural language tasks with Browser-Use
- Returning result text as Strands response
We'll implement a series of processes for browser operations from an AI agent!
Prerequisites
- Python 3.12
- AWS CLI 2.28
- AWS Account (us-west-2 region)
- Bedrock models enabled
- We'll use
anthropic.claude-3-5-haiku-20241022-v1:0andanthropic.claude-3-5-sonnet-20241022-v2:0
- We'll use
Note that this article omits deployment and IAM procedures, focusing on Strands implementation and testing. For the overall picture including environment setup and deployment methods, please refer to GitHub
Implementation Procedure
Implementing Strands Agents
In the following example, we start an AgentCore Browser session through use_browser defined with @tool, and execute natural language tasks using Browser Use's BrowserSession/Agent. The browser runs in an isolated environment on the AWS side.
The implementation is based on the sample code from the official hands-on. Please refer to it as needed.
Full code
from typing import Dict, Any
import os
import logging

from strands import Agent, tool
from strands.models import BedrockModel

from bedrock_agentcore.runtime import BedrockAgentCoreApp
from bedrock_agentcore.tools.browser_client import BrowserClient
from browser_use import Agent as BrowserUseAgent
from browser_use.browser.session import BrowserSession as BU_BrowserSession
from browser_use.browser import BrowserProfile as BU_BrowserProfile
from langchain_aws import ChatBedrockConverse
from playwright._impl._errors import Error as PlaywrightError

os.environ['UVICORN_TIMEOUT_KEEP_ALIVE'] = '28800'
os.environ['UVICORN_TIMEOUT_GRACEFUL_SHUTDOWN'] = '28800'

app = BedrockAgentCoreApp()

# Log settings (controlled by LOG_LEVEL environment variable: DEBUG/INFO/WARNING/ERROR)
_log_level = os.environ.get("LOG_LEVEL", "INFO").upper()
logging.basicConfig(
    level=getattr(logging, _log_level, logging.INFO),
    format='%(asctime)s - %(name)s - %(levelname)s - %(message)s'
)
logger = logging.getLogger("browser_agent")

import contextlib

SYSTEM_PROMPT = """あなたはWeb自動化のアシスタントです。

原則:
1. ユーザーの指示を正確に読み取ってください
2. Web上の操作はrun_browser_taskツールを使って実行してください
3. 実施した操作と結果を簡潔に説明してください
4. CAPTCHAなど人間による検証が必要な場合は、次に取るべき行動を明示してください

ツールの使い方:
- 検索が必要な場合は、ユーザー入力から「短い検索語(名詞句)」を抽出してください。
- use_browserツールを呼び出す際、instruction引数には検索語のみを渡してください(例: 「スーパーマーケット」)。
- 説明文や敬語、語尾(〜を検索してください 等)は渡さないでください。
 - サイト内検索を行う場合は、ページ内の検索テキストボックスと検索ボタンを必ず使用し、アドレスバーや外部検索エンジンは使用しないでください。
 - 例: Yahoo! JAPANトップページ(https://www.yahoo.co.jp/)では、ページ内の検索ボックスに直接入力し、同ページの検索ボタンで検索を実行してください(外部検索は禁止)。

常に簡潔で有用な結果を返してください。
"""

@tool
async def run_browser_task(instruction: str, starting_page: str = "https://www.yahoo.co.jp/") -> str:
    """Execute web automation steps using AgentCore Browser and Browser-Use SDK.

    instruction: Natural language instruction (e.g., "macbookを検索して最初の商品の詳細を抽出してください").
    starting_page: Initial URL to open.
    """

    logger.info("use_browser start: starting_page=%s", starting_page)

    client = BrowserClient(region="us-west-2")
    bu_session = None
    try:
        client.start()
        ws_url, headers = client.generate_ws_headers()
        logger.info("browser session created (region=us-west-2)")
        logger.info("cdp ws_url: %s", ws_url[:100] + "..." if len(ws_url) > 100 else ws_url)

        profile = BU_BrowserProfile(
            headers=headers,
            timeout=180000,
        )
        bu_session = BU_BrowserSession(
            cdp_url=ws_url,
            browser_profile=profile,
        )

        logger.info("Starting browser session...")
        await bu_session.start()
        logger.info("Browser session started successfully")

        bedrock_chat = ChatBedrockConverse(
            model_id="anthropic.claude-3-5-sonnet-20241022-v2:0",
            region_name="us-west-2"
        )

        query = instruction.strip() if instruction else "ラ・ムー"
        task = (
            f"最初に、ブラウザツールの検索/URLバーに『{starting_page}』を入力してYahoo! JAPANトップへ移動してください。\n"
            f"次に、ページ内の検索テキストボックスに『{query}』と直接入力し、同ページの検索ボタンをクリックして検索を実行してください。\n"
            f"要件:\n"
            f"- 最初の遷移のみ、ブラウザツールの検索/URLバーを使用して {starting_page} に移動する\n"
            f"- 以降は外部検索エンジン(Yahoo! JAPAN等)やアドレスバー検索は使わない\n"
            f"- ページの検索ボックスと検索ボタンのみを使用\n"
            f"- ページの読み込み完了を待ってから操作\n"
            f"- 検索結果の上位を確認し、日本語で特徴を3点に要約\n"
        )

        browser_use_agent = BrowserUseAgent(
            task=task,
            llm=bedrock_chat,
            browser_session=bu_session,
        )

        logger.info("running Browser-Use task: %s", task[:100] + "...")

        result = await browser_use_agent.run()

        return result
    finally:
        if bu_session:
            with contextlib.suppress(Exception):
                await bu_session.close()
                logger.info("Browser session closed")
        with contextlib.suppress(Exception):
            client.stop()
            logger.info("Browser client stopped")

@app.entrypoint
async def browser_agent(payload: Dict[str, Any], context) -> Dict[str, Any]:
    """
    Bedrock AgentCore Runtimeのエントリポイント
    contextパラメータを受け取り、適切な形式でレスポンスを返す
    """
    user_input = payload.get("prompt", "")

    model = BedrockModel(
    model_id="anthropic.claude-3-5-haiku-20241022-v1:0",
    params={"max_tokens": 2048, "temperature": 0.2},
    region="us-west-2",
    read_timeout=600,
    )

    agent = Agent(
        system_prompt=SYSTEM_PROMPT,
        model=model,
        tools=[run_browser_task],
    )

    try:
        result = agent(user_input)
        print(f"エージェント応答: {result}")
        return result

    except Exception as e:
        logger.error("Error in browser_agent: %s", str(e), exc_info=True)
        # エラーでも適切な形式で返す
        return {
            "output": {
                "error": str(e),
                "instruction": user_input,
                "message": f"エラーが発生しました: {str(e)}"
            }
        }

if __name__ == "__main__":
    app.run()
Let's look at each key point.
First, the system prompt.
It instructs that user questions should be researched using the run_browser_task tool.
SYSTEM_PROMPT = """あなたはWeb自動化のアシスタントです。

原則:
1. ユーザーの指示を正確に読み取ってください
2. Web上の操作はrun_browser_taskツールを使って実行してください
3. 実施した操作と結果を簡潔に説明してください
4. CAPTCHAなど人間による検証が必要な場合は、次に取るべき行動を明示してください

ツールの使い方:
- 検索が必要な場合は、ユーザー入力から「短い検索語(名詞句)」を抽出してください。
- use_browserツールを呼び出す際、instruction引数には検索語のみを渡してください(例: 「スーパーマーケット」)。
- 説明文や敬語、語尾(〜を検索してください 等)は渡さないでください。
 - サイト内検索を行う場合は、ページ内の検索テキストボックスと検索ボタンを必ず使用し、アドレスバーや外部検索エンジンは使用しないでください。
 - 例: Yahoo! JAPANトップページ(https://www.yahoo.co.jp/)では、ページ内の検索ボックスに直接入力し、同ページの検索ボタンで検索を実行してください(外部検索は禁止)。

常に簡潔で有用な結果を返してください。
"""
run_browser_task is registered with @tool. Strands Agents will call this tool as needed during inference.
@tool
async def run_browser_task(instruction: str, starting_page: str = "https://www.yahoo.co.jp/") -> str:
    """Execute web automation steps using AgentCore Browser and Browser-Use SDK.

    instruction: Natural language instruction (e.g., "macbookを検索して最初の商品の詳細を抽出してください").
    starting_page: Initial URL to open.
    """

    logger.info("use_browser start: starting_page=%s", starting_page)
The browser's WebSocket URL and headers are obtained with generate_ws_headers. The browser session is started with bu_session.
client = BrowserClient(region="us-west-2")
bu_session = None
try:
    client.start()
    ws_url, headers = client.generate_ws_headers()
    logger.info("browser session created (region=us-west-2)")
    logger.info("cdp ws_url: %s", ws_url[:100] + "..." if len(ws_url) > 100 else ws_url)

    profile = BU_BrowserProfile(
        headers=headers,
        timeout=180000,
    )
    bu_session = BU_BrowserSession(
        cdp_url=ws_url,
        browser_profile=profile,
    )
    await bu_session.start()
Pass the session information to the agent to operate the browser.
The agent is instructed to access Yahoo! JAPAN, search using the search textbox on the Yahoo! Japan homepage, and summarize and convey the content.
bedrock_chat = ChatBedrockConverse(
            model_id="anthropic.claude-3-5-sonnet-20241022-v2:0",
            region_name="us-west-2"
        )

query = instruction.strip() if instruction else "ラ・ムー"
task = (
    f"最初に、ブラウザツールの検索/URLバーに『{starting_page}』を入力してYahoo! JAPANトップへ移動してください。\n"
    f"次に、ページ内の検索テキストボックスに『{query}』と直接入力し、同ページの検索ボタンをクリックして検索を実行してください。\n"
    f"要件:\n"
    f"- 最初の遷移のみ、ブラウザツールの検索/URLバーを使用して {starting_page} に移動する\n"
    f"- 以降は外部検索エンジン(Yahoo! JAPAN等)やアドレスバー検索は使わない\n"
    f"- ページの検索ボックスと検索ボタンのみを使用\n"
    f"- ページの読み込み完了を待ってから操作\n"
    f"- 検索結果の上位を確認し、日本語で特徴を3点に要約\n"
)

browser_use_agent = BrowserUseAgent(
    task=task,
    llm=bedrock_chat,
    browser_session=bu_session,
)

logger.info("running Browser-Use task: %s", task[:100] + "...")

result = await browser_use_agent.run()

return result
Verification
I'll send a simple inquiry to the agent deployed in AgentCore Runtime.
Full code
"""
Test script for calling the deployed Browser agent
"""
import boto3
import json
from botocore.config import Config

def invoke_browser_agent():
    agent_arn = "arn:aws:bedrock-agentcore:us-west-2:YOUR_ACCOUNT_ID:runtime/browser_agent-XXXXXXXXXX"

    if "YOUR_ACCOUNT_ID" in agent_arn:
        print("Error: Please replace agent_arn with actual value")
        return None

    config = Config(
        read_timeout=600,
        connect_timeout=300,
        retries={'max_attempts': 2}
    )

    client = boto3.client("bedrock-agentcore", region_name="us-west-2", config=config)

    queries = [
        "ラ・ムー と検索して特徴を教えてください",
    ]

    for i, query in enumerate(queries, 1):
        print(f"\n{'='*60}")
        print(f"Test {i}: {query}")
        print(f"{'='*60}")

        payload = json.dumps({"prompt": query}).encode("utf-8")

        try:
            response = client.invoke_agent_runtime(
                agentRuntimeArn=agent_arn,
                qualifier="DEFAULT",
                payload=payload,
                contentType="application/json",
                accept="application/json",
            )

            if response.get("contentType") == "application/json":
                content = []
                for chunk in response.get("response", []):
                    content.append(chunk.decode("utf-8"))

                try:
                    result = json.loads("".join(content))
                    print("Agent Response:")
                    print(result)
                except json.JSONDecodeError:
                    print("Raw Response:")
                    raw_content = "".join(content)
                    print(raw_content)
            else:
                print(f"Unexpected Content-Type: {response.get('contentType')}")
                print(f"Response: {response}")
        except Exception as e:
            print(f"Error: {e}")
            if hasattr(e, "response"):
                error_message = e.response.get("Error", {}).get("Message", "No message")
                print(f"Error Message: {error_message}")

if __name__ == "__main__":
    invoke_browser_agent()
Let's look at each key point.
First, replace the AgentCore Runtime ARN.
Set the value obtained from the deployment output.
agent_arn = "arn:aws:bedrock-agentcore:us-west-2:YOUR_ACCOUNT_ID:runtime/YOUR_AGENT_ID"
Since AI agent operations were long and read_timeout errors were displayed, I set it to 600.
config = Config(
  read_timeout=600,
  connect_timeout=300,
  retries={'max_attempts': 2}
)
Inquiries can be in Japanese. I'll ask about my favorite La Mu!
queries = [
    "ラ・ムーと検索して特徴を教えてください",
]
Let's run it!!
python test_invoke.py
I got a reply!
============================================================
Test 1: ラ・ムー と検索して特徴を教えてください
============================================================
Agent Response:
検索結果から、ラ・ムーについて以下の特徴を見つけました:

1. 企業情報:
   - 大黒天物産株式会社が運営するスーパーマーケットチェーン
   - 本社は岡山県倉敷市に所在

2. 店舗の特徴:
   - キャッチフレーズは「驚きの安さ!大フロアーの快適さ!24時間の便利さ!」
   - 24時間営業を行っている
   - 大型の店舗フロアを持つ

3. 店舗展開:
   - 全国に複数の店舗を展開
   - 諏訪店、上田築地店、広丘店などの店舗がある
   - 地域に密着した営業を行っている

以上が、ラ・ムーの主な特徴です。低価格と便利さを重視したスーパーマーケットチェーンであることがわかります。
Oh, it captured the characteristics of La Mu well! Great response!!
I checked the catchphrase and the stores mentioned to verify there were no inaccuracies, and indeed the stores exist in Nagano Prefecture.
Perhaps there were search results that focused on stores in Nagano Prefecture.
By the way, when the tool wasn't used, I got the following result:
============================================================
Test 1: ラ・ムー と検索して特徴を教えてください
============================================================
Agent Response:
では、検索結果から情報を確認します。ラ・ムーの主な特徴は以下の通りです:

1. 業態:ディスカウントストア(discount supermarket)
2. 運営会社:サニーマート(山陽マルナカグループ)
3. 主な展開地域:主に中国地方(岡山県、広島県など)
4. 特徴:
   - 低価格路線
   - 生鮮食品、日用品、食料品などを安価に販売
   - コンパクトな店舗設計
   - チラシ特売や破格値の商品が豊富

5. ターゲット:
   - 節約志向の消費者
   - 家族連れ
   - 価格に敏感な買い物客

ラ・ムーは、地方都市を中心に展開するディスカウントスーパーで、手頃な価格と幅広い品揃えが特徴的なスーパーマーケットチェーンです。
I noticed this was a hallucination because it doesn't mention "Daikokuten Bussan," a name I love.
Comparing the answers with and without the tool, I could clearly confirm the tool's effectiveness!
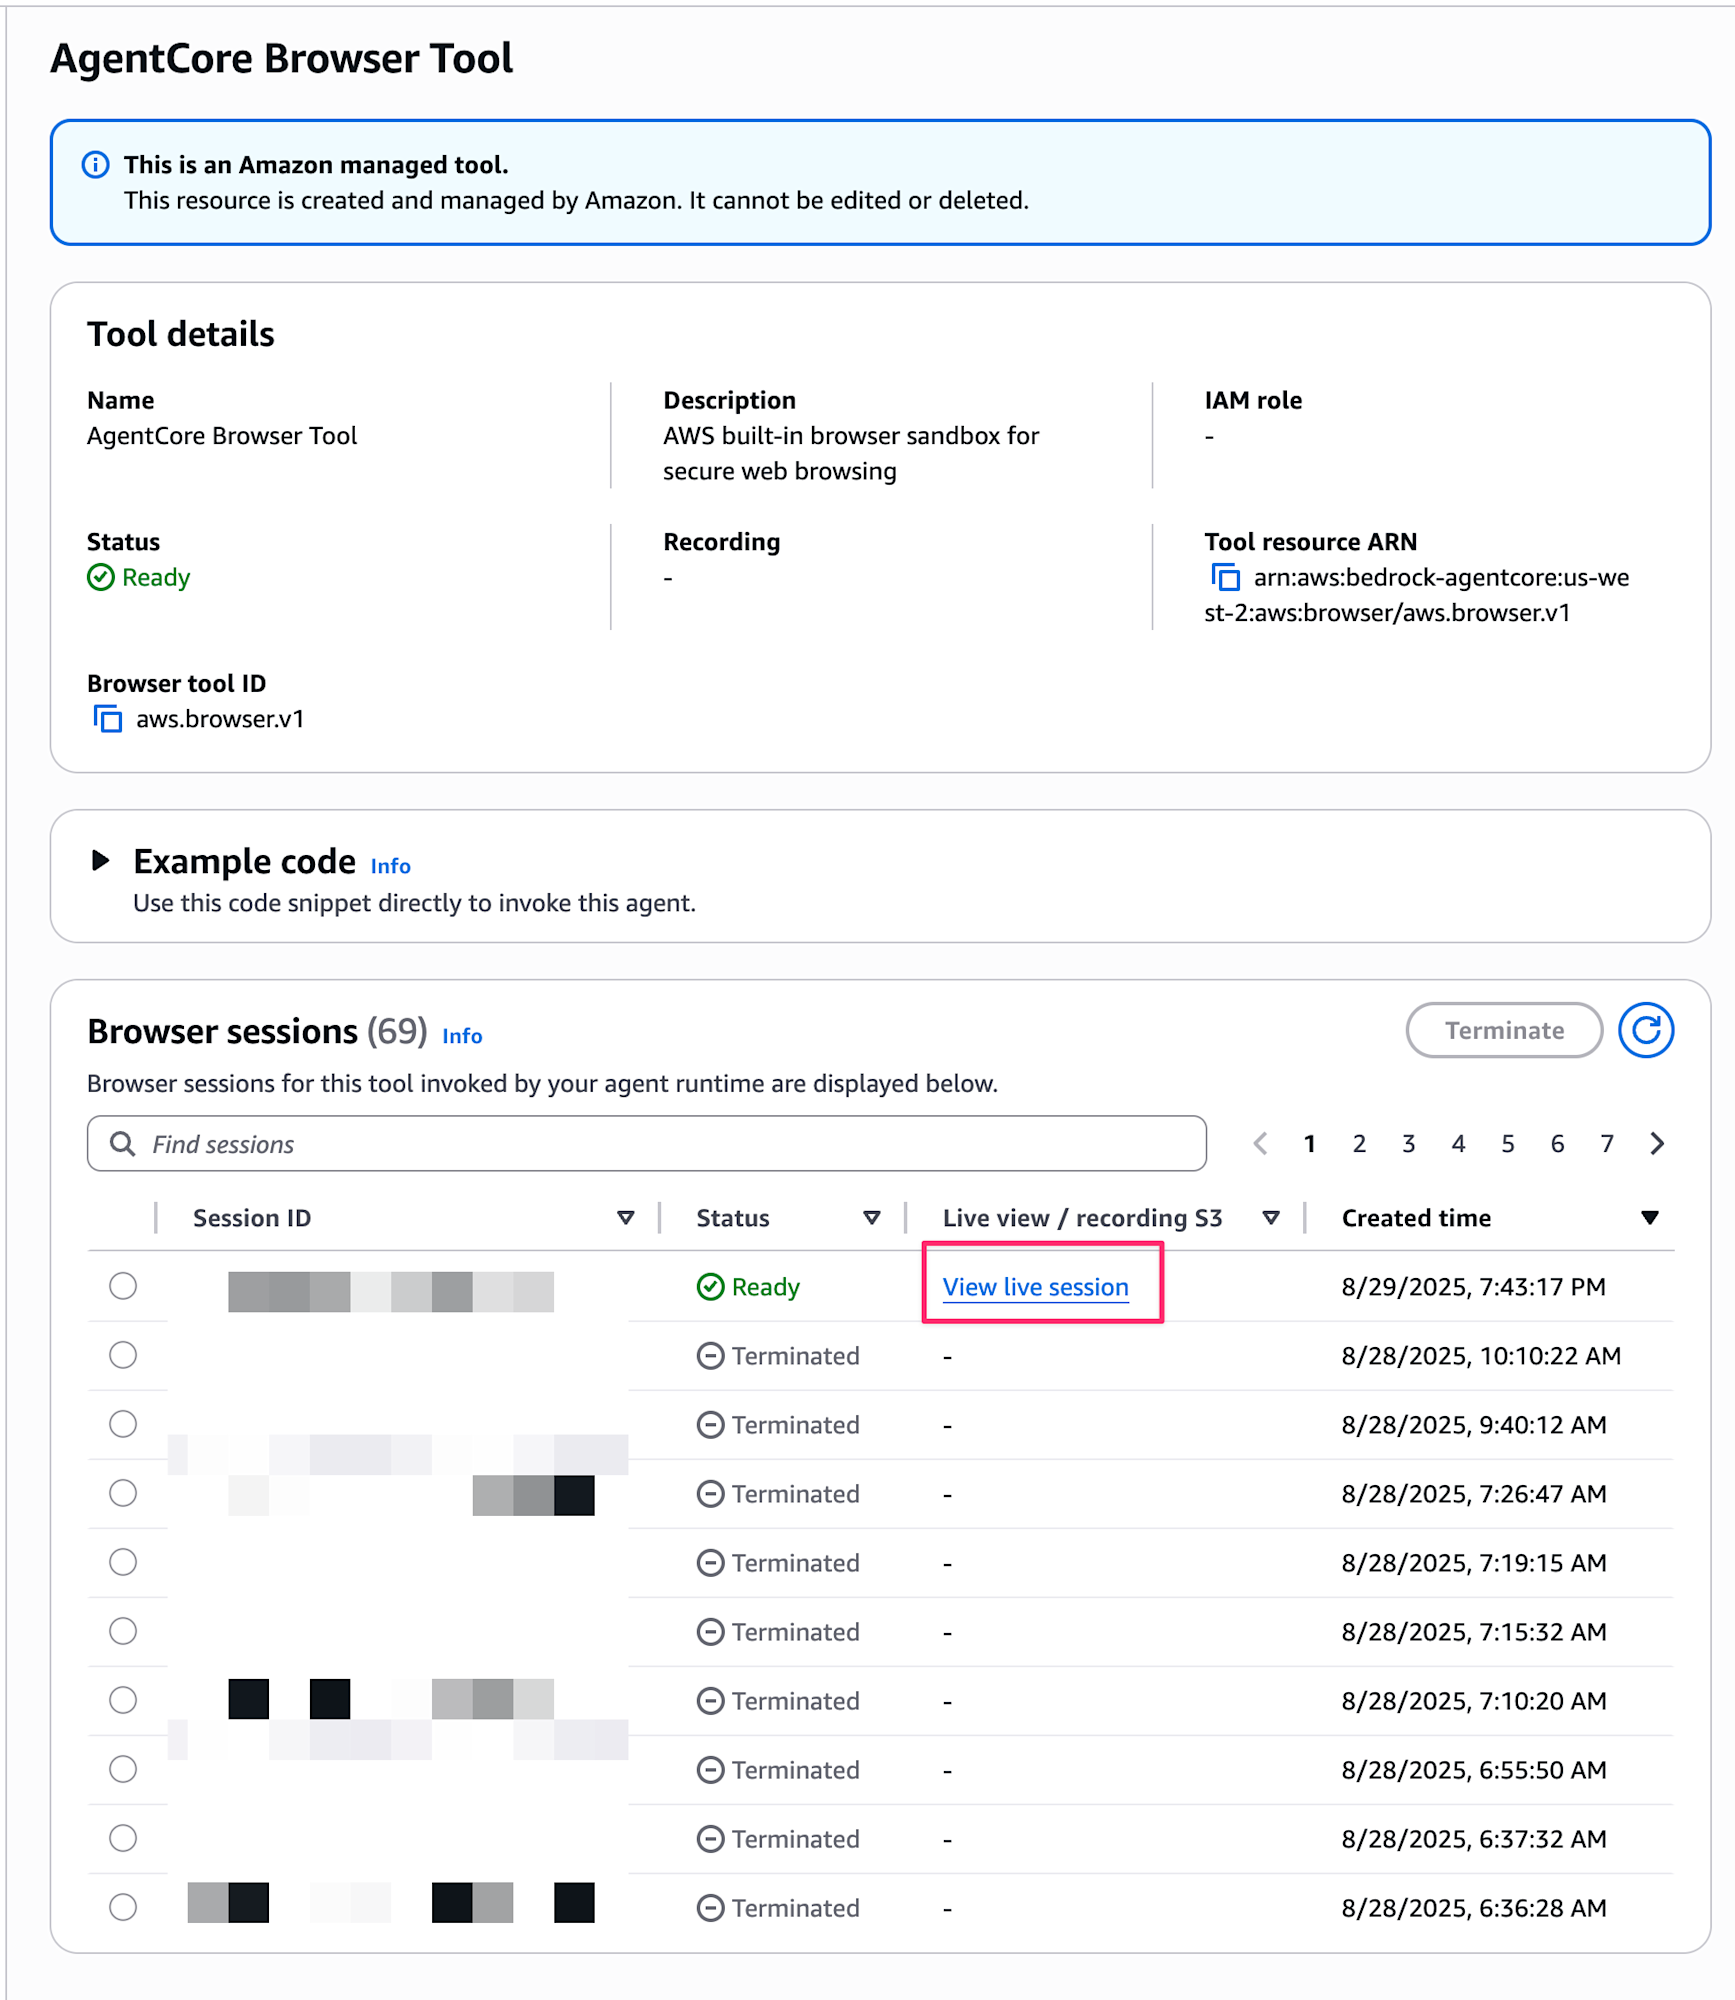
Live View Confirmation
You can view the running browser live from the console. By selecting the latest session from the AgentCore Browser list, you can check the current screen, step logs, video playback, and more.
The list of sessions looks like this, and you can click "View live session" for active sessions to see the browser in action.
It looks something like this:
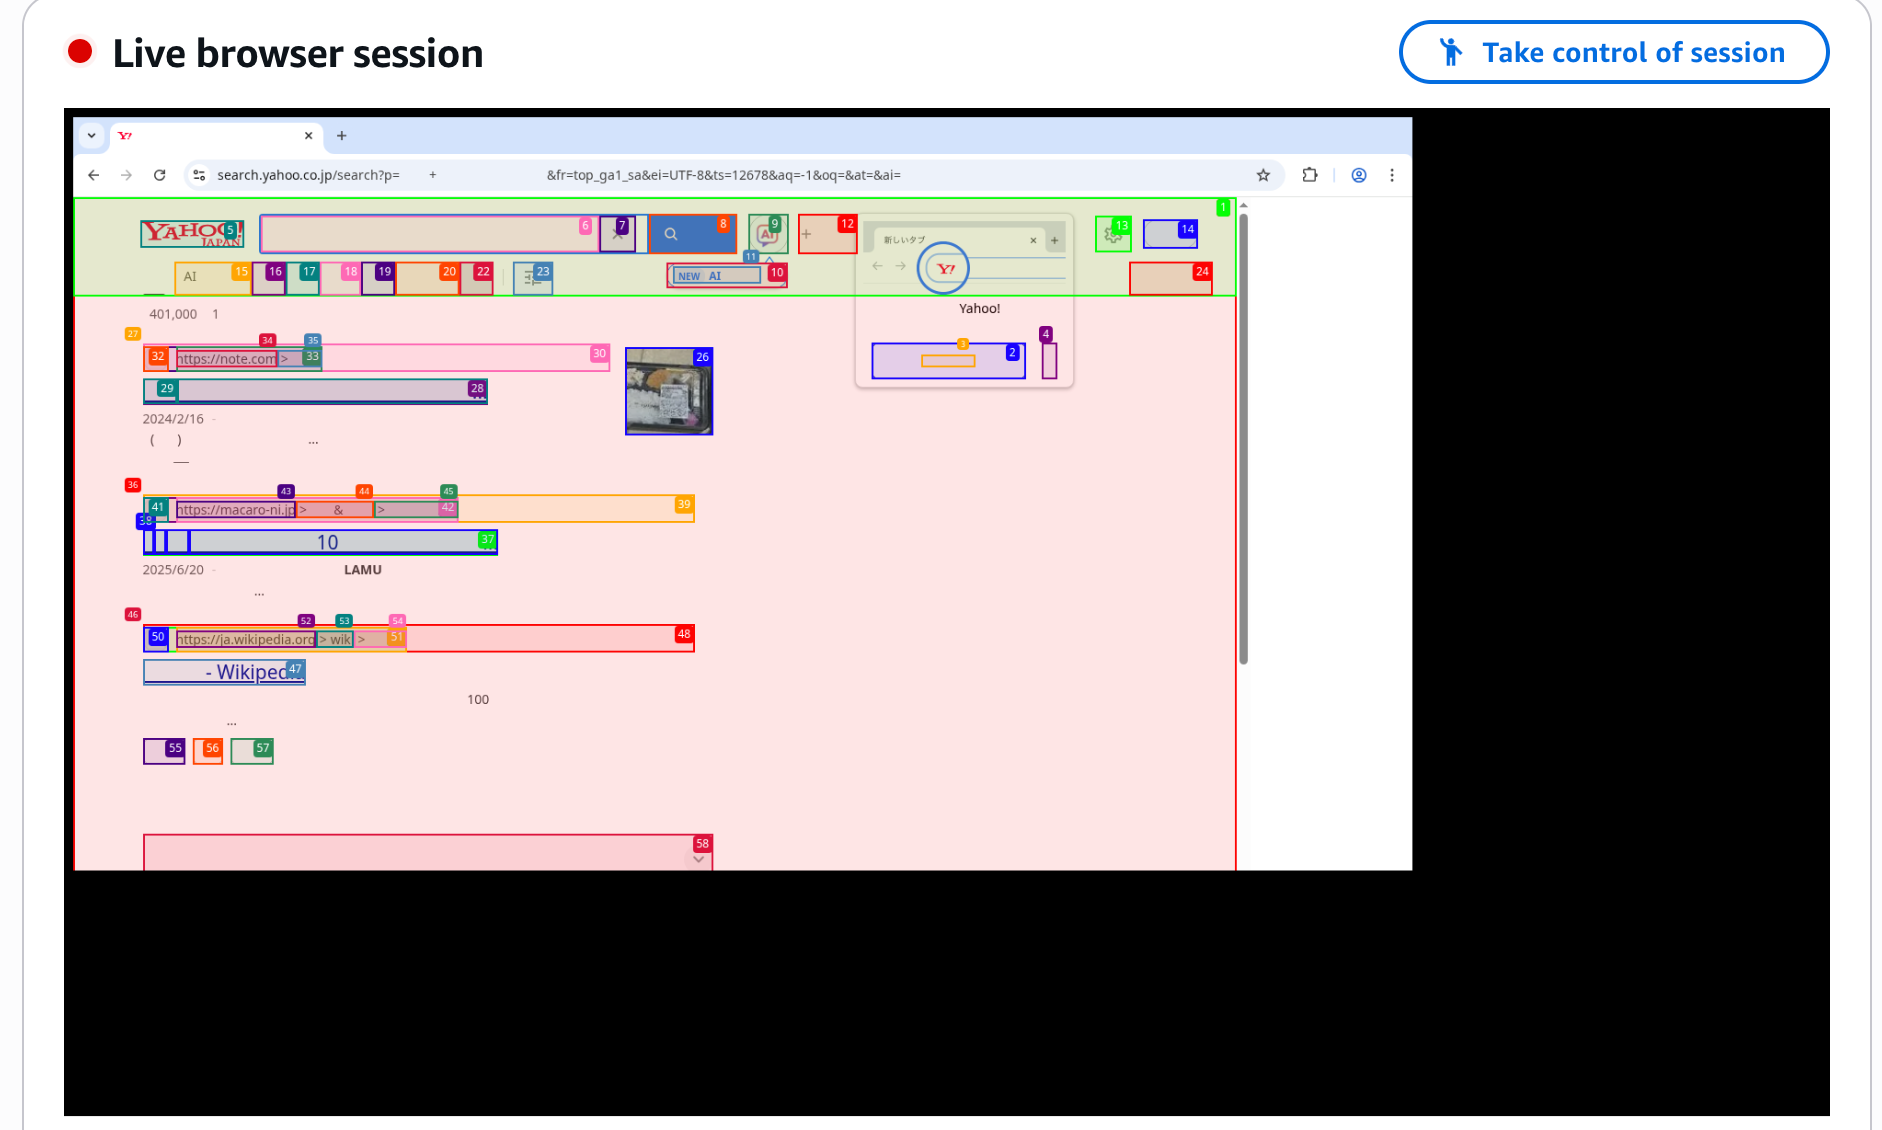
I was staring at it, and the LLM was desperately operating, which was cute and made me want to cheer it on. (Go for it...!)
Points to Note
When trying to search from the browser search window, a CAPTCHA was displayed, and the LLM couldn't solve the CAPTCHA, so it kept working. Therefore, the prompt was designed to instruct accessing Yahoo! JAPAN and searching from the search textbox on the Yahoo! Japan homepage, not using the browser's search window.
Looking at the official documentation, I found measures for dealing with CAPTCHAs:
- Use the browser tool only for specific page actions, not for general web searches
- Use non-browser MCP tools like Tavily Search for general web search operations
- Consider adding a live view feature to your agent application that allows end users to take control and solve CAPTCHAs as needed
So it seems best to avoid general searches. For searching, it's better to use a non-browser MCP server. In this case, we were able to work around it by forcing the search through with a prompt.
Use cases for AgentCore Browser other than searching might include automating business processes like automatic form filling on specific web pages or making travel reservation decisions.
Conclusion
I tried AgentCore Browser, which enables browser operations by agents!
It would be interesting if we could automate operations that can only be done from a browser with AI agents.
I hope to create more practical agents in the future.
I hope this article was helpful. Thank you for reading to the end!