
I tried checking the GenAI Observability dashboard of the Observability feature in Amazon Bedrock AgentCore
This page has been translated by machine translation. View original
Introduction
Hello, this is Kamino from the Consulting Department, and I'm a big fan of La Mu supermarket.
Today I'd like to introduce Amazon Bedrock AgentCore Observability! It's a metrics collection feature.
When I first heard the name, I thought "observability...? sounds difficult...?" so I want to break it down in this article!
AgentCore Observability
AgentCore Observability is a feature that helps trace, debug, and monitor agent performance.
It's a useful feature when you want to observe behavior while developing and operating agents!
Looking at the illustration in the official documentation, it's a feature like the following.
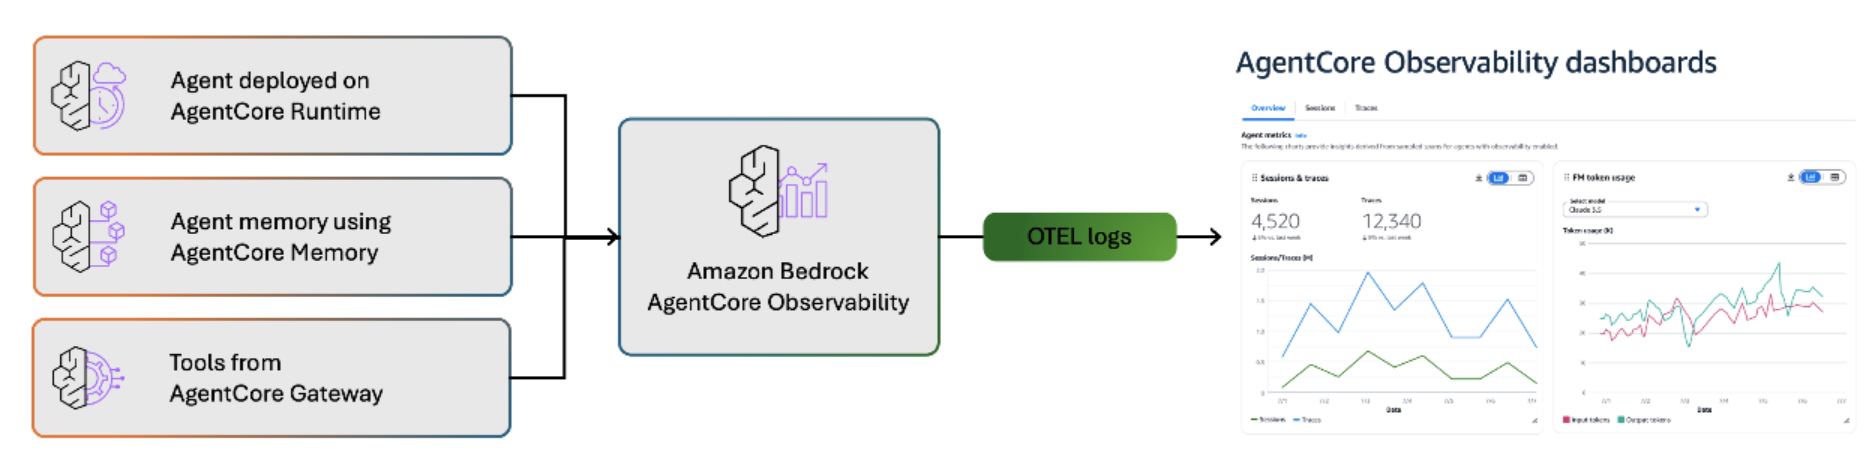
It collects information from AgentCore Runtime, Memory, and Gateway, converts it to OTEL (Open Telemetry) logs, and makes it visible.
The main telemetry is divided into three categories: metrics, structured logs, and spans and traces. Each has its own characteristics, so let's look at them in order!
First, metrics represent basic indicators such as number of calls, latency, duration, token usage, session counts, throttles, user errors, and system errors.
Since they are provided as CloudWatch metrics, they are relatively easy to understand. They're useful for understanding agent performance and usage.
Next, structured logs are JSON-formatted logs that capture event ingestion, long-term memory extraction, integration procedures, and various operations. These logs record detailed operational logs of the agent in JSON format compliant with OpenTelemetry standards. They include detailed information about what decisions the agent made, which tools it used, and what prompts it processed, which is very helpful for debugging.
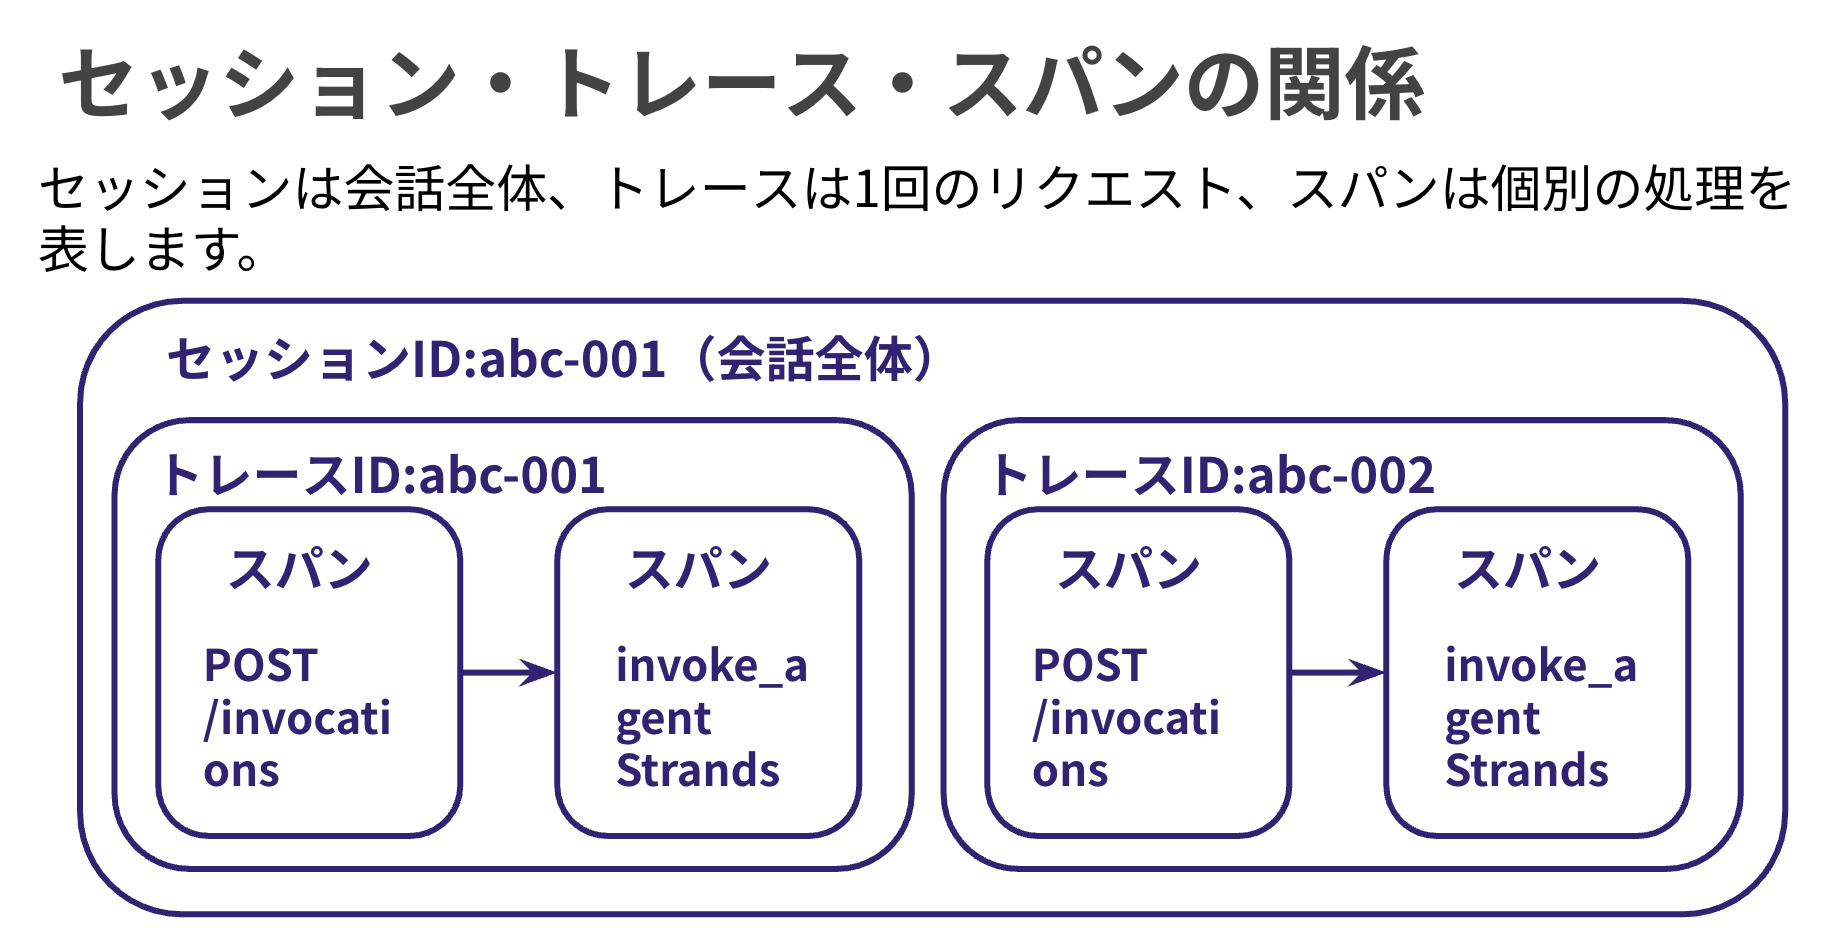
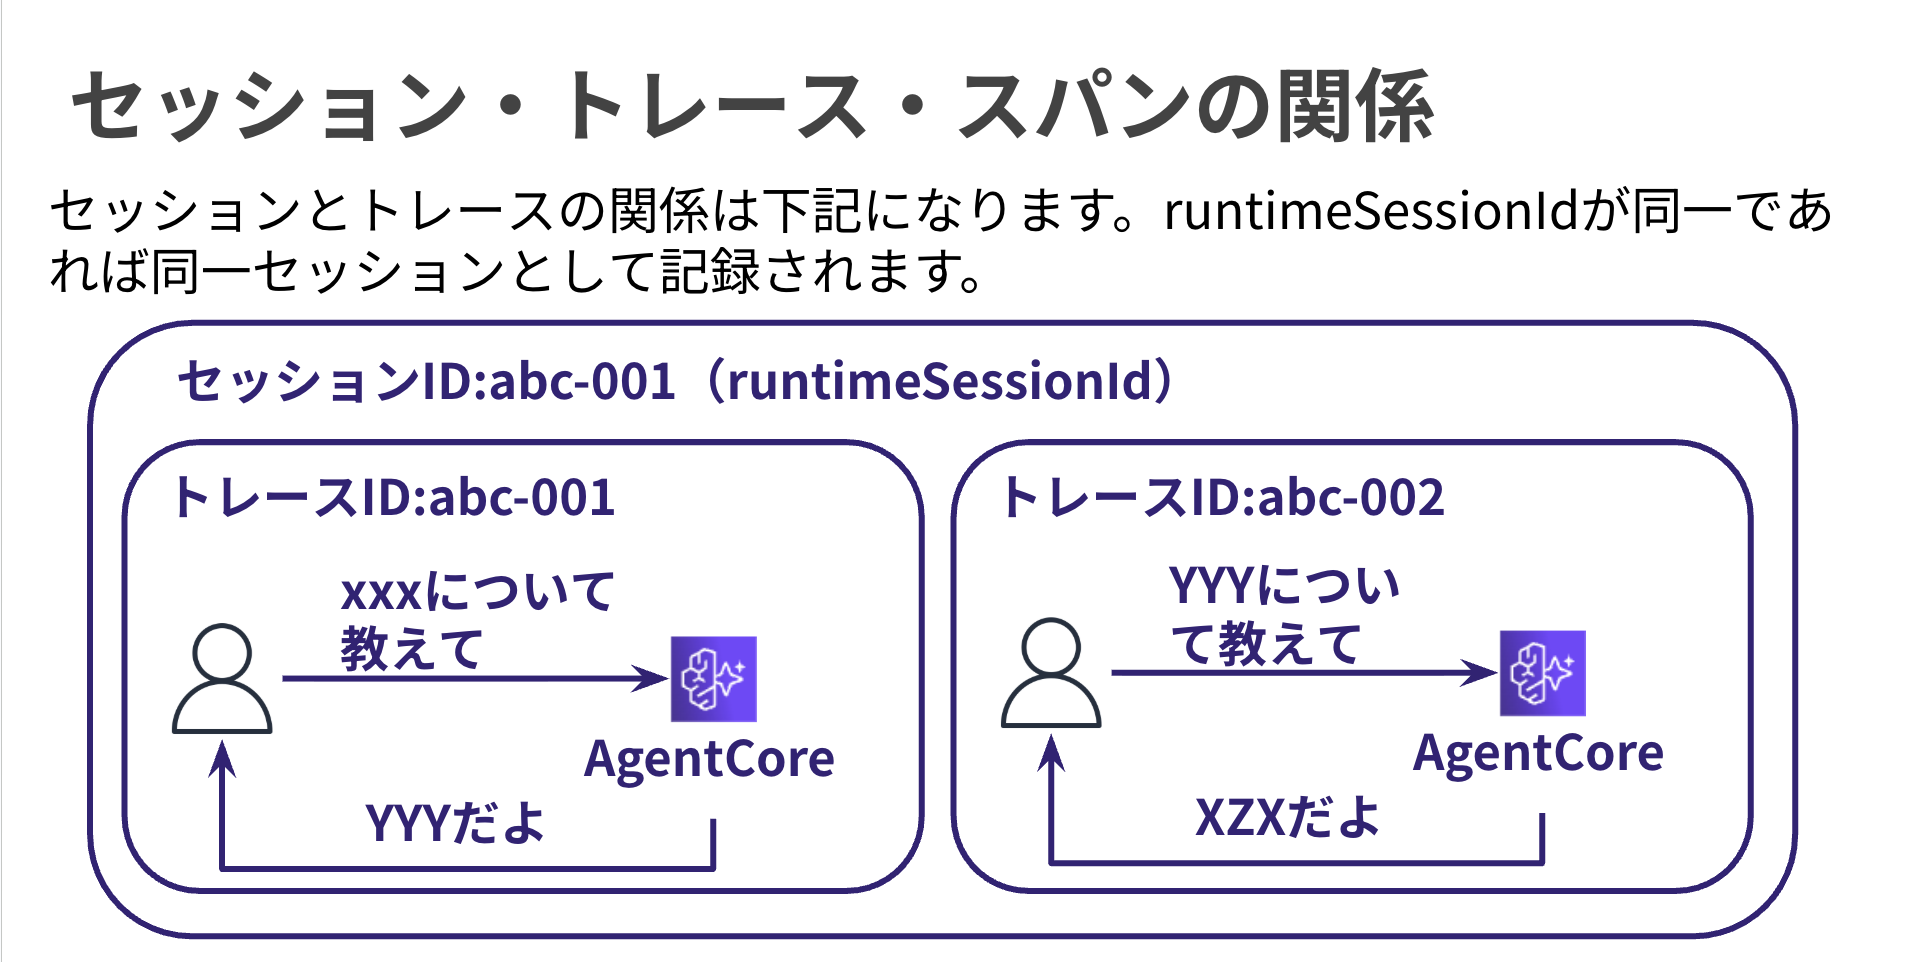
Finally, for spans and traces, a trace records the complete execution path from agent invocation to response, while spans represent individual units of operation within it. The hierarchical structure allows you to visually confirm how much time was spent on which processes.
In AgentCore Observability, a session exists as a unit that bundles traces, representing the entire conversation. It looks like this:
Dashboard Integration
This is a built-in dashboard. It's a convenient feature viewable from CloudWatch.
It's provided as a feature called GenAI Observability.
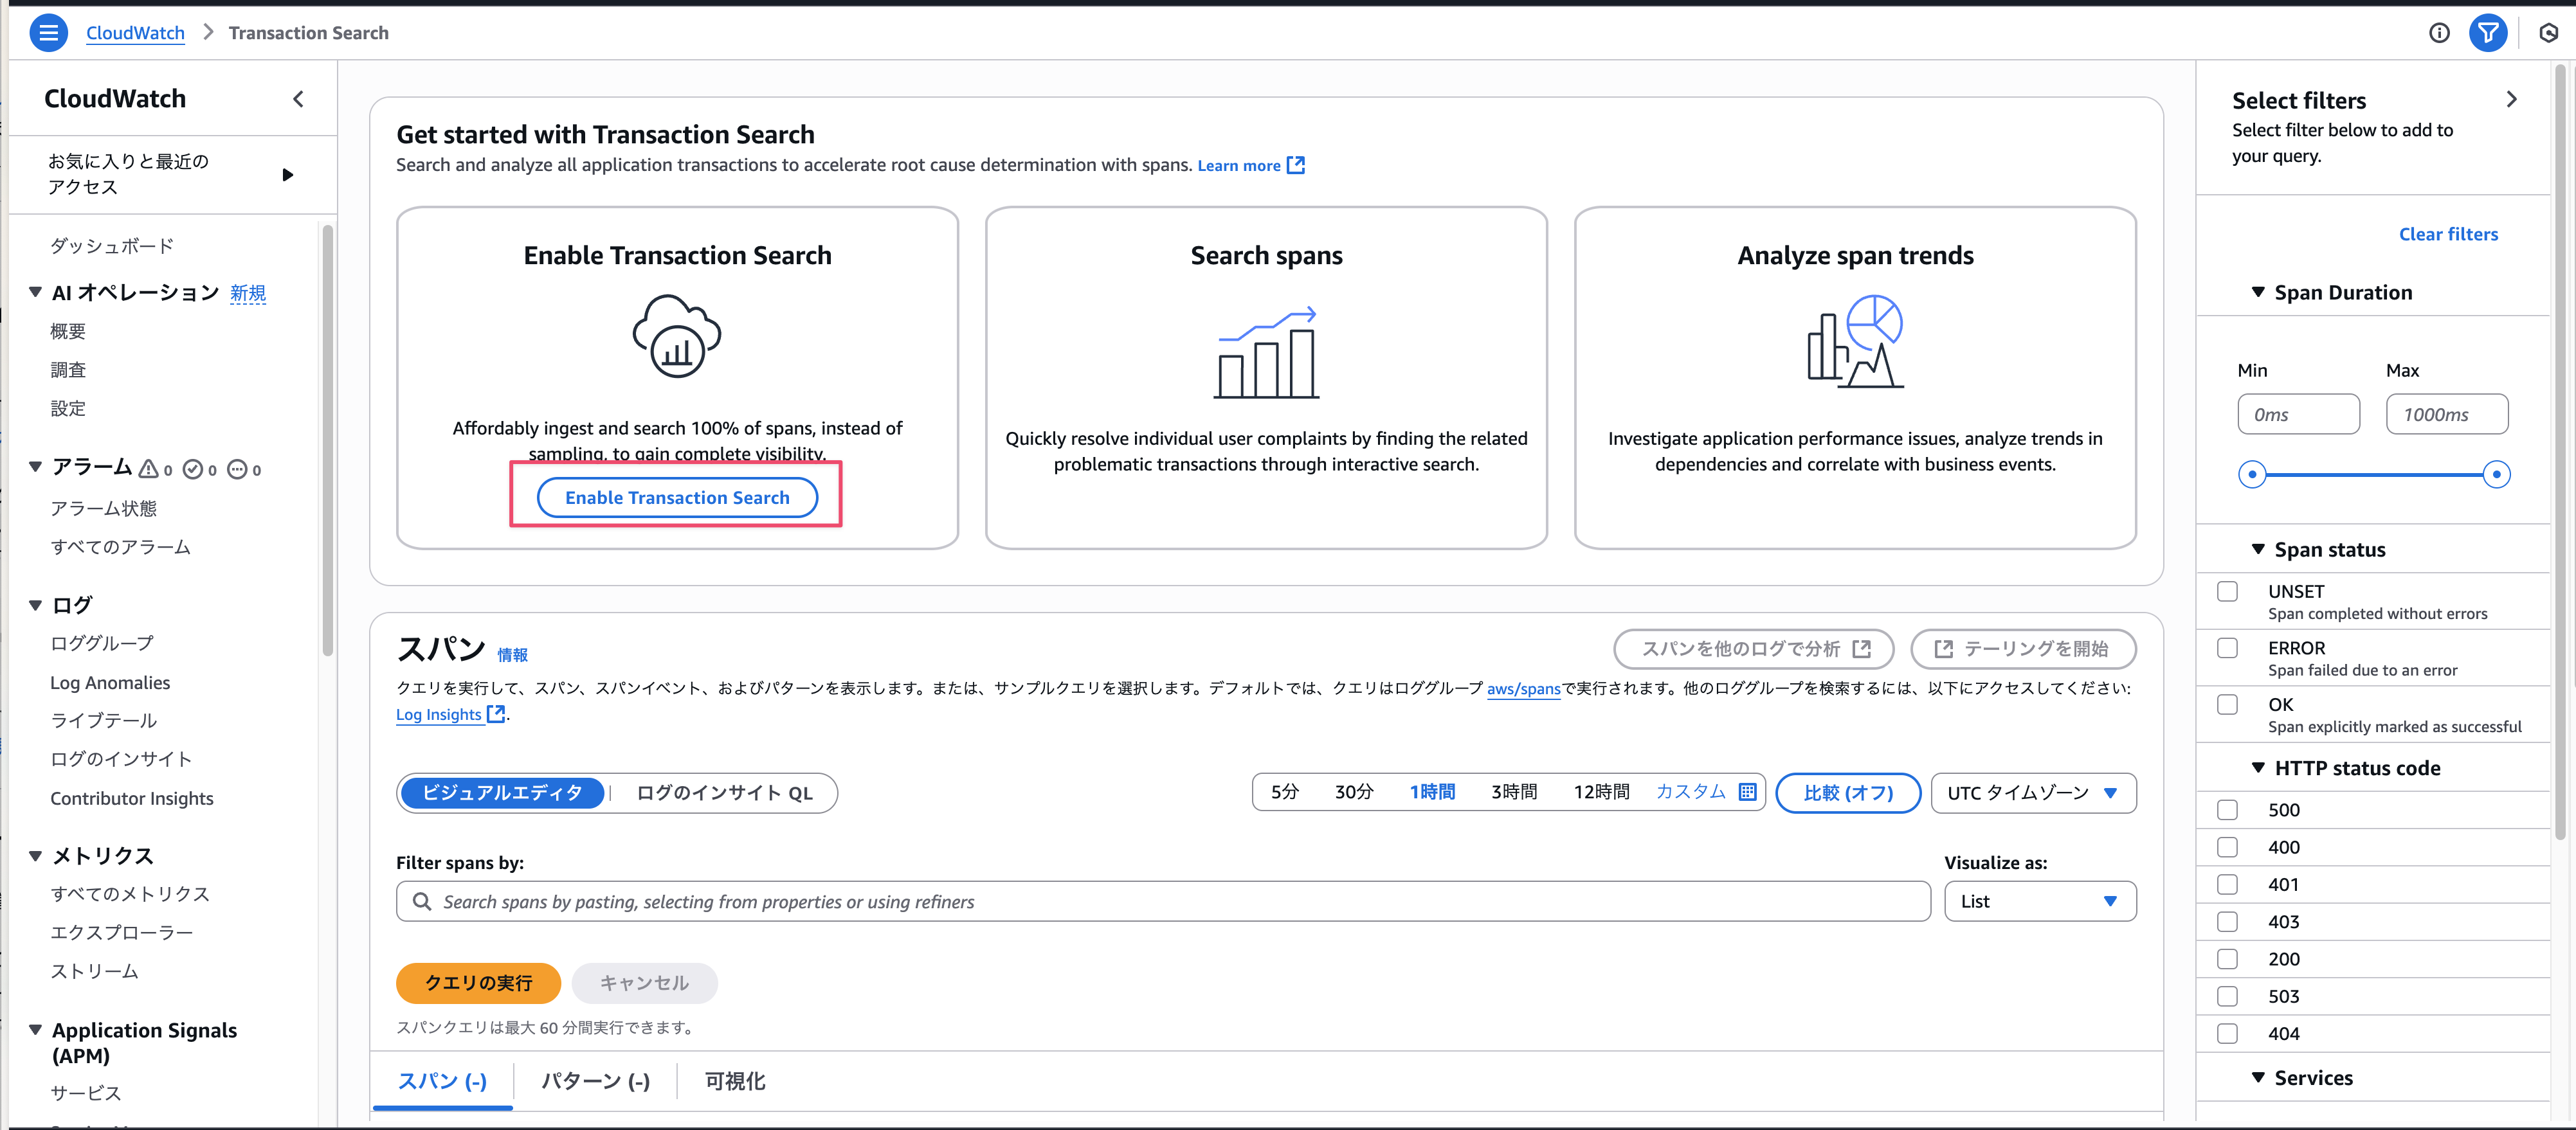
Enabling Transaction Search
To allow span capture, you need to enable transaction search once per account.
Click the Enable Transaction Search button below to enable it.
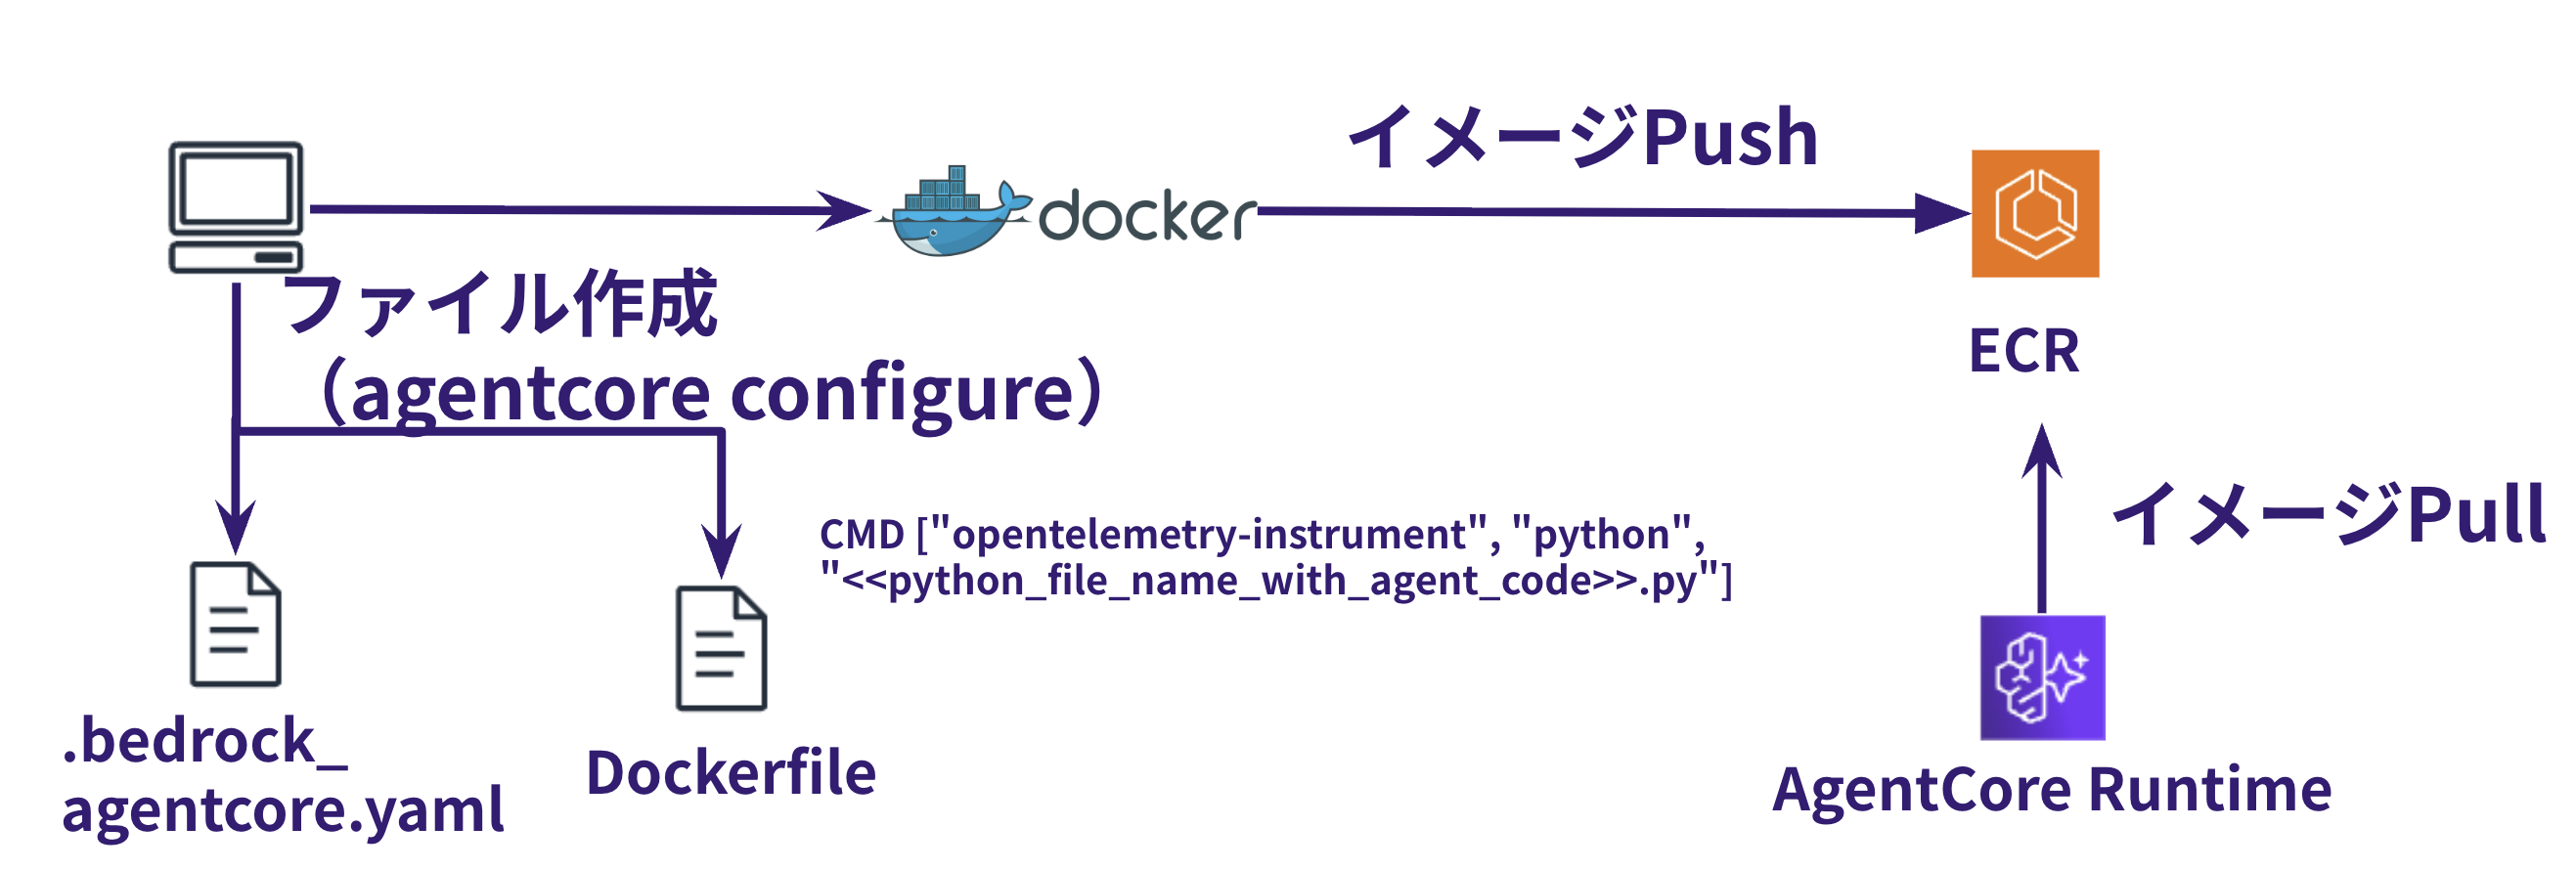
Required Dependencies
When collecting OTEL logs with AgentCore Runtime, you need to include aws-opentelemetry-distro in your dependencies. However, when deploying using the AgentCore starter toolkit, opentelemetry-instrument is automatically enabled, allowing for visualization.
The concept is illustrated in the figure below.
Log Groups
When using Runtime, two types of log streams are output.
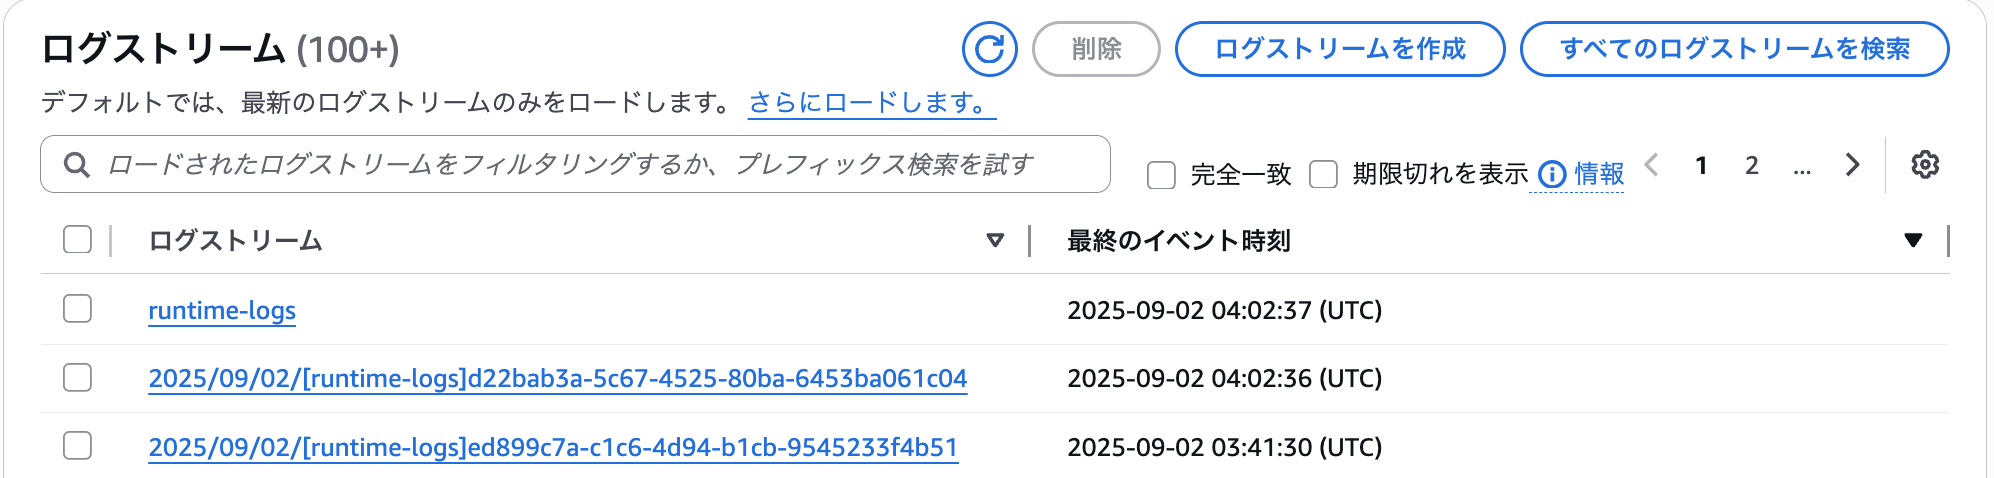
- runtime-logs
- OpenTelemetry standard logs
- YYYY/MM/DD/[runtime-logs]xxxx
- Application logs
There are a lot of features...!!
In this article, I'd like to focus on the GenAI Observability dashboard!
Preparation
Agent We'll Use Today
Today we'll check what we can see with an agent we've created previously.
I'll test with an agent that uses the Memory feature.
Let's Try It
Set the runtime-session-id in chat.py to the same value.
runtime_session_id = "sample-id-xxxx"
Let's ask the agent a question.
python chat.py "Tell me about S3 bucket security" --user "test_user"  --session "session_test"                                        [11:05:31]
"Practical advice:\n- Regularly check AWS official documentation\n- Carefully configure security groups and bucket policies\n- Always be aware of the principle of least privilege\n\nDo you have any questions or would you like to know more about specific implementations?"

python chat.py "I'm not good with security permissions... What specific settings should I make?" --user "test_user"  --session "session_test"
"I'll explain the key points of S3 bucket security settings in detail:\n\n1. Bucket Access Settings\n- Block public access\n  - Enable the \"Block all public access\" option\n  - Block all public access by default\n\n2. Bucket Policy Settings\n- Apply the principle of least privilege\n  ```json\n  {\n    \"Version\": \"2012-10-17\",\n    \"Statement\": [\n      {\n        \"Sid\": \"RestrictBucketAccess\",\n        \"Effect\": \"Deny\",\n        \"Principal\": \"*\",\n        \"Action\": \"s3:*\",\n        \"Resource\": [\n          \"arn:aws:s3:::your-bucket-name\",\n          \"arn:aws:s3:::your-bucket-name/*\"\n        ],\n        \"Condition\": {\n          \"NotIpAddress\": {\n            \"aws:SourceIp\": \"Allowed IP address/range\"\n          }\n        }\n      }\n    ]\n  }\n  ```\n\n3. IAM User/Role Permission Management\n- Allow only specifically necessary operations\n- Separate read/write permissions\n- Regular review of permissions\n\n4. Enable Encryption\n- Enable server-side encryption\n  - SSE-S3 (AWS managed keys)\n  - SSE-KMS (Customer managed keys)\n\n5. Versioning and Tracking\n- Enable versioning\n- Record access logs with CloudTrail\n\nAs practical advice, I recommend:\n- Refer to AWS official documentation\n- Configure security groups gradually\n- Be mindful of the principle of least privilege\n\nDo you have any concerns about specific implementations or settings? Let's check them carefully together."
I'll also ask a question that uses tools. It's the weakness analysis tool.
python chat.py "Analyze my weaknesses" --session "session_test" --user "test_user"                                                             [11:21:58]
"From the analysis results, I can see that you particularly struggle with security permission settings in cloud computing. Focusing on S3 bucket security, here's some specific advice:\n\n1. IAM (Identity and Access Management) Basics\n- Set bucket access rights with the \"principle of least privilege\"\n- Grant only the minimum necessary permissions to users and roles\n\n2. Key Points for Bucket Policy Settings\n- Fine-grained control of read, write, delete permissions\n- Restrict access from specific IP addresses\n- Enable encryption\n\n3. Specific Setting Examples\n```json\n{\n  \"Version\": \"2012-10-17\",\n  \"Statement\": [\n    {\n      \"Effect\": \"Allow\",\n      \"Principal\": {\"AWS\": \"arn:aws:iam::xxxxxxxxxxxx:user/username\"},\n      \"Action\": [\n        \"s3:GetObject\",\n        \"s3:PutObject\"\n      ],\n      \"Resource\": \"arn:aws:s3:::your-bucket-name/*\"\n    }\n  ]\n}\n```\n\nI recommend learning step by step. Start with one setting and gradually deepen your understanding.\n\nIf you want to know more about specific points or have questions, please let me know. We can learn step by step together."
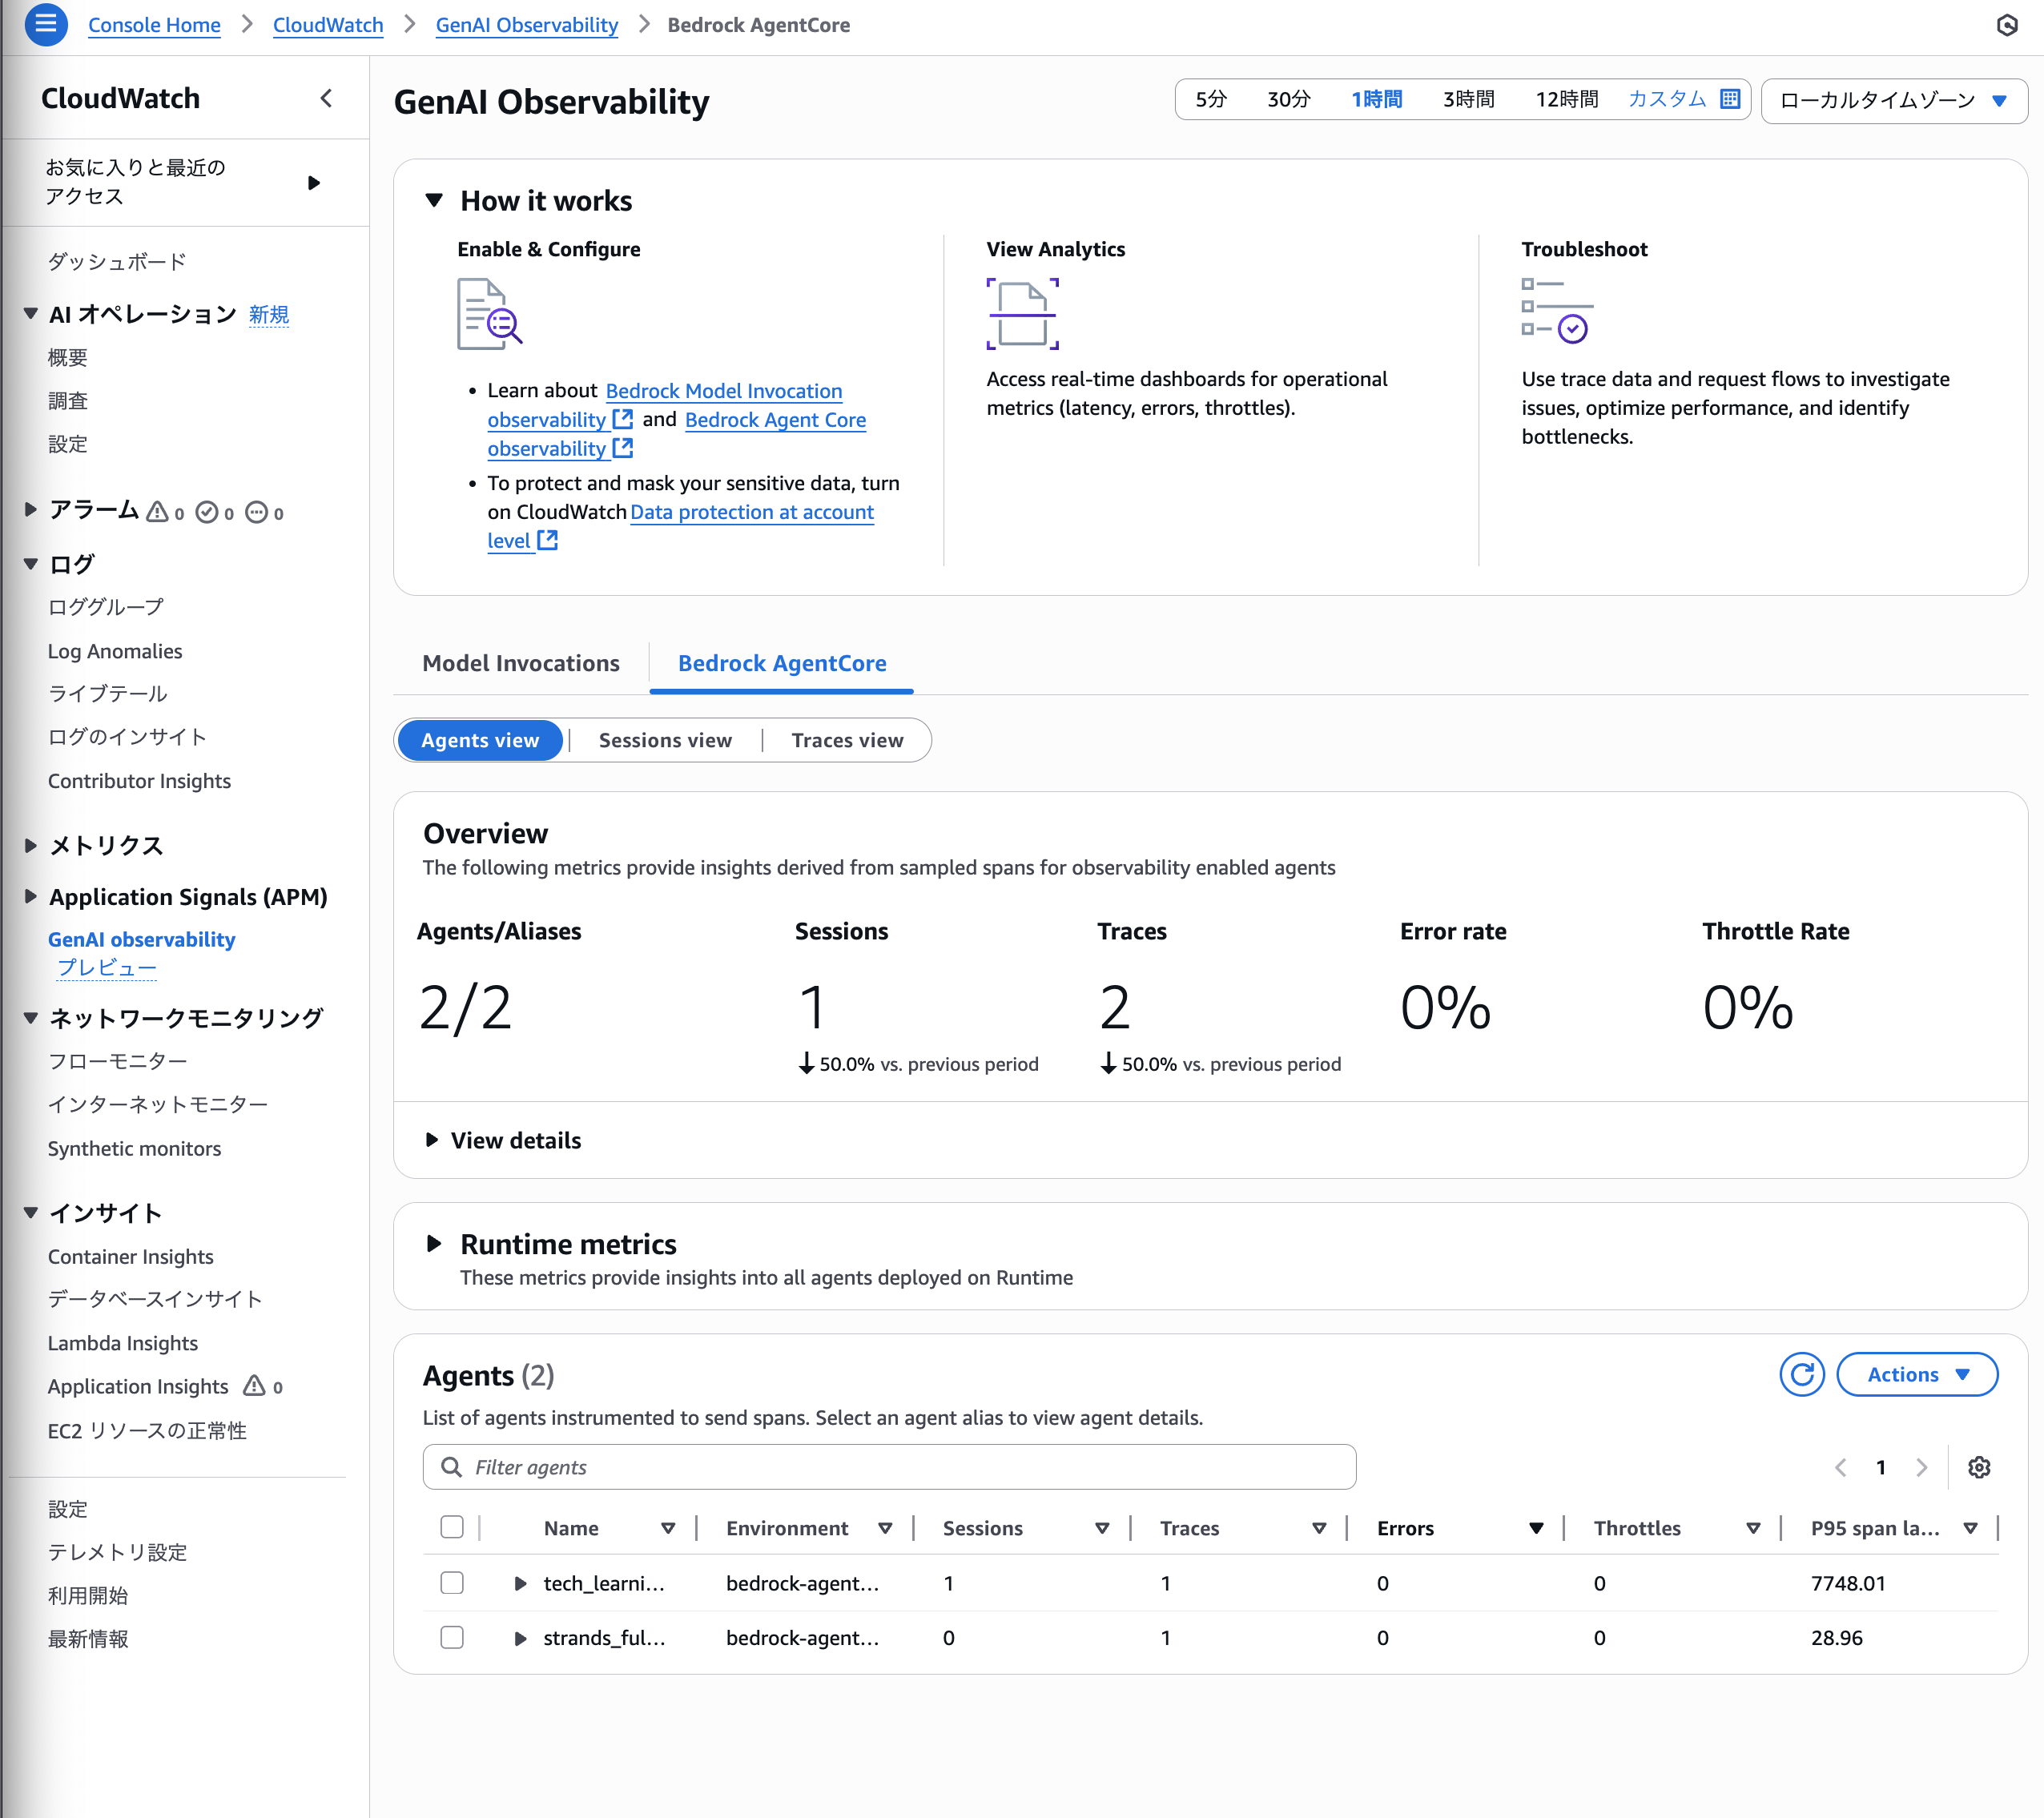
Now let's take a look at the CloudWatch dashboard.
Click on GenAI observability in the left tab. Click on the Bedrock AgentCore tab.
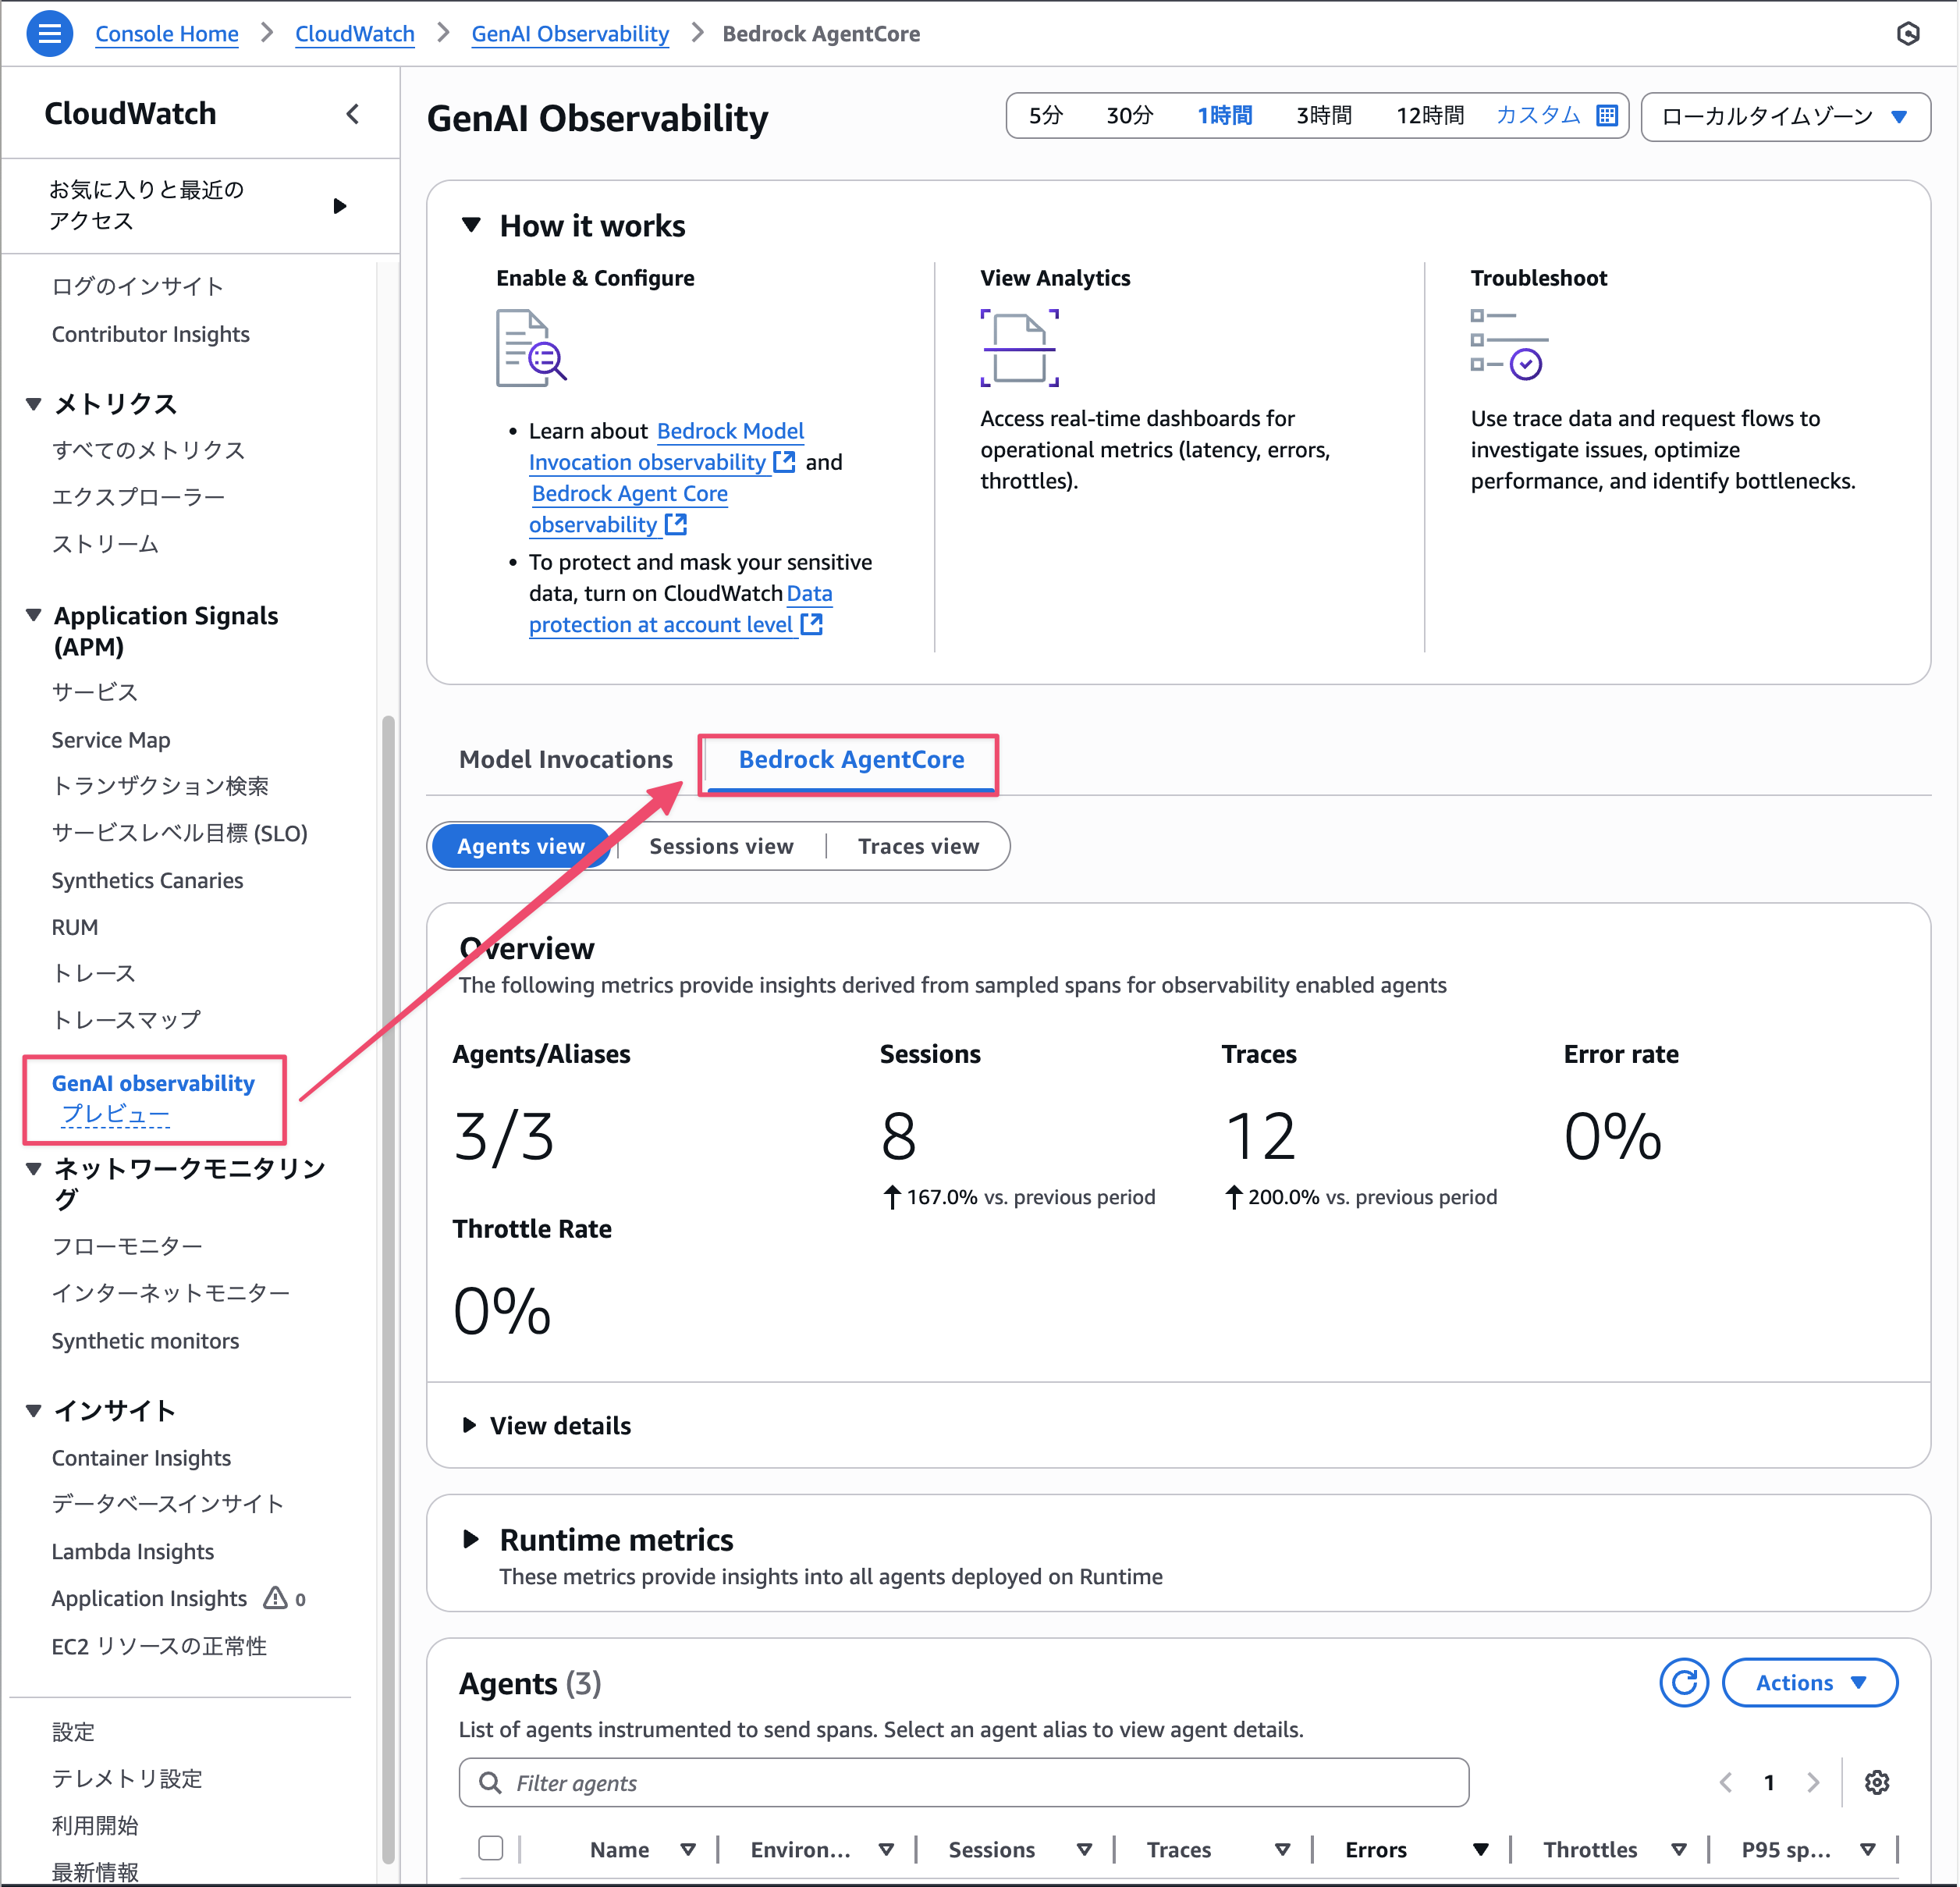
A cool dashboard has appeared.
There are three views (Agents view, Sessions view, and Traces view), each allowing you to check metrics and behavior from different perspectives.
Agents view
You can check the behavior of the deployed Agent.
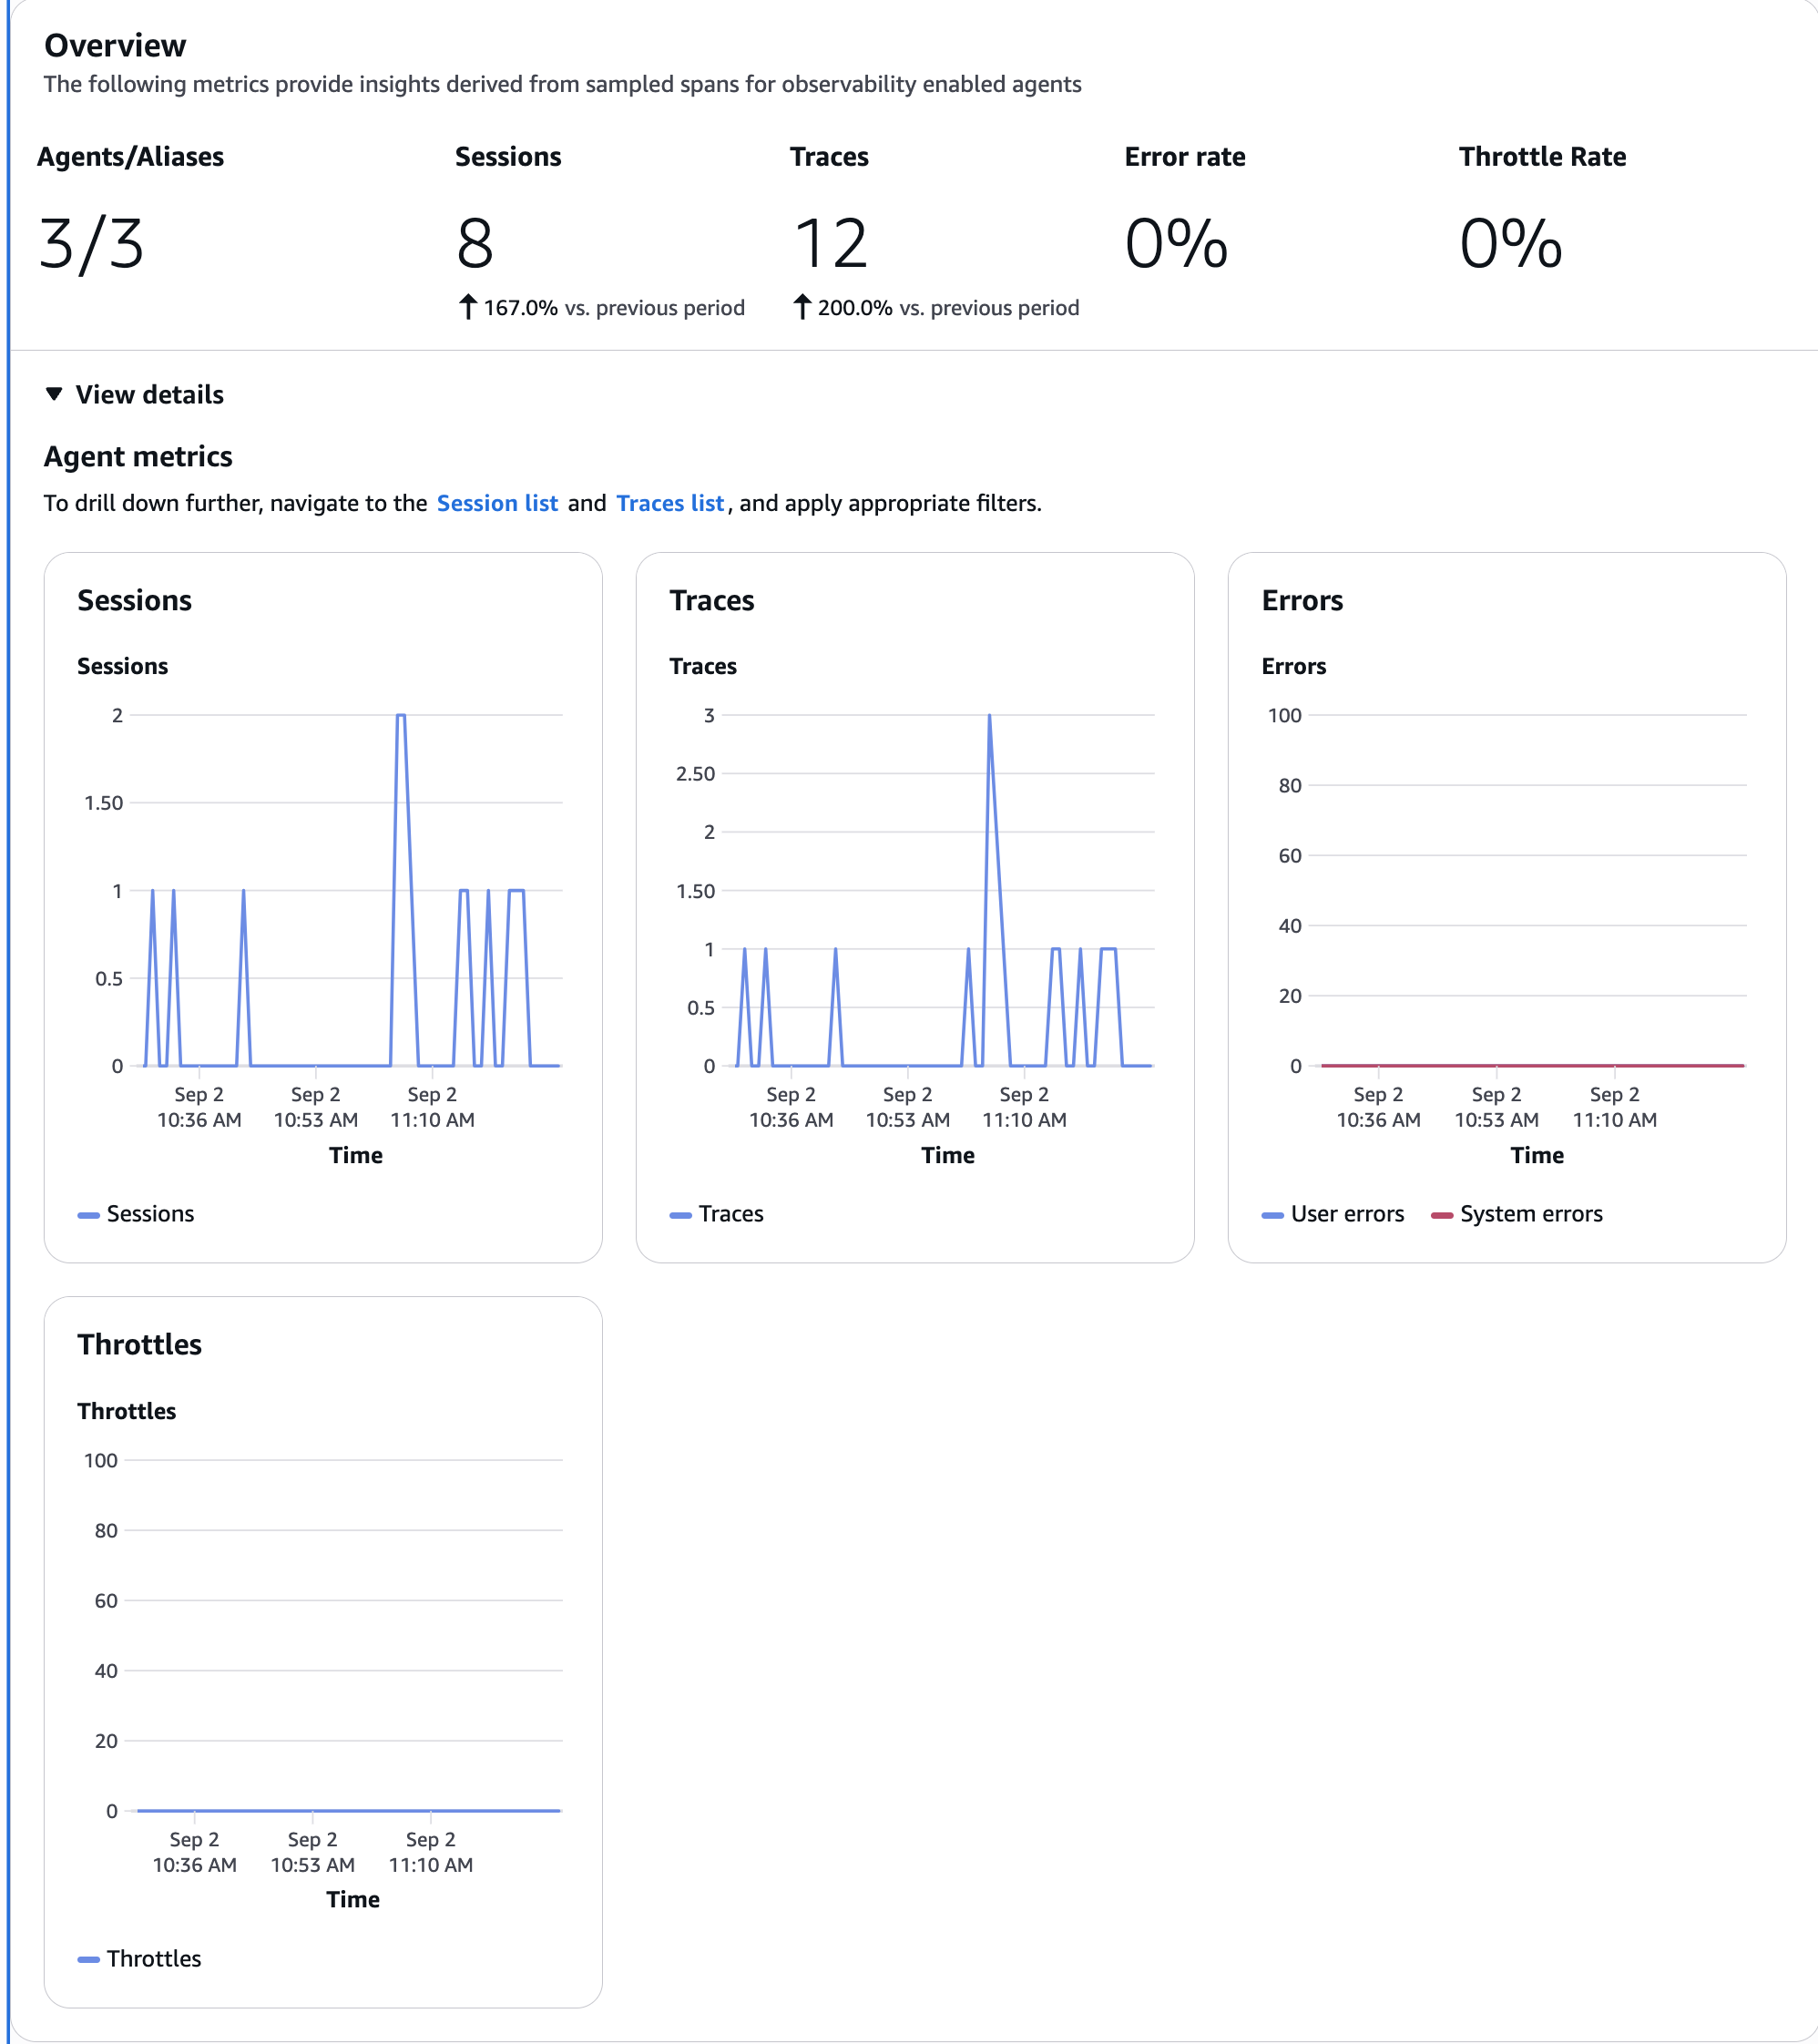
It's designed to show at a glance the number of sessions and traces, and whether there are any errors or throttling.
You can also click on the endpoints deployed in the agent list, so click the link if you want to see details per agent.
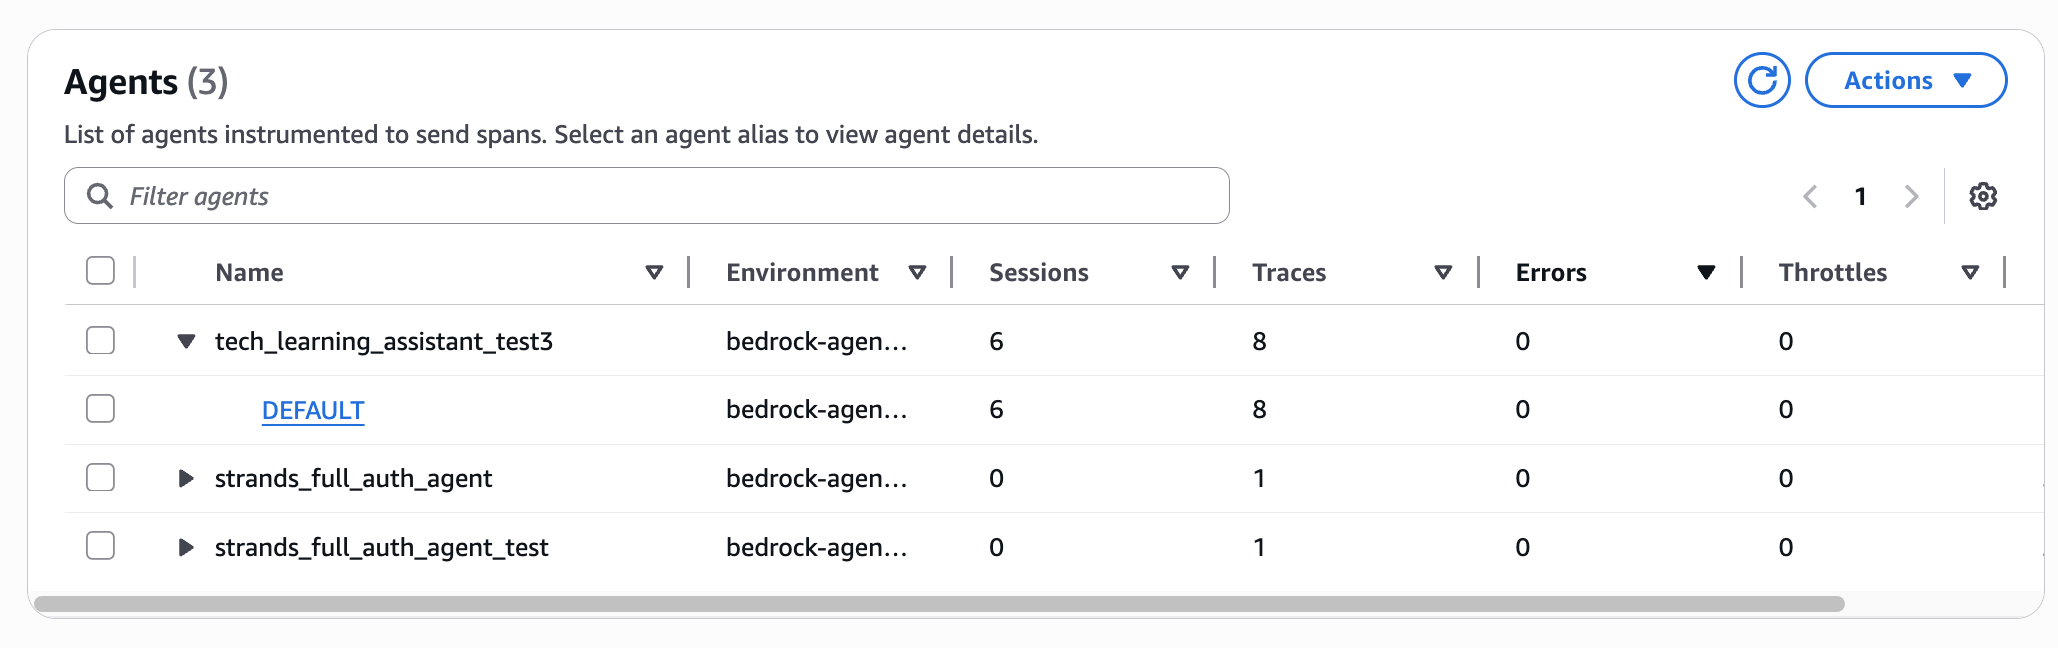
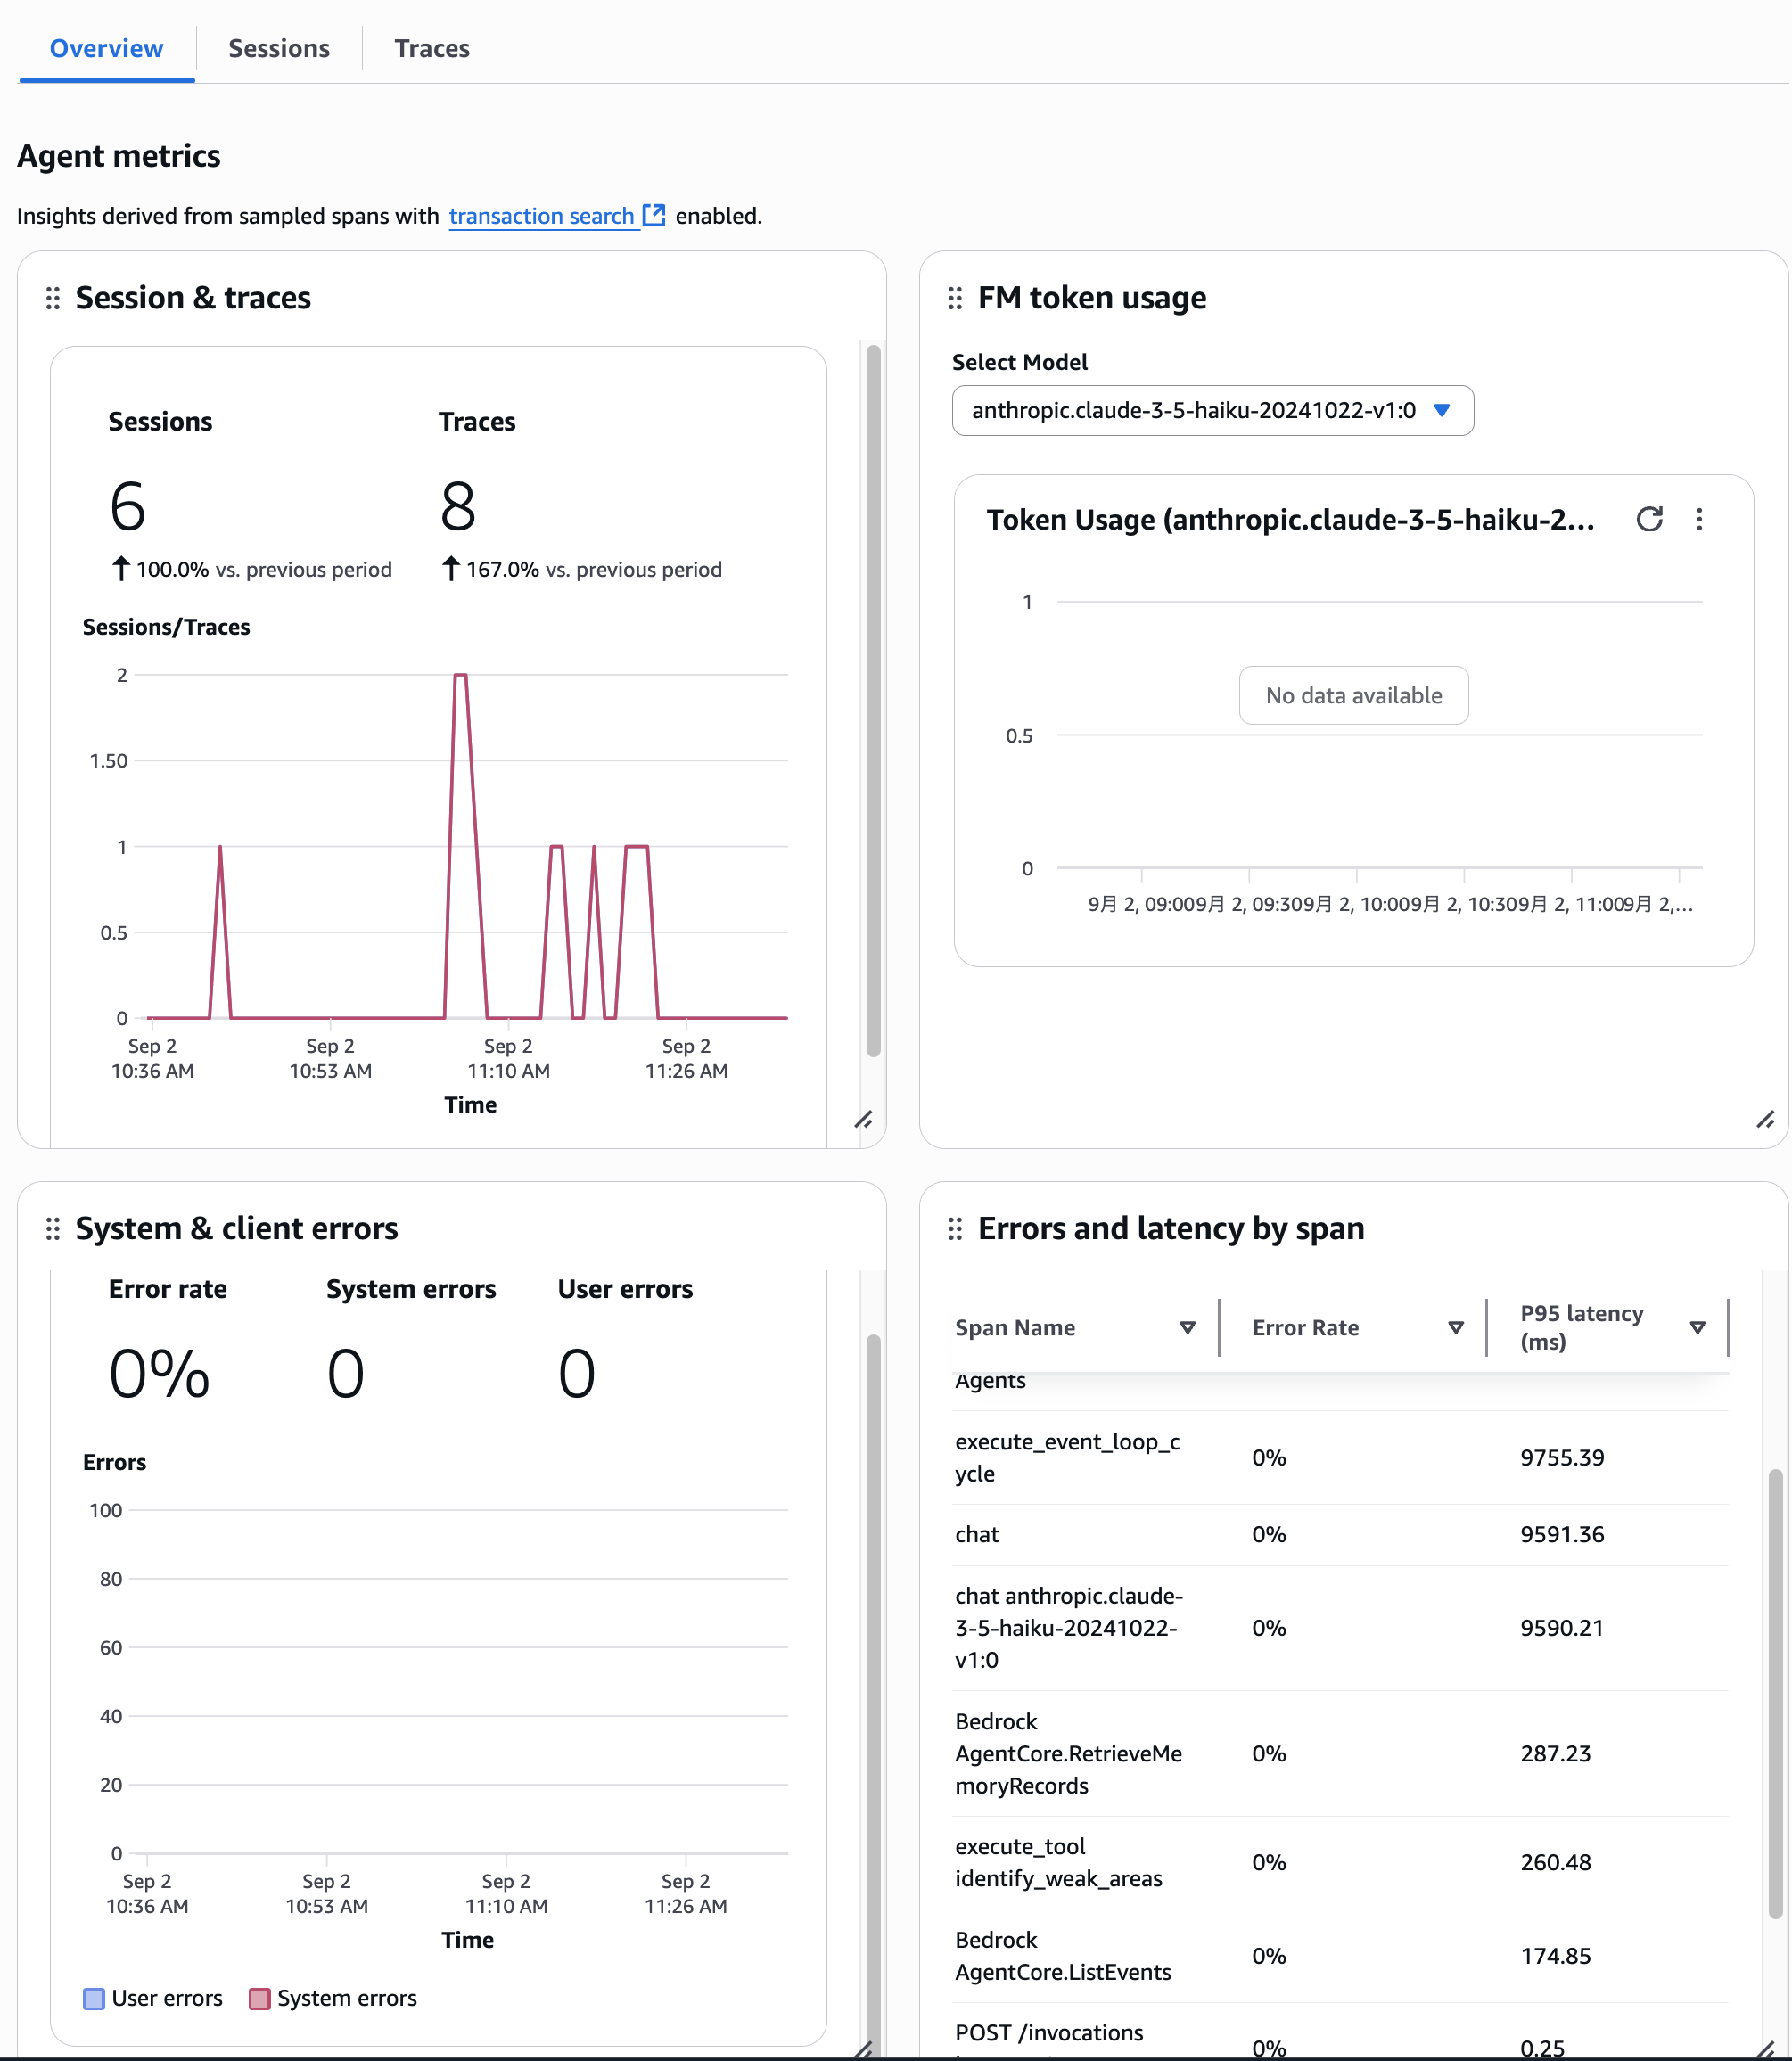
This seems to show more details on a per-agent basis.

Also, by clicking on the Sessions tab or Traces tab, you can view the list of Sessions and Traces within this agent.
I think this is the flow when looking at details on a per-agent basis.
I'll explain Sessions and Traces later.
Sessions view
You can check the list of Sessions for the agent.
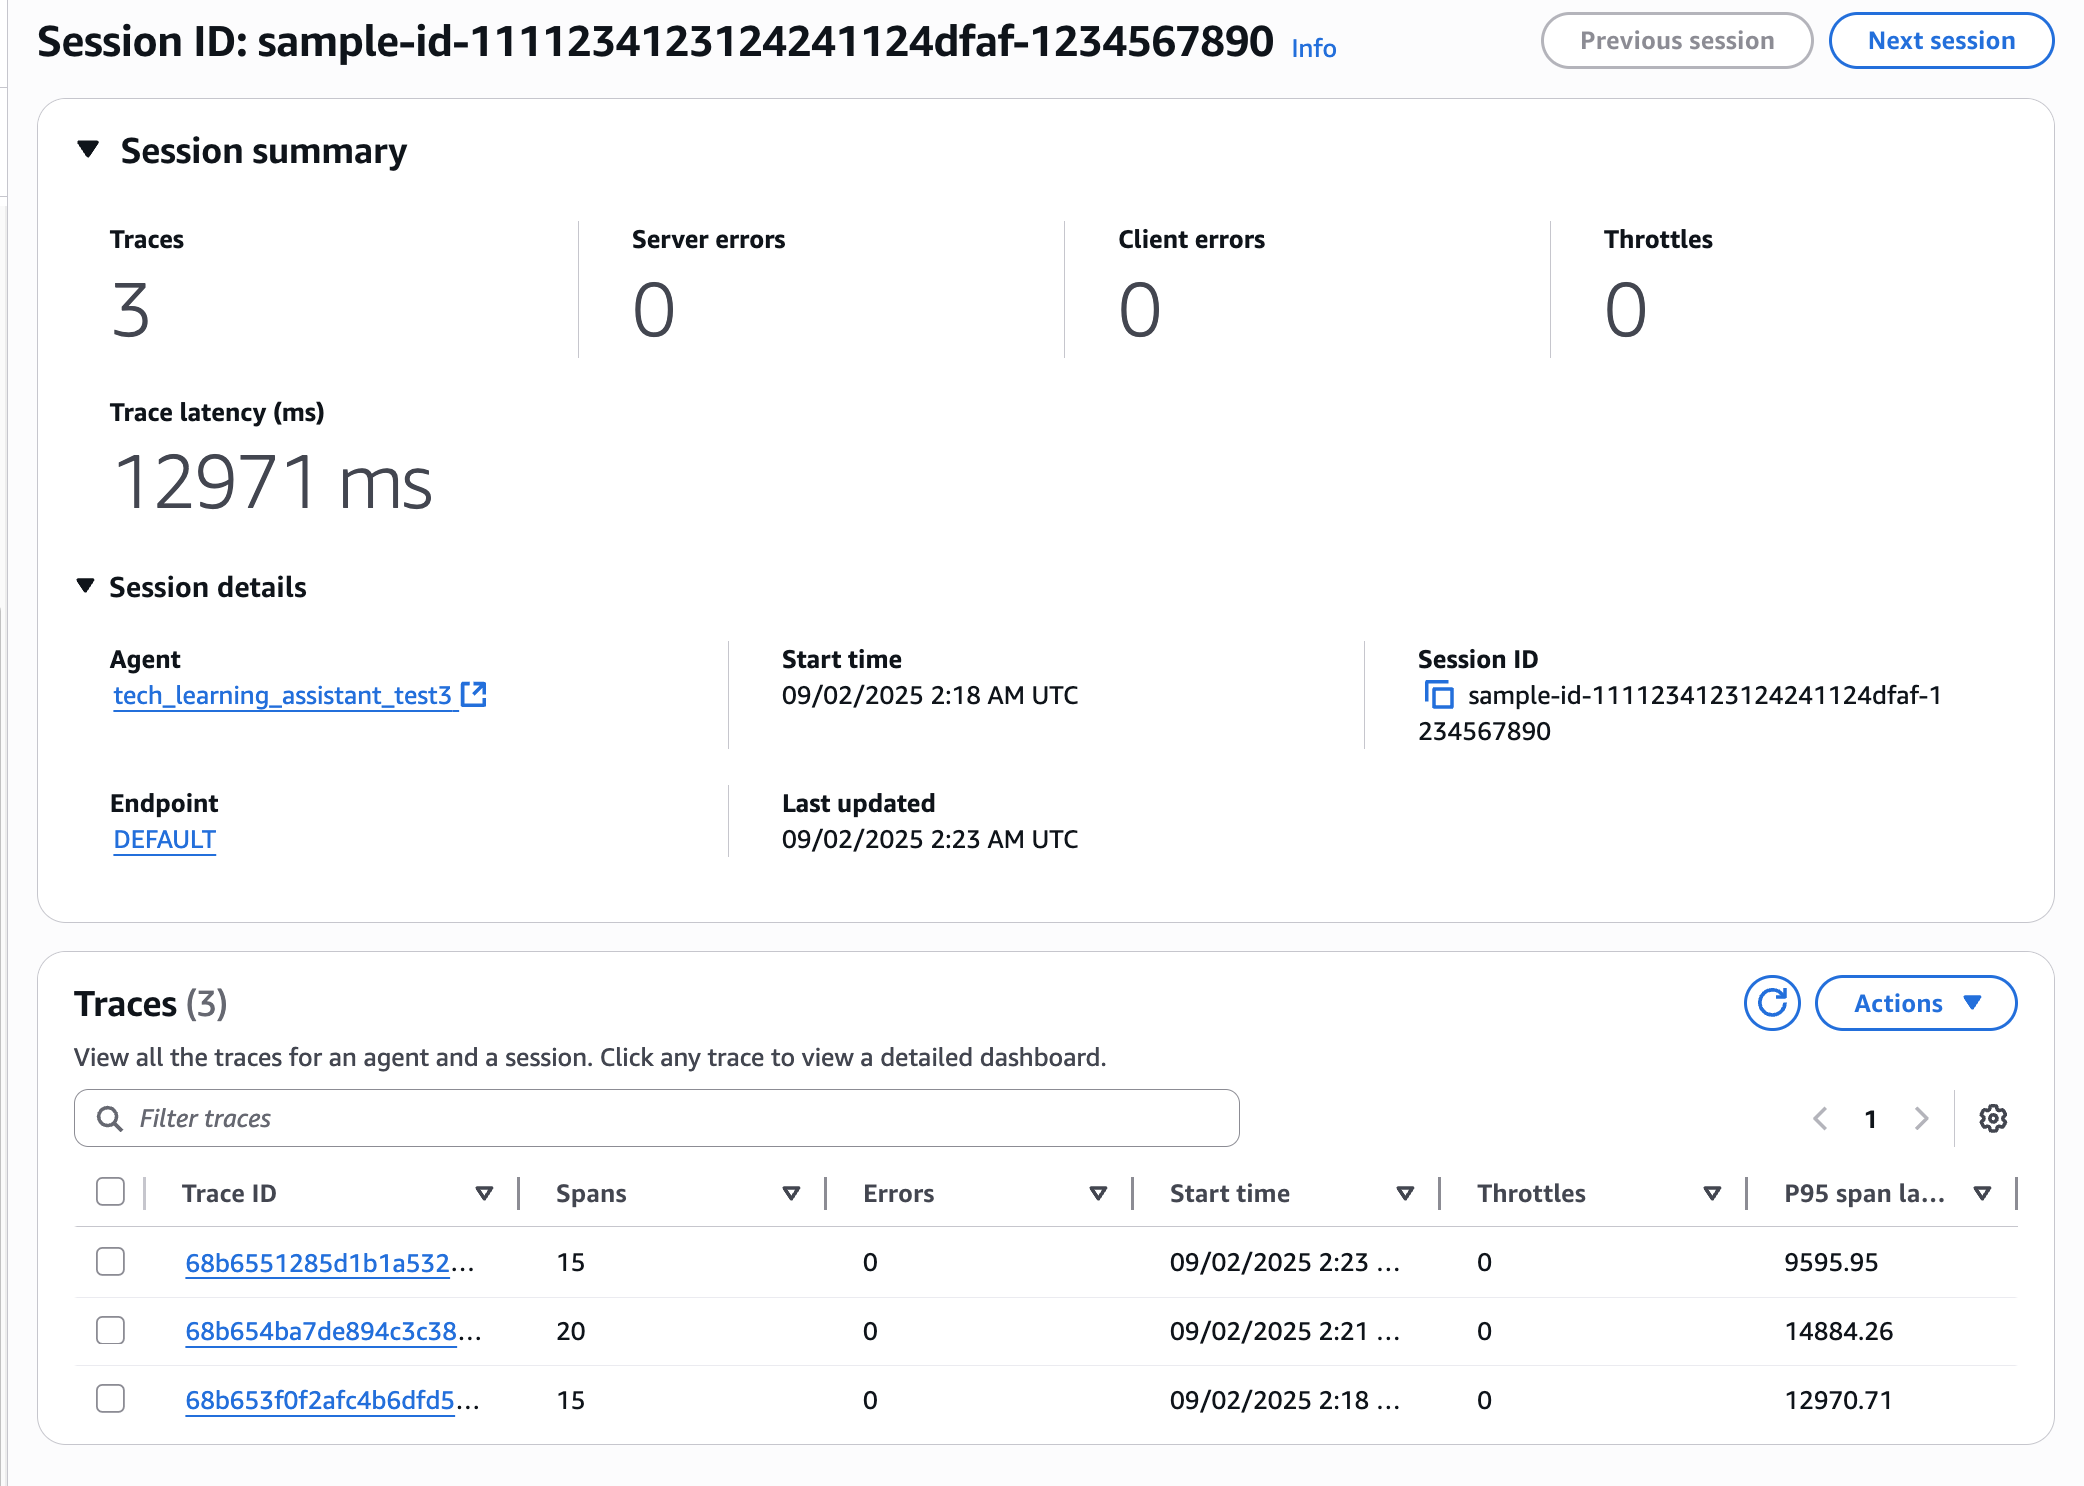
I see the arbitrary Session ID I created earlier. Let's click on it.
Clicking shows a summary of this Session. You can also see the associated Traces.

Clicking allows you to see even more details.
Traces View
Here you can see a list of all traces. Let's click on the latest trace.
Clicking brings up a graphical dashboard. It visualizes the Spans within Traces.
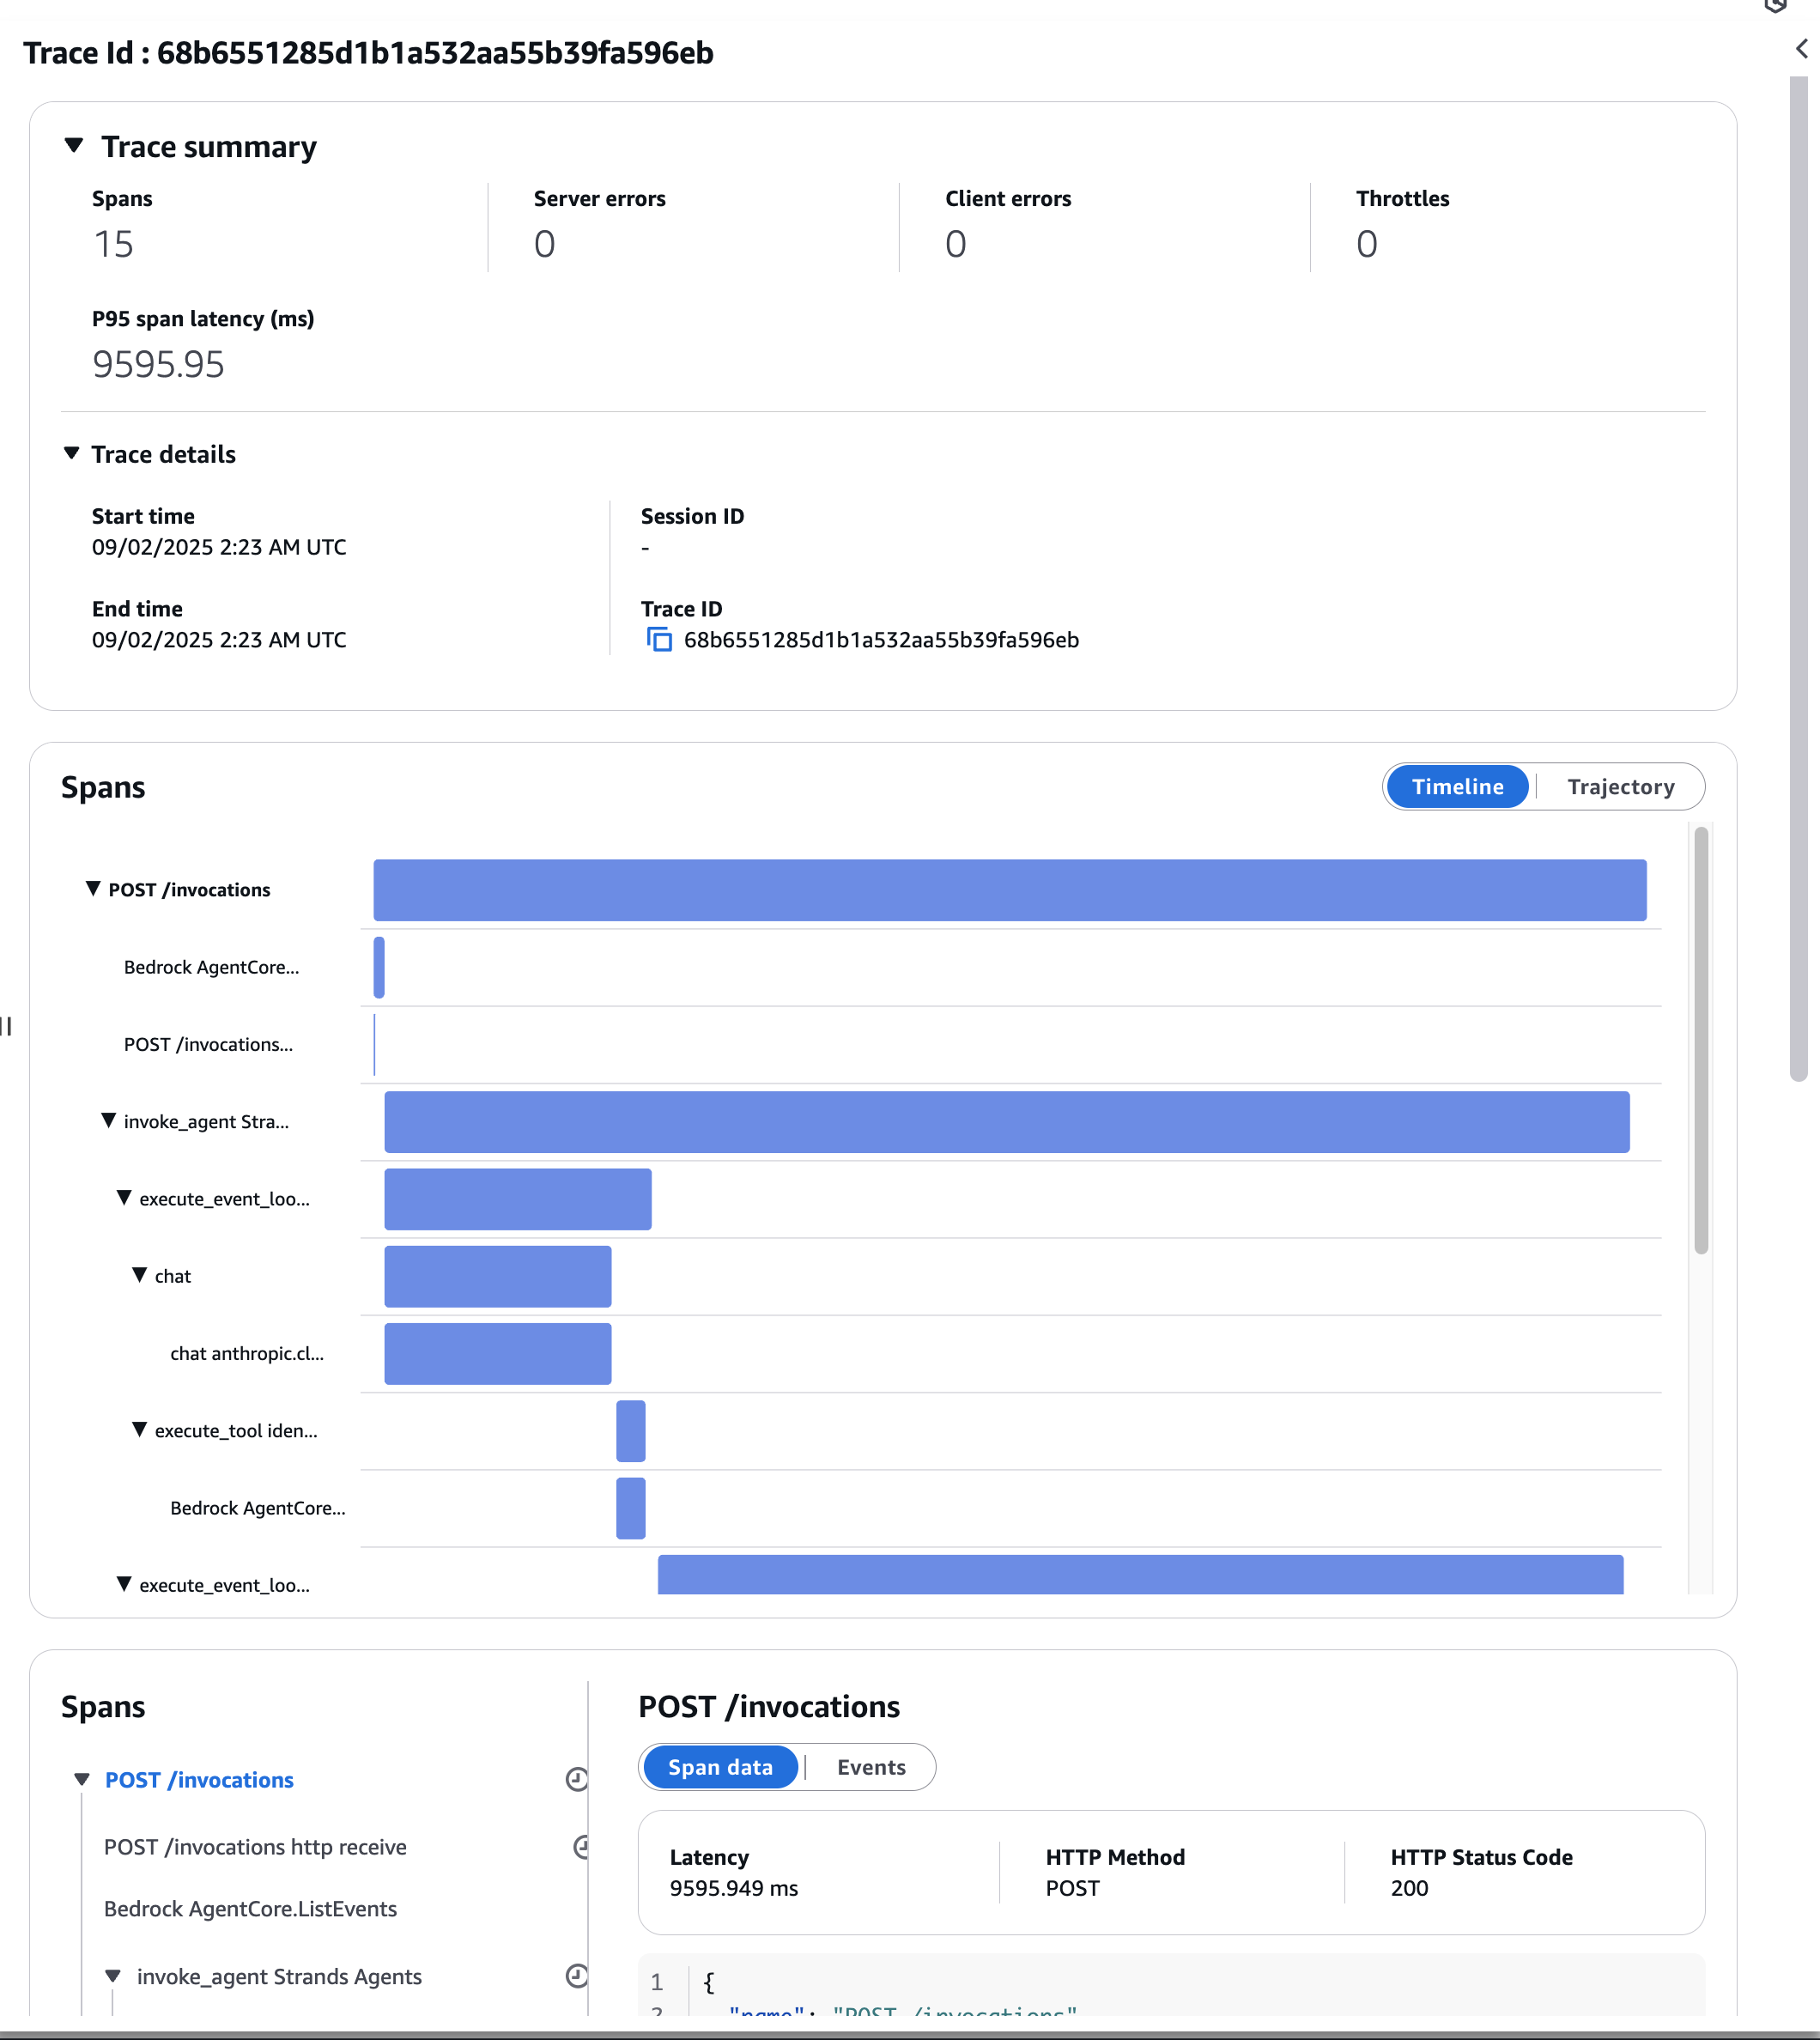
You can see the elapsed time for each span, which seems good for identifying bottlenecks!
Trajectory
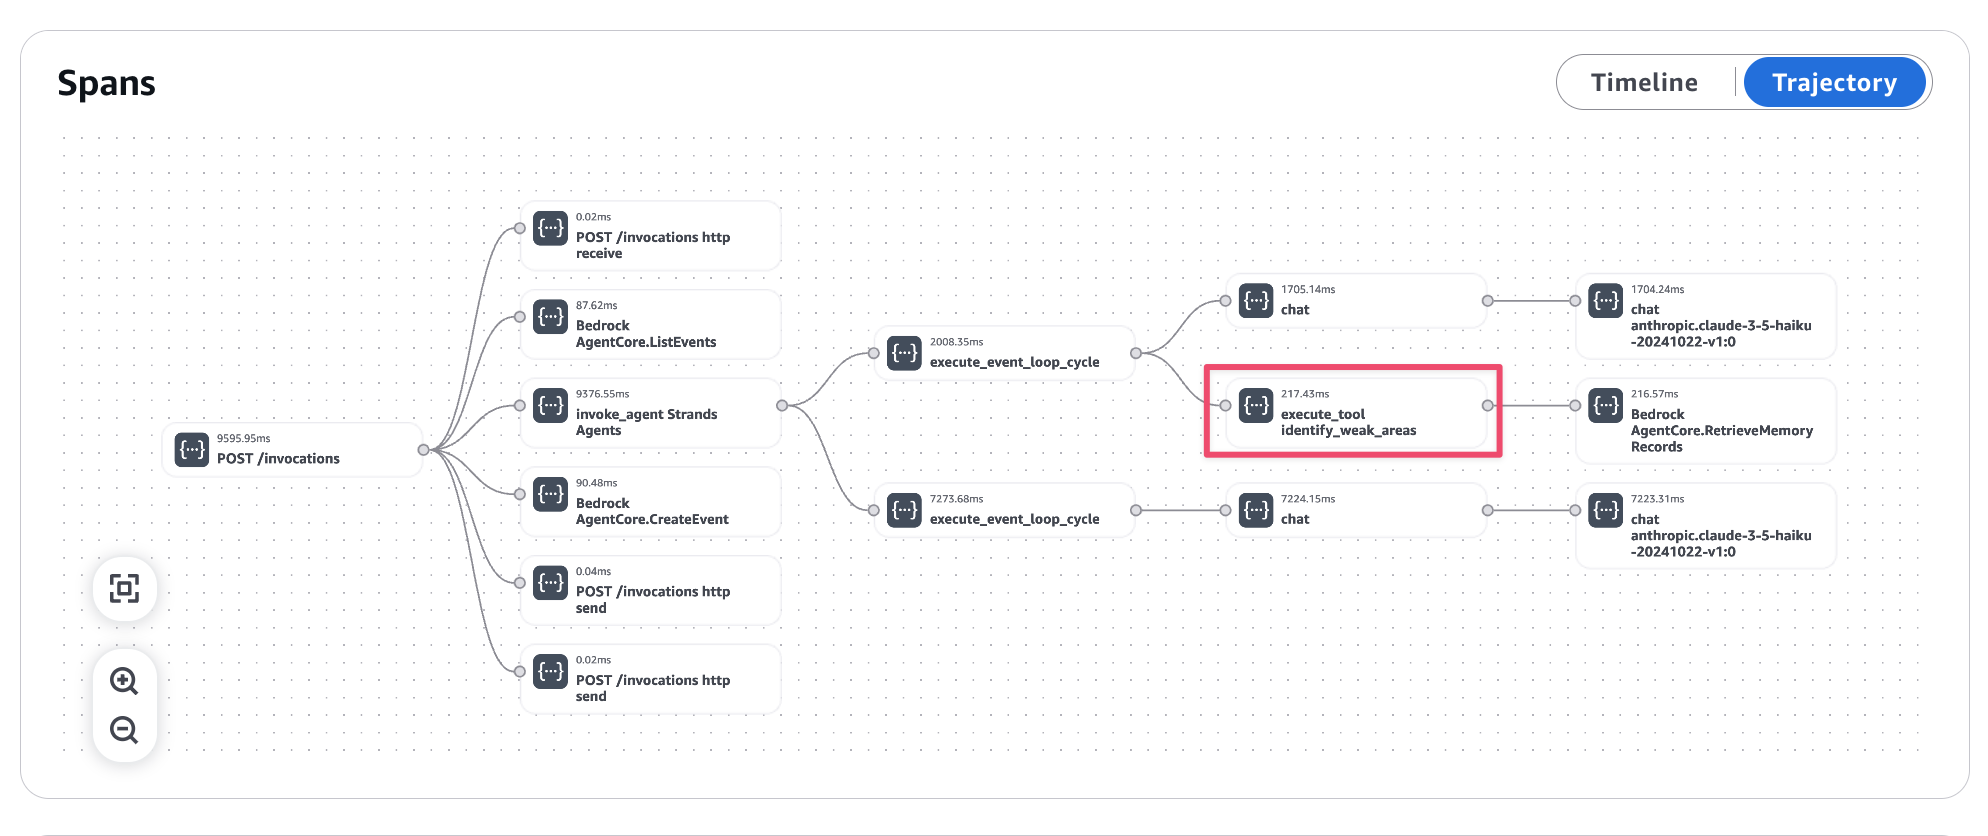
Seeing it as a flow is very clear. This shows the flow of the agent starting, launching tools, etc.
The identity_weak_areas tool that was executed for weakness analysis is properly recorded.
Also, looking at the Spans below, it's easy to see what AI actions were taken.
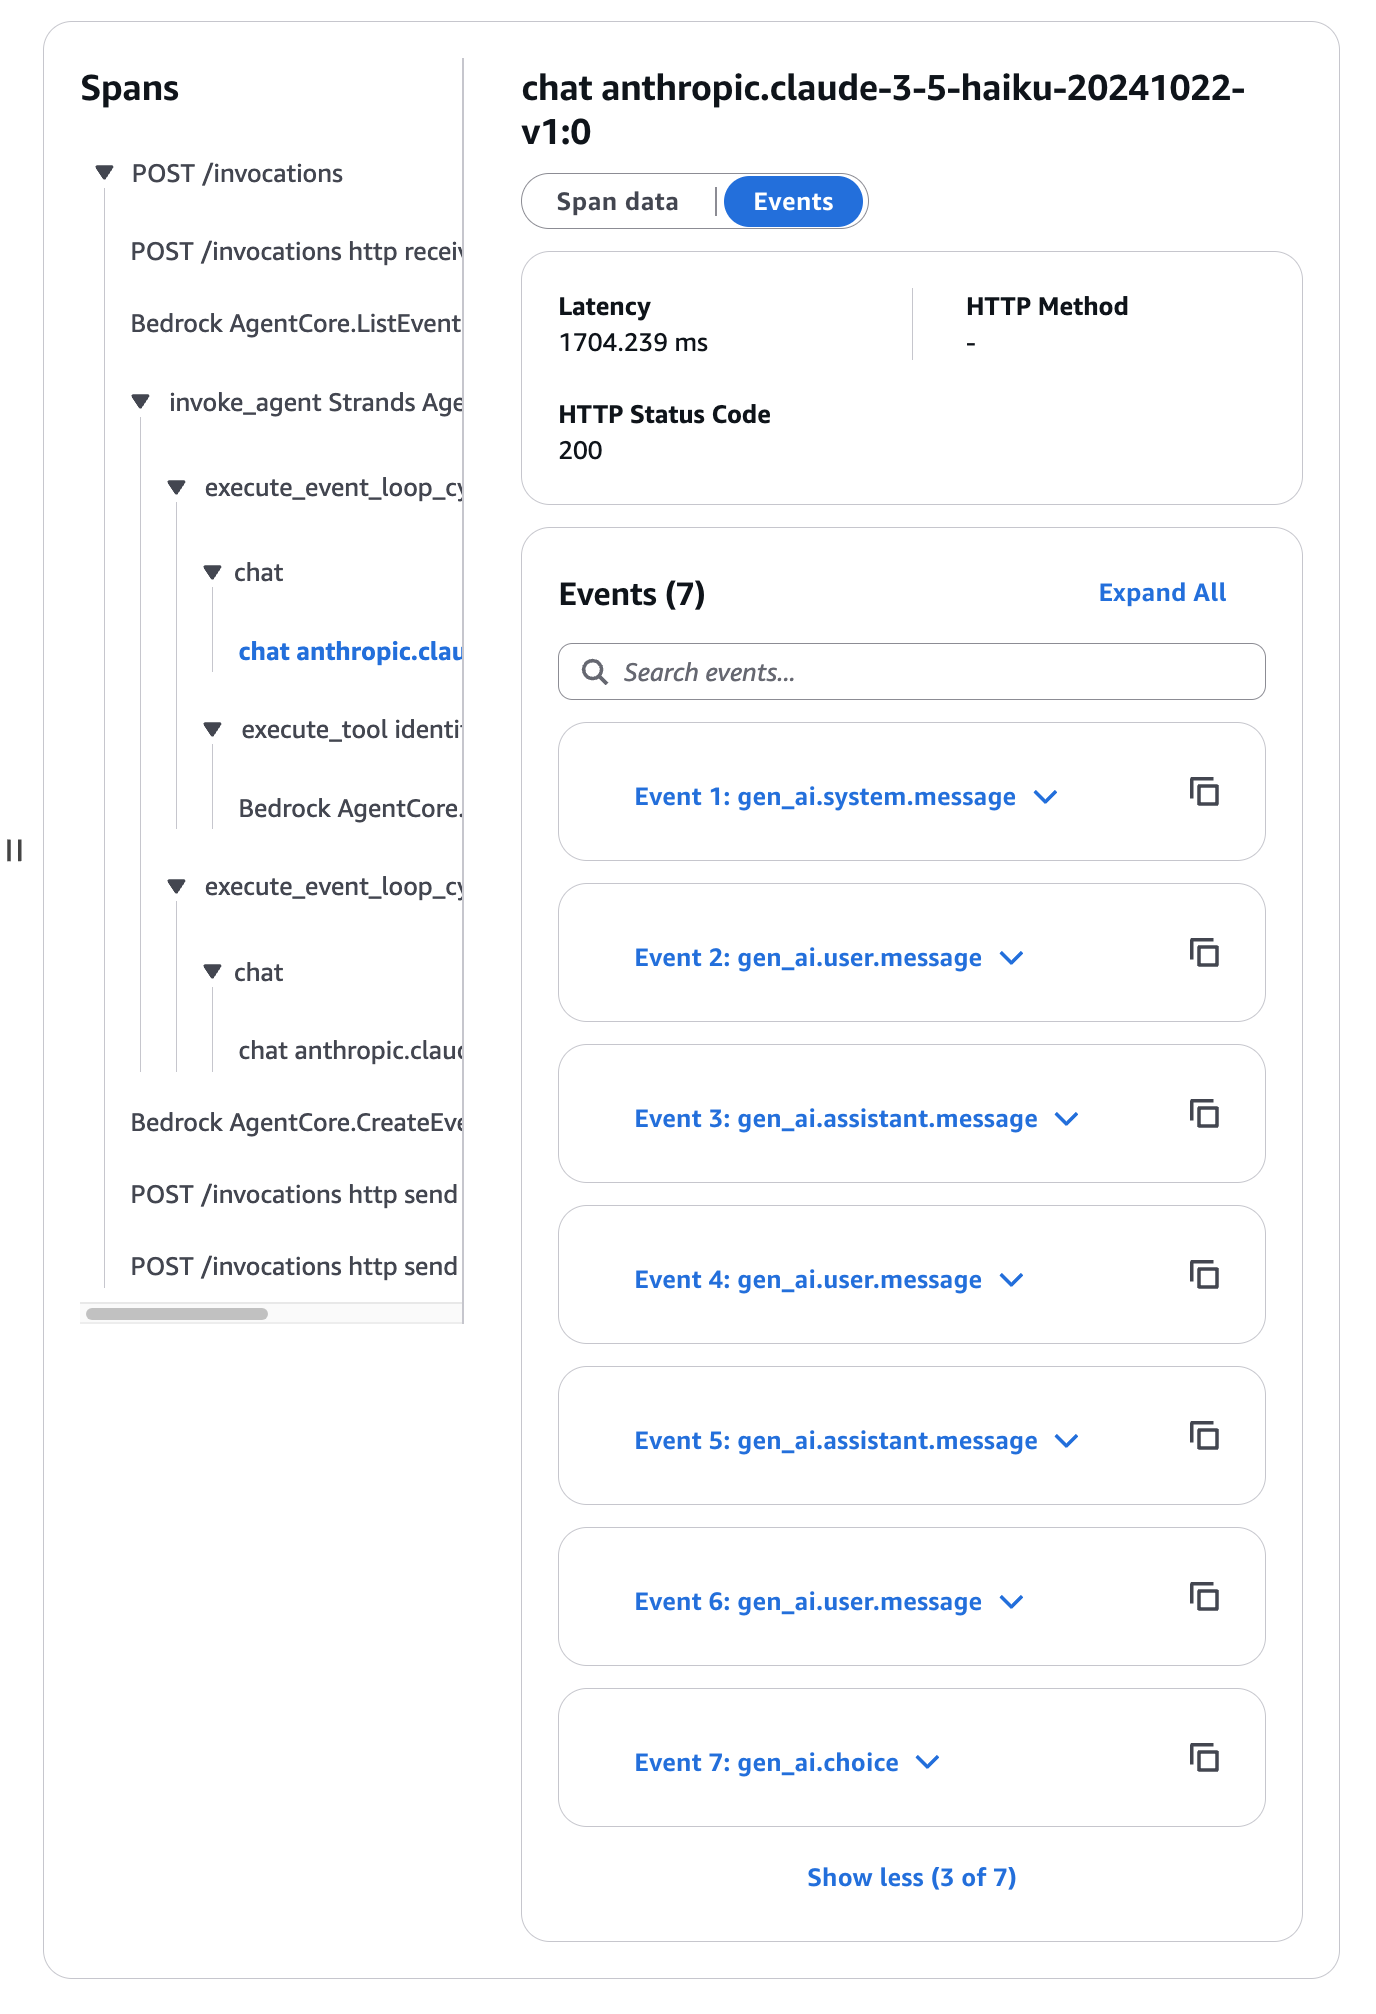
They're arranged in chronological order. You can see the logs by opening one of the Events.
Let's look at Event 1.
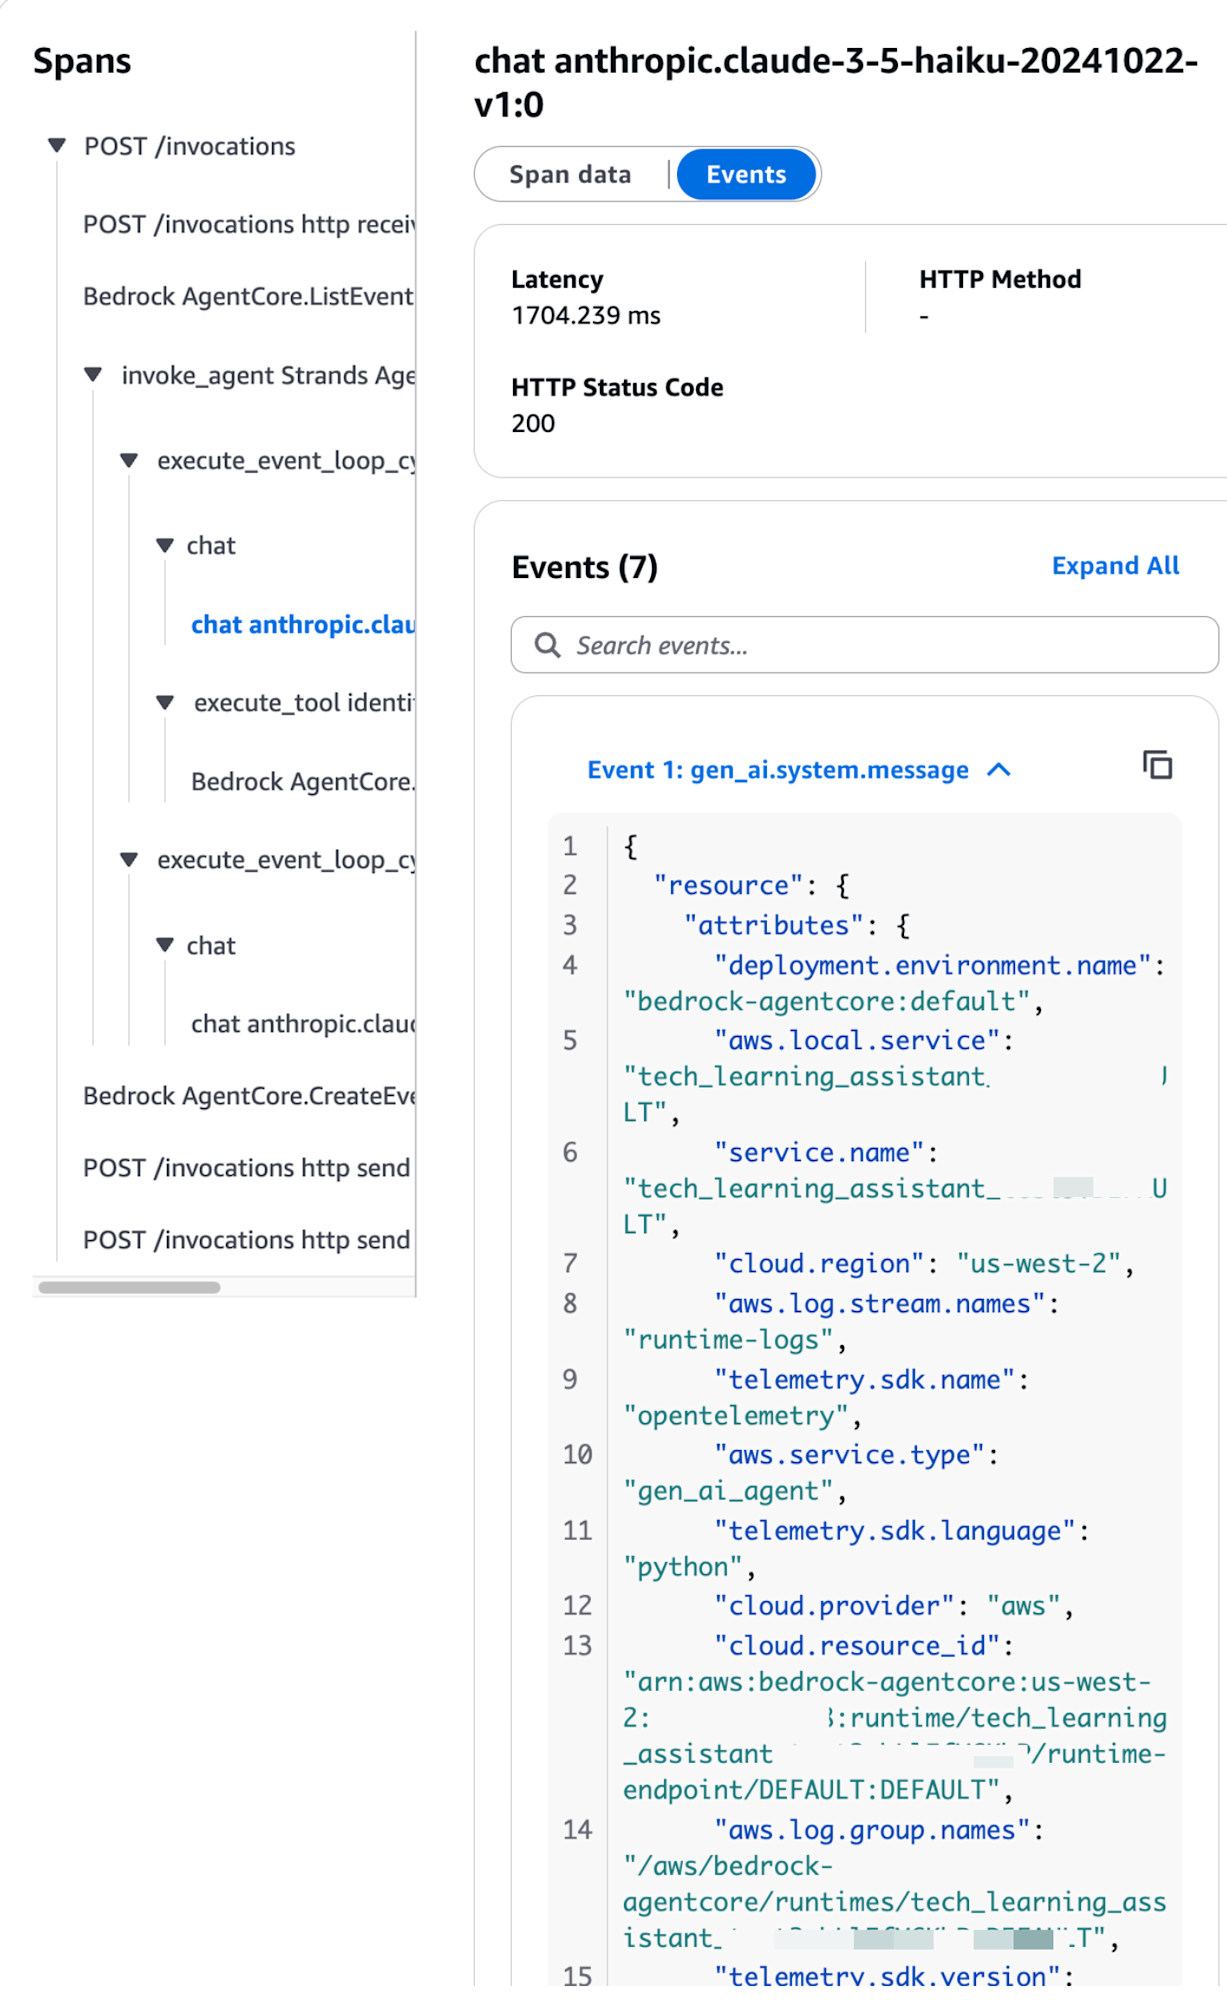
{
  "resource": {
    "attributes": {
      "deployment.environment.name": "bedrock-agentcore:default",
      "aws.local.service": "my-agent.DEFAULT",
      "service.name": "my-agent.DEFAULT",
      "cloud.region": "us-west-2",
      "aws.log.stream.names": "runtime-logs",
      "telemetry.sdk.name": "opentelemetry",
      "aws.service.type": "gen_ai_agent",
      "telemetry.sdk.language": "python",
      "cloud.provider": "aws",
      "cloud.resource_id": "arn:aws:bedrock-agentcore:us-west-2:xxxxxxxxxxxx:runtime/my-agent-xxxx/runtime-endpoint/DEFAULT:DEFAULT",
      "aws.log.group.names": "/aws/bedrock-agentcore/runtimes/my-agent-xxxx-DEFAULT",
      "telemetry.sdk.version": "1.33.1",
      "cloud.platform": "aws_bedrock_agentcore",
      "telemetry.auto.version": "0.11.0-aws"
    }
  },
  "scope": {
    "name": "opentelemetry.instrumentation.botocore.bedrock-runtime",
    "schemaUrl": "https://opentelemetry.io/schemas/1.30.0"
  },
  "timeUnixNano": 1756785750184271639,
  "observedTimeUnixNano": 1756785750184290707,
  "severityNumber": 9,
  "severityText": "",
  "body": {
    "content": [
      {
        "text": "You are an excellent technical learning assistant.\n            You support engineers in technical learning, record their understanding, and suggest effective learning methods.\n            \n            The following tools are available:\n            - analyze_learning_progress: Analyze learning progress (specific technical fields can be specified)\n            - identify_weak_areas: Identify weak areas\n            - suggest_review_topics: Suggest topics for review\n            - get_session_summary: Get a summary of the learning session\n            \n            Please note the following:\n            - Explain technical questions with specific examples\n            - Check understanding as you proceed\n            - When weak areas are identified, suggest learning methods accordingly\n            - Provide encouragement and constructive feedback\n            - Use tools as needed to understand the learning situation\n            "
      }
    ]
  },
  "attributes": {
    "event.name": "gen_ai.system.message",
    "gen_ai.system": "aws.bedrock"
  },
  "flags": 1,
  "traceId": "68b66c556c14723d4f7168399c6e91af",
  "spanId": "ad1a0ebc825b849e"
}
Event 1 was a log of the system prompt being conveyed to the AI.
Let's look at Event 2 as well.
{
  "resource": {
    "attributes": {
      "deployment.environment.name": "bedrock-agentcore:default",
      "aws.local.service": "my-agent.DEFAULT",
      "service.name": "my-agent.DEFAULT",
      "cloud.region": "us-west-2",
      "aws.log.stream.names": "runtime-logs",
      "telemetry.sdk.name": "opentelemetry",
      "aws.service.type": "gen_ai_agent",
      "telemetry.sdk.language": "python",
      "cloud.provider": "aws",
      "cloud.resource_id": "arn:aws:bedrock-agentcore:us-west-2:xxxxxxxxxxxx:runtime/my-agent-xxxx/runtime-endpoint/DEFAULT:DEFAULT",
      "aws.log.group.names": "/aws/bedrock-agentcore/runtimes/my-agent-xxxx-DEFAULT",
      "telemetry.sdk.version": "1.33.1",
      "cloud.platform": "aws_bedrock_agentcore",
      "telemetry.auto.version": "0.11.0-aws"
    }
  },
  "scope": {
    "name": "opentelemetry.instrumentation.botocore.bedrock-runtime",
    "schemaUrl": "https://opentelemetry.io/schemas/1.30.0"
  },
  "timeUnixNano": 1756779796818481971,
  "observedTimeUnixNano": 1756779796818488400,
  "severityNumber": 9,
  "severityText": "",
  "body": {
    "content": [
      {
        "text": "Tell me about S3 bucket security"
      }
    ]
  },
  "attributes": {
    "event.name": "gen_ai.user.message",
    "gen_ai.system": "aws.bedrock"
  },
  "flags": 1,
  "traceId": "68b6551285d1b1a532aa55b39fa596eb",
  "spanId": "a02614dcd6a51732"
}
It continues with the specific question. It's very clear. The history includes past question history as well.
Event 6 contained the content of the weakness analysis question.
{
  "resource": {
    "attributes": {
      "deployment.environment.name": "bedrock-agentcore:default",
      "aws.local.service": "my-agent.DEFAULT",
      "service.name": "my-agent.DEFAULT",
      "cloud.region": "us-west-2",
      "aws.log.stream.names": "runtime-logs",
      "telemetry.sdk.name": "opentelemetry",
      "aws.service.type": "gen_ai_agent",
      "telemetry.sdk.language": "python",
      "cloud.provider": "aws",
      "cloud.resource_id": "arn:aws:bedrock-agentcore:us-west-2:xxxxxxxxxxxx:runtime/my-agent-xxxx/runtime-endpoint/DEFAULT:DEFAULT",
      "aws.log.group.names": "/aws/bedrock-agentcore/runtimes/my-agent-xxxx-DEFAULT",
      "telemetry.sdk.version": "1.33.1",
      "cloud.platform": "aws_bedrock_agentcore",
      "telemetry.auto.version": "0.11.0-aws"
    }
  },
  "scope": {
    "name": "opentelemetry.instrumentation.botocore.bedrock-runtime",
    "schemaUrl": "https://opentelemetry.io/schemas/1.30.0"
  },
  "timeUnixNano": 1756779796818529300,
  "observedTimeUnixNano": 1756779796818534000,
  "severityNumber": 9,
  "severityText": "",
  "body": {
    "content": [
      {
        "text": "Analyze my weaknesses"
      }
    ]
  },
  "attributes": {
    "event.name": "gen_ai.user.message",
    "gen_ai.system": "aws.bedrock"
  },
  "flags": 1,
  "traceId": "68b6551285d1b1a532aa55b39fa596eb",
  "spanId": "a02614dcd6a51732"
}
Following this makes it easy to visually investigate what flow of behavior was performed.
Conclusion
I've looked at the dashboard, which is one of the features of Amazon Bedrock AgentCore Observability!
It's convenient that by enabling it with a button and deploying with built-in features, AI agents can be traced using the OpenTelemetry standard, allowing visual confirmation of AI agent behavior.
There are many viewpoints available, and I'd like to introduce how to use them in actual operations in the future!
I hope this article has been helpful to you. Thank you for reading to the end!!