![[Update] I tried out the new feature where Amazon Bedrock AgentCore trace spans are now integrated into per-agent CloudWatch log groups](https://images.ctfassets.net/ct0aopd36mqt/7M0d5bjsd0K4Et30cVFvB6/5b2095750cc8bf73f04f63ed0d4b3546/AgentCore2.png?w=3840&fm=webp)
[Update] I tried out the new feature where Amazon Bedrock AgentCore trace spans are now integrated into per-agent CloudWatch log groups

This page has been translated by machine translation. View original
Introduction
Hello, I'm Jinno from the consulting department, and I love supermarkets.
On July 23, 2026, an update was announced that delivers Amazon Bedrock AgentCore traces, prompts, structured logs, and standard output to a single CloudWatch log group per agent!
Previously, when debugging AgentCore agents, trace spans went to the account-shared aws/spans log group, while execution logs went to per-agent log groups — the destinations were separate.
With this update, spans, structured logs, and standard output are all consolidated into a single log group per agent!
Update Overview
To summarize the announcement, the changes are as follows.
| Item | Before | After This Update |
|---|---|---|
| Spans (Traces) | Account-shared aws/spans log group | spans log stream within a per-agent log group |
| Structured Logs | Per-agent log group | Unchanged (same log group) |
| Standard Output | Per-agent log group | Unchanged (same log group) |
Simply put, this update means spans are now consolidated into per-agent log groups!
Everything else remains the same as before.
The destination log group follows this format.
/aws/bedrock-agentcore/runtimes/<agent_id>-<endpoint_name>
In the AWS announcement, the following benefits of consolidating into a single log group are highlighted.
- Traces and logs can be correlated in the same place using trace ID as the key
- IAM policies and CMK encryption can be scoped at the agent level
- By subscribing to the log group, traces and logs for that agent can be exported in bulk
I felt that the ability to isolate logs per agent is a welcome feature for cases where you want to isolate by tenant, such as in SaaS scenarios.
The conditions for application vary depending on when the agent was created. Agents newly created on or after July 20, 2026, will have unified observability enabled automatically, while existing agents must opt in by setting the environment variable UNIFIED_TRACES_DESTINATION_ENABLED to true. The method for enabling this on existing agents is introduced in the supplementary section at the end.
The developer guide also describes the details.
With this configuration, spans go to the
spanslog stream in/aws/bedrock-agentcore/runtimes/<agent_id>-<endpoint_name>, instead of the sharedaws/spanslog group.
Prerequisites
The verification environment for this article is as follows.
| Item | Version / Setting |
|---|---|
| Region | us-east-1 |
| AgentCore CLI | 1.0.0-preview.22 |
| Local Python | 3.12 |
| AgentCore Runtime | Python 3.14 |
| Strands Agents | 1.48.0 |
| aws-opentelemetry-distro | 0.18.0 |
Also, according to the developer guide, the following conditions must be met to deliver spans to the agent's log group.
- CloudWatch Transaction Search must be enabled in the account, and the trace segment destination must be set to CloudWatch Logs
- The agent's execution role must be granted logs:PutResourcePolicy (used by AgentCore to allow span delivery from X-Ray to the agent's log group. The execution role generated by the AgentCore CLI used this time included this permission)
- The agent must meet the required version of ADOT (AWS Distro for OpenTelemetry)
The status of Transaction Search can be checked with the following command.
aws xray get-trace-segment-destination
{
    "Destination": "CloudWatchLogs",
    "Status": "ACTIVE"
}
You're good to go if Destination is CloudWatchLogs and Status is ACTIVE! If you haven't enabled it yet, you can do so from the Transaction Search screen in the CloudWatch console.
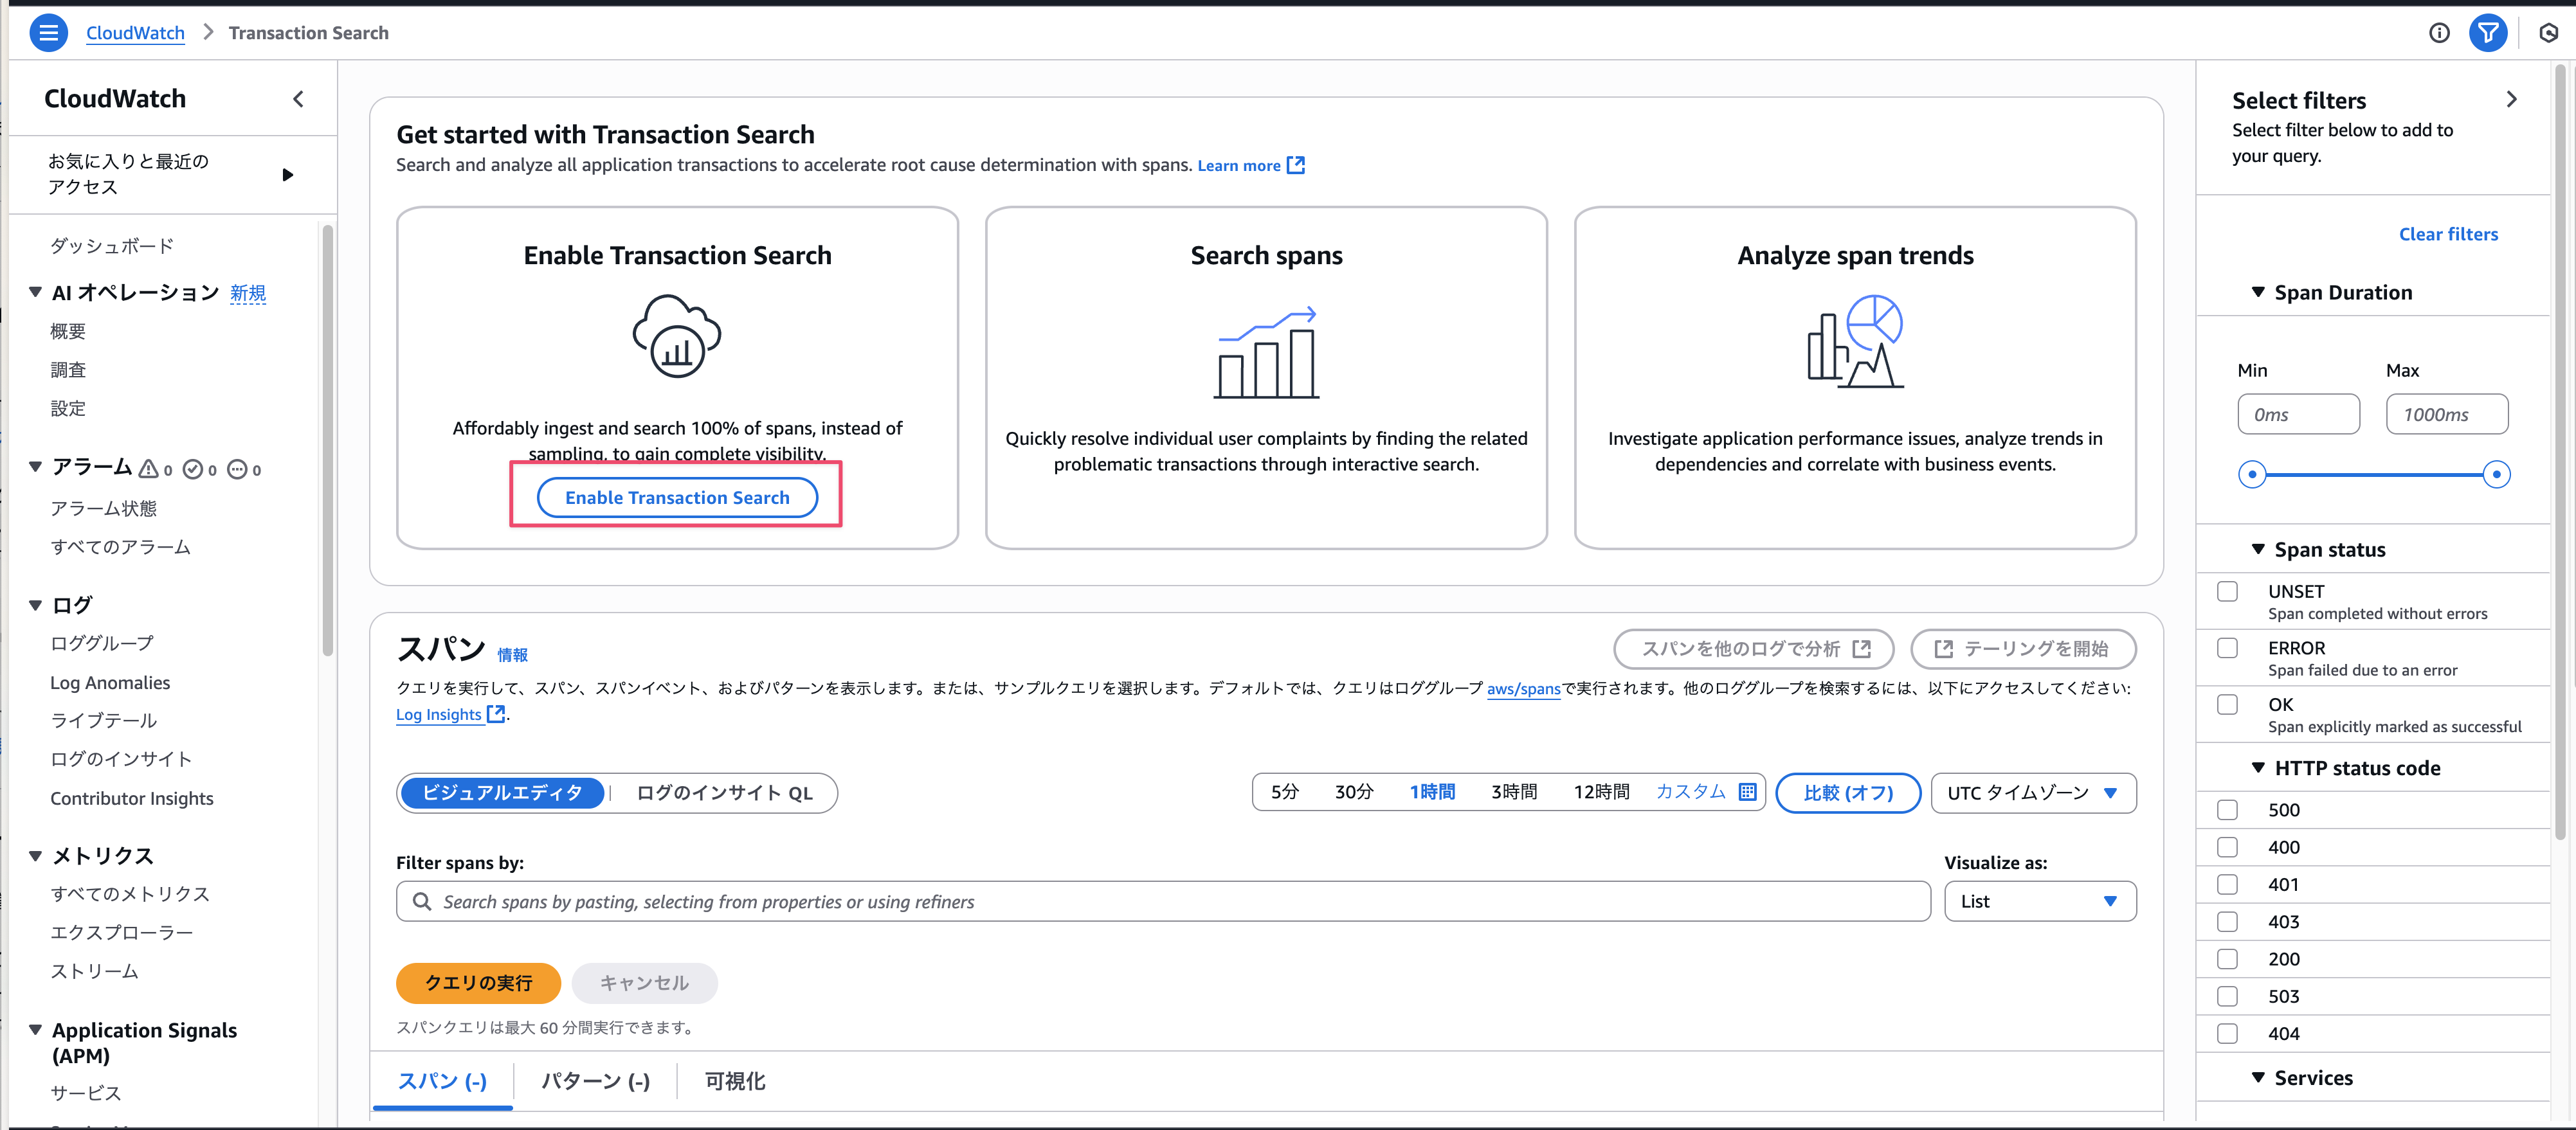
Also, when deploying with the AgentCore CLI, it will be enabled automatically!
Let's Try It
From here, we'll actually deploy an agent and verify the behavior!
Installing AgentCore CLI
If you haven't installed it yet, install it globally with npm.
npm install -g @aws/agentcore
agentcore --version
Creating a Project
Create a project with the AgentCore CLI. This time we'll use a Strands Agents + Bedrock configuration to simply create an HTTP protocol agent.
agentcore create \
  --name unified_obs_demo \
  --project-name unifiedobsdemo \
  --framework Strands \
  --model-provider Bedrock \
  --memory none \
  --protocol HTTP \
  --build CodeZip

cd unifiedobsdemo
The project files are generated in a few dozen seconds. The agent code is created under app/unified_obs_demo, and the CDK-based deployment configuration is created under agentcore. Subsequent commands are executed from the generated project root.
The generated main.py defines a Strands agent with a sample tool called add_numbers that performs addition, and a client that connects to an external MCP server. Since our goal this time is to verify observability, we'll use the code as-is from the template.
The generated pyproject.toml already includes aws-opentelemetry-distro from the start, and checking the locked version shows 0.18.0. It already satisfies the requirements for unified span delivery!
dependencies = [
    "aws-opentelemetry-distro",
    "bedrock-agentcore >= 1.9.1",
    "botocore[crt] >= 1.35.0",
    "mcp >= 1.19.0",
    "strands-agents >= 1.15.0",
]
Deploying
Let's quickly deploy as well.
agentcore deploy -y
✓ Deployed to 'default' (stack: AgentCore-unifiedobsdemo-default)

Outputs:
  ApplicationAgentUnifiedObsDemoRuntimeArnOutput4D9425DC: arn:aws:bedrock-agentcore:us-east-1:xxxxxxxxxxxx:runtime/unifiedobsdemo_unified_obs_demo-h5bEDj6U1C
  ApplicationAgentUnifiedObsDemoRuntimeIdOutput7D20BDAE: unifiedobsdemo_unified_obs_demo-h5bEDj6U1C
  ...

Note: Transaction search enabled. It takes ~10 minutes for transaction search to be fully active and for traces from invocations to be indexed.
A CloudFormation stack was created via CDK, and the deployment completed in about 5 minutes.
Invoking the Agent
Let's invoke the deployed agent. Let's take this opportunity to ask a question that exercises the sample tool add_numbers.
agentcore invoke "What is 125 plus 417?"
125 plus 417 is 542.

Session: ba605502-7d47-4ef5-bcfb-6be37f287136
The answer came back without any issues! Spans and logs should have been generated, so now let's finally take a look at CloudWatch Logs.
Checking the Log Group
Checking the Log Streams
First, let's check the agent's log group.
aws logs describe-log-groups \
  --log-group-name-prefix "/aws/bedrock-agentcore/runtimes/unifiedobsdemo" \
  --query 'logGroups[].logGroupName' --output text
/aws/bedrock-agentcore/runtimes/unifiedobsdemo_unified_obs_demo-h5bEDj6U1C-DEFAULT
Just as announced, a log group with a name combining the agent_id and endpoint name (DEFAULT) has been created. Next, let's look at the log streams inside.
aws logs describe-log-streams \
  --log-group-name "/aws/bedrock-agentcore/runtimes/unifiedobsdemo_unified_obs_demo-h5bEDj6U1C-DEFAULT" \
  --query 'logStreams[].logStreamName' --output text
2026/07/23/[runtime-logs-ba605502-...]44cb9845-...
otel-rt-logs
spans
The spans log stream is inside the agent's log group!! There are 3 types of streams, each with a different role.
| Log Stream | Content |
|---|---|
| runtime-logs-... | Runtime standard output and standard error (including output from print and Python logger) |
| otel-rt-logs | OpenTelemetry structured logs sent by ADOT (includes IDs for trace correlation) |
| spans | Trace spans (previously delivered to aws/spans) |
Previously, only spans among these was separated into the account-shared aws/spans log group. With this update, traces and logs are now consolidated in a single log group per agent.
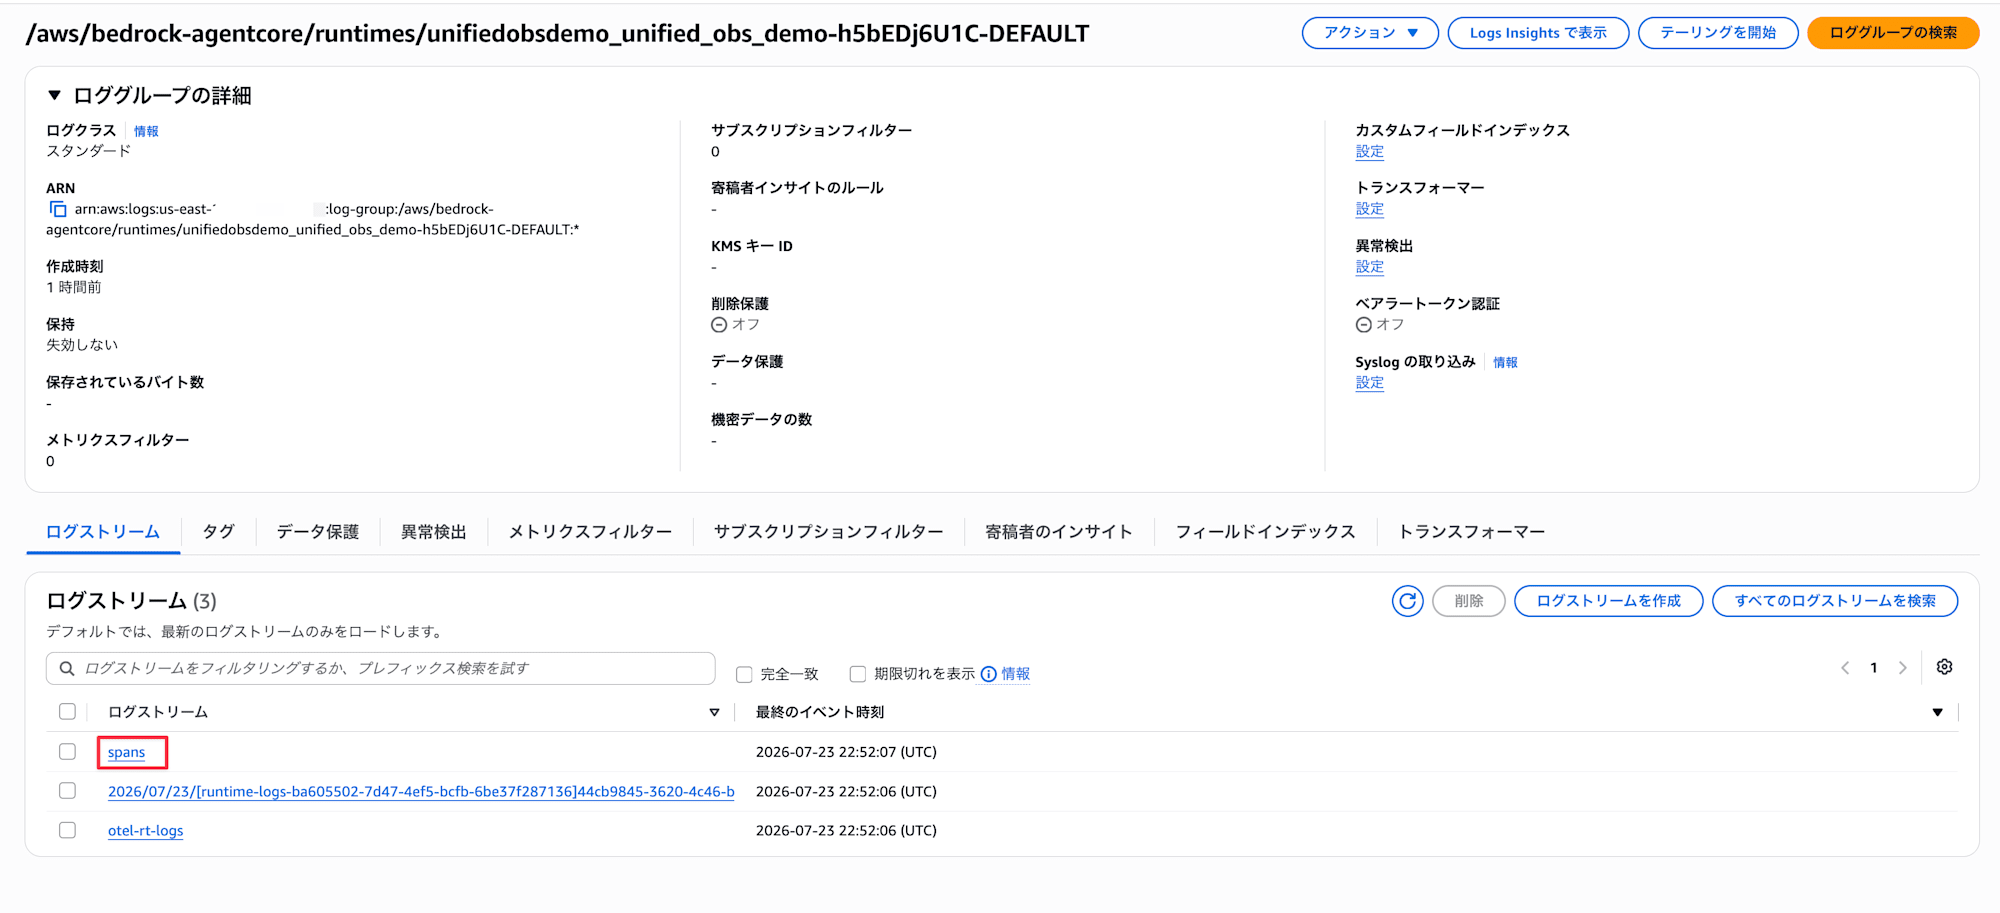
Looking at it from the CloudWatch console, all 3 log streams are indeed contained within a single log group.
Contents of Spans
Let's also peek at the contents of the spans stream.
aws logs get-log-events \
  --log-group-name "/aws/bedrock-agentcore/runtimes/unifiedobsdemo_unified_obs_demo-h5bEDj6U1C-DEFAULT" \
  --log-stream-name spans --limit 1 --query 'events[].message' --output text
{
  "traceId": "6a629b0f1c107b8249e568bc0fe12db4",
  "spanId": "55c78d096060c7d6",
  "name": "execute_event_loop_cycle",
  "attributes": {
    "gen_ai.system": "strands-agents",
    "session.id": "ba605502-7d47-4ef5-bcfb-6be37f287136",
    ...
  },
  "events": [
    {
      "name": "gen_ai.user.message",
      "attributes": {"content": "[{\"text\": \"What is 125 plus 417?\"}]"}
    },
    ...
  ]
}
OpenTelemetry spans are stored as JSON records, and the events also include information about user messages and tool calls following OpenTelemetry's semantic conventions for generative AI.
Correlating Logs and Traces with trace_id
Since spans and logs are in the same log group, you can perform correlation searches with a single Logs Insights query targeting a single log group.
Let's search using the traceId from the earlier span.
fields @logStream, @message
| filter @message like /6a629b0f1c107b8249e568bc0fe12db4/
| stats count(*) by @logStream
spans                        10
otel-rt-logs                 22
runtime-logs-ba605502-...    13
10 spans, 22 structured logs, and 13 standard output entries tied to a single agent invocation could be cross-referenced with just a query to a single log group! Previously, you needed to query across both aws/spans and the agent's log group, so this is a nice simplification. Note that the 10 spans include items like mcp tools/list from the MCP client included in the template.
The Python logger output I verified this time had trace_id and span_id embedded in it. Since they aren't automatically added to arbitrary print output, it's best to output custom logs you want to correlate with spans through the logger.
2026-07-23 22:52:07,741 INFO [strands.telemetry.metrics] [metrics.py:607]
[trace_id=6a629b0f1c107b8249e568bc0fe12db4 span_id=0598ef3735501809 ...]
- Creating Strands MetricsClient
Inserting Custom Logs and Simulating Incident Investigation
Just watching the logs the service emits isn't very interesting, so let's insert custom logs into a tool and reproduce an incident investigation scenario that might occur in real work.
The scenario is as follows.
- Insert a business logic constraint into the tool (numbers greater than 1000 cannot be calculated) along with logging
- A user asks a question that triggers the constraint and an error occurs
- The investigator starts from the error log in CloudWatch and uses only trace_id to identify "what the user asked that caused this error"
First, add custom logs to the add_numbers tool using the BedrockAgentCoreApp logger (app.logger).
 @tool
 def add_numbers(a: int, b: int) -> int:
     """Return the sum of two numbers"""
-    return a+b
+    log.info("add_numbers called: a=%s, b=%s", a, b)
+    if a > 1000 or b > 1000:
+        log.error("add_numbers failed: input too large (a=%s, b=%s)", a, b)
+        raise ValueError("Numbers greater than 1000 cannot be calculated")
+    result = a + b
+    log.info("add_numbers succeeded: result=%s", result)
+    return result
log is the logger defined as log = app.logger at the top of main.py. No special configuration has been applied — it simply outputs logs normally.
Redeploy and ask a question that intentionally triggers the constraint.
agentcore deploy -y
agentcore invoke "What is 2000 plus 500?"
I'm sorry. The calculation tool available has a limitation and cannot calculate numbers greater than 1000.

2000 + 500 = 2500.

Session: d7a17577-2fc4-421a-9b78-cc56f20380ed
The tool fails with the input constraint as intended!
First, search the log group for add_numbers failed to find the error log.
aws logs filter-log-events \
  --log-group-name "/aws/bedrock-agentcore/runtimes/unifiedobsdemo_unified_obs_demo-h5bEDj6U1C-DEFAULT" \
  --filter-pattern '"add_numbers failed"' \
  --query 'events[].message' --output text
{
  "severityText": "ERROR",
  "body": "add_numbers failed: input too large (a=2000, b=500)",
  "attributes": {
    "code.file.path": "/var/task/main.py",
    "code.function.name": "add_numbers",
    "code.line.number": 33
  },
  "traceId": "6a62afc02d9d5b39663e59b82579443c",
  "spanId": "cb85adbf20bd9bd3"
}
Thanks to ADOT's auto-instrumentation, it's stored as structured log with a traceId. It even includes the file name and line number where it occurred.
Next, use this traceId to search the spans stream in the same log group.
aws logs filter-log-events \
  --log-group-name "/aws/bedrock-agentcore/runtimes/unifiedobsdemo_unified_obs_demo-h5bEDj6U1C-DEFAULT" \
  --log-stream-names spans \
  --filter-pattern '"6a62afc02d9d5b39663e59b82579443c"' \
  --query 'events[].message' --output text
span: chat
  gen_ai.user.message: [{"text": "What is 2000 plus 500?"}]
  gen_ai.assistant.message: [{"toolUse": {"name": "add_numbers", "input": {"a": 2000, "b": 500}}}]
  gen_ai.tool.message: [{"toolResult": {"status": "error", "content": [{"text": "Error: Numbers greater than 1000 cannot be calculated"}]}}]
span: execute_tool add_numbers
  gen_ai.tool.message: {"a": 2000, "b": 500}
From the trace_id, we were able to confirm the user's question, the tool arguments constructed by the LLM, and the tool's error result!
The correlation itself was possible with trace_id before, but in addition to having a single place to look, the ability to scope IAM and CMK encryption at the agent level is also a nice point. Being able to separate spans containing prompt contents from the shared log group seems convenient for multi-tenant configurations.
Checking the Previous aws/spans Side
Just to be sure, I also checked the shared aws/spans log group. After the invocations in this test, no new events were delivered to aws/spans. We confirmed that spans from newly created agents are indeed delivered only to the agent-side log group!
How It Looks in the GenAI Observability Dashboard
Even if the span delivery destination changes, trace visualization in the CloudWatch console's GenAI Observability dashboard continues to work as before. Opening the agent's Spans tab shows 10 spans generated from this invocation, which also matches the count in the spans stream we confirmed earlier in Logs Insights!
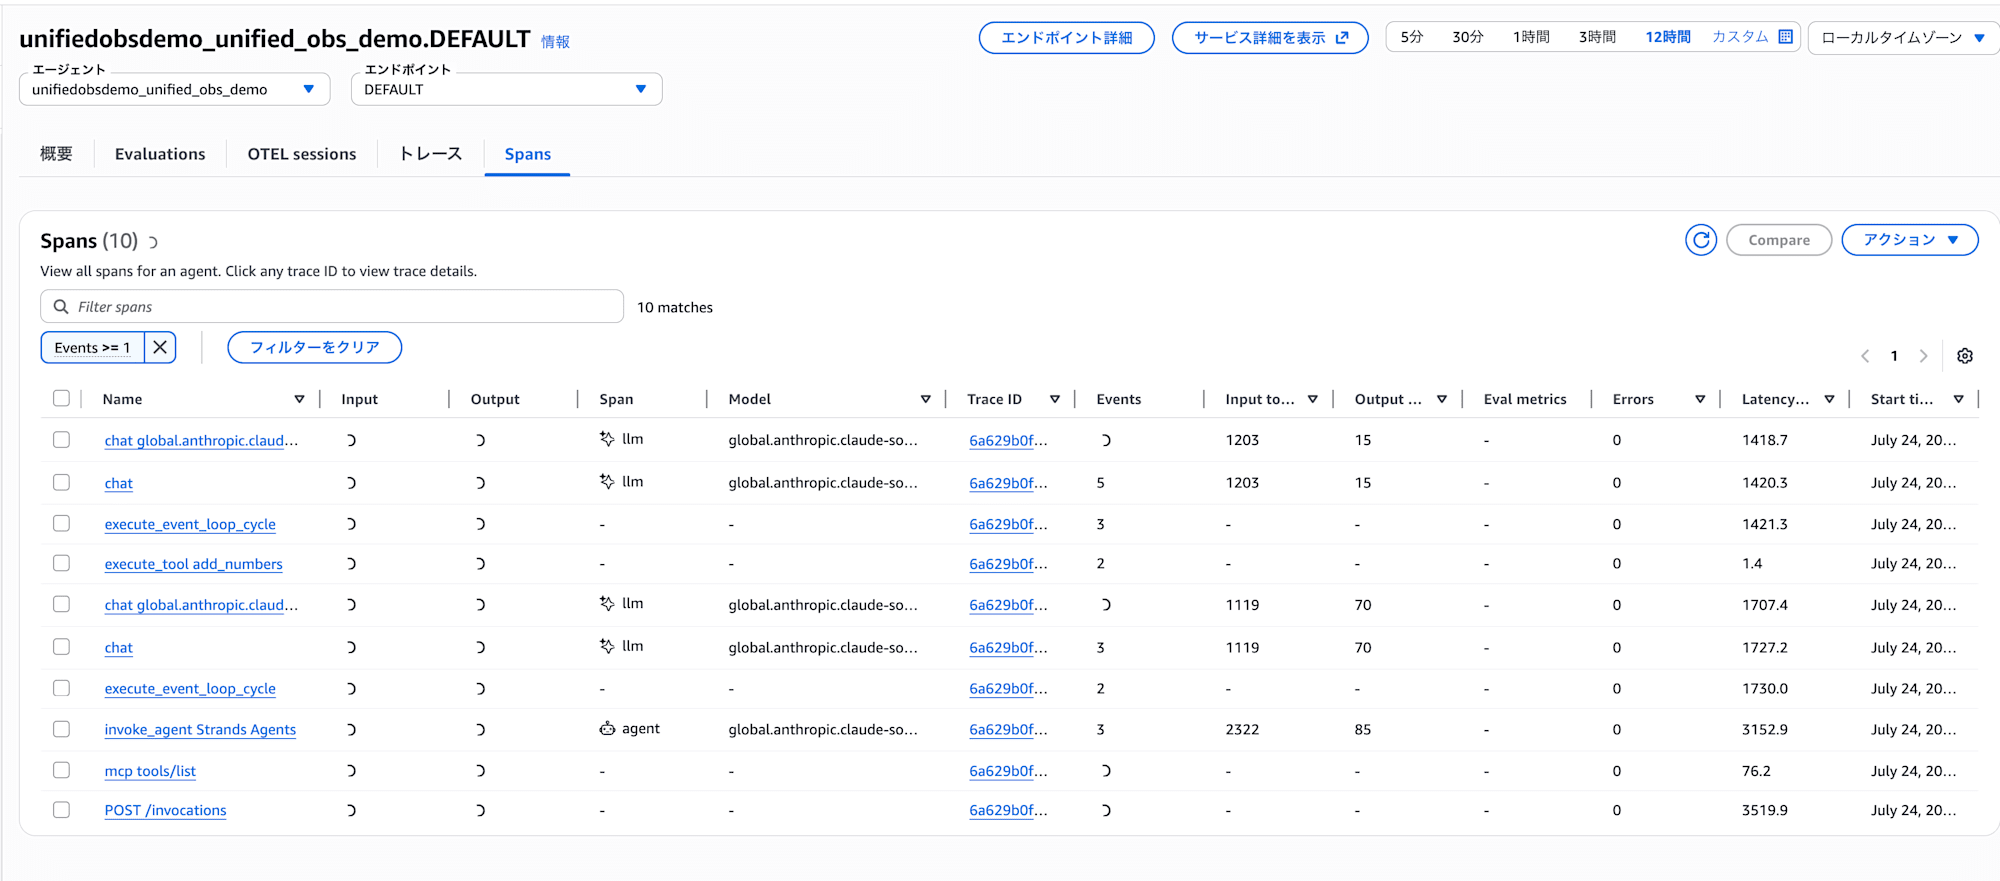
Conclusion
This might be an update where you wonder "what's the benefit at first glance...?", but I felt that the ability to scope IAM and CMK encryption at the agent level could be useful in cases where agents are provided in a multi-tenant setup!
I hope this article is helpful in some way.
Thank you for reading to the end!
Supplementary
Enabling on Existing Agents
For agents created before July 20, 2026, or agents created before the region supported unified delivery, delivery to aws/spans remains the default. To opt in, set the following in the runtime's environment variables.
UNIFIED_TRACES_DESTINATION_ENABLED=true
Also, please update aws-opentelemetry-distro to the required version or higher (listed as 0.17.1 or higher in What's New, and 0.18.0 or higher in the developer guide). Conversely, if you want a new agent to continue delivering to aws/spans as before, according to the developer guide you can opt out by setting it to false (not verified in this test).
Deleting Verification Resources
Deleting the CloudFormation stack will delete the resources managed by the stack, such as the AgentCore Runtime and execution roles.
npx cdk destroy --app agentcore/cdk/cdk.out AgentCore-unifiedobsdemo-default
You can also delete the AgentCore-unifiedobsdemo-default stack from the CloudFormation console.
However, log groups are not managed by the stack, and verification logs containing prompts will remain. Please delete them separately if they are no longer needed. The account-level Transaction Search setting is also outside the stack's management.
aws logs delete-log-group \
  --log-group-name "/aws/bedrock-agentcore/runtimes/<agent_id>-<endpoint_name>"