
CloudFront VPC Origin Outage (2026-07-16): Confirming from logs that approximately 30-second timeout waits were occurring

This page has been translated by machine translation. View original
Introduction
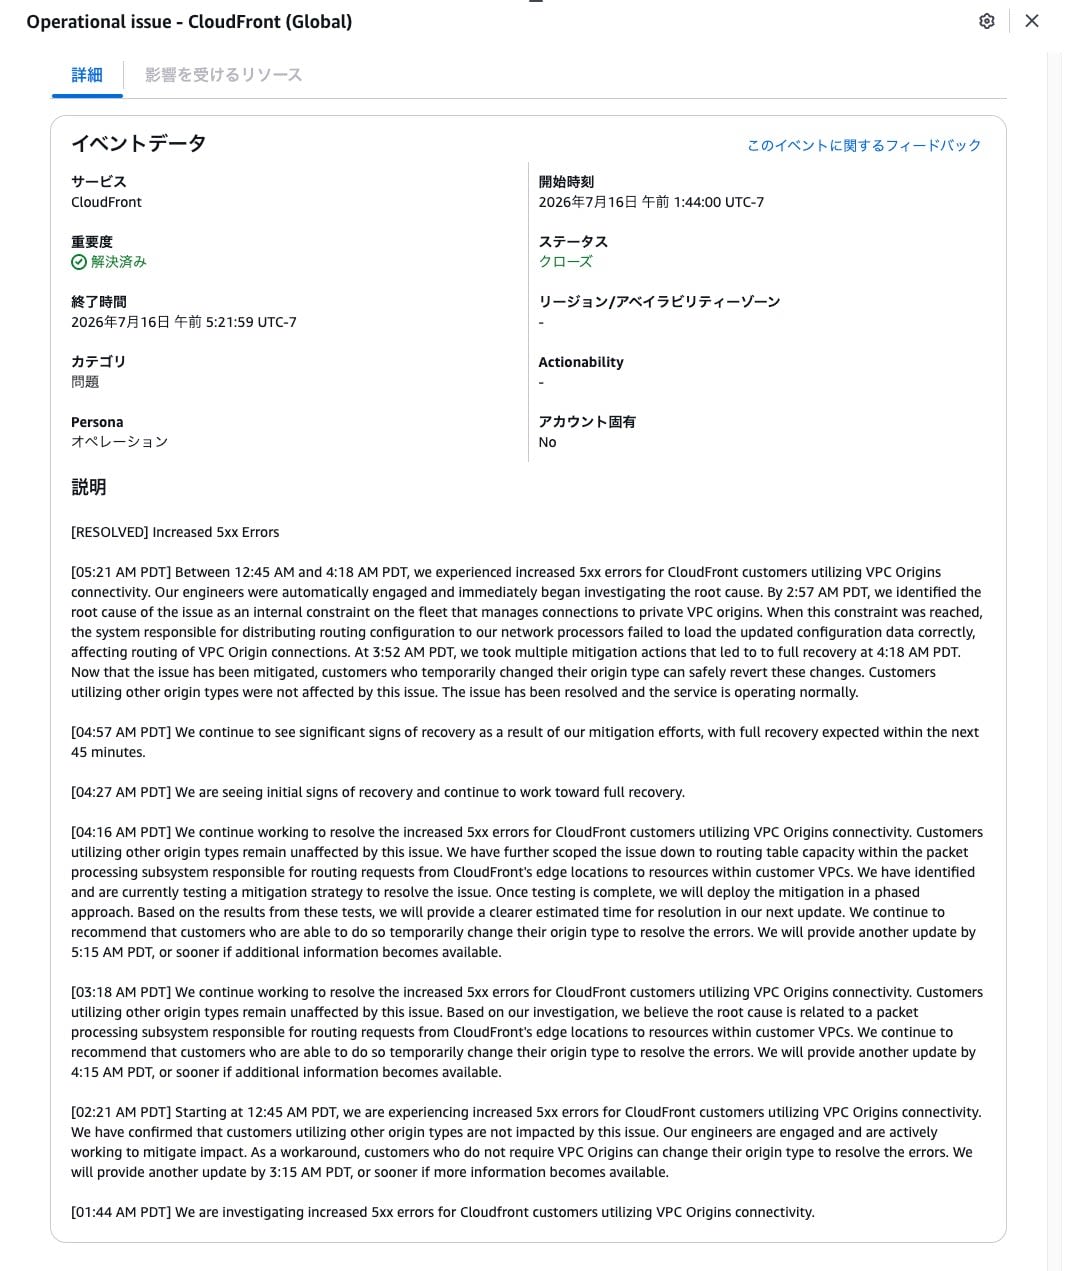
An outage occurred with CloudFront VPC Origins on 2026-07-16 (JST 16:45–20:18). The AWS Service Health Dashboard's final report described the root cause as follows:
We identified the root cause of the issue as an internal constraint on the fleet that manages connections to private VPC origins. When this constraint was reached, the system responsible for distributing routing configuration to our network processors failed to load the updated configuration data correctly, affecting routing of VPC Origin connections.
The cause was that the fleet managing private connections to VPC Origins reached an internal constraint, causing the routing configuration distribution to network processors to fail.
The interim countermeasure taken on the day of the outage (building a bypass configuration using Inter-Region VPC Peering) is introduced in the following article.
In this article, we analyzed the impact of the outage using CloudFront access logs and ALB access logs on either side of the VPC Origin. The target system is configured with two routes using a CloudFront Origin Failover Group:
- primary: CloudFront → VPC Origin → Internal ALB (3AZ) → ECS
- secondary: CloudFront → Cloudflare Workers (for degraded operation)
Verification Details
Verification Environment
| Item | Value |
|---|---|
| Target | dev.classmethod.jp (DevelopersIO) |
| CloudFront Distribution | E2XXXXXXXXXXXX |
| VPC Origin | vo_XXXXXXXXXXXXXXXXXXXXXXXX → Internal ALB (3AZ) |
| Failover Group | primary = VPC Origin, secondary = Cloudflare Workers (for degraded operation) |
| ALB Nodes | 3AZ (AZ-a, AZ-c, AZ-d) |
| ConnectionTimeout (at time of outage) | 10 seconds |
| ConnectionAttempts (at time of outage) | 3 times |
| OriginReadTimeout (at time of outage) | 30 seconds |
Outage Occurrence as Seen from ALB Logs
Before the outage (07:30–07:53), the ALB was processing normally across all AZs, with HTTP responses being mostly 200/308/404 (only 2 instances of 500) and an average response time of 0.097–0.102 seconds.
The following shows request counts per second from 07:53:30 to 07:53:55 (UTC).
| Time (UTC) | AZ-a | AZ-c | AZ-d | Total |
|---|---|---|---|---|
| 07:53:30 | 5 | 2 | 4 | 11 |
| 07:53:31 | 0 | 4 | 1 | 5 |
| 07:53:32 | 2 | 2 | 2 | 6 |
| 07:53:33 | 2 | 1 | 2 | 5 |
| 07:53:34 | 1 | 1 | 1 | 3 |
| 07:53:35 | 1 | 2 | 6 | 9 |
| 07:53:36 | 5 | 3 | 0 | 8 |
| 07:53:37 | 2 | 4 | 2 | 8 |
| 07:53:38 | 3 | 0 | 2 | 5 |
| 07:53:39 | 0 | 2 | 1 | 3 |
| 07:53:40 | 3 | 2 | 4 | 9 |
| 07:53:41 | 2 | 3 | 2 | 7 |
| 07:53:42 | 3 | 1 | 0 | 4 |
| 07:53:43 | 0 | 2 | 0 | 2 |
| 07:53:44 | 3 | 2 | 4 | 9 |
| 07:53:45 | 1 | 1 | 3 | 5 |
| 07:53:46 | 1 | 0 | 1 | 2 |
| 07:53:47 | 0 | 1 | 0 | 1 |
| 07:53:48 | 0 | 0 | 0 | 0 |
| 07:53:49 | 0 | 0 | 1 | 1 |
| 07:53:50 | 1 | 0 | 0 | 1 |
| 07:53:51 | 0 | 0 | 0 | 0 |
| 07:53:52 | 0 | 0 | 0 | 0 |
| 07:53:53 | 0 | 0 | 0 | 0 |
| 07:53:54 | 0 | 0 | 0 | 0 |
| 07:53:55 | 0 | 0 | 0 | 0 |
The last requests per AZ were AZ-c: 07:53:47, AZ-d: 07:53:49, and AZ-a: 07:53:50, with requests ceasing in all AZs in succession within approximately 3 seconds. This shows that requests stopped arriving simultaneously across all AZs, not as a failure in a specific AZ.
There were no signs of failure on the ALB/ECS side, indicating that the failure occurred at a stage before reaching the ALB. This observation is consistent with the impact on VPC Origin connections reported by AWS.
Reality of Timeouts as Seen from CloudFront Logs
The following is time-series data aggregated per minute from CloudFront access logs (29,251 origin_request entries) around the time of the outage. The ok column shows the number of requests with sc_status of 2xx/3xx, and the err column shows the number of requests with sc_status of 0 or 5xx. Since 4xx is not included in either, some rows may not have ok+err equal to total.
| Time (UTC) | total | ok | err | ok rate | p95_t (sec) | Notes |
|---|---|---|---|---|---|---|
| 07:50 | 367 | 367 | 0 | 100.0% | 1.315 | Normal |
| 07:51 | 404 | 404 | 0 | 100.0% | 1.397 | Normal |
| 07:52 | 385 | 381 | 0 | 99.0% | 1.452 | Normal |
| 07:53 | 310 | 271 | 39 | 87.4% | 4.765 | First error occurred (07:53:45) |
| 07:54 | 260 | 60 | 200 | 23.1% | 30.624 | Outage intensifies |
| 07:55 | 307 | 57 | 250 | 18.6% | 30.382 | Outage continues |
| 07:56 | 332 | 87 | 245 | 26.2% | 30.313 | Outage continues |
| 07:57 | 376 | 98 | 278 | 26.1% | 30.363 | Outage continues |
| 07:58 | 339 | 78 | 261 | 23.0% | 30.328 | Outage continues |
The first error (sc_status=0) occurred at 07:53:45, and from 07:54 onward, the p95 response time settled at approximately 30.3 seconds. This value is consistent with the approximately 30 seconds corresponding to the configured timeouts (OriginReadTimeout 30 seconds, or ConnectionTimeout 10 seconds × 3 attempts), indicating a state where communication with the VPC Origin was stalling at some stage and reaching a timeout (which was dominant will be discussed later).
Full table (07:30–08:29 UTC)
| Time (UTC) | total | ok | err | ok rate | avg_t | p95_t |
|---|---|---|---|---|---|---|
| 07:30 | 355 | 355 | 0 | 100.0% | 0.493 | 1.285 |
| 07:31 | 409 | 405 | 0 | 99.0% | 0.516 | 1.188 |
| 07:32 | 314 | 314 | 0 | 100.0% | 0.471 | 1.243 |
| 07:33 | 328 | 328 | 0 | 100.0% | 0.374 | 1.088 |
| 07:34 | 339 | 339 | 0 | 100.0% | 0.454 | 1.201 |
| 07:35 | 340 | 340 | 0 | 100.0% | 0.474 | 1.207 |
| 07:36 | 489 | 489 | 0 | 100.0% | 0.535 | 1.264 |
| 07:37 | 384 | 384 | 0 | 100.0% | 0.535 | 1.231 |
| 07:38 | 339 | 339 | 0 | 100.0% | 0.421 | 1.165 |
| 07:39 | 368 | 368 | 0 | 100.0% | 0.430 | 1.182 |
| 07:40 | 344 | 340 | 0 | 98.8% | 0.438 | 1.128 |
| 07:41 | 375 | 375 | 0 | 100.0% | 0.460 | 1.309 |
| 07:42 | 347 | 347 | 0 | 100.0% | 1.132 | 1.345 |
| 07:43 | 382 | 378 | 0 | 99.0% | 0.438 | 1.269 |
| 07:44 | 290 | 290 | 0 | 100.0% | 0.446 | 1.242 |
| 07:45 | 380 | 379 | 1 | 99.7% | 0.475 | 1.187 |
| 07:46 | 464 | 464 | 0 | 100.0% | 0.503 | 1.089 |
| 07:47 | 305 | 305 | 0 | 100.0% | 0.461 | 1.165 |
| 07:48 | 310 | 309 | 1 | 99.7% | 0.467 | 1.189 |
| 07:49 | 322 | 322 | 0 | 100.0% | 0.486 | 1.420 |
| 07:50 | 367 | 367 | 0 | 100.0% | 0.469 | 1.315 |
| 07:51 | 404 | 404 | 0 | 100.0% | 0.513 | 1.397 |
| 07:52 | 385 | 381 | 0 | 99.0% | 0.509 | 1.452 |
| 07:53 | 310 | 271 | 39 | 87.4% | 1.006 | 4.765 |
| 07:54 | 260 | 60 | 200 | 23.1% | 11.771 | 30.624 |
| 07:55 | 307 | 57 | 250 | 18.6% | 11.022 | 30.382 |
| 07:56 | 332 | 87 | 245 | 26.2% | 14.046 | 30.313 |
| 07:57 | 376 | 98 | 278 | 26.1% | 14.017 | 30.363 |
| 07:58 | 339 | 78 | 261 | 23.0% | 12.366 | 30.328 |
| 07:59 | 368 | 69 | 299 | 18.8% | 10.746 | 30.303 |
| 08:00 | 377 | 102 | 275 | 27.1% | 13.573 | 30.513 |
| 08:01 | 531 | 82 | 449 | 15.4% | 11.630 | 30.316 |
| 08:02 | 553 | 76 | 477 | 13.7% | 11.451 | 30.305 |
| 08:03 | 453 | 90 | 359 | 19.9% | 12.650 | 30.317 |
| 08:04 | 526 | 83 | 443 | 15.8% | 11.058 | 30.299 |
| 08:05 | 651 | 105 | 546 | 16.1% | 11.660 | 30.299 |
| 08:06 | 640 | 116 | 524 | 18.1% | 12.257 | 30.297 |
| 08:07 | 739 | 94 | 645 | 12.7% | 10.724 | 30.288 |
| 08:08 | 535 | 97 | 438 | 18.1% | 11.361 | 30.313 |
| 08:09 | 608 | 98 | 510 | 16.1% | 11.294 | 30.285 |
| 08:10 | 793 | 99 | 694 | 12.5% | 11.047 | 30.287 |
| 08:11 | 785 | 113 | 672 | 14.4% | 11.355 | 30.288 |
| 08:12 | 804 | 107 | 697 | 13.3% | 10.195 | 30.294 |
| 08:13 | 663 | 105 | 558 | 15.8% | 10.845 | 30.294 |
| 08:14 | 405 | 79 | 326 | 19.5% | 11.618 | 30.301 |
| 08:15 | 657 | 89 | 568 | 13.5% | 10.381 | 30.285 |
| 08:16 | 670 | 111 | 559 | 16.6% | 11.818 | 30.299 |
| 08:17 | 784 | 96 | 688 | 12.2% | 10.840 | 30.282 |
| 08:18 | 752 | 97 | 655 | 12.9% | 10.990 | 30.262 |
| 08:19 | 823 | 103 | 716 | 12.5% | 11.632 | 30.278 |
| 08:20 | 754 | 82 | 672 | 10.9% | 10.117 | 30.214 |
| 08:21 | 719 | 96 | 619 | 13.4% | 10.930 | 30.300 |
| 08:22 | 700 | 100 | 600 | 14.3% | 10.379 | 30.300 |
| 08:23 | 430 | 81 | 349 | 18.8% | 11.878 | 30.312 |
| 08:24 | 450 | 79 | 371 | 17.6% | 11.145 | 30.313 |
| 08:25 | 651 | 102 | 549 | 15.7% | 11.279 | 30.307 |
| 08:26 | 678 | 104 | 570 | 15.3% | 11.179 | 30.297 |
| 08:27 | 545 | 85 | 460 | 15.6% | 10.498 | 30.298 |
| 08:28 | 461 | 91 | 370 | 19.7% | 12.365 | 30.362 |
| 08:29 | 482 | 103 | 379 | 21.4% | 12.060 | 30.361 |
The breakdown of errors is as follows.
| Error Type | Count | Percentage | Meaning |
|---|---|---|---|
| ClientCommError | 15,672 | 89.3% | Classification recorded as communication interruption between CloudFront and the viewer |
| ClientHungUpRequest | 1,872 | 10.7% | Viewer disconnected before response was complete |
ClientHungUpRequest (1,872 cases) are cases where the viewer disconnected before the response was complete. The majority of the remainder are ClientCommError (classification recorded as communication interruption between CloudFront and the viewer), and based on the correlation with the outage period, these are estimated to have occurred against a backdrop of origin timeouts.
Errors occurred simultaneously across a wide range of CloudFront edge locations in multiple regions, with no bias toward any specific PoP.
By path, /articles/* accounted for 72.4% of errors, reflecting the traffic composition of the site.
Effectiveness and Limitations of Origin Failover
Even during the outage, there were 60–116 successful responses per minute, and the ok rate ranged between 10–27% throughout the duration of the outage (07:54–08:29). Since 2xx responses were being returned while the VPC Origin was unable to respond, it is estimated that Cloudflare Workers configured as the secondary origin was returning responses.
In Cloudflare Workers (devio-front-failback), Invocations, which were normally nearly 0, increased to a peak of 2.1k/minute.
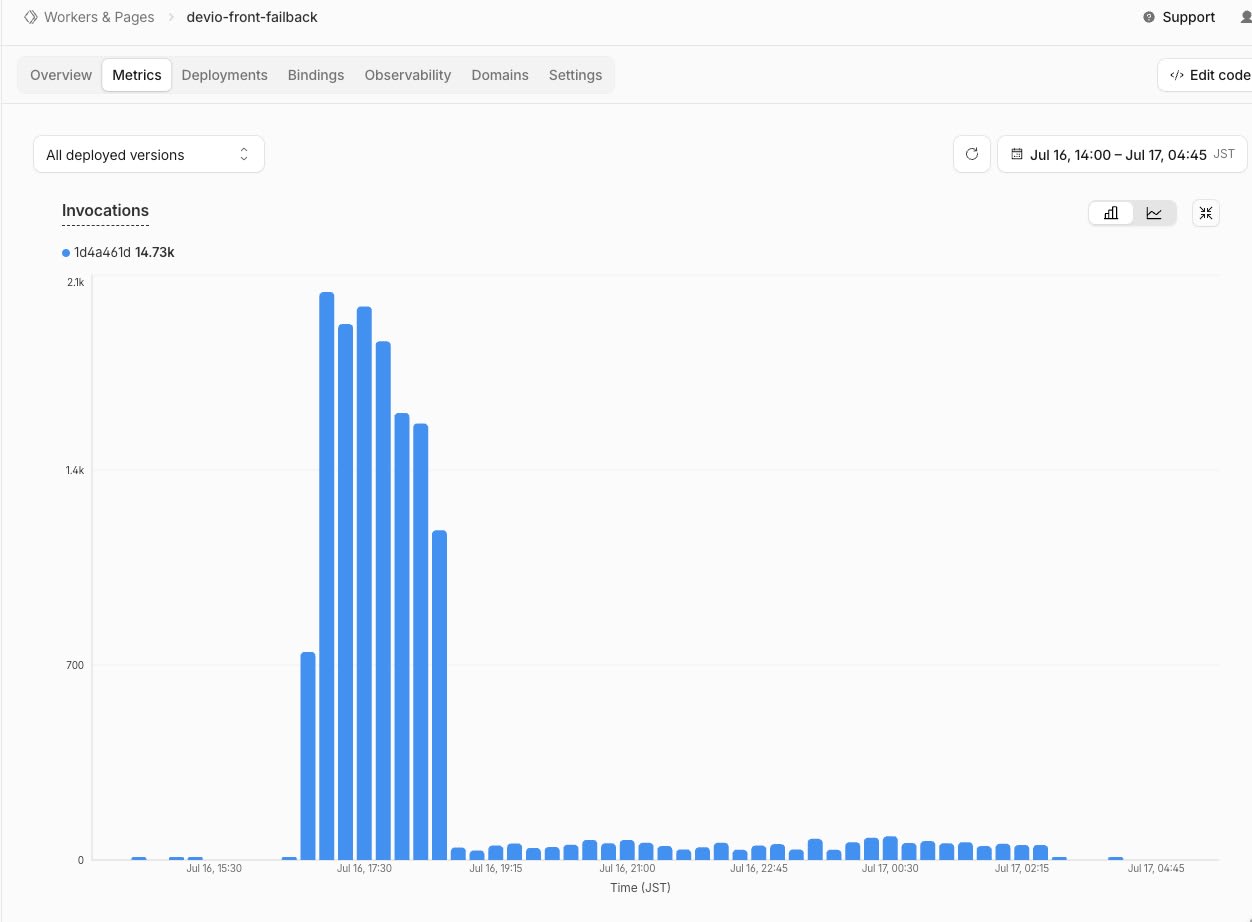
Cloudflare Workers (devio-front-failback) Invocations
We also confirmed pages on which the degraded operation banner was actually displayed.
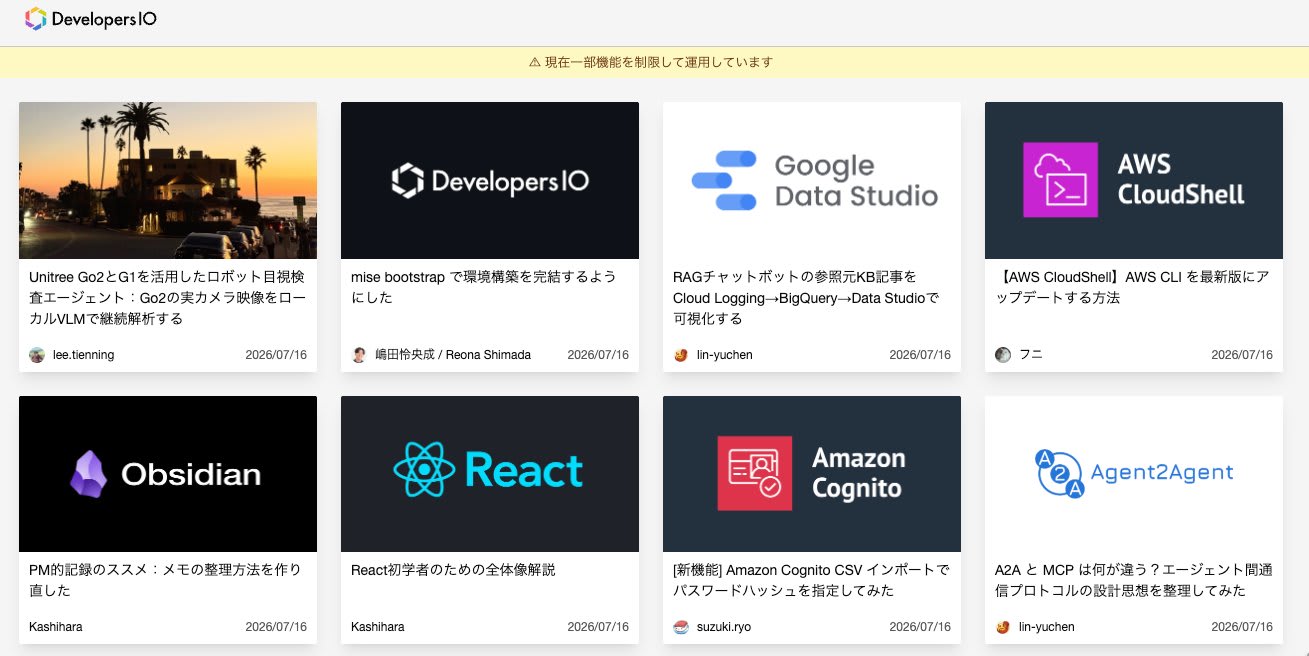
Banner displayed during degraded operation
However, there was a problem in the process leading up to the failover triggering. When CloudFront reaches a timeout while establishing a connection to or obtaining a response from the primary origin, it attempts the secondary according to the configured failover conditions. In the logs for this incident, a wait of approximately 30 seconds was observed, meaning users received the degraded page only after that wait.
When the origin failover group was configured, we anticipated cases where the primary origin would return an HTTP error (5XX, etc.) that was set as a failover trigger. However, what actually occurred was an event where "no response was returned from the origin at all," resulting in behavior where the secondary was attempted only after the timeout (approximately 30 seconds) elapsed.
Interim Measure Policy
The timeout settings subject to review are as follows.
| Setting | Current Value |
|---|---|
| OriginReadTimeout | 30 seconds |
| ConnectionTimeout | 10 seconds |
| ConnectionAttempts | 3 times |
The root cause of this outage is said to be a failure in routing configuration distribution for VPC Origins. Since p95 matches the OriginReadTimeout of 30 seconds, it is possible that a TCP connection was established but no response was returned, however, from the logs in this article, whether a connection was established cannot be directly determined. Shortening OriginReadTimeout is the primary improvement measure, but since balance with SSR response times during normal operation must be considered, the appropriate value will be determined after verification. Shortening ConnectionTimeout/ConnectionAttempts is also planned as a precaution against cases where connection establishment itself fails.
Improvements Identified Through This Analysis
To resolve the aforementioned constraints, we added fields to the CloudFront access logs: origin-fbl (origin first-byte latency), origin-lbl (origin last-byte latency), and timestamp(ms) (millisecond-precision timestamp).
Summary
Through this log analysis, we confirmed that during the VPC Origin outage, a timeout wait of approximately 30 seconds was occurring on the CloudFront side. While origin failover was functioning, the wait time until a degraded response was served became a challenge, as it required waiting for the primary origin's timeout judgment.
Additionally, for timeout types and per-request behavior that could not be identified this time, by utilizing the added log fields, we expect to be able to capture origin-side latency and time correlations in greater detail going forward.
Going forward, we plan to verify behavior in a reproduction environment, then optimize CloudFront timeout settings and origin failover settings, and incorporate them as preventive measures against recurrence.