
I tried setting up correlation between traces and logs in CloudWatch Application Signals
This page has been translated by machine translation. View original
Easy Checking of Trace-Related Logs
Hello, this is nonPi (@non____97).
Have you ever wanted to easily check logs related to traces while using CloudWatch Application Signals? I have.
When you click on a metrics graph in Application Signals, up to 10 spans are displayed from the point you clicked.
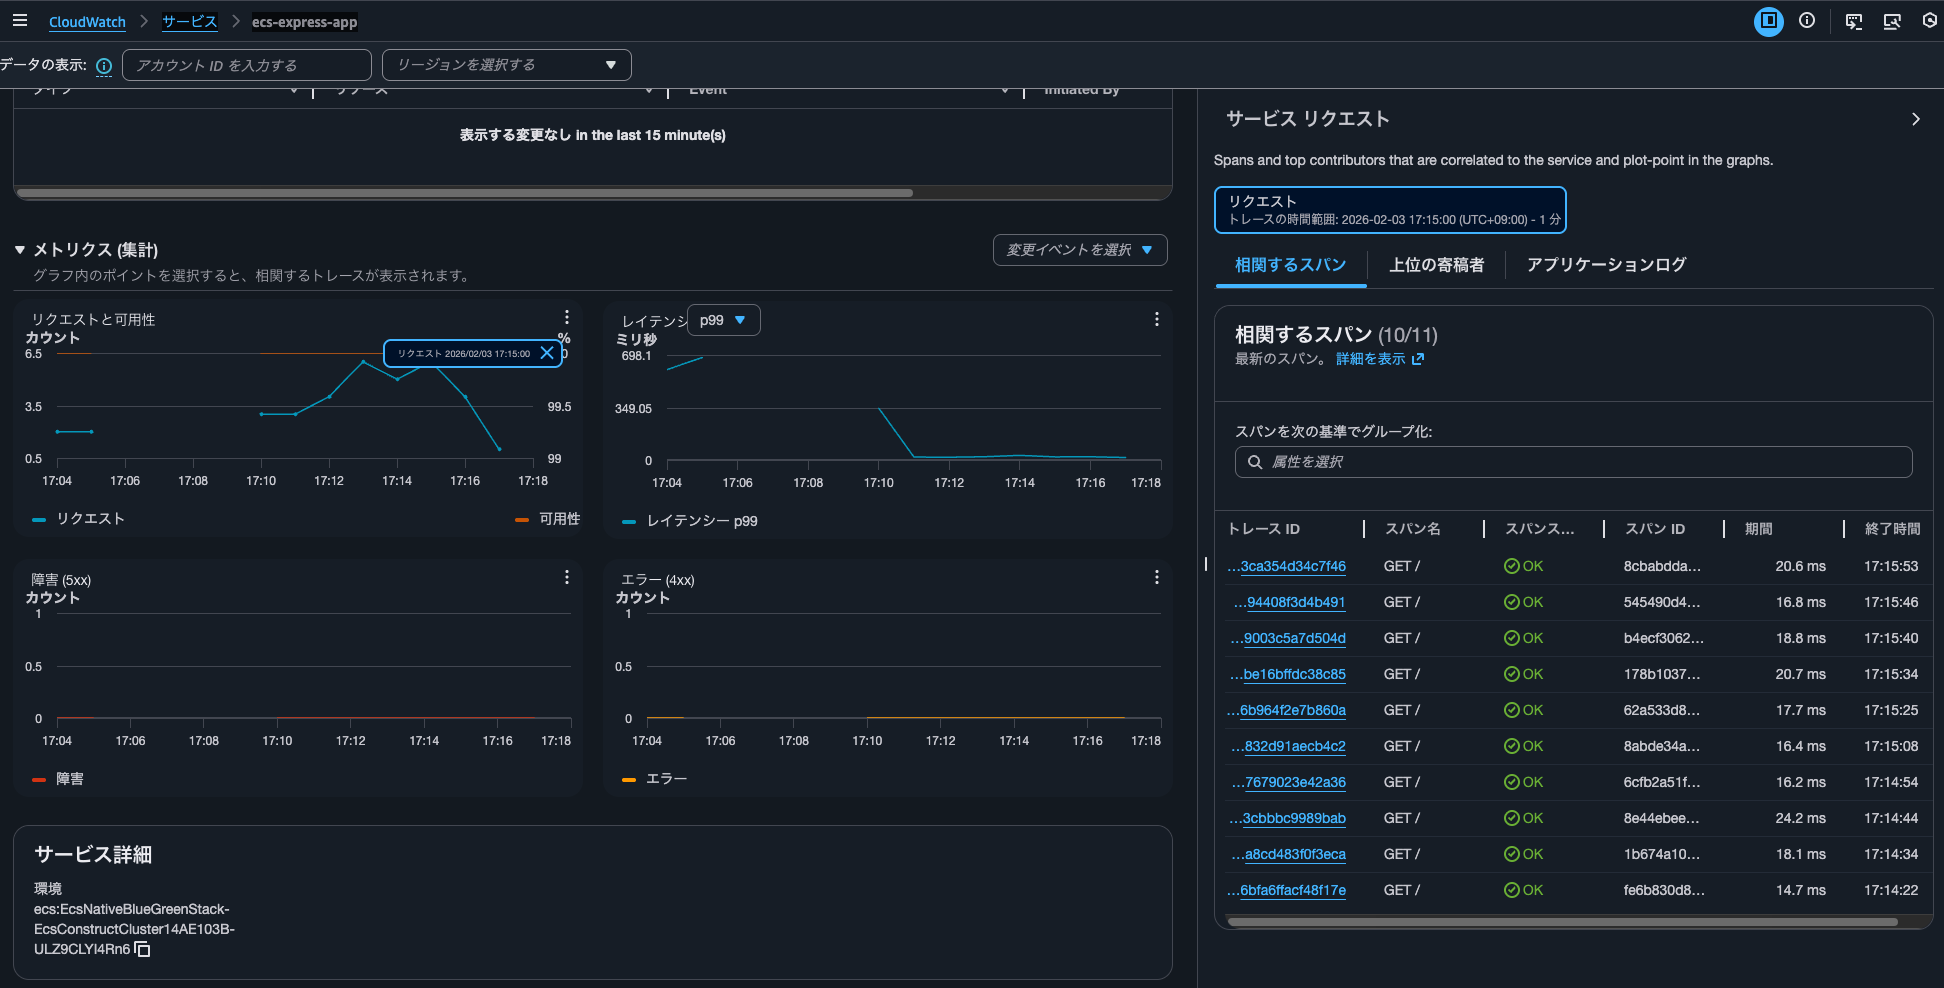
You can check trace details by clicking on the trace ID of one of these spans.
By being able to check logs related to traces together, you can immediately see detailed error messages and stack traces without having to search for logs separately, reducing investigation time.
The implementation method is described in the following AWS official documentation:
You can enable trace log correlation in Application Signals. This automatically inserts trace IDs and span IDs into related application logs. Then, when you open a trace details page in the Application Signals console, if there are log entries related to the current trace, they are automatically displayed at the bottom of the page.
For example, you might notice a spike in a latency graph. You can select that point on the graph to load diagnostic information for that moment. Then, you can select a related trace to see detailed information. When you view the trace information, you can scroll down to see the logs associated with that trace. Examining these logs might help you identify the issue causing the latency spike and reveal related patterns or error codes.
I actually tried it.
Summary
- To correlate logs, follow these steps:
- Embedding trace information in logs
- Be careful whether the package and version you're using is supported by the zero-code instrumentation library
- Specifying the log output destination
- Specify with
aws.log.group.namesinOTEL_RESOURCE_ATTRIBUTES
- Specify with
- Embedding trace information in logs
- CloudWatch Logs Insights operates behind the scenes for log correlation
- It automatically queries log groups starting with
/ecs/
- It automatically queries log groups starting with
What I Did
Testing Environment
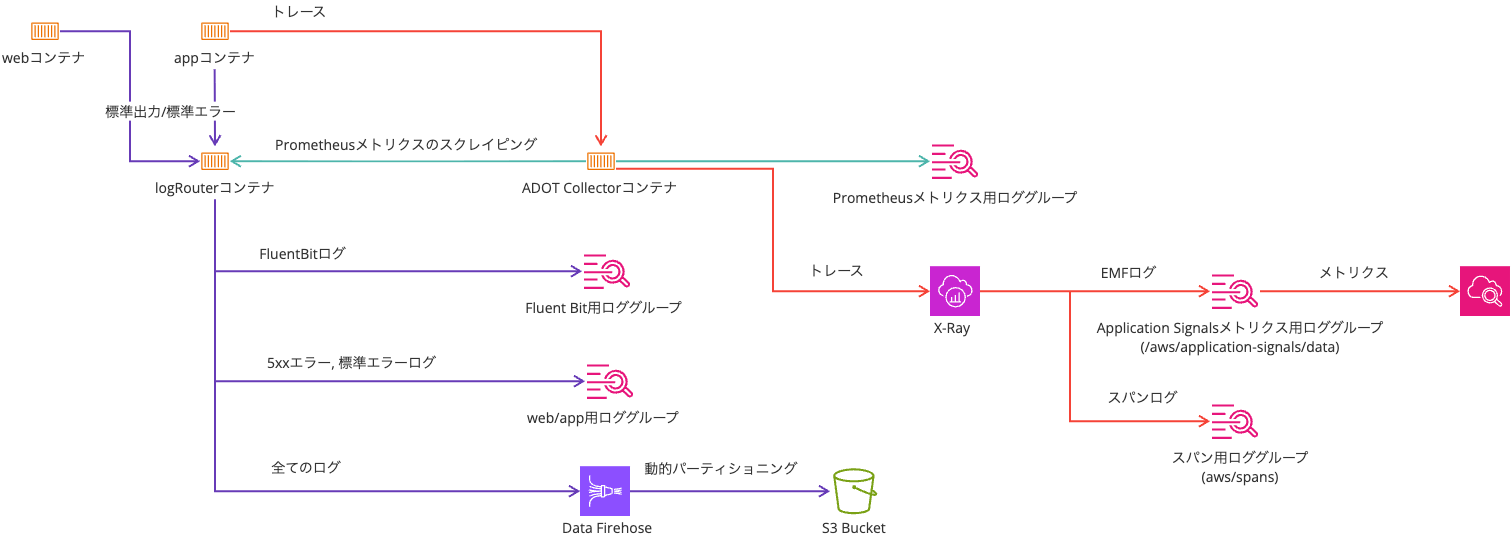
The testing environment is as follows:
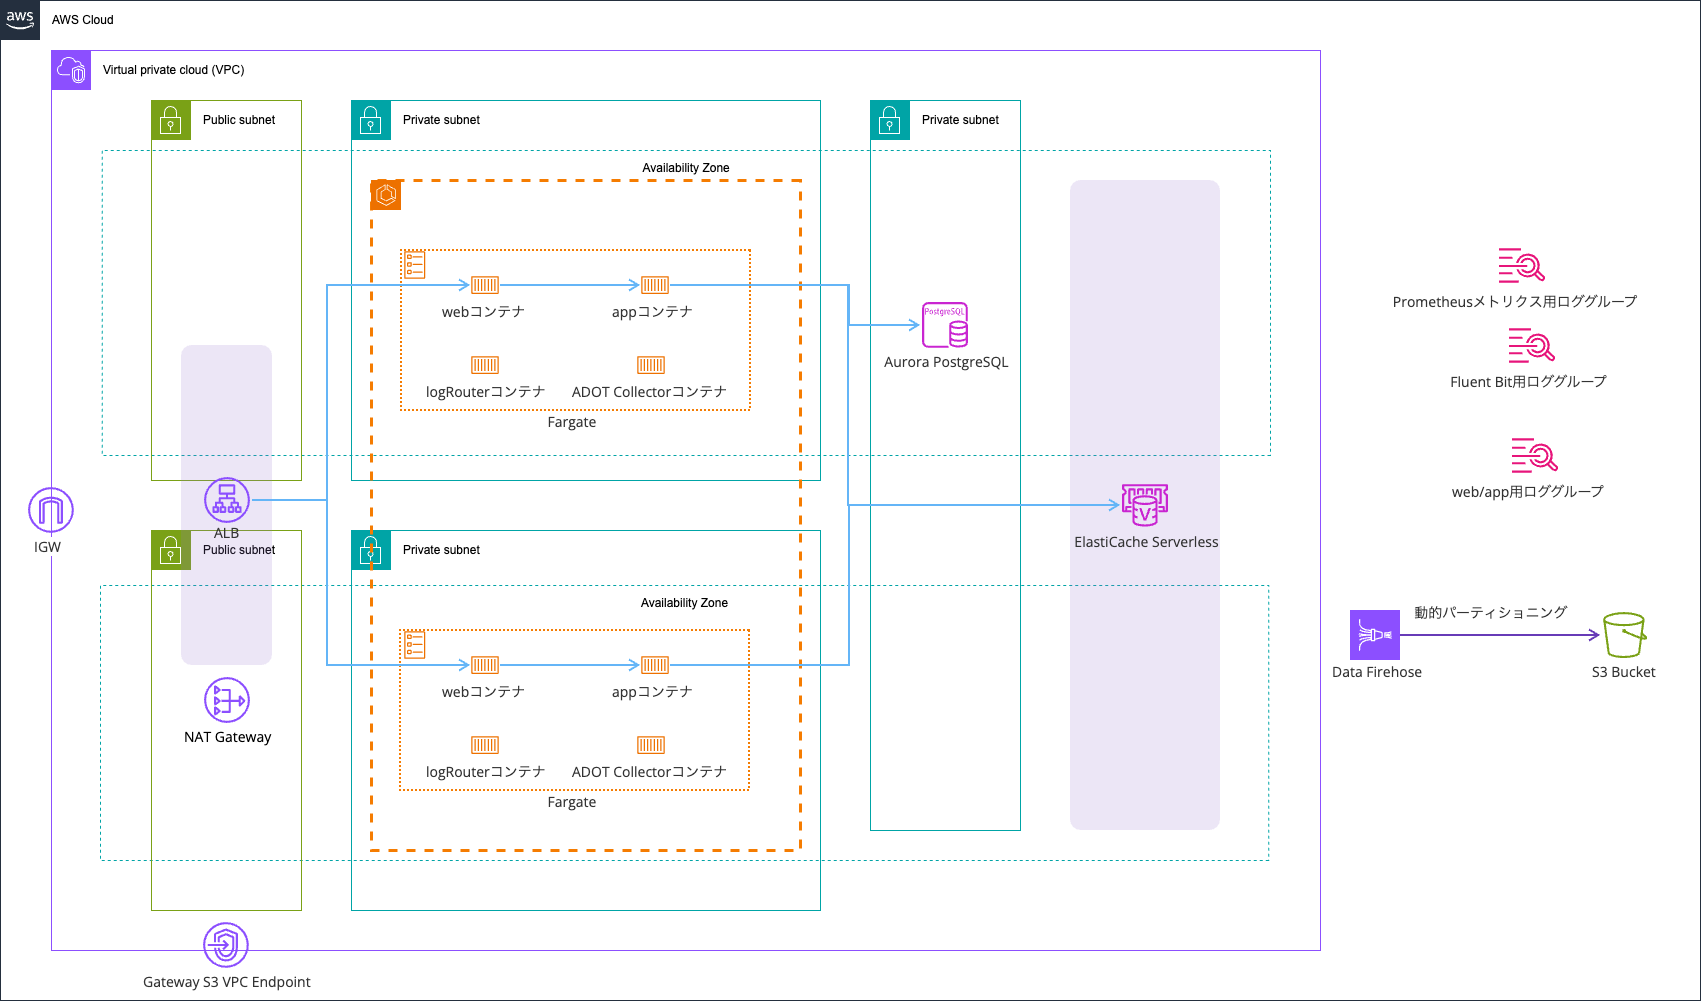
Logs are output using AWS FireLens (AWS for Fluent Bit), with error logs going to CloudWatch Logs and all logs being sent to an S3 bucket via Data Firehose.
It's based on the following article:
All resources are deployed with AWS CDK. The code used is:
After deployment, the Open Telemetry and Application Signals related environment variables are:
| Key | Value |
|---|---|
| OTEL_AWS_APPLICATION_SIGNALS_ENABLED | false |
| OTEL_EXPORTER_OTLP_ENDPOINT | http://localhost:4318 |
| OTEL_EXPORTER_OTLP_PROTOCOL | http/protobuf |
| OTEL_LOGS_EXPORTER | none |
| OTEL_METRICS_EXPORTER | none |
| OTEL_PROPAGATORS | tracecontext,baggage,xray |
| OTEL_RESOURCE_ATTRIBUTES | service.name=ecs-express-app,deployment.environment=ecs:EcsNativeBlueGreenStack-EcsConstructCluster14AE103B-4JfsTzadcWYq,aws.log.group.names=EcsNativeBlueGreenStack-FirelensConstructFirelensLogGroupD186C82F-Oieo4YPQifeI |
| OTEL_TRACES_EXPORTER | otlp |
| OTEL_TRACES_SAMPLER | xray |
| OTEL_TRACES_SAMPLER_ARG | endpoint=http://localhost:2000,polling_interval=300 |
Embedding Trace Information in Logs
First, you need to embed trace information in logs.
Checking the AWS official documentation below, for Node.js, it recommends using zero-code instrumentation libraries for each logger:
Node.js
For details on how to enable trace context insertion in Node.js to work with Node.js-compatible logging libraries, see the documentation on using NPM for automatic instrumentation of either Pino, Winston, or Bunyan in Node.js.
Since I'm using Pino in this case, I need to use @opentelemetry/instrumentation-pino.
As I'm using public.ecr.aws/aws-observability/adot-autoinstrumentation-node:v0.8.1 in an Init container, there's no need to install @opentelemetry/instrumentation-pino separately.
Checking the releases of aws-observability/aws-otel-js-instrumentation, you can see that this container image includes aws-otel-js-instrumentation:
See ADOT node auto-instrumentation Docker image v0.8.1 in our public ECR repository:
https://gallery.ecr.aws/aws-observability/adot-autoinstrumentation-node
And by checking the package-lock.json of aws-otel-js-instrumentation, you can see that the Pino zero-code instrumentation library version ^0.46.0 is included:
The important thing to note is the Pino version.
For the zero-code instrumentation library version 0.46.0, the supported Pino versions are >=5.14.0 <10:
pino versions >=5.14.0 <10
The "log sending" feature is only supported in pino v7 and later.
The latest Pino version is 10.3.1. Therefore, if you don't specify a version, you'll be using a version of Pino that the zero-code instrumentation library doesn't support.
When Pino's zero-code instrumentation is working correctly, trace_id and span_id are added as follows:
{
    "level": "error",
    "time": "2026-02-11T00:42:49.466Z",
    "pid": 6,
    "hostname": "ip-10-10-8-112.ec2.internal",
    "req": {
        "id": 36,
        "method": "GET",
        "url": "/error/",
        "query": {},
        "params": {},
        "headers": {
            "host": "ecsnat-albco-qzyosxmqsim4-1634003559.us-east-1.elb.amazonaws.com",
            "x-real-ip": "10.10.8.10",
            "x-forwarded-for": "<送信元IPアドレス>, 10.10.8.10",
            "x-forwarded-proto": "http",
            "connection": "close",
            "x-forwarded-port": "80",
            "x-amzn-trace-id": "Root=1-698bd089-3e85c9ad79fddc8706f7ad7f",
            "cookie": "connect.sid=s%3Aa-rXSzyN-2POI_b5dkH4LkP6ijl68rve.zWuJDO786nBLrcXV3U70DxhwxfrFLqXFjPWwB9ATd%2FQ",
            "user-agent": "curl/8.7.1",
            "accept": "*/*"
        },
        "remoteAddress": "127.0.0.1",
        "remotePort": 57812
    },
    "trace_id": "698bd089673affe7e1c8a2add24be6a9",
    "span_id": "448e1d51d070a746",
    "trace_flags": "01",
    "res": {
        "statusCode": 500,
        "headers": {
            "x-powered-by": "Express",
            "content-type": "application/json; charset=utf-8",
            "content-length": "33",
            "etag": "W/\"21-Fau8GdrOCOyGNNH/IiTxy2DuMu0\""
        }
    },
    "err": {
        "type": "Error",
        "message": "failed with status code 500",
        "stack": "Error: failed with status code 500\n    at onResFinished (/app/node_modules/.pnpm/pino-http@10.5.0/node_modules/pino-http/logger.js:115:39)\n    at ServerResponse.onResponseComplete (/app/node_modules/.pnpm/pino-http@10.5.0/node_modules/pino-http/logger.js:178:14)\n    at /otel-auto-instrumentation/node_modules/@opentelemetry/context-async-hooks/build/src/AbstractAsyncHooksContextManager.js:50:55\n    at AsyncLocalStorage.run (node:internal/async_local_storage/async_context_frame:59:14)\n    at AsyncLocalStorageContextManager.with (/otel-auto-instrumentation/node_modules/@opentelemetry/context-async-hooks/build/src/AsyncLocalStorageContextManager.js:33:40)\n    at ServerResponse.contextWrapper (/otel-auto-instrumentation/node_modules/@opentelemetry/context-async-hooks/build/src/AbstractAsyncHooksContextManager.js:50:32)\n    at ServerResponse.emit (node:events:520:35)\n    at onFinish (node:_http_outgoing:1026:10)\n    at callback (node:internal/streams/writable:764:21)\n    at afterWrite (node:internal/streams/writable:708:5)"
    },
    "responseTime": 5,
    "msg": "request errored",
    "container_name": "app",
    "source": "stderr",
    "container_id": "6b8cc0c5e5f94ebe888e690dbb051168-0527074092",
    "ecs_cluster": "EcsNativeBlueGreenStack-EcsConstructCluster14AE103B-zJnVnD9x7R6g",
    "ecs_task_arn": "arn:aws:ecs:us-east-1:<AWSアカウントID>:task/EcsNativeBlueGreenStack-EcsConstructCluster14AE103B-zJnVnD9x7R6g/6b8cc0c5e5f94ebe888e690dbb051168",
    "ecs_task_definition": "EcsNativeBlueGreenStackEcsConstructTaskDefinitionF683F4B2:95"
}
On the other hand, when using Pino version 10 or later, trace information is not recorded:
{
    "level": "error",
    "time": "2026-02-04T07:54:00.739Z",
    "pid": 6,
    "hostname": "ip-10-10-8-103.ec2.internal",
    "req": {
        "id": 63,
        "method": "GET",
        "url": "/error/",
        "query": {},
        "params": {},
        "headers": {
            "host": "ecsnat-albco-fgdpbvnooxwj-1973419334.us-east-1.elb.amazonaws.com",
            "x-real-ip": "10.10.8.57",
            "x-forwarded-for": "<送信元IPアドレス>, 10.10.8.57",
            "x-forwarded-proto": "http",
            "connection": "close",
            "x-forwarded-port": "80",
            "x-amzn-trace-id": "Root=1-6982fb18-3fb552d8541fd9151d48406f",
            "accept": "*/*",
            "user-agent": "curl/8.7.1"
        },
        "remoteAddress": "127.0.0.1",
        "remotePort": 53378
    },
    "res": {
        "statusCode": 500,
        "headers": {
            "x-powered-by": "Express",
            "content-type": "application/json; charset=utf-8",
            "content-length": "33",
            "etag": "W/\"21-Fau8GdrOCOyGNNH/IiTxy2DuMu0\"",
            "set-cookie": [
                "connect.sid=s%3An3YhhvIDKp6XWpVpDbx0U9F0GeNEHJxg.1HNNiMD4%2BhQEmjNdBO9NbQsADN67pKUccIeBYe%2Fp%2FVc; Path=/; Expires=Thu, 05 Feb 2026 07:54:00 GMT; HttpOnly"
            ]
        }
    },
    "err": {
        "type": "Error",
        "message": "failed with status code 500",
        "stack": "Error: failed with status code 500\n    at onResFinished (/app/node_modules/.pnpm/pino-http@11.0.0/node_modules/pino-http/logger.js:115:39)\n    at ServerResponse.onResponseComplete (/app/node_modules/.pnpm/pino-http@11.0.0/node_modules/pino-http/logger.js:178:14)\n    at /otel-auto-instrumentation/node_modules/@opentelemetry/context-async-hooks/build/src/AbstractAsyncHooksContextManager.js:50:55\n    at AsyncLocalStorage.run (node:internal/async_local_storage/async_context_frame:59:14)\n    at AsyncLocalStorageContextManager.with (/otel-auto-instrumentation/node_modules/@opentelemetry/context-async-hooks/build/src/AsyncLocalStorageContextManager.js:33:40)\n    at ServerResponse.contextWrapper (/otel-auto-instrumentation/node_modules/@opentelemetry/context-async-hooks/build/src/AbstractAsyncHooksContextManager.js:50:32)\n    at ServerResponse.emit (node:events:520:35)\n    at onFinish (node:_http_outgoing:1026:10)\n    at callback (node:internal/streams/writable:764:21)\n    at afterWrite (node:internal/streams/writable:708:5)"
    },
    "responseTime": 3,
    "msg": "request errored",
    "container_name": "app",
    "source": "stderr",
    "container_id": "0dfd495fff0048de92bd87f68daa8de1-0527074092",
    "ecs_cluster": "EcsNativeBlueGreenStack-EcsConstructCluster14AE103B-s5tytpIiJ9VQ",
    "ecs_task_arn": "arn:aws:ecs:us-east-1:<AWSアカウントID>:task/EcsNativeBlueGreenStack-EcsConstructCluster14AE103B-s5tytpIiJ9VQ/0dfd495fff0048de92bd87f68daa8de1",
    "ecs_task_definition": "EcsNativeBlueGreenStackEcsConstructTaskDefinitionF683F4B2:93"
}
Similarly, be careful with other packages like Express to ensure you're using versions supported by zero-code instrumentation. The supported versions are documented in the source code as well:
Specifying Log Output Destination
To correlate traces and logs, you need to specify the log output destination.
Specifically, you add aws.log.group.names=<target log group name> to the OTEL_RESOURCE_ATTRIBUTES.
(Optional) To enable Application Signals log correlation, additionally set the environment variable aws.log.group.names to your application log's log group name. This allows traces and metrics generated by your application to be correlated with corresponding log entries in this log group. In this variable, replace $YOUR_APPLICATION_LOG_GROUP with your application's log group name. If you have multiple log groups, you can use ampersands (&) to separate them, as in this example: aws.log.group.names=log-group-1&log-group-2. To enable log correlation for metrics, just setting this current environment variable is sufficient. For more information, see Enable log correlation for metrics. To enable log correlation for traces, you also need to modify your application's logging configuration. For more information, see Enable log correlation for traces.
With this configuration, the specified log group names will appear in the cloudwatch_logs property under the aws property of the span.
{
    "ecs.task.arn": "arn:aws:ecs:us-east-1:<AWSアカウントID>:task/EcsNativeBlueGreenStack-EcsConstructCluster14AE103B-zJnVnD9x7R6g/015048a8181a46e4bbc15539e33568f7",
    "ecs.task.family": "EcsNativeBlueGreenStackEcsConstructTaskDefinitionF683F4B2",
    "ecs.cluster.arn": "arn:aws:ecs:us-east-1:<AWSアカウントID>:cluster/EcsNativeBlueGreenStack-EcsConstructCluster14AE103B-zJnVnD9x7R6g",
    "ecs": {
        "container": "ip-10-10-8-74.ec2.internal",
        "container_id": "46e4bbc15539e33568f7/015048a8181a46e4bbc15539e33568f7-0527074092"
    },
    "ecs.container.arn": "arn:aws:ecs:us-east-1:<AWSアカウントID>:container/EcsNativeBlueGreenStack-EcsConstructCluster14AE103B-zJnVnD9x7R6g/015048a8181a46e4bbc15539e33568f7/8059f724-8aeb-4554-afd9-bddf9f15b80e",
    "ecs.launchtype": "fargate",
    "span.kind": "CLIENT",
    "cloudwatch_logs": [
        {
            "log_group": "EcsNativeBlueGreenStack-FirelensConstructFirelensLogGroupD186C82F-wTQ4890Mp8e9"
        }
    ],
    "ecs.task.revision": "100"
},
Note that log correlation will not work if you include ECS Detectors in your resourcedetection processor in the Open Telemetry Collector trace pipeline:
processors:
.
.
(omitted)
.
.
  resourcedetection:
    detectors: [env, ecs]
    timeout: 5s
    override: false
.
.
(omitted)
.
.
service:
  extensions: [sigv4auth, awsproxy]
  pipelines:
    traces:
      receivers: [otlp]
      processors: [filter/exclude_health, resourcedetection, batch]
      exporters: [otlphttp]
Specifically, you'll see an error message like "Error occurred while retrieving data":
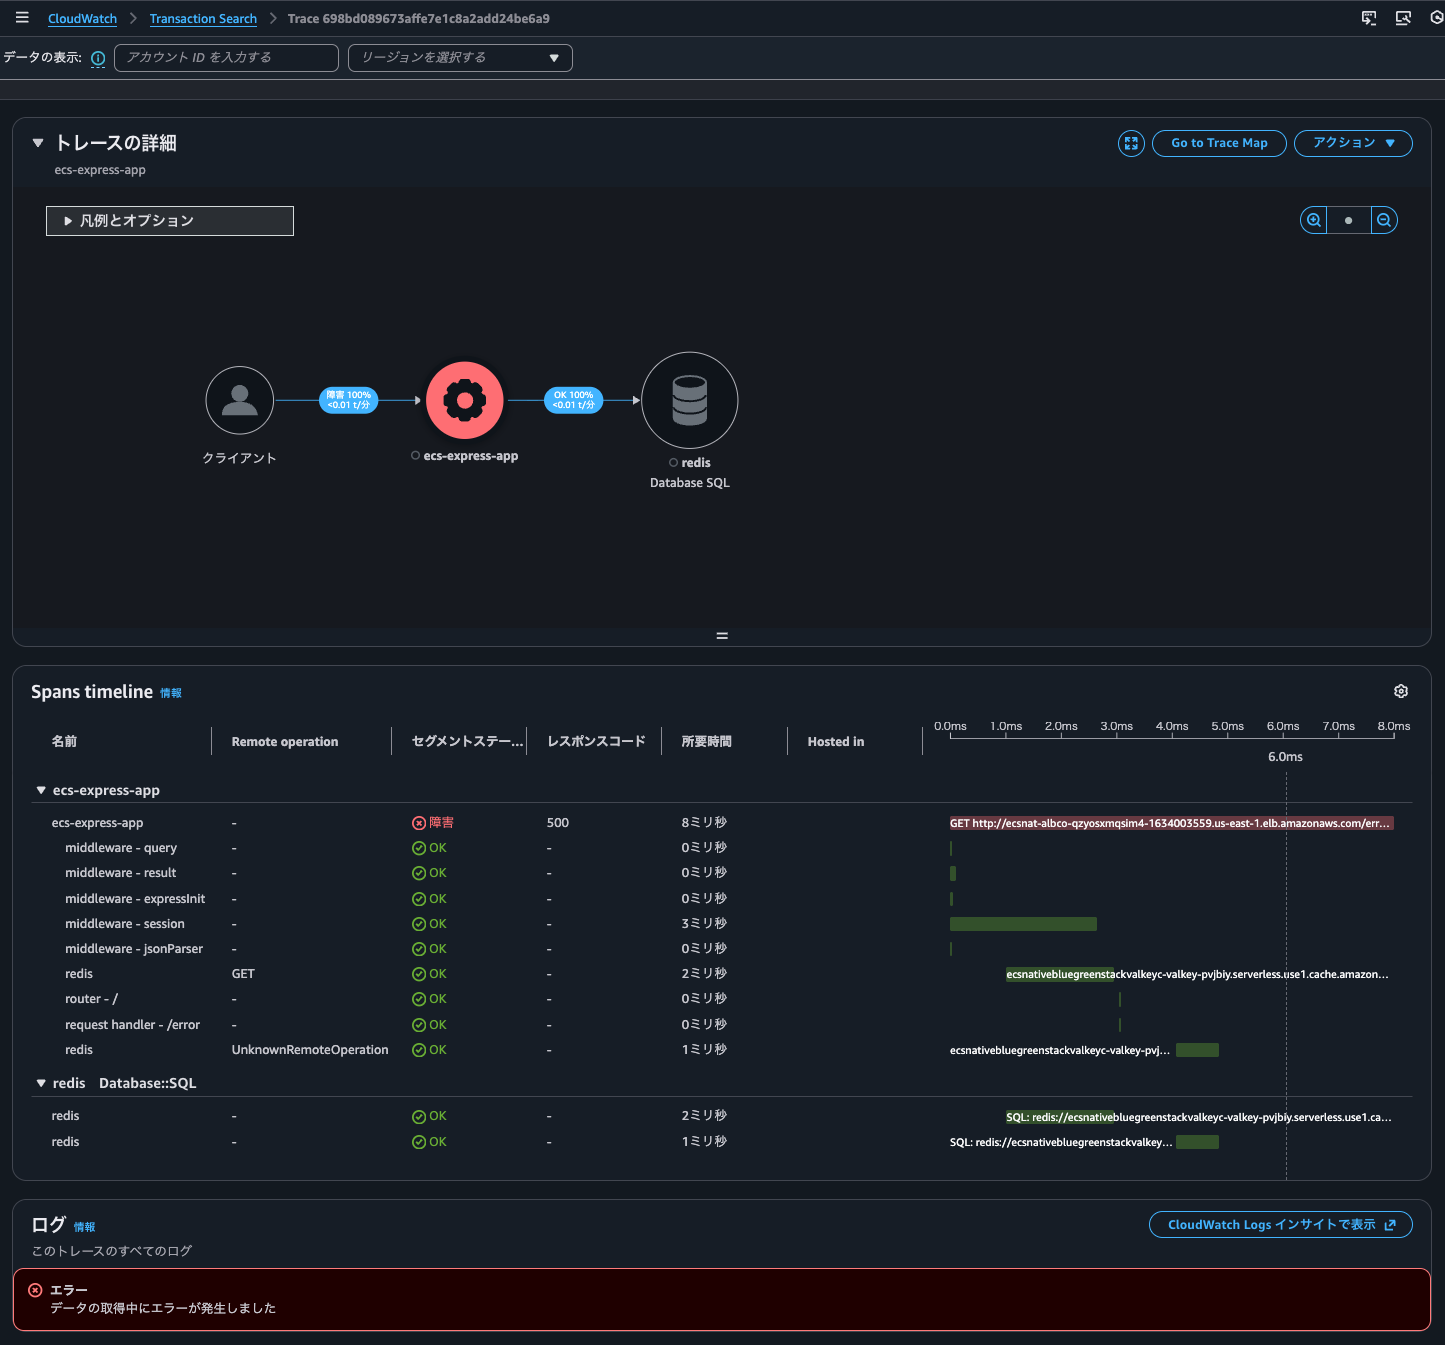
Note: The same result occurs whether from "CloudWatch > Transaction Search" or "CloudWatch > Traces"
As mentioned later, CloudWatch Logs Insights runs behind the scenes for log correlation, but in this case there was no evidence that Logs Insights was executed.
By the way, in this case, the aws property of the span contained the log group and log stream for the container's log output destination using the awslogs log driver in cloudwatch_logs, log.stream.arns, and log.stream.names:
{
  "ecs.task.arn": "arn:aws:ecs:us-east-1:<AWSアカウントID>:task/EcsNativeBlueGreenStack-EcsConstructCluster14AE103B-zJnVnD9x7R6g/2a9e9b028b6b4bd0b4edf85023bd9c3b",
  "ecs.task.family": "EcsNativeBlueGreenStackEcsConstructTaskDefinitionF683F4B2",
  "ecs.cluster.arn": "arn:aws:ecs:us-east-1:<AWSアカウントID>:cluster/EcsNativeBlueGreenStack-EcsConstructCluster14AE103B-zJnVnD9x7R6g",
  "ecs": {
      "container": "ip-10-10-8-125.ec2.internal",
      "container_id": "4bd0b4edf85023bd9c3b/2a9e9b028b6b4bd0b4edf85023bd9c3b-0527074092"
  },
  "ecs.container.arn": "arn:aws:ecs:us-east-1:<AWSアカウントID>:container/EcsNativeBlueGreenStack-EcsConstructCluster14AE103B-zJnVnD9x7R6g/2a9e9b028b6b4bd0b4edf85023bd9c3b/e8984edf-97c0-4e46-a8ea-23018b9537c6",
  "ecs.launchtype": "fargate",
  "span.kind": "CLIENT",
  "cloudwatch_logs": [
      {
          "log_group": "EcsNativeBlueGreenStack-FirelensConstructFirelensLogGroupD186C82F-wTQ4890Mp8e9"
      },
      {
          "log_group": "arn:aws:logs:us-east-1:<AWSアカウントID>:log-group:EcsNativeBlueGreenStack-EcsConstructTaskDefinitionAdotAutoInstrumentationInitContainerLogGroup8060A51D-TTDVP1HlaLC8"
      },
      {
          "log_group": "arn:aws:logs:us-east-1:<AWSアカウントID>:log-group:EcsNativeBlueGreenStack-EcsConstructTaskDefinitionlogRouterLogGroup27EC9B3C-OxmB1VpOf8SS"
      }
  ],
  "ecs.task.revision": "100",
  "log.stream.arns": [
      "arn:aws:logs:us-east-1:<AWSアカウントID>:log-group:EcsNativeBlueGreenStack-EcsConstructTaskDefinitionAdotAutoInstrumentationInitContainerLogGroup8060A51D-TTDVP1HlaLC8:log-stream:init/init/2a9e9b028b6b4bd0b4edf85023bd9c3b",
      "arn:aws:logs:us-east-1:<AWSアカウントID>:log-group:EcsNativeBlueGreenStack-EcsConstructTaskDefinitionlogRouterLogGroup27EC9B3C-OxmB1VpOf8SS:log-stream:firelens/EcsNativeBlueGreenStackEcsConstructTaskDefinitionF683F4B2/logRouter/2a9e9b028b6b4bd0b4edf85023bd9c3b"
  ],
  "log.stream.names": [
      "init/init/2a9e9b028b6b4bd0b4edf85023bd9c3b",
      "firelens/EcsNativeBlueGreenStackEcsConstructTaskDefinitionF683F4B2/logRouter/2a9e9b028b6b4bd0b4edf85023bd9c3b"
  ],
  "ecs.task.id": "2a9e9b028b6b4bd0b4edf85023bd9c3b"
},
Other than adding ecs.task.id, don't insert this in your pipeline.
Verification Test
I will verify functionality.
Application Signals service shows metric graph data points that can be clicked to display correlation spans.
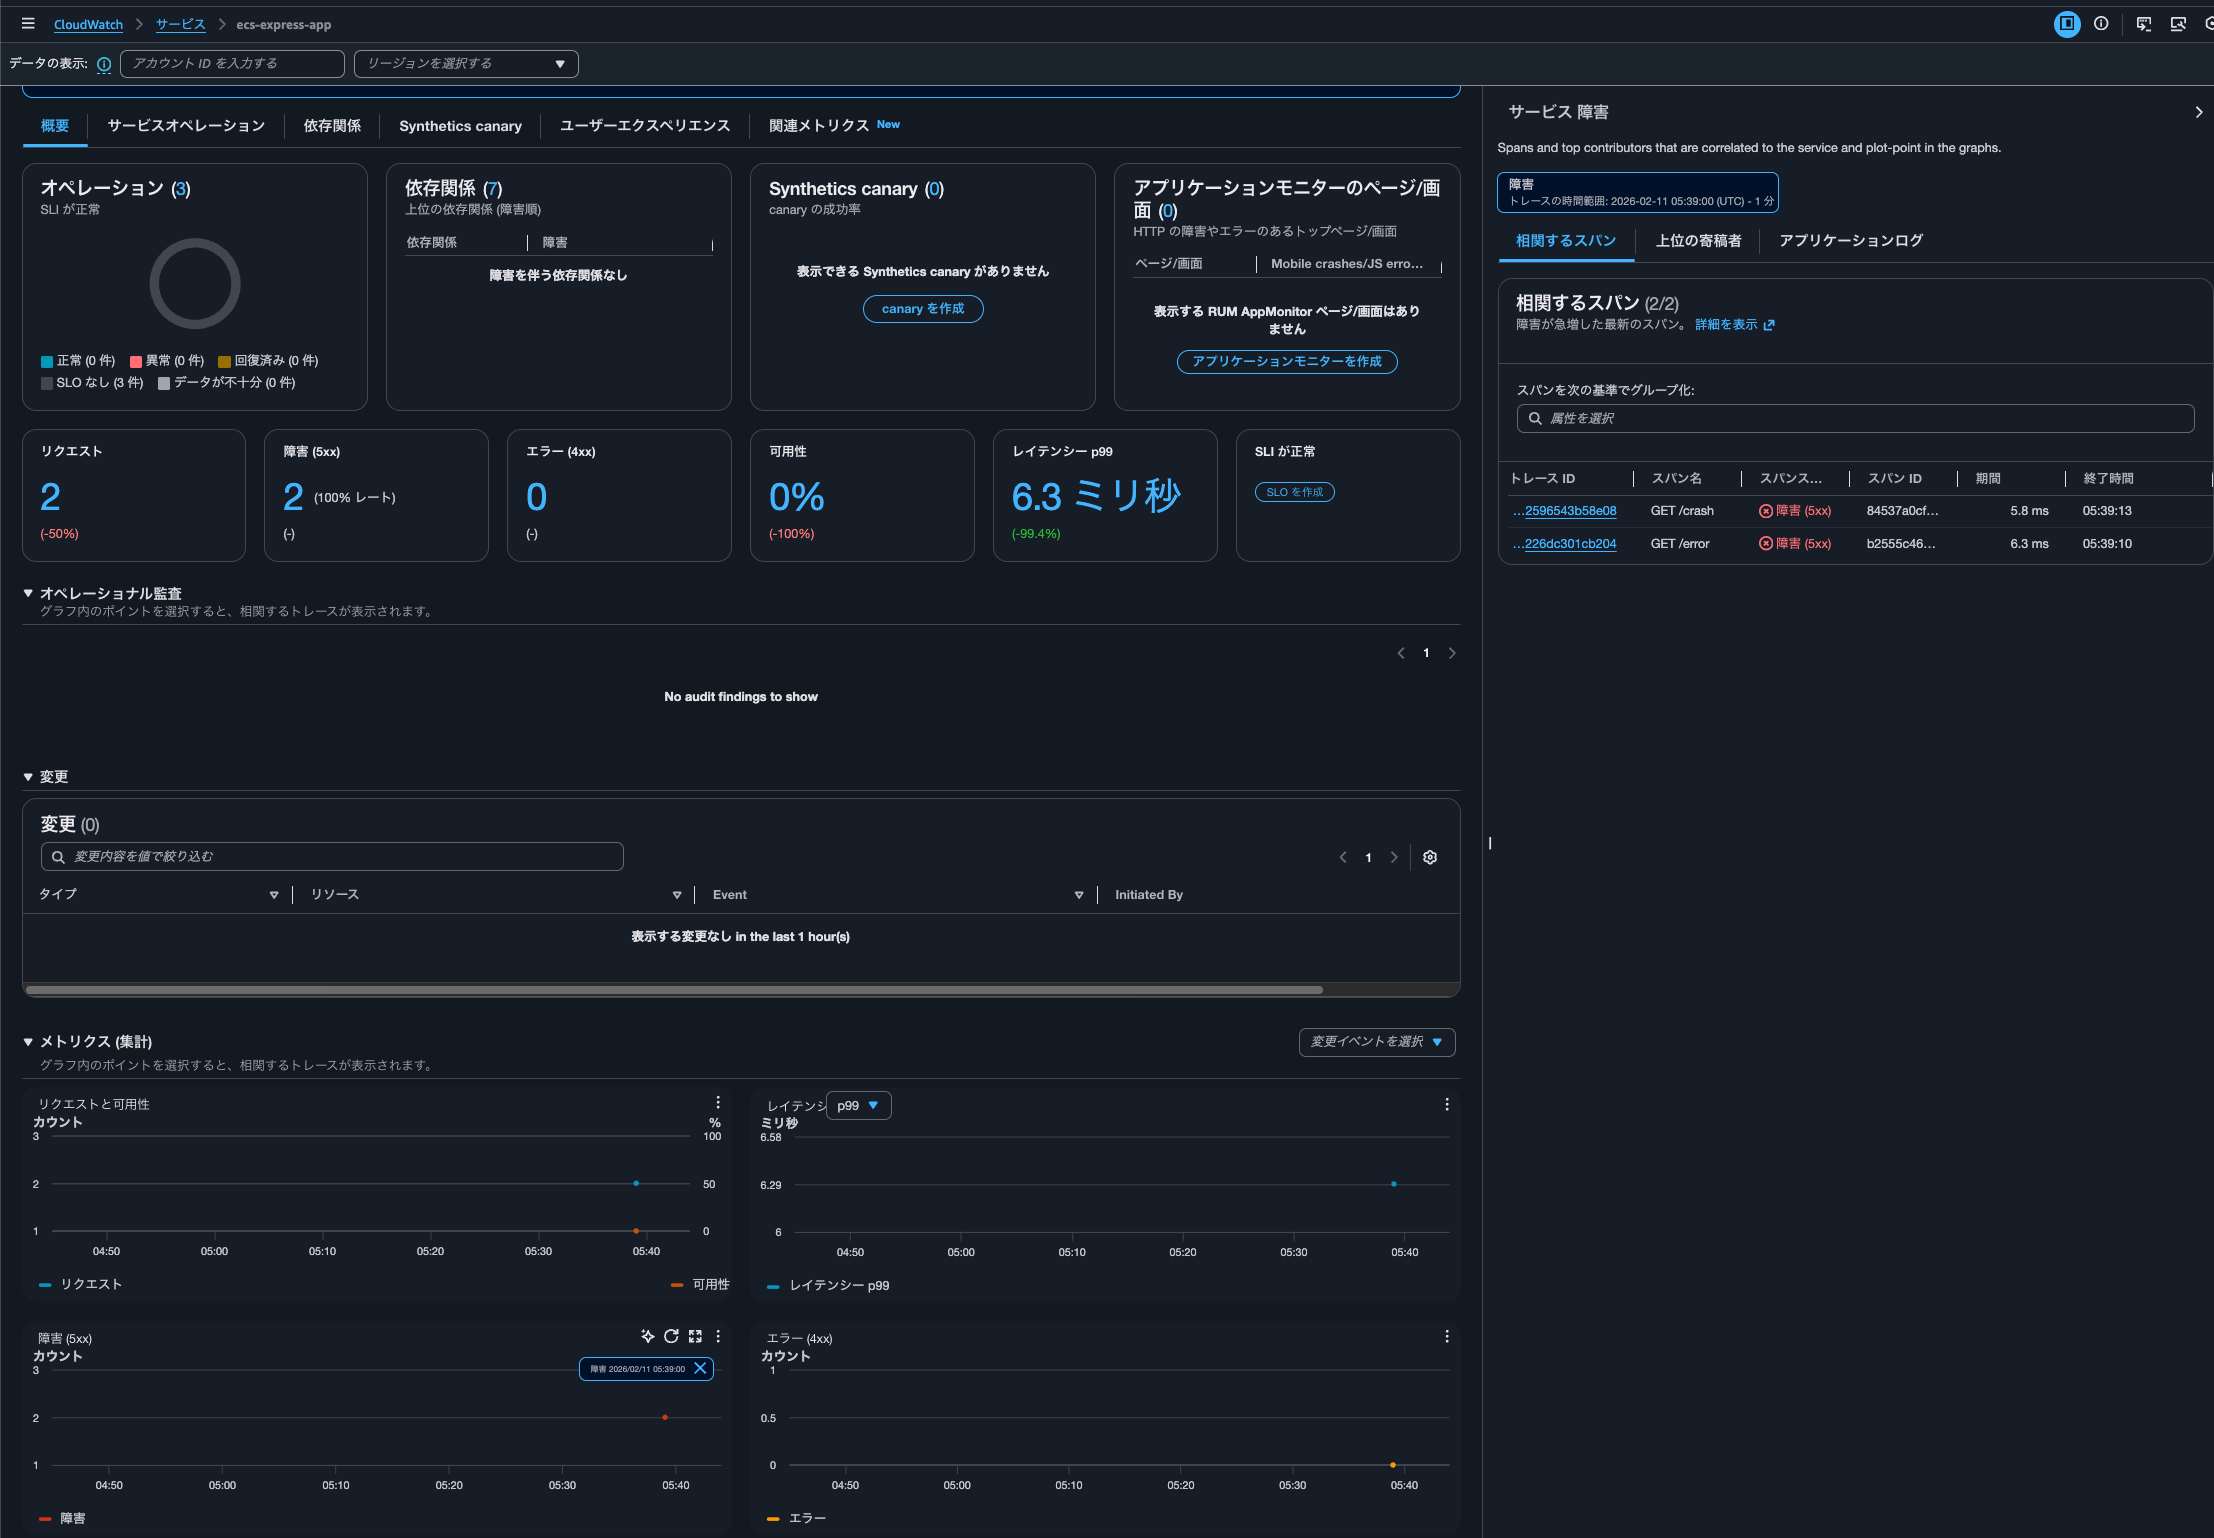
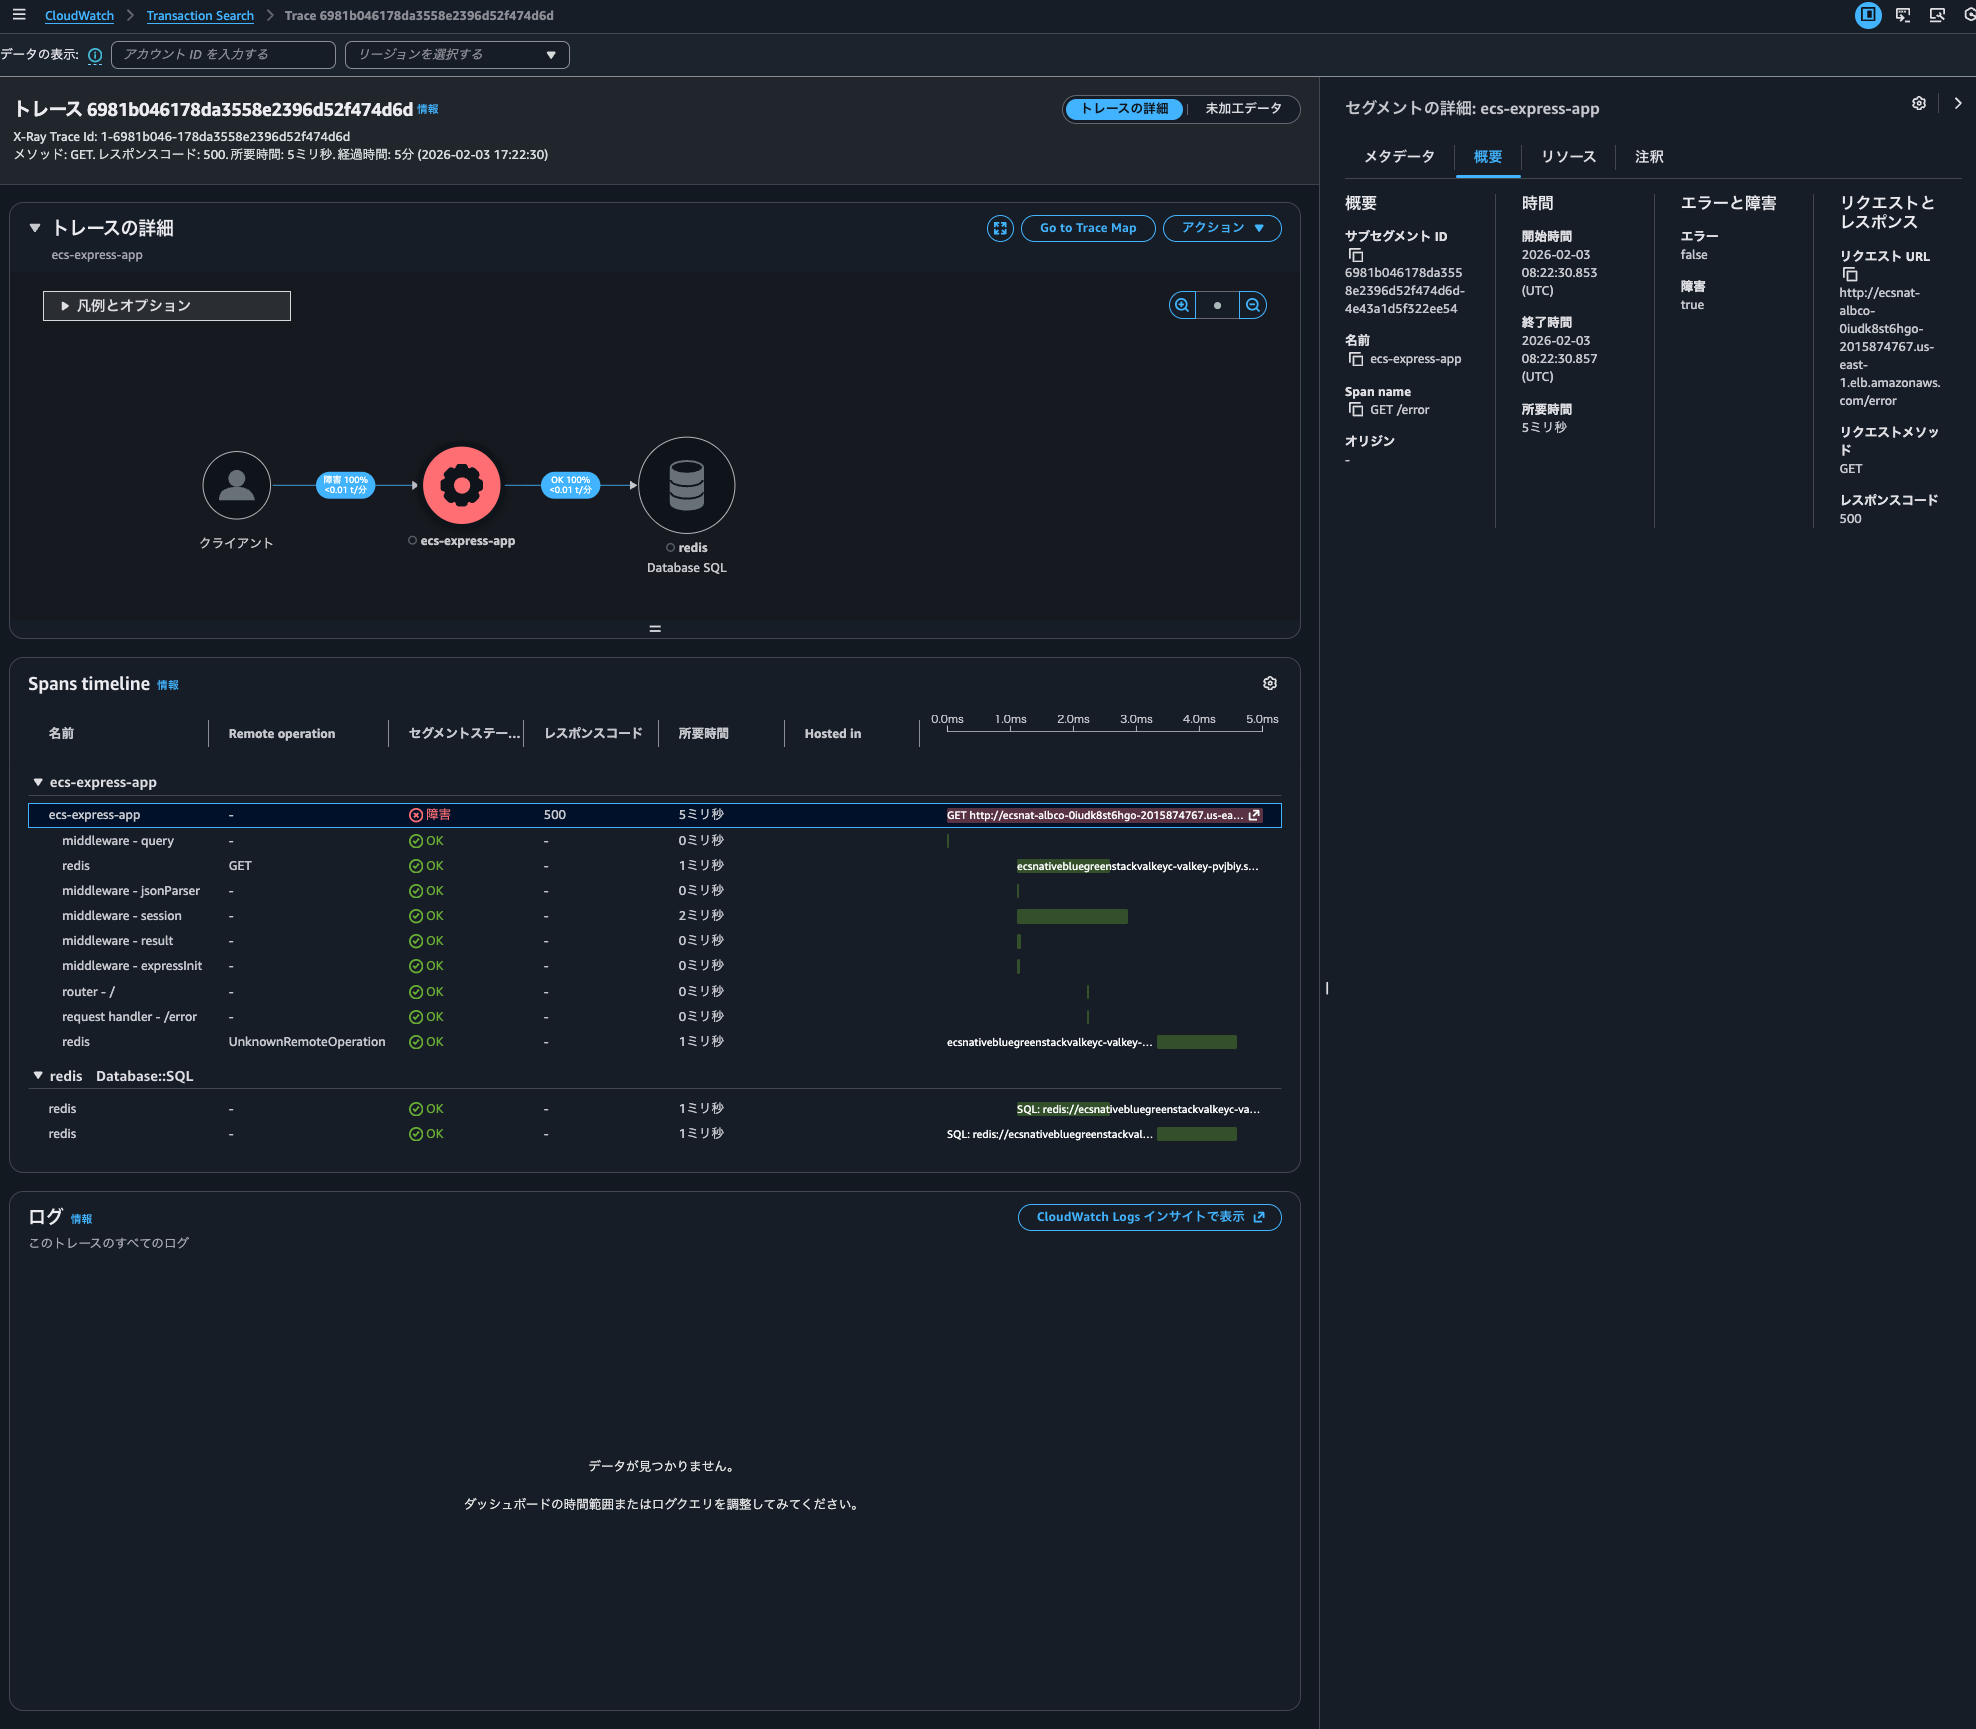
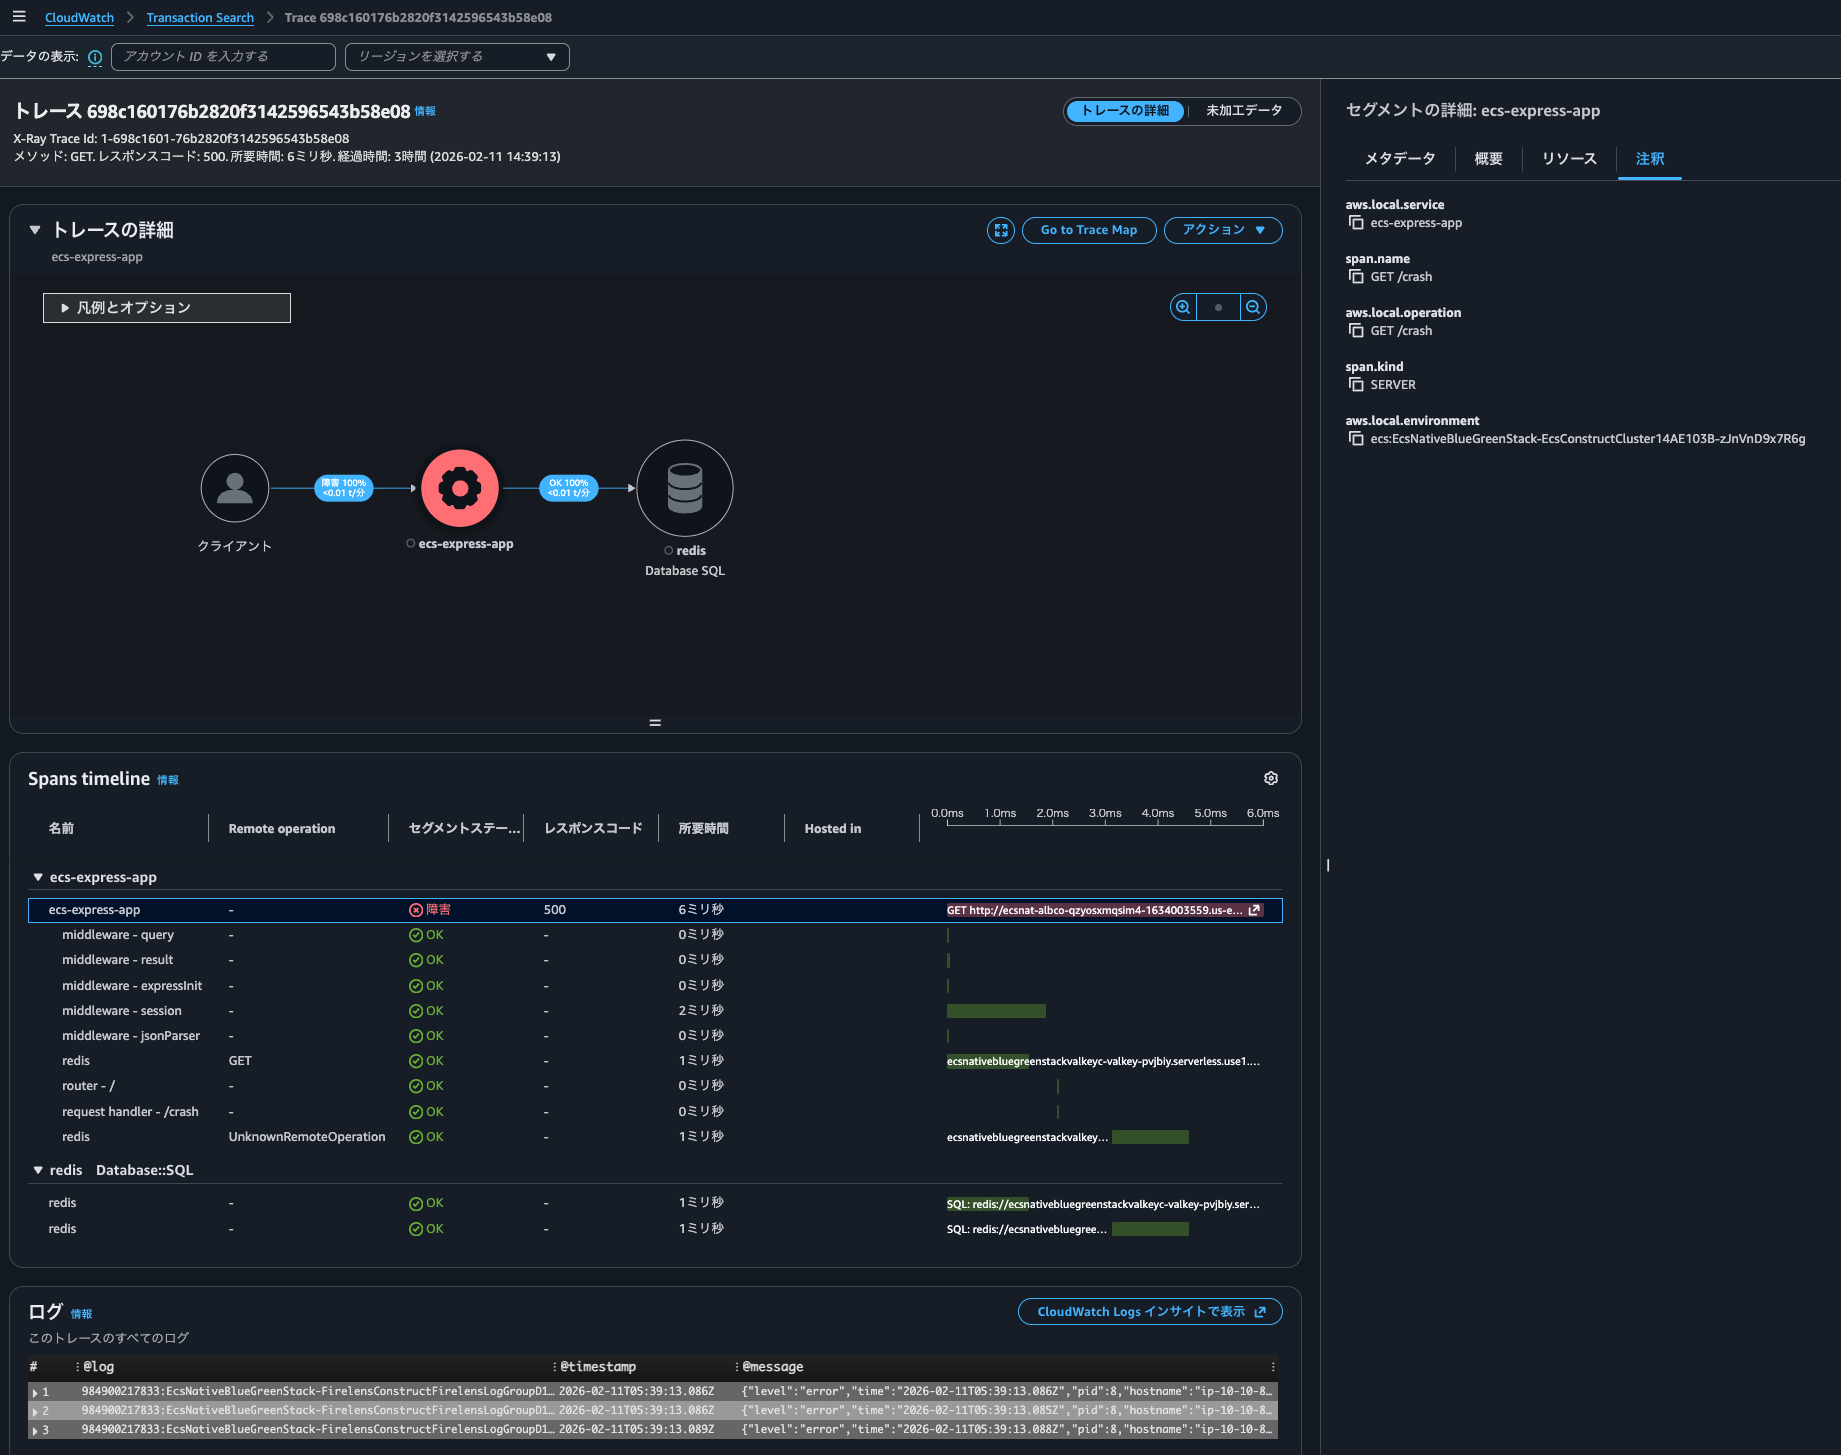
Clicking on the trace ID within the correlation span.
As a result, I was able to see logs associated with the trace as shown below.
{
    "level": "error",
    "time": "2026-02-11T05:39:13.085Z",
    "pid": 8,
    "hostname": "ip-10-10-8-89.ec2.internal",
    "req": {
        "id": 479,
        "method": "GET",
        "url": "/crash/",
        "query": {},
        "params": {},
        "headers": {
            "host": "ecsnat-albco-qzyosxmqsim4-1634003559.us-east-1.elb.amazonaws.com",
            "x-real-ip": "10.10.8.40",
            "x-forwarded-for": "<送信元IPアドレス>, 10.10.8.40",
            "x-forwarded-proto": "http",
            "connection": "close",
            "x-forwarded-port": "80",
            "x-amzn-trace-id": "Root=1-698c1601-5ec60d115f6377e539ba7666",
            "cookie": "connect.sid=s%3AkdwCTdPnOMbapxgvwkYpR3T2Y1Ykw_eW.cef%2Bw5X7jVYHTqDmz0m8XtFUePmZOE225Vy9JSE%2B4uQ",
            "user-agent": "curl/8.7.1",
            "accept": "*/*"
        },
        "remoteAddress": "127.0.0.1",
        "remotePort": 33256
    },
    "trace_id": "698c160176b2820f3142596543b58e08",
    "span_id": "84537a0cf5432a39",
    "trace_flags": "01",
    "msg": "Crash endpoint triggered - throwing exception",
    "container_id": "26510d3c39984a7cb58a1bf43dda452b-0527074092",
    "container_name": "app",
    "source": "stderr",
    "ecs_cluster": "EcsNativeBlueGreenStack-EcsConstructCluster14AE103B-zJnVnD9x7R6g",
    "ecs_task_arn": "arn:aws:ecs:us-east-1:<AWSアカウントID>:task/EcsNativeBlueGreenStack-EcsConstructCluster14AE103B-zJnVnD9x7R6g/26510d3c39984a7cb58a1bf43dda452b",
    "ecs_task_definition": "EcsNativeBlueGreenStackEcsConstructTaskDefinitionF683F4B2:98"
}
{
    "level": "error",
    "time": "2026-02-11T05:39:13.086Z",
    "pid": 8,
    "hostname": "ip-10-10-8-89.ec2.internal",
    "req": {
        "id": 479,
        "method": "GET",
        "url": "/crash/",
        "query": {},
        "params": {},
        "headers": {
            "host": "ecsnat-albco-qzyosxmqsim4-1634003559.us-east-1.elb.amazonaws.com",
            "x-real-ip": "10.10.8.40",
            "x-forwarded-for": "<送信元IPアドレス>, 10.10.8.40",
            "x-forwarded-proto": "http",
            "connection": "close",
            "x-forwarded-port": "80",
            "x-amzn-trace-id": "Root=1-698c1601-5ec60d115f6377e539ba7666",
            "cookie": "connect.sid=s%3AkdwCTdPnOMbapxgvwkYpR3T2Y1Ykw_eW.cef%2Bw5X7jVYHTqDmz0m8XtFUePmZOE225Vy9JSE%2B4uQ",
            "user-agent": "curl/8.7.1",
            "accept": "*/*"
        },
        "remoteAddress": "127.0.0.1",
        "remotePort": 33256
    },
    "trace_id": "698c160176b2820f3142596543b58e08",
    "span_id": "84537a0cf5432a39",
    "trace_flags": "01",
    "err": {
        "type": "Error",
        "message": "Application crash test - intentional exception",
        "stack": "Error: Application crash test - intentional exception\n    at /app/dist/router.js:218:11\n    at Layer.handle [as handle_request] (/app/node_modules/.pnpm/express@4.22.1/node_modules/express/lib/router/layer.js:95:5)\n    at next (/app/node_modules/.pnpm/express@4.22.1/node_modules/express/lib/router/route.js:149:13)\n    at Route.dispatch (/app/node_modules/.pnpm/express@4.22.1/node_modules/express/lib/router/route.js:119:3)\n    at patched (/otel-auto-instrumentation/node_modules/@opentelemetry/instrumentation-express/build/src/instrumentation.js:210:37)\n    at Layer.handle [as handle_request] (/app/node_modules/.pnpm/express@4.22.1/node_modules/express/lib/router/layer.js:95:5)\n    at /app/node_modules/.pnpm/express@4.22.1/node_modules/express/lib/router/index.js:284:15\n    at router.process_params (/app/node_modules/.pnpm/express@4.22.1/node_modules/express/lib/router/index.js:346:12)\n    at next (/app/node_modules/.pnpm/express@4.22.1/node_modules/express/lib/router/index.js:280:10)\n    at router.handle (/app/node_modules/.pnpm/express@4.22.1/node_modules/express/lib/router/index.js:175:3)"
    },
    "msg": "Error occurred",
    "container_id": "26510d3c39984a7cb58a1bf43dda452b-0527074092",
    "container_name": "app",
    "source": "stderr",
    "ecs_cluster": "EcsNativeBlueGreenStack-EcsConstructCluster14AE103B-zJnVnD9x7R6g",
    "ecs_task_arn": "arn:aws:ecs:us-east-1:<AWSアカウントID>:task/EcsNativeBlueGreenStack-EcsConstructCluster14AE103B-zJnVnD9x7R6g/26510d3c39984a7cb58a1bf43dda452b",
    "ecs_task_definition": "EcsNativeBlueGreenStackEcsConstructTaskDefinitionF683F4B2:98"
}
{
    "level": "error",
    "time": "2026-02-11T05:39:13.088Z",
    "pid": 8,
    "hostname": "ip-10-10-8-89.ec2.internal",
    "req": {
        "id": 479,
        "method": "GET",
        "url": "/crash/",
        "query": {},
        "params": {},
        "headers": {
            "host": "ecsnat-albco-qzyosxmqsim4-1634003559.us-east-1.elb.amazonaws.com",
            "x-real-ip": "10.10.8.40",
            "x-forwarded-for": "<送信元IPアドレス>, 10.10.8.40",
            "x-forwarded-proto": "http",
            "connection": "close",
            "x-forwarded-port": "80",
            "x-amzn-trace-id": "Root=1-698c1601-5ec60d115f6377e539ba7666",
            "cookie": "connect.sid=s%3AkdwCTdPnOMbapxgvwkYpR3T2Y1Ykw_eW.cef%2Bw5X7jVYHTqDmz0m8XtFUePmZOE225Vy9JSE%2B4uQ",
            "user-agent": "curl/8.7.1",
            "accept": "*/*"
        },
        "remoteAddress": "127.0.0.1",
        "remotePort": 33256
    },
    "trace_id": "698c160176b2820f3142596543b58e08",
    "span_id": "84537a0cf5432a39",
    "trace_flags": "01",
    "res": {
        "statusCode": 500,
        "headers": {
            "x-powered-by": "Express",
            "content-type": "application/json; charset=utf-8",
            "content-length": "33",
            "etag": "W/\"21-Fau8GdrOCOyGNNH/IiTxy2DuMu0\""
        }
    },
    "err": {
        "type": "Error",
        "message": "failed with status code 500",
        "stack": "Error: failed with status code 500\n    at onResFinished (/app/node_modules/.pnpm/pino-http@10.5.0/node_modules/pino-http/logger.js:115:39)\n    at ServerResponse.onResponseComplete (/app/node_modules/.pnpm/pino-http@10.5.0/node_modules/pino-http/logger.js:178:14)\n    at /otel-auto-instrumentation/node_modules/@opentelemetry/context-async-hooks/build/src/AbstractAsyncHooksContextManager.js:50:55\n    at AsyncLocalStorage.run (node:internal/async_local_storage/async_context_frame:59:14)\n    at AsyncLocalStorageContextManager.with (/otel-auto-instrumentation/node_modules/@opentelemetry/context-async-hooks/build/src/AsyncLocalStorageContextManager.js:33:40)\n    at ServerResponse.contextWrapper (/otel-auto-instrumentation/node_modules/@opentelemetry/context-async-hooks/build/src/AbstractAsyncHooksContextManager.js:50:32)\n    at ServerResponse.emit (node:events:520:35)\n    at onFinish (node:_http_outgoing:1026:10)\n    at callback (node:internal/streams/writable:764:21)\n    at afterWrite (node:internal/streams/writable:708:5)"
    },
    "responseTime": 5,
    "msg": "request errored",
    "container_id": "26510d3c39984a7cb58a1bf43dda452b-0527074092",
    "container_name": "app",
    "source": "stderr",
    "ecs_cluster": "EcsNativeBlueGreenStack-EcsConstructCluster14AE103B-zJnVnD9x7R6g",
    "ecs_task_arn": "arn:aws:ecs:us-east-1:<AWSアカウントID>:task/EcsNativeBlueGreenStack-EcsConstructCluster14AE103B-zJnVnD9x7R6g/26510d3c39984a7cb58a1bf43dda452b",
    "ecs_task_definition": "EcsNativeBlueGreenStackEcsConstructTaskDefinitionF683F4B2:98"
}
The logs contain the trace ID 698c160176b2820f3142596543b58e08 in W3C format and correlation works correctly. It seems there's no need to convert it to X-Ray format like 1-698c1601-76b2820f3142596543b58e08.
I can also see when dependency availability is low.
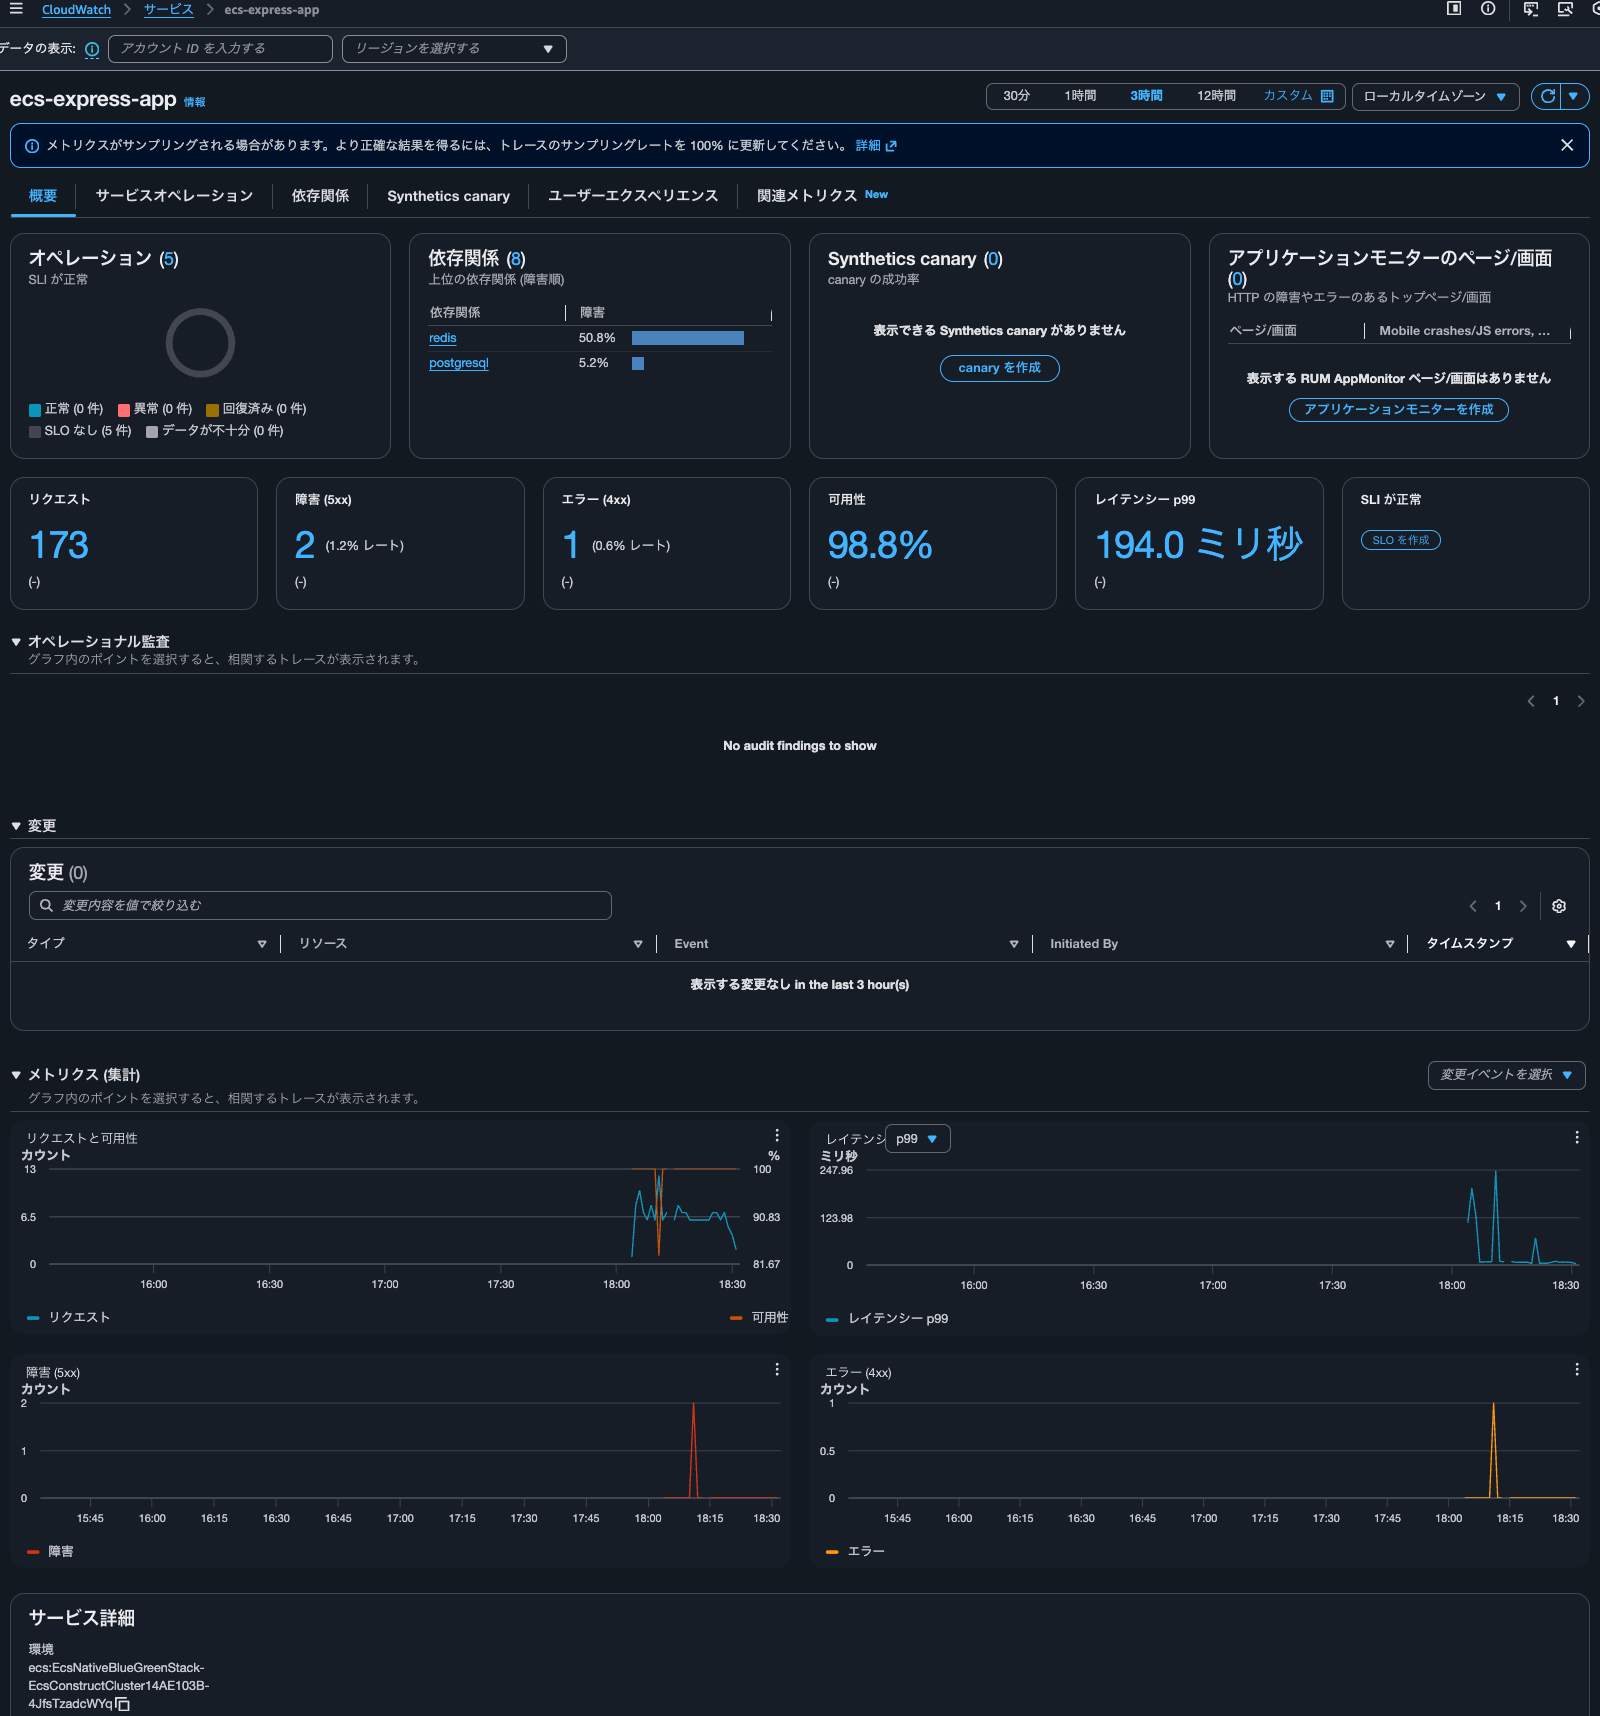
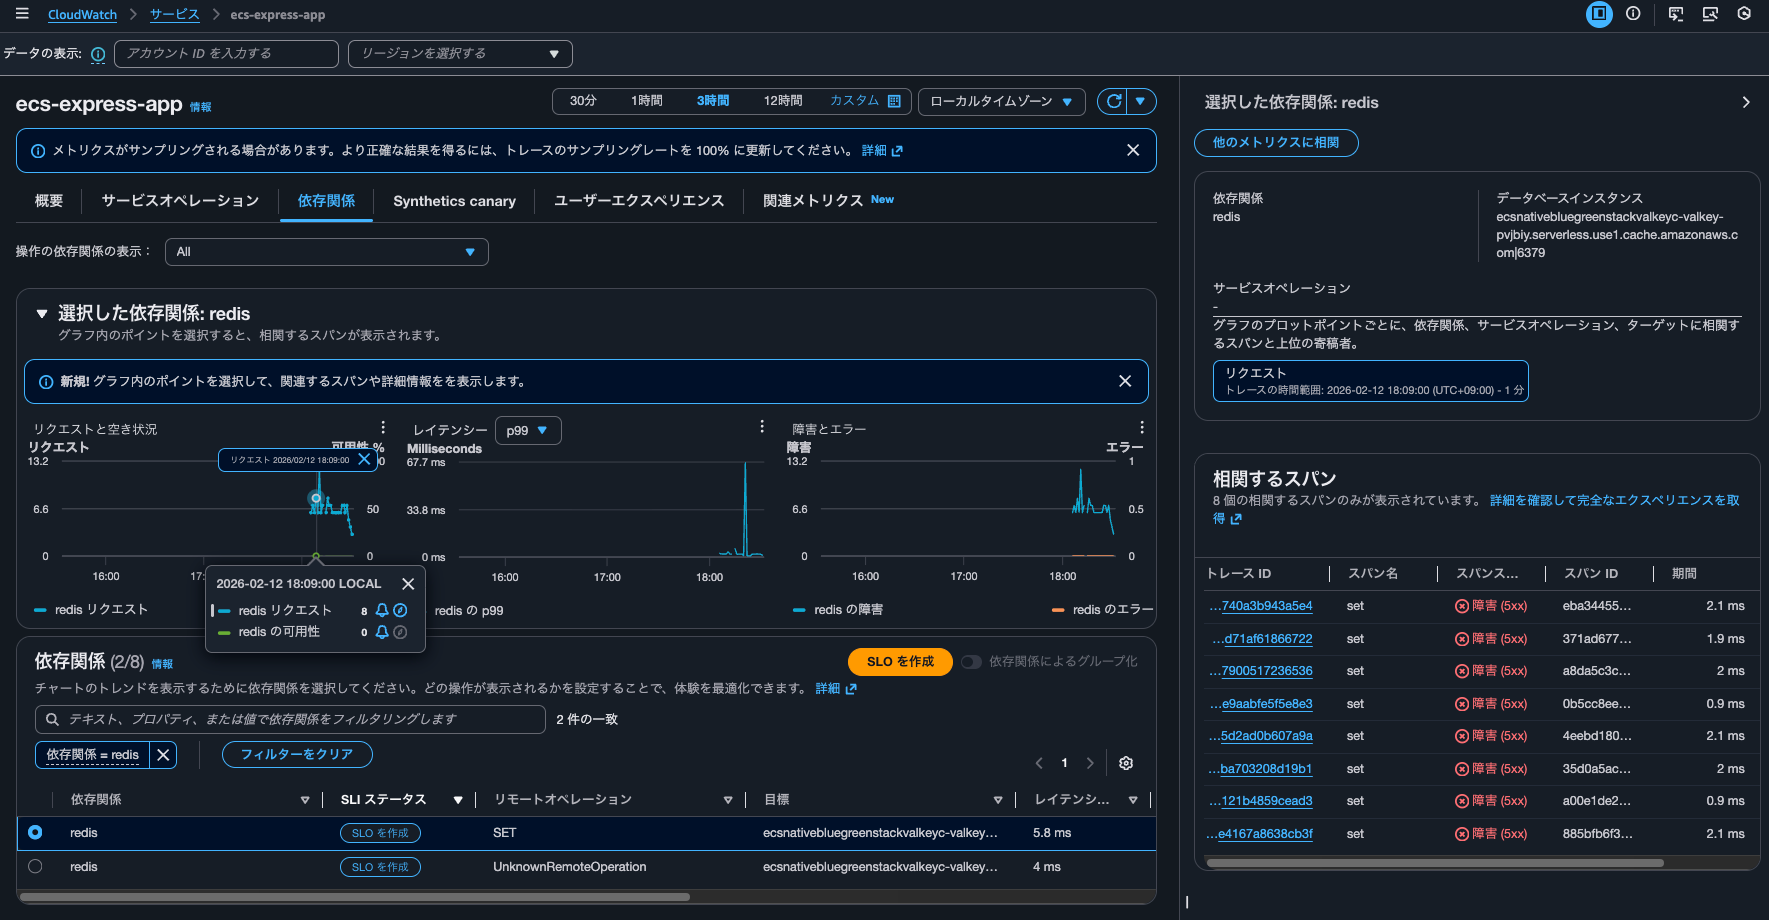
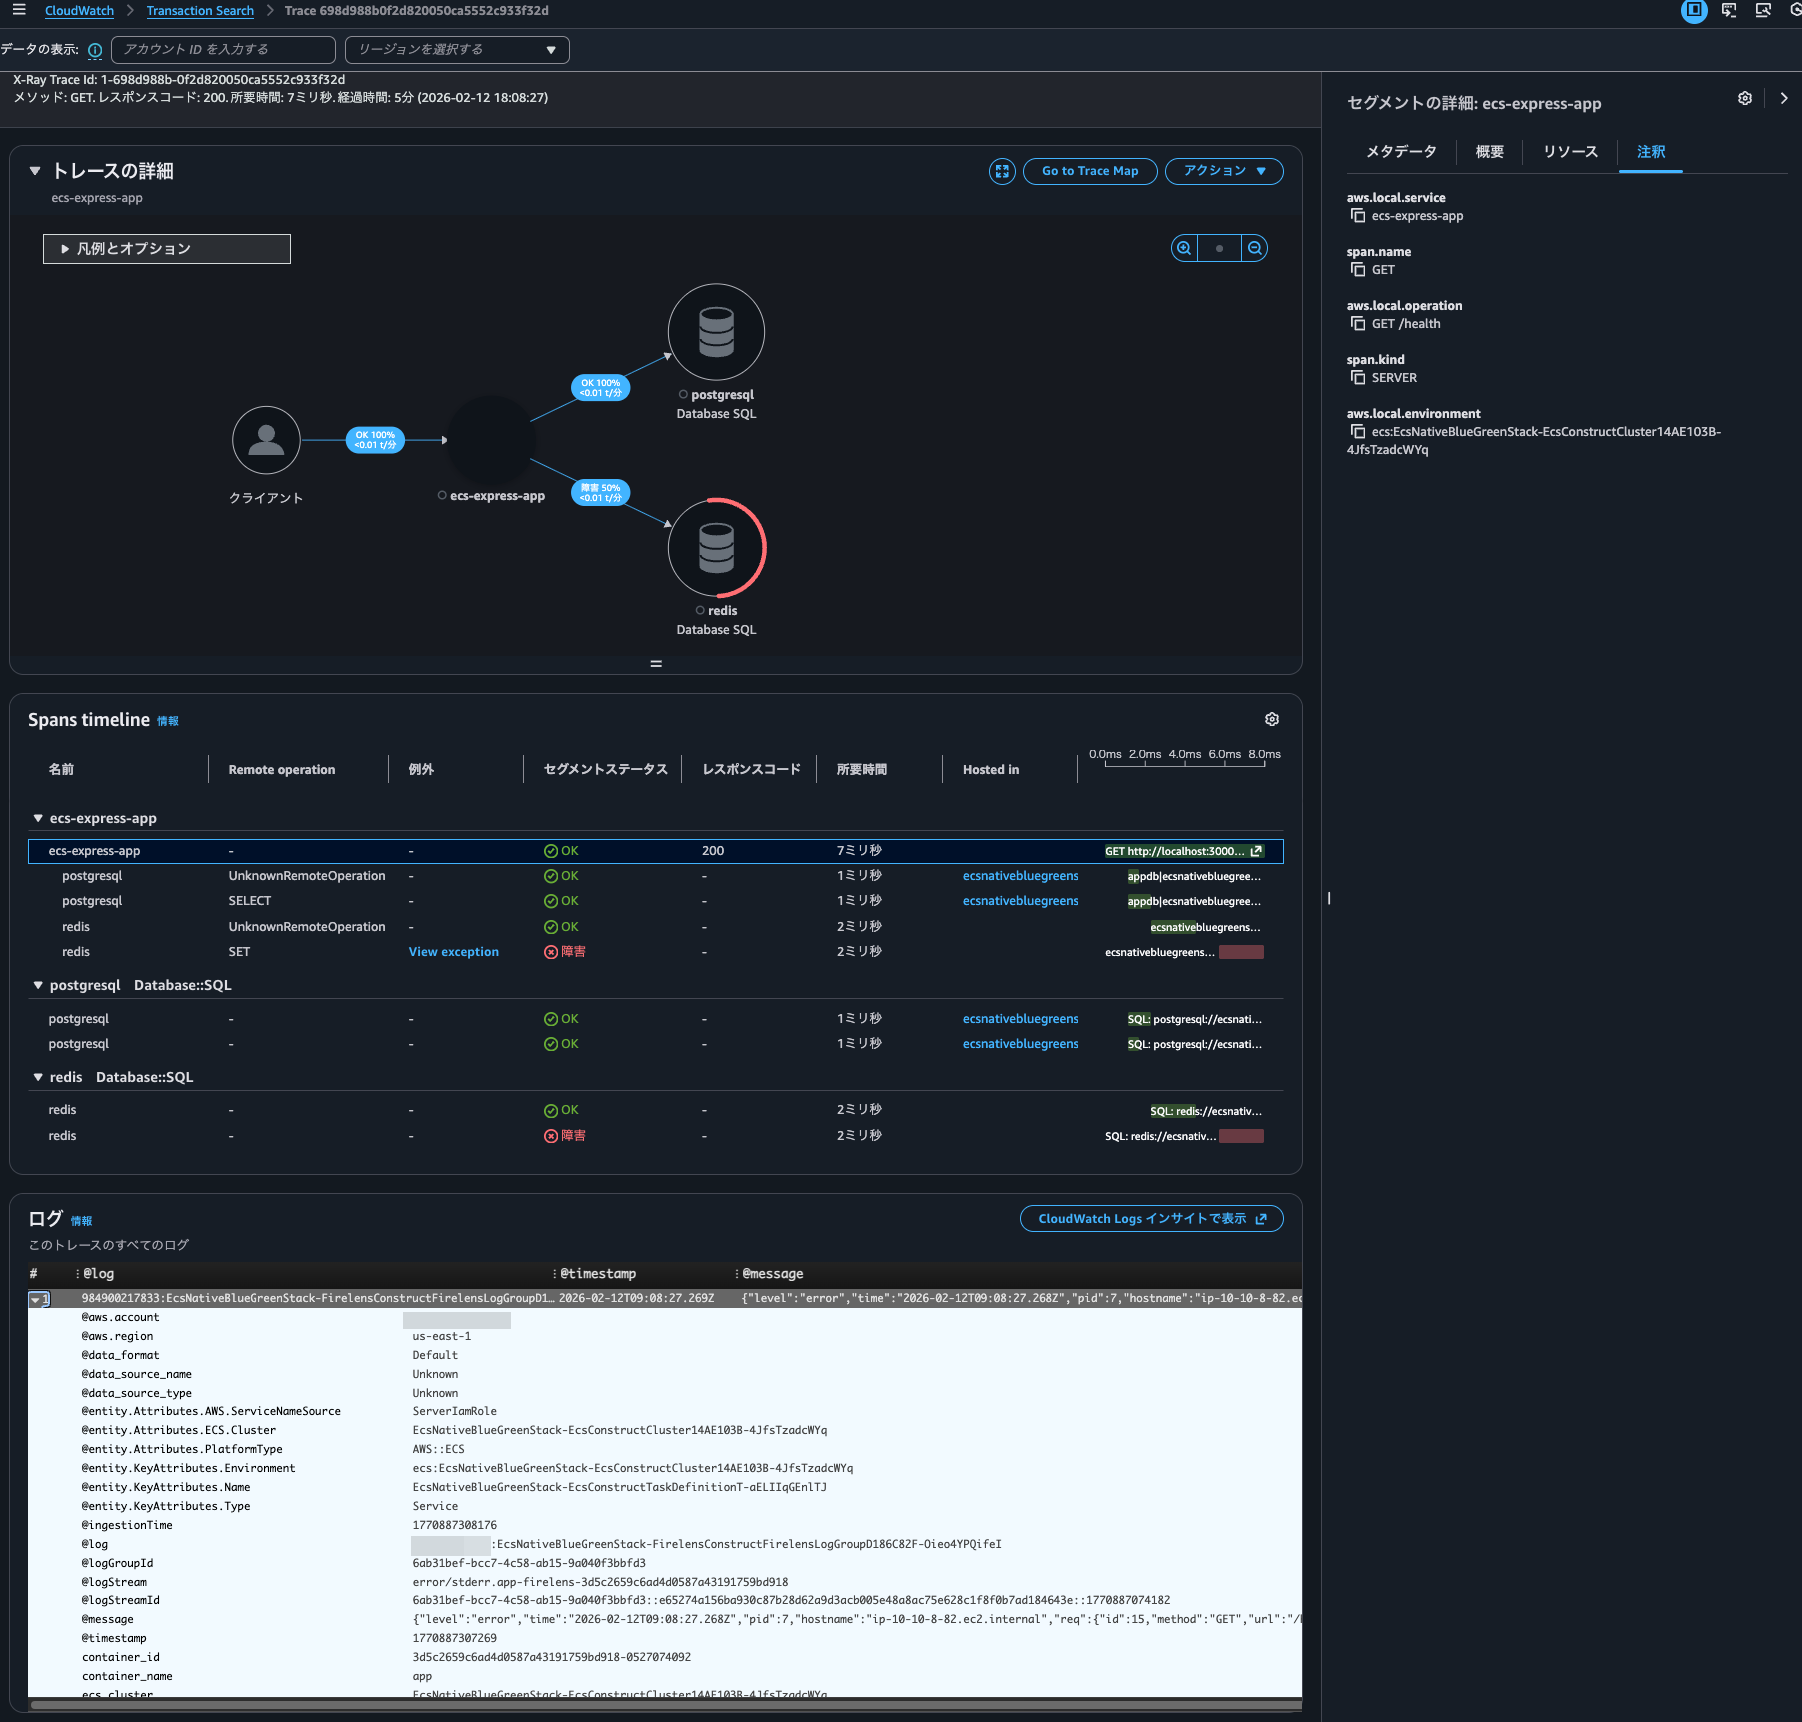
The logs for this event are as follows:
{
    "level": "error",
    "time": "2026-02-12T09:08:27.268Z",
    "pid": 7,
    "hostname": "ip-10-10-8-82.ec2.internal",
    "req": {
        "id": 15,
        "method": "GET",
        "url": "/health",
        "query": {},
        "params": {},
        "headers": {
            "host": "localhost:3000",
            "user-agent": "Wget",
            "accept": "*/*",
            "connection": "close"
        },
        "remoteAddress": "127.0.0.1",
        "remotePort": 57732
    },
    "trace_id": "698d988b0f2d820050ca5552c933f32d",
    "span_id": "f9ff425ef6931901",
    "trace_flags": "01",
    "err": {
        "type": "ReplyError",
        "message": "ERR syntax error",
        "stack": "ReplyError: ERR syntax error\n    at parseError (/app/node_modules/.pnpm/redis-parser@3.0.0/node_modules/redis-parser/lib/parser.js:179:12)\n    at parseType (/app/node_modules/.pnpm/redis-parser@3.0.0/node_modules/redis-parser/lib/parser.js:302:14)",
        "command": {
            "name": "set",
            "args": [
                "sess:st2zrsEzLyFlzb5i4XocReBSUhmyjgRz",
                "{\"cookie\":{\"originalMaxAge\":86400000,\"expires\":\"2026-02-13T09:08:27.265Z\",\"secure\":false,\"httpOnly\":true,\"path\":\"/\"}}",
                "[object Object]"
            ]
        }
    },
    "msg": "Error occurred",
    "container_id": "3d5c2659c6ad4d0587a43191759bd918-0527074092",
    "container_name": "app",
    "source": "stderr",
    "ecs_cluster": "EcsNativeBlueGreenStack-EcsConstructCluster14AE103B-4JfsTzadcWYq",
    "ecs_task_arn": "arn:aws:ecs:us-east-1:<AWSアカウントID>:task/EcsNativeBlueGreenStack-EcsConstructCluster14AE103B-4JfsTzadcWYq/3d5c2659c6ad4d0587a43191759bd918",
    "ecs_task_definition": "EcsNativeBlueGreenStackEcsConstructTaskDefinitionF683F4B2:103"
}
When checking the trace details by clicking on the trace ID, the Logs Insights execution history showed the following queries:
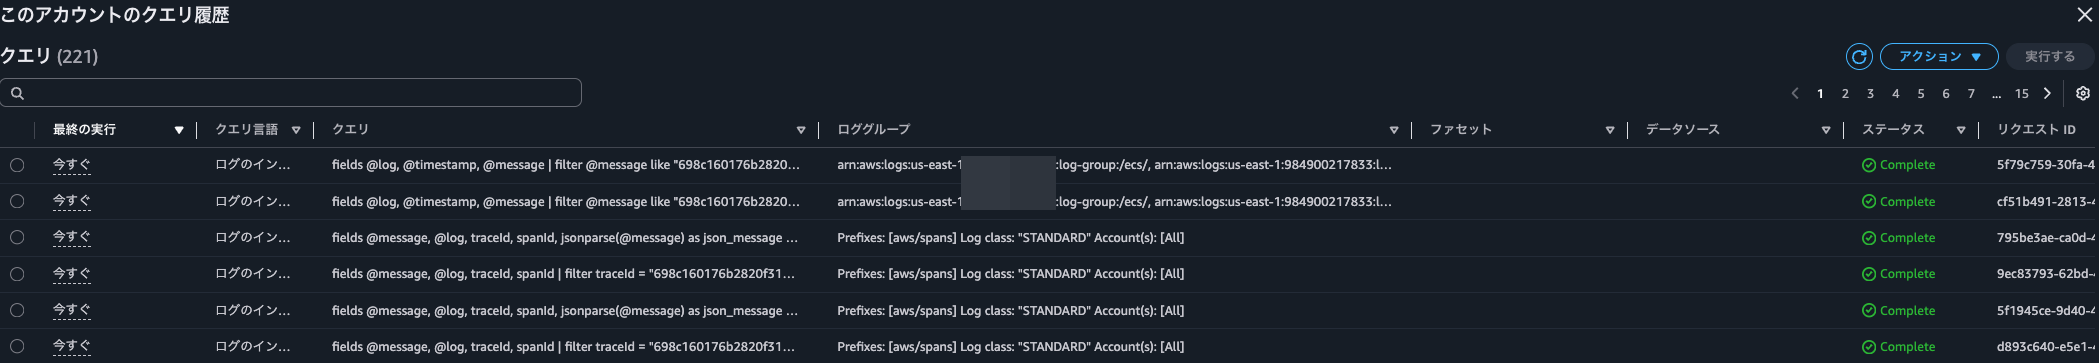
fields @message, @log, traceId, spanId | filter traceId = "698c160176b2820f3142596543b58e08" | sort @timestamp desc | limit 10000
fields @message, @log, traceId, spanId, jsonparse(@message) as json_message | unnest json_message.links into link | filter link.traceId = "698c160176b2820f3142596543b58e08" | sort @timestamp desc | limit 10000
fields @log, @timestamp, @message
| filter @message like "698c160176b2820f3142596543b58e08" or @message like "8c1601762820f3142596543b58e08"
| sort @timestamp, @message desc
fields @log, @timestamp, @message
| filter @message like "698c160176b2820f3142596543b58e08" or @message like "8c1601762820f3142596543b58e08"
| sort @timestamp, @message desc
In other words, three types of queries are being executed twice each.
Based on the log group names in the query, the last two queries are likely responsible for log correlation.
Here is the CloudTrail event for this:
{
    "eventVersion": "1.11",
    "userIdentity": {
        "type": "AssumedRole",
        "principalId": "<プリンシパルID>",
        "arn": "arn:aws:sts::<AWSアカウントID>:assumed-role/<IAMロール名>/<セッション名>",
        "accountId": "<AWSアカウントID>",
        "accessKeyId": "<アクセスキー>",
        "sessionContext": {
            "sessionIssuer": {
                "type": "Role",
                "principalId": "<プリンシパルID>",
                "arn": "arn:aws:iam::<AWSアカウントID>:role/<IAMロール名>",
                "accountId": "<AWSアカウントID>",
                "userName": "<IAMユーザー名>"
            },
            "attributes": {
                "creationDate": "2026-02-11T05:38:53Z",
                "mfaAuthenticated": "true"
            }
        }
    },
    "eventTime": "2026-02-11T05:45:59Z",
    "eventSource": "logs.amazonaws.com",
    "eventName": "StartQuery",
    "awsRegion": "us-east-1",
    "sourceIPAddress": "<送信元IPアドレス>",
    "userAgent": "Mozilla/5.0 (Macintosh; Intel Mac OS X 10_15_7) AppleWebKit/537.36 (KHTML, like Gecko) Chrome/144.0.0.0 Safari/537.36",
    "requestParameters": {
        "logGroupNames": [
            "arn:aws:logs:us-east-1:<AWSアカウントID>:log-group:/ecs/",
            "arn:aws:logs:us-east-1:<AWSアカウントID>:log-group:/ecs/default-nginx-5d29",
            "arn:aws:logs:us-east-1:<AWSアカウントID>:log-group:/ecs/ecs-aws-firelens-sidecar-container",
            "arn:aws:logs:us-east-1:<AWSアカウントID>:log-group:/ecs/ecs-aws-otel-sidecar-collector",
            "arn:aws:logs:us-east-1:<AWSアカウントID>:log-group:/ecs/nginx",
            "arn:aws:logs:us-east-1:<AWSアカウントID>:log-group:EcsNativeBlueGreenStack-FirelensConstructFirelensLogGroupD186C82F-wTQ4890Mp8e9"
        ],
        "startTime": 1770788338,
        "endTime": 1770788383,
        "queryString": "fields @log, @timestamp, @message\n| filter @message like \"698c160176b2820f3142596543b58e08\" or @message like \"8c1601762820f3142596543b58e08\"\n| sort @timestamp, @message desc",
        "dryRun": false
    },
    "responseElements": null,
    "additionalEventData": {
        "queryId": "5f79c759-30fa-45e5-adff-e68542d98ab0"
    },
    "requestID": "3f4c9697-9f6f-4213-891d-3f72959a2916",
    "eventID": "cc9165a8-ecda-4992-9498-dbe332ebce96",
    "readOnly": true,
    "resources": [
        {
            "accountId": "<AWSアカウントID>",
            "type": "AWS::Logs::LogGroup",
            "ARN": "arn:aws:logs:us-east-1:<AWSアカウントID>:log-group:/ecs/"
        },
        {
            "accountId": "<AWSアカウントID>",
            "type": "AWS::Logs::LogGroup",
            "ARN": "arn:aws:logs:us-east-1:<AWSアカウントID>:log-group:/ecs/default-nginx-5d29"
        },
        {
            "accountId": "<AWSアカウントID>",
            "type": "AWS::Logs::LogGroup",
            "ARN": "arn:aws:logs:us-east-1:<AWSアカウントID>:log-group:/ecs/ecs-aws-firelens-sidecar-container"
        },
        {
            "accountId": "<AWSアカウントID>",
            "type": "AWS::Logs::LogGroup",
            "ARN": "arn:aws:logs:us-east-1:<AWSアカウントID>:log-group:/ecs/ecs-aws-otel-sidecar-collector"
        },
        {
            "accountId": "<AWSアカウントID>",
            "type": "AWS::Logs::LogGroup",
            "ARN": "arn:aws:logs:us-east-1:<AWSアカウントID>:log-group:/ecs/nginx"
        },
        {
            "accountId": "<AWSアカウントID>",
            "type": "AWS::Logs::LogGroup",
            "ARN": "arn:aws:logs:us-east-1:<AWSアカウントID>:log-group:EcsNativeBlueGreenStack-FirelensConstructFirelensLogGroupD186C82F-wTQ4890Mp8e9"
        }
    ],
    "eventType": "AwsApiCall",
    "apiVersion": "20140328",
    "managementEvent": true,
    "recipientAccountId": "<AWSアカウントID>",
    "eventCategory": "Management",
    "tlsDetails": {
        "tlsVersion": "TLSv1.3",
        "cipherSuite": "TLS_AES_128_GCM_SHA256",
        "clientProvidedHostHeader": "logs.us-east-1.amazonaws.com"
    },
    "sessionCredentialFromConsole": "true"
}
From "startTime": 1770788338 and "endTime": 1770788383, we can see it's searching for relevant logs within a 45-second window in the specified log groups.
What's concerning is that log groups starting with /ecs/ like /ecs/ and /ecs/default-nginx-5d29 are included in the query targets even though this wasn't specified.
Checking CloudTrail, the system was searching for log groups starting with /ecs/ when performing log correlation:
{
    "eventVersion": "1.11",
    "userIdentity": {
        "type": "AssumedRole",
        "principalId": "<プリンシパルID>",
        "arn": "arn:aws:sts::<AWSアカウントID>:assumed-role/<IAMロール名>/<セッション名>",
        "accountId": "<AWSアカウントID>",
        "accessKeyId": "<アクセスキー>",
        "sessionContext": {
            "sessionIssuer": {
                "type": "Role",
                "principalId": "<プリンシパルID>",
                "arn": "arn:aws:iam::<AWSアカウントID>:role/<IAMロール名>",
                "accountId": "<AWSアカウントID>",
                "userName": "<IAMユーザー名>"
            },
            "attributes": {
                "creationDate": "2026-02-11T05:38:53Z",
                "mfaAuthenticated": "true"
            }
        }
    },
    "eventTime": "2026-02-11T06:02:54Z",
    "eventSource": "logs.amazonaws.com",
    "eventName": "DescribeLogGroups",
    "awsRegion": "us-east-1",
    "sourceIPAddress": "<送信元IPアドレス>",
    "userAgent": "Mozilla/5.0 (Macintosh; Intel Mac OS X 10_15_7) AppleWebKit/537.36 (KHTML, like Gecko) Chrome/144.0.0.0 Safari/537.36",
    "requestParameters": {
        "logGroupNamePrefix": "/ecs/",
        "includeLinkedAccounts": true
    },
    "responseElements": null,
    "requestID": "c59cb761-d8cf-4c71-aa7e-24e7ca4a9cb7",
    "eventID": "46c30084-8d1d-4484-a167-0b4821b413fc",
    "readOnly": true,
    "resources": [
        {
            "accountId": "<AWSアカウントID>",
            "type": "AWS::Logs::LogGroup",
            "ARN": "arn:aws:logs:us-east-1:<AWSアカウントID>:log-group:/ecs/"
        },
        {
            "accountId": "<AWSアカウントID>",
            "type": "AWS::Logs::LogGroup",
            "ARN": "arn:aws:logs:us-east-1:<AWSアカウントID>:log-group:/ecs/default-nginx-5d29"
        },
        {
            "accountId": "<AWSアカウントID>",
            "type": "AWS::Logs::LogGroup",
            "ARN": "arn:aws:logs:us-east-1:<AWSアカウントID>:log-group:/ecs/ecs-aws-firelens-sidecar-container"
        },
        {
            "accountId": "<AWSアカウントID>",
            "type": "AWS::Logs::LogGroup",
            "ARN": "arn:aws:logs:us-east-1:<AWSアカウントID>:log-group:/ecs/ecs-aws-otel-sidecar-collector"
        },
        {
            "accountId": "<AWSアカウントID>",
            "type": "AWS::Logs::LogGroup",
            "ARN": "arn:aws:logs:us-east-1:<AWSアカウントID>:log-group:/ecs/nginx"
        }
    ],
    "eventType": "AwsApiCall",
    "apiVersion": "20140328",
    "managementEvent": true,
    "recipientAccountId": "<AWSアカウントID>",
    "eventCategory": "Management",
    "tlsDetails": {
        "tlsVersion": "TLSv1.3",
        "cipherSuite": "TLS_AES_128_GCM_SHA256",
        "clientProvidedHostHeader": "logs.us-east-1.amazonaws.com"
    },
    "sessionCredentialFromConsole": "true"
}
Personally, I'd prefer to disable this feature.
There are billing concerns for Logs Insights if large volumes of logs are flowing through log groups starting with /ecs/. Since it's using filter @message like "<traceID>" to search the entire message body, field indexing won't be effective.
If anyone knows how to opt out of including log groups starting with /ecs/ in log correlation, I'd appreciate the information.
Personally, I'm considering avoiding creating log groups that start with /ecs/ as a workaround.
Log correlation can be set up easily
I tried correlating traces and logs with CloudWatch Application Signals.
It was easier than I expected because you just need to use a supported logger and specify the log group name with an environment variable.
By the way, since I'm only sending error logs to CloudWatch Logs this time, log correlation isn't possible when an HTTP status code of 200 is returned.
All logs are output to S3 buckets via Data Firehose. If you want to find logs with HTTP status code 200, search using the trace ID. Logs are recorded as follows:
{
  "level": "info",
  "time": "2026-02-12T01:48:36.868Z",
  "pid": 7,
  "hostname": "ip-10-10-8-104.ec2.internal",
  "req": {
    "id": 55,
    "method": "GET",
    "url": "/",
    "query": {},
    "params": {},
    "headers": {
      "host": "ecsnat-albco-shaasnih0xar-1652870936.us-east-1.elb.amazonaws.com",
      "x-real-ip": "10.10.8.43",
      "x-forwarded-for": "<source IP address>, 10.10.8.43",
      "x-forwarded-proto": "http",
      "connection": "close",
      "x-forwarded-port": "80",
      "x-amzn-trace-id": "Root=1-698d3174-5876cff8075b183978fe1d65",
      "accept": "*/*",
      "user-agent": "curl/8.7.1"
    },
    "remoteAddress": "127.0.0.1",
    "remotePort": 35448
  },
  "trace_id": "698d3174fa6d5a5d85e08988b96c738d",
  "span_id": "6f704133bb94ada4",
  "trace_flags": "01",
  "res": {
    "statusCode": 200,
    "headers": {
      "x-powered-by": "Express",
      "content-type": "application/json; charset=utf-8",
      "content-length": "427",
      "etag": "W/\"1ab-kBv3WE96jXCcAIdDtz3e81LLMik\"",
      "set-cookie": [
        "connect.sid=s%3A_ykD64hKoji4n7SB71zDtgljHN5UDJBx.7y5uIGbxZsGgM4knIOw1Pt7BAOhIo%2FA6NLGKotG6hoU; Path=/; Expires=Fri, 13 Feb 2026 01:48:36 GMT; HttpOnly"
      ]
    }
  },
  "responseTime": 292,
  "msg": "request completed",
  "container_id": "c9979e7d4b08471b8285c6b3ecfd5cfb-0527074092",
  "container_name": "app",
  "source": "stdout",
  "ecs_cluster": "EcsNativeBlueGreenStack-EcsConstructCluster14AE103B-VoUD00RfbaSW",
  "ecs_task_arn": "arn:aws:ecs:us-east-1:<AWS Account ID>:task/EcsNativeBlueGreenStack-EcsConstructCluster14AE103B-VoUD00RfbaSW/c9979e7d4b08471b8285c6b3ecfd5cfb",
  "ecs_task_definition": "EcsNativeBlueGreenStackEcsConstructTaskDefinitionF683F4B2:102",
  "datetime": "2026-02-12T01:48:36.869Z"
}
I hope this article helps someone.
This was nonpi (@non____97) from the Consulting Department of the Cloud Business Division!