
I tried out CloudWatch Database Insights with support for PostgreSQL on EC2

This page has been translated by machine translation. View original
Introduction
On September 1, 2026, CloudWatch Database Insights added support for self-managed PostgreSQL. PostgreSQL that you operate yourself now appears in the same Database Insights dashboard as RDS and Aurora.
I set this up on PostgreSQL 16 running on a t3.micro EC2 instance and verified what appears in the console and what data is delivered to CloudWatch. I also traced how the agent collects and sends data from the effective configuration after deployment.
What Was Tested
The CloudWatch agent runs on the same host as PostgreSQL. The user guide prerequisites also state that monitoring remote databases is not supported. The connection target is localhost, and server logs are read from a local file. In this test, both were co-located on a single EC2 instance.
Test Environment
The environment is a single EC2 instance in us-west-2. Amazon Linux 2023 was installed on a t3.micro (gp3 8GB). The installed software was PostgreSQL 16.15 (postgresql16-server-16.15-1.amzn2023.0.1.x86_64). The CloudWatch agent is version 1.300072.0b1766, the latest version obtained from the S3 distribution URL. Shell access is via Session Manager only, with no inbound rules open in the security group.
Two managed policies were attached to the instance profile.
  InstanceRole:
    Type: AWS::IAM::Role
    Properties:
      AssumeRolePolicyDocument:
        Version: '2012-10-17'
        Statement:
          - Effect: Allow
            Principal:
              Service: ec2.amazonaws.com
            Action: sts:AssumeRole
      ManagedPolicyArns:
        - arn:aws:iam::aws:policy/AmazonSSMManagedInstanceCore
        - arn:aws:iam::aws:policy/CloudWatchAgentServerPolicy
AmazonSSMManagedInstanceCore is the policy attached for Session Manager and Run Command. Database Insights only requires CloudWatchAgentServerPolicy.
This environment was created with CloudFormation.
aws cloudformation deploy \
  --region us-west-2 \
  --stack-name dbinsights-selfmanaged-pg \
  --template-file template.yaml \
  --capabilities CAPABILITY_IAM \
  --parameter-overrides InstanceType=t3.micro
PostgreSQL Configuration
Since Database Insights reads standard PostgreSQL views, PostgreSQL must be configured first. The following was added to postgresql.conf.
shared_preload_libraries = 'pg_stat_statements'
track_activities = on
track_activity_query_size = 4096
password_encryption = 'scram-sha-256'

pg_stat_statements.max = 10000
pg_stat_statements.track = all
pg_stat_statements.track_planning = on

logging_collector = on
log_directory = 'log'
log_filename = 'postgresql-%a.log'
log_rotation_age = 1d
log_rotation_size = 0
log_truncate_on_rotation = on
log_min_duration_statement = 500
log_line_prefix = '%m [%p] %q%u@%d '

compute_query_id = on
Since shared_preload_libraries is only read at startup, a restart rather than a reload is required for the change to take effect.
systemctl restart postgresql
Next, the extension was enabled, a monitoring user was created, and the connection was permitted. Since pg_stat_statements is an extension, it must be created for each database to be monitored.
CREATE EXTENSION IF NOT EXISTS pg_stat_statements;
CREATE ROLE cw_monitor WITH LOGIN PASSWORD '<password>';
GRANT pg_monitor TO cw_monitor;
# TYPE  DATABASE  USER         ADDRESS         METHOD
host    all       cw_monitor   127.0.0.1/32    scram-sha-256
host    all       cw_monitor   ::1/128         scram-sha-256
pg_hba.conf is evaluated from top to bottom, and the first matching line is used. The default configuration on Amazon Linux 2023 accepts loopback connections using ident, so these two lines must be placed above the existing lines. This can be applied with a reload.
systemctl reload postgresql
Granting the pg_monitor role allows reading pg_stat_activity and pg_stat_statements without superuser privileges. After applying the configuration, I connected to localhost as the monitoring user and verified that both views could be read.
Connecting as the monitoring user returned the following values.
postgres (PostgreSQL) 16.15

 activity_rows
---------------
             6
(1 row)

 statement_rows
----------------
             58
(1 row)

 shared_preload_libraries
--------------------------
 pg_stat_statements
(1 row)
Agent Configuration
Only one section needs to be added on the CloudWatch agent side. The contents of /opt/aws/amazon-cloudwatch-agent/etc/amazon-cloudwatch-agent.json are as follows.
{
  "agent": {
    "region": "us-west-2"
  },
  "opentelemetry": {
    "collect": {
      "database_insights": {
        "postgresql": [
          {
            "endpoint": "localhost:5432",
            "instance_name": "selfmanaged-pg-1",
            "username": "cw_monitor",
            "password_file": "/opt/aws/amazon-cloudwatch-agent/etc/pgpass",
            "logs": {
              "file_path": "/var/lib/pgsql/data/log/postgresql-*.log"
            }
          }
        ]
      }
    }
  }
}
The instance_name becomes the display name in the console. The password is placed in the file pointed to by password_file rather than in the configuration file. The format is libpq's pgpass.
Only six parameters can be specified: region, endpoint, instance_name, username, password_file, and logs.file_path. There is no parameter for selecting which metrics to collect. The parameter table in the user guide also lists only these six items. What was actually collected is described later.
The pgpass file was created and the configuration was loaded.
umask 077
printf 'localhost:5432:*:cw_monitor:%s\n' "$MON_PASS" \
  > /opt/aws/amazon-cloudwatch-agent/etc/pgpass
chown cwagent:cwagent /opt/aws/amazon-cloudwatch-agent/etc/pgpass

/opt/aws/amazon-cloudwatch-agent/bin/amazon-cloudwatch-agent-ctl \
  -a fetch-config -m ec2 -s \
  -c file:/opt/aws/amazon-cloudwatch-agent/etc/amazon-cloudwatch-agent.json
The pgpass file's owner was changed so the cwagent user could read it. After loading, the agent returned the following status.
{
  "status": "running",
  "starttime": "2026-09-03T01:53:35+00:00",
  "configstatus": "configured",
  "version": "1.300072.0b1766"
}
The configuration file as written contains no parameters for specifying collection intervals. The intervals appear in the effective configuration expanded by config-translator. The expanded amazon-cloudwatch-agent.yaml is 51,220 bytes. The collection intervals are as follows.
| Collection | Interval |
|---|---|
| postgresql/metrics_0 | 10s |
| query_sample_collection (pg_stat_activity) | 1s |
| top_query_collection (pg_stat_statements) | 1m |
| postgresql/metrics_perresource_0 | 1m |
| postgresql/events_0 | 10s |
| hostmetrics/opentelemetry | 30s |
Session samples are collected every second, with a maximum of 500 rows per collection. Top queries are collected every minute, targeting the top 200. Execution plans are retrieved up to 1,000 per interval and placed in a cache of 1,000 entries with a TTL of 1 hour.
The host metrics process scraper targets only processes matching post(gres|master).*. The filelog that tails the server log sets start_at to end and parses timestamps and severity using regular expressions. Log records where the username or role name is cw_monitor are dropped by a filter processor, so queries from the monitoring user itself do not appear in raw-events.
Data is delivered to CloudWatch every minute, and the difference in unique timestamps for events was 60 seconds for both pg_stat_statements-derived and pg_stat_activity-derived events. During periods without any load, there were time windows where no data points appeared.
Collection is performed by the agent connecting directly to PostgreSQL. The configured endpoint and username are expanded as-is in the postgresqlreceiver, with transport set to tcp. The password references pgpass as a passfile. The queries issued are SELECTs against standard views, targeting pg_stat_activity, pg_stat_statements, pg_stat_database, pg_locks, pg_stat_user_indexes, pg_stat_user_functions, pg_database_size(), SHOW max_connections, SHOW server_version, and others.
When observed without any load, there were 8 persistent idle connections from the monitoring user.
Data is transmitted by the agent in batches via OTLP/HTTP. PutMetricData is not used.
    otlphttp/metrics:
        metrics_endpoint: https://monitoring.us-west-2.amazonaws.com/v1/metrics
        compression: gzip
        encoding: proto
        sending_queue:
            enabled: true
            num_consumers: 10
            queue_size: 1000
        retry_on_failure:
            enabled: true
            initial_interval: 5s
            max_interval: 30s
            max_elapsed_time: 5m0s
            multiplier: 1.5
        timeout: 30s
    otlphttp/logs:
        logs_endpoint: https://logs.us-west-2.amazonaws.com/v1/logs
        compression: gzip
        encoding: proto
The batching conditions are written in the batch processor.
| Target | send_batch_size | send_batch_max_size | timeout |
|---|---|---|---|
| Metrics | 1000 | 1000 | 30s |
| Logs | 10000 | 10000 | 30s |
Authentication uses sigv4auth. The SigV4 service name is monitoring for metrics and logs for logs. Creation of log groups and log streams is handled by the awscloudwatchlogsprovisioner extension. The destination is determined by the x-aws-log-group and x-aws-log-stream headers set by headers_setter. The log-side batch holds the log group name and log stream name as metadata keys.
I also measured the cost of the collection itself. These are values from a single t3.micro instance, leaving it idle for 300 seconds after resetting pg_stat_statements with no load applied.
- Agent process CPU time was 7.40 seconds / 300 seconds, equivalent to 2.47% of 1 core
- Agent process RSS was 140,072 KB, with ps %MEM at 14.9%
- The monitoring user's queries totaled 980 calls / 221.94 ms combined
- Of these, only one query ran at 1-second intervals — the one reading pg_stat_activity — with 305 calls / 55.60 ms (mean 0.182 ms). The 19 queries at 10-second intervals had 35 calls each, and the one reading pg_stat_statements had 10 calls
- The query with the longest per-execution time was the one reading pg_database_size, with a mean of 1.535 ms
- The server log grew by only 22 lines over 300 seconds
The load on the DB side is small; the ongoing cost is 140 MB of memory and 2.5% CPU on the agent side. In a configuration where the agent is co-located with PostgreSQL on a t3.micro, memory will be the primary concern. As the number of SQL executions and the volume of query logs increase, the load on the collection side will also increase.
Whether collection has started can be determined from the agent log. The following lines appeared.
I! {"caller":"builders/builders.go:26","msg":"Development component. May change in the future."}
I! {"caller":"awscloudwatchlogsprovisionerextension@v0.124.1/extension.go:79","msg":"awscloudwatchlogsprovisioner started","region":"us-west-2"}
I! {"caller":"service@v0.124.0/service.go:289","msg":"Everything is ready. Begin running and processing data."}
I! {"caller":"fileconsumer/file.go:265","msg":"Started watching file","component":"fileconsumer","path":"/var/lib/pgsql/data/log/postgresql-Thu.log"}
Only the two policies shown in the test environment were granted, yet no AccessDenied entries appeared in the log. The collection pipeline configuration output in the same log includes postgresql/metrics_0, count/dbi_dbload, and signaltometrics/dbi_topsql.
Console Display
To generate data for the console, load was injected via SSM Run Command. For 10 minutes, I ran aggregation SELECTs against a table with 300,000 rows, INSERTs and UPDATEs, slow queries with pg_sleep, and transactions that updated the same row simultaneously.
The command sent was as follows. commands.json contained the SQL to create an orders table with 300,000 rows and the shell script to apply the above load.
aws ssm send-command \
  --region us-west-2 \
  --instance-ids i-xxxxxxxxxxxxxxxxx \
  --document-name AWS-RunShellScript \
  --parameters file://commands.json
The load period ran from 2026-09-03T01:54:23Z to 02:04:26Z. The top entry in PostgreSQL's pg_stat_statements was SELECT count(*) FROM orders WHERE note LIKE $1 AND amount > (random()*. It had 1,464 calls and a total_exec_time of 1,049,332.9 ms.
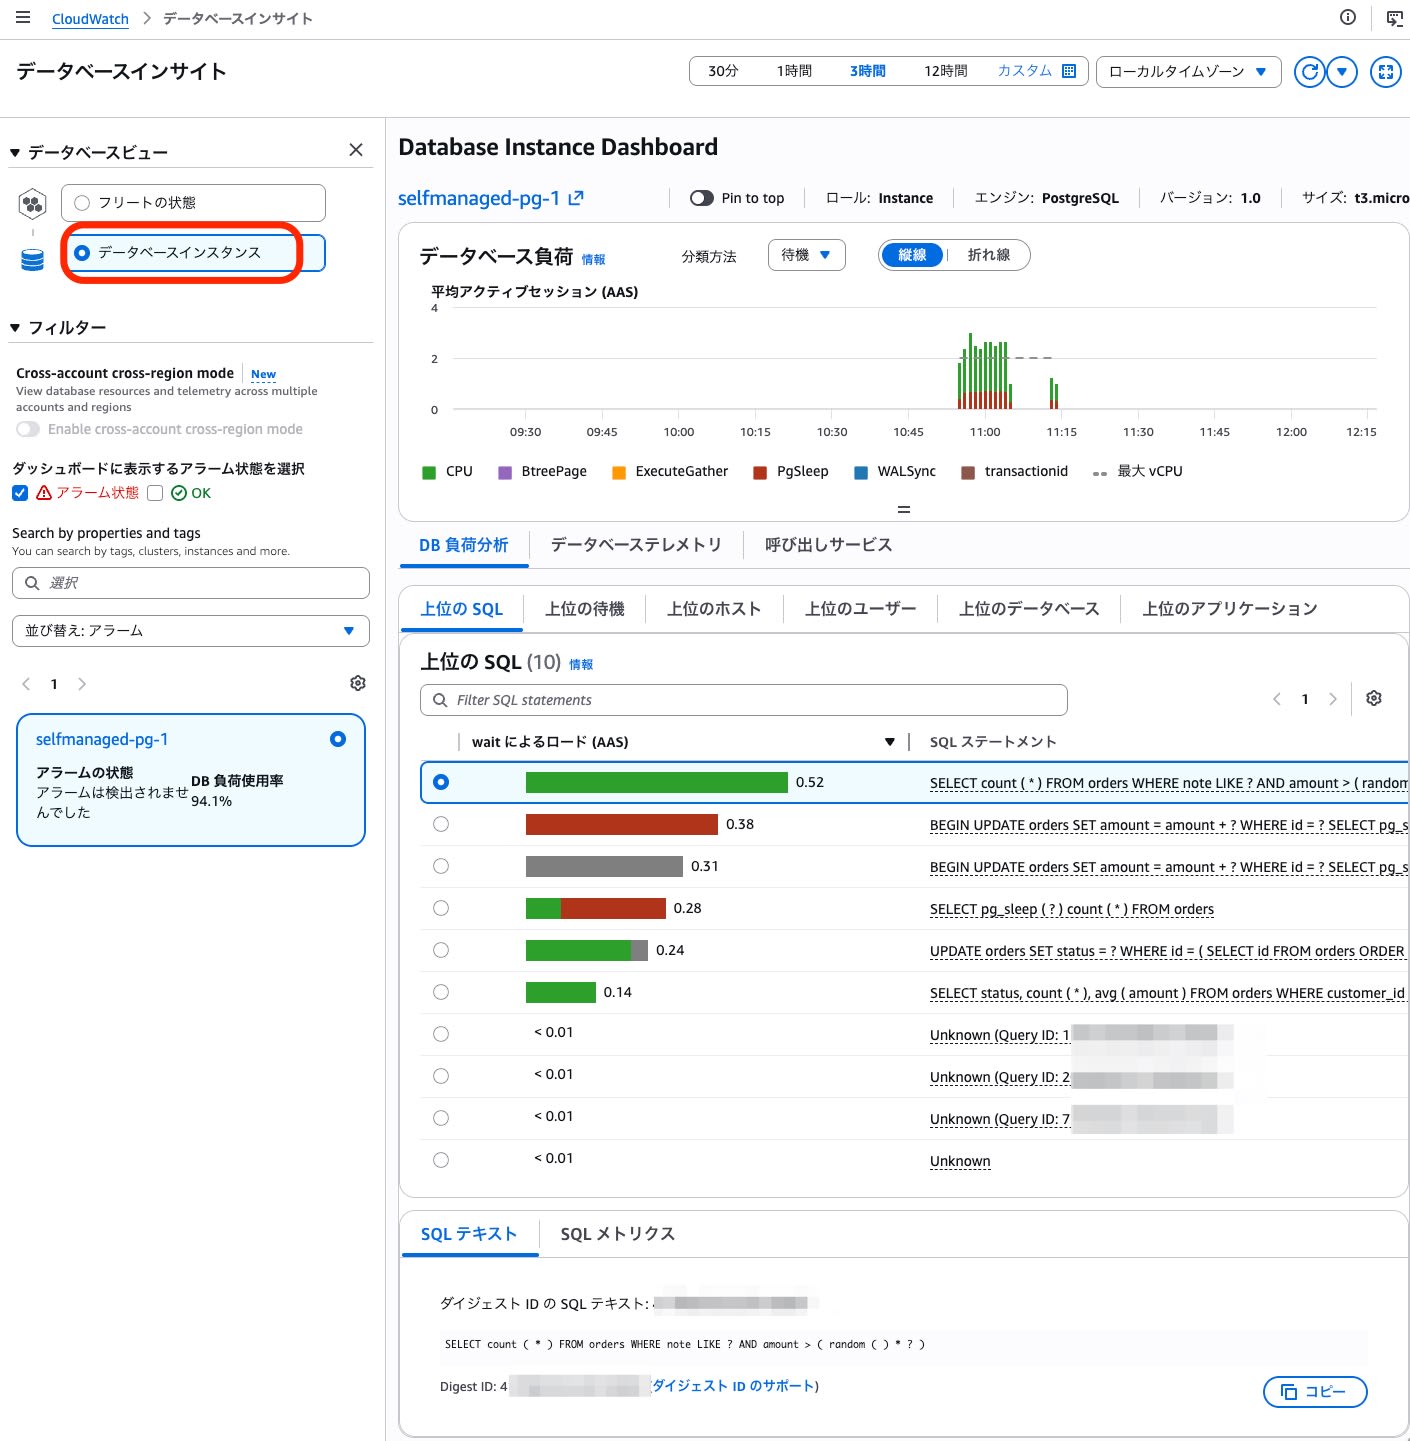
The database load graph, wait event legend, and list of top SQL are displayed together. The following is what appeared after applying load once to a single t3.micro instance.
The name shown in the database instance list was selfmanaged-pg-1, which is the instance_name from the agent configuration used as-is. The card displayed "DB Load Usage 94.1%", with a role of Instance, engine of PostgreSQL, and size of t3.micro in the header.
Database load is displayed as Average Active Sessions (AAS). A bar chart with a peak of 2–3 appeared during the load period. The legend shows CPU, BtreePage, ExecuteGather, PgSleep, WALSync, transactionid, and a dashed line for "Max vCPU".
There were 10 top SQL entries. The wait load (AAS) values from the top were 0.52, 0.38, 0.31, 0.28, 0.24, and 0.14. The remaining 4 were below 0.01. Of the 10 entries, 3 had no SQL text available and were displayed as Unknown with a Query ID. Immediately after opening the dashboard, it showed "Top SQL (0)" with "Loading data", after which 10 entries appeared.
There are two views — "Fleet Status" and "Database Instances" — and the Cross-account cross-region mode toggle is in the same position as for RDS.
Telemetry Delivered
The agent created two log groups.
/aws/self-managed-database-insights/postgresql/raw-events
/aws/self-managed-database-insights/postgresql/server-logs
Neither was created in the template. The log stream name for both follows the format i-xxxxxxxxxxxxxxxxx/selfmanaged-pg-1, combining the instance ID with the configured instance_name. These log groups are outside CloudFormation management, so they remain even after the stack is deleted.
OTel logs with literals replaced by ? were delivered to raw-events. Of the 223 events retrieved, 169 were statistics from pg_stat_statements and 54 were session samples from pg_stat_activity.
One event has the following structure.
{
  "resource": {
    "attributes": {
      "service.instance.id": "ip-10-20-x-x.us-west-2.compute.internal:5432",
      "cloud.provider": "aws",
      "cloud.platform": "aws_ec2",
      "cloud.region": "us-west-2",
      "cloud.account.id": "123456789012",
      "cloud.availability_zone": "us-west-2a",
      "host.id": "i-xxxxxxxxxxxxxxxxx",
      "host.image.id": "ami-0bea529386a62a2ad",
      "host.type": "t3.micro",
      "host.name": "ip-10-20-x-x.us-west-2.compute.internal",
      "db.system.name": "postgresql",
      "db.instance.name": "selfmanaged-pg-1",
      "deployment.environment.name": "aws_ec2:default",
      "cloud.resource_id": "arn:aws:ec2:us-west-2:123456789012:instance/i-xxxxxxxxxxxxxxxxx",
      "service.name": "unknown_service"
    },
    "schemaUrl": "https://opentelemetry.io/schemas/1.6.1"
  },
  "scope": {
    "name": "github.com/open-telemetry/opentelemetry-collector-contrib/receiver/postgresqlreceiver",
    "version": "1.300072.0b1766",
    "attributes": {
      "cloudwatch.source": "cloudwatch-agent",
      "cloudwatch.solution": "otel-database-insights"
    }
  },
  "timeUnixNano": 1788400477424151302,
  "observedTimeUnixNano": 0,
  "severityNumber": 0,
  "severityText": "",
  "attributes": {
    "db.system.name": "postgresql",
    "db.namespace": "appdb",
    "db.query.text": "BEGIN UPDATE orders SET amount = amount + ? WHERE id = ? SELECT pg_sleep ( ? ) COMMIT",
    "user.name": "postgres",
    "postgresql.state": "active",
    "postgresql.pid": 28140,
    "postgresql.application_name": "psql",
    "network.peer.address": "",
    "network.peer.port": -1,
    "postgresql.client_hostname": "",
    "postgresql.query_start": "2026-09-03 01:54:36.888193+00",
    "postgresql.wait_event": "transactionid",
    "postgresql.wait_event_type": "Lock",
    "postgresql.query_id": "686538199038618172",
    "postgresql.total_exec_time": 625.21
  },
  "traceId": "",
  "spanId": "",
  "eventName": "db.server.query_sample"
}
The eventName of the shown event is db.server.query_sample, which corresponds to a pg_stat_activity sample. Events from pg_stat_statements have db.query.text, postgresql.calls, postgresql.rows, postgresql.total_exec_time, postgresql.total_plan_time, postgresql.shared_blks_hit, postgresql.shared_blks_read, postgresql.shared_blks_dirtied, postgresql.shared_blks_written, postgresql.temp_blks_read, postgresql.temp_blks_written, postgresql.queryid, and postgresql.rolname. Even for the same query, postgresql.calls will be smaller than the cumulative value in pg_stat_statements.
The wait event breakdown seen in the console can also be queried with Logs Insights.
filter ispresent(`attributes.postgresql.state`)
| stats count(*) as samples
    by coalesce(`attributes.postgresql.wait_event_type`, "CPU") as wait_type,
       coalesce(`attributes.postgresql.wait_event`, "CPU") as wait_event
| sort samples desc
| wait_type | wait_event | samples |
|---|---|---|
| CPU | CPU | 27 |
| Timeout | PgSleep | 17 |
| Lock | transactionid | 9 |
| IO | WALSync | 1 |
This is an aggregation of the 54 events with postgresql.state out of the 181 events scanned by Logs Insights over the target period (the range differs from the 223 events mentioned earlier). Events without a wait event type are counted as CPU.
Top queries can also be retrieved from the same log group.
filter ispresent(`attributes.postgresql.total_exec_time`)
| stats max(`attributes.postgresql.total_exec_time`) as total_exec_ms,
        max(`attributes.postgresql.calls`) as calls
    by substr(`attributes.db.query.text`, 0, 60) as query
| sort total_exec_ms desc | limit 8
8 entries were returned. The top 4 are listed below.
| query (first 60 characters) | total_exec_ms | calls |
|---|---|---|
| BEGIN UPDATE orders SET amount = amount + ? WHERE id = ? SEL | 3585.866 | - |
| SELECT pg_sleep ( ? ) count ( * ) FROM orders | 975.3 | 40 |
| UPDATE orders SET status = ? WHERE id = ( SELECT id FROM ord | 830.038 | 121 |
| SELECT count ( * ) FROM orders WHERE note LIKE ? AND amount | 609.541 | 150 |
The calls here are the values carried in the events, which is a different quantity from the cumulative value in pg_stat_statements (1,464). The top entry was an event that did not carry a calls value.
Looking at the metrics side as well: only one section was written in the configuration file, but the agent configured multiple pipelines.
        metrics/host_metrics:
            exporters:
                - forward/opentelemetry
            processors:
                - transform/host_metrics_scope
            receivers:
                - hostmetrics/opentelemetry
        metrics/opentelemetry:
            exporters:
                - otlphttp/metrics
            processors:
                - resourcedetection/opentelemetry
                - transform/identity
                - batch/opentelemetry_metrics
            receivers:
                - forward/opentelemetry
In the same dump, postgresql/metrics_0 and postgresql/metrics_perresource_0 appear upstream. count/dbi_dbload and signaltometrics/dbi_topsql also appear in this dump. DB load and top queries are assembled by the agent. The host metrics receiver is also configured by the agent without any explicit settings.
The metrics output goes through otlphttp/metrics and is sent as OpenTelemetry metrics. Therefore, they do not appear in the traditional CloudWatch metrics list returned by ListMetrics. The metrics in the CWAgent namespace showed {"Metrics": []} when checked after configuration and after load injection. The list of namespaces with active metrics in the last 3 hours also showed nothing corresponding to Database Insights.
Retrieval via the Performance Insights API is also not possible. In the service model bundled with AWS CLI 2.34.39 on hand, the ServiceType for the pi API only has two values: RDS and DOCDB. There is no value for specifying self-managed PostgreSQL.
The access path for OTel metrics is PromQL. Since SQL text is not included in metric-side labels, querying by query text requires looking at the log group.
The collected metric names can be listed at https://monitoring.us-west-2.amazonaws.com/api/v1/label/__name__/values. The SigV4 service name is monitoring, and the required permissions are cloudwatch:GetMetricData and cloudwatch:ListMetrics. The returned list contained 69 metric names, none of which were written in the configuration file.
postgresql.active_sessions.by_app  postgresql.active_sessions.by_db
postgresql.active_sessions.by_host postgresql.active_sessions.by_sql
postgresql.active_sessions.by_sql_wait postgresql.active_sessions.by_user
postgresql.active_sessions.by_wait postgresql.active_sessions.count
postgresql.backends postgresql.bgwriter.buffers.allocated
postgresql.bgwriter.buffers.writes postgresql.bgwriter.checkpoint.count
postgresql.bgwriter.duration postgresql.bgwriter.maxwritten
postgresql.blocks_read postgresql.calls postgresql.commits
postgresql.connection.max postgresql.database.count postgresql.db_size
postgresql.index.scans postgresql.index.size postgresql.operations
postgresql.rollbacks postgresql.rows postgresql.shared_blks_hit
postgresql.shared_blks_read postgresql.table.count postgresql.table.size
postgresql.table.vacuum.count postgresql.total_exec_time
postgresql.total_plan_time
process.cpu.time process.cpu.utilization process.disk.io
process.memory.usage process.memory.utilization process.memory.virtual
system.cpu.frequency system.cpu.load_average.15m system.cpu.load_average.1m
system.cpu.load_average.5m system.cpu.logical.count system.cpu.physical.count
system.cpu.time system.cpu.utilization system.disk.io system.disk.io_time
system.disk.merged system.disk.operation_time system.disk.operations
system.disk.pending_operations system.disk.weighted_io_time
system.filesystem.inodes.usage system.filesystem.usage
system.filesystem.utilization system.linux.memory.available
system.linux.memory.dirty system.memory.limit system.memory.page_size
system.memory.usage system.memory.utilization system.network.connections
system.network.dropped system.network.errors system.network.io
system.network.packets system.processes.count system.processes.created
Those beginning with active_sessions correspond to the DB load and its breakdown in the console. The breakdown is by wait event, SQL, database, user, application, and host. Those beginning with system and process are host metrics.
The DB load breakdown can be queried on the metrics side using PromQL.
Below is the breakdown for one minute during load injection (time=1788401100 = 2026-09-03T02:05:00Z).
sum by ("postgresql.wait_event_type","postgresql.wait_event") ({"postgresql.active_sessions.by_wait"})
| postgresql.wait_event_type | postgresql.wait_event | Value |
|---|---|---|
| CPU | CPU | 9 |
| Timeout | PgSleep | 2 |
| Lock | transactionid | 2 |
| LWLock | WALWrite | 1 |
| IPC | ExecuteGather | 1 |
| IPC | BtreePage | 1 |
| IO | WALSync | 1 |
The wait event types listed matched the console legend. The values are integers and did not match the AAS shown in the console (peak of 2–3). Plotting the CPU wait trend with step=60 gives 4 → 7 → 8 → 10 → 7 → 7 → 8 → 6 → 9 → 9 → 9, with one point per minute.
Labels carry the OTLP structure as-is. Instance name, host type, and solution are included directly. The label for SQL-level metrics is the query ID.
This query was executed after the stack and log groups had been deleted. The metrics remained and could be queried even though they did not appear in ListMetrics.
Only a few seconds elapsed between loading the configuration and receiving the first event. The agent started at 01:53:35Z, the first event arrived at 01:53:37Z, and the two log groups appeared 32 seconds and 79 seconds after startup, respectively.
After testing, I deleted both the stack and the log groups outside CloudFormation management.
aws cloudformation delete-stack --region us-west-2 --stack-name dbinsights-selfmanaged-pg
aws cloudformation wait stack-delete-complete --region us-west-2 --stack-name dbinsights-selfmanaged-pg

# Log groups are outside CloudFormation management and must be deleted individually
aws logs delete-log-group --region us-west-2 \
  --log-group-name /aws/self-managed-database-insights/postgresql/raw-events
aws logs delete-log-group --region us-west-2 \
  --log-group-name /aws/self-managed-database-insights/postgresql/server-logs
Pricing
Database Insights for self-managed databases is billed based on the volume of data ingested. You pay for the OpenTelemetry metrics and CloudWatch Logs ingested by the agent. Since self-managed databases do not use Standard or Advanced mode, there is no vCPU-hour billing as with RDS or Aurora.
According to the pricing page at the time of writing, OTel metrics ingestion is $0.50 per GB ingested. This flat rate includes 15 months of storage for the collected metrics. There are no separate charges for API calls, metric storage, or the number of unique series.
Logs collected by the agent are stored in CloudWatch. The retention period follows the settings of the destination log group.
Summary
I was able to get a self-managed PostgreSQL running on EC2 onto the Database Insights dashboard by simply adding one section to the CloudWatch agent configuration. The mechanism uses the CloudWatch agent approach: the agent connects to the DB, reads standard views, and sends the data to CloudWatch via OTLP. The delivered metrics can be accessed not only from the console dashboard, but also from Logs Insights and PromQL.
Looking at the architecture, it combines an OTel receiver with a general-purpose batch transfer, with only one engine-specific receiver. Currently, only PostgreSQL is supported for self-managed databases, but the design leaves room for expansion to other engines. This is worth paying attention to as a monitoring option for databases running on EC2 and similar environments. It also serves as a useful reference for CloudWatch agent usage and OTel integration.
What RDS and Aurora's Database Insights provide as a managed service is this entire mechanism. With self-managed databases, you take on the PostgreSQL configuration, monitoring roles, and the ongoing cost of the agent yourself. I recommend leaning toward RDS or Aurora for production workloads, and running the agent on EC2 as an opportunity to understand what's going on under the hood.