I tried the new CloudWatch feature "Metrics Centralization" for aggregating metrics within Organizations
This page has been translated by machine translation. View original
Introduction
In June 2026, Metrics Centralization was added to CloudWatch. This feature physically copies metrics within an Organization to a centralization destination account, allowing alarms, dashboards, and queries to be run locally from the destination.
Since this feature has a different positioning from the previously available OAM (Cross-Account Observability), let's organize the comparison in a table.
| OAM (Cross-Account Observability) | Metrics Centralization | |
|---|---|---|
| Mechanism | Cross-references source telemetry from a monitoring account | Physically copies metrics to the centralization destination account |
| Data location | Remains in the source account | Replicated to the destination |
| Alarm creation | Possible from the monitoring account (cross-account reference) | Created as local metrics at the destination |
| Source identification | Filtering by Account ID | Classic: :@aws.account dimension, OTel: @aws.account attribute added automatically |
| Configuration owner | Source account authorizes connection to sink | Management account specifies in bulk via Centralization Rule |
| Organizations required | Not required (can be configured between individual accounts) | Required |
| Targets | Metrics / Logs / Traces | Metrics + Logs |
| Historical data | Existing data on the source side can be referenced | Only new data after rule creation |
| Cost (metrics) | Within normal CloudWatch API / feature usage fees | First metric copy is free |
How Centralization Works
A Centralization Rule is created from the management account to specify target accounts and regions. The aggregated metrics are automatically tagged with source identification information as follows:
- Custom metrics via PutMetricData (Classic path):
:@aws.account/:@aws.regiondimensions are automatically added - OTel metrics via OTLP endpoint (OTel path):
@aws.account/@aws.regionattributes are automatically added
Log aggregation can also be configured using the same Centralization Rule. By adding SourceLogsConfiguration, log groups from the specified accounts and regions are forwarded to the destination.
Limitations
- Only new data after rule creation is targeted (historical data is not transferred)
- Selective filtering (aggregating only specific metrics) is not currently supported
Verification Environment and Prerequisites
| Account | Role | Account ID |
|---|---|---|
| Management account | Creates Centralization Rule, enables Trusted access | 111111111111 |
| Monitored account | EC2 + CWAgent (Classic + OTel parallel) + Enrichment enabled | 222222222222 |
| Destination account | Metric reference, alarm, and dashboard construction | 333333333333 |
- Region: ap-northeast-1 (Tokyo)
- EC2: t4g.small (arm64) / Amazon Linux 2023
- CloudWatch Agent: v1.300069.0
Enabling Trusted Access and Creating a Centralization Rule
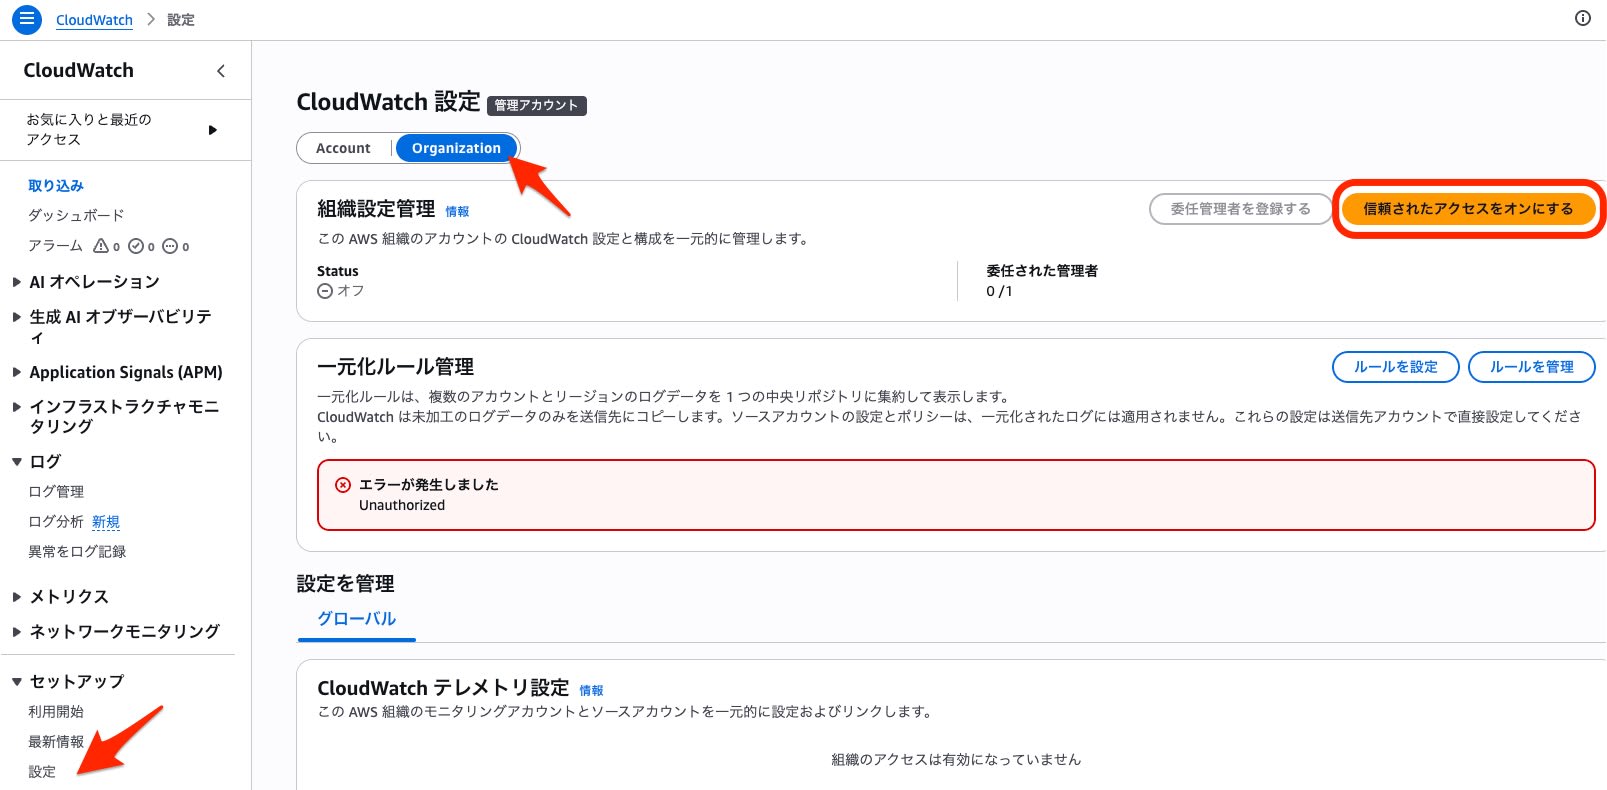
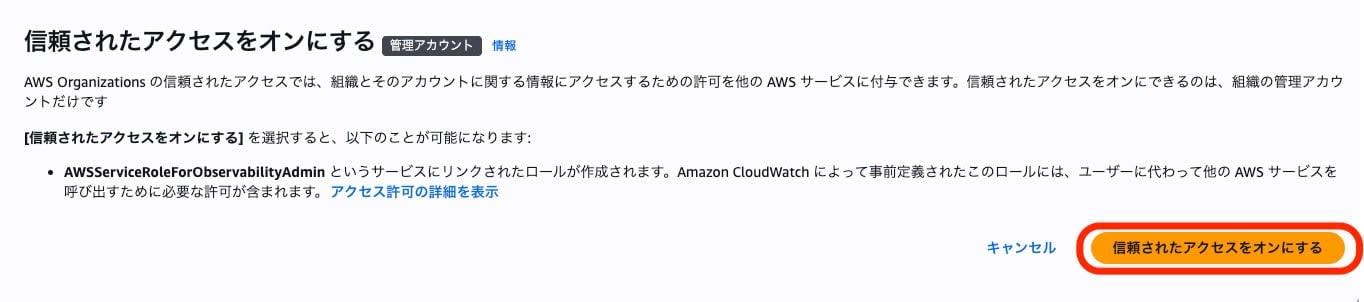
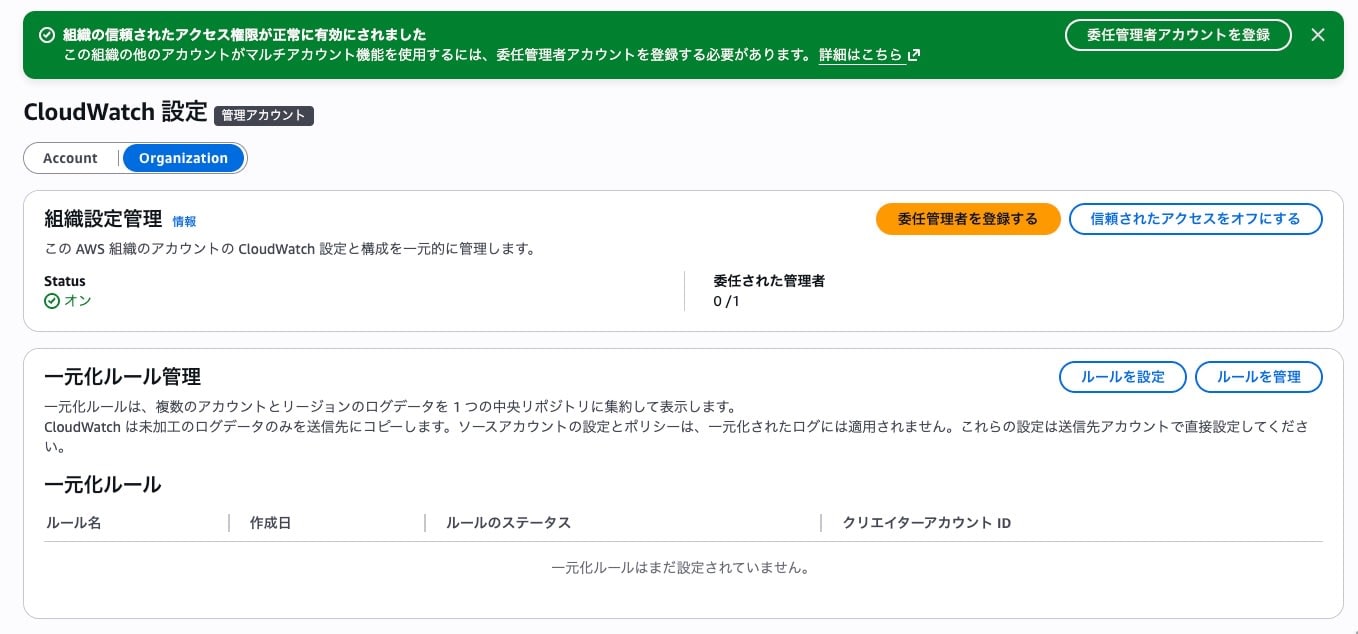
Enabling Trusted Access
To use Metrics Centralization, Trusted Access for CloudWatch must be enabled in the management account.
This was enabled from the Settings screen in the CloudWatch console, under the Organization tab.
Creating the Centralization Rule (Metrics + Logs)
Create the rule from the management account using the observabilityadmin CLI.
aws observabilityadmin create-centralization-rule-for-organization \
  --rule-name metrics-centralization-202606 \
  --rule '{
    "Source": {
      "Regions": ["ap-northeast-1"],
      "Scope": "AccountId = '\''222222222222'\''",
      "SourceMetricsConfiguration": {},
      "SourceLogsConfiguration": {
        "LogGroupSelectionCriteria": "*",
        "EncryptedLogGroupStrategy": "SKIP"
      }
    },
    "Destination": {
      "Region": "ap-northeast-1",
      "Account": "333333333333"
    }
  }' \
  --region ap-northeast-1
{
    "RuleArn": "arn:aws:observabilityadmin:ap-northeast-1:111111111111:organization-centralization-rule/metrics-centralization-202606"
}
Key configuration points:
SourceMetricsConfiguration: {}must be explicitly specified even as an empty object. Omitting it will result in aValidationExceptionScopesyntax: UseAccountId = '<account-id>'for a single account,OrganizationUnitId IN (...)for OU specification, and*for all accountsLogGroupSelectionCriteria: "*"targets all log groupsEncryptedLogGroupStrategy: "SKIP"skips log groups encrypted with CMK
Verifying Metric Aggregation
Here is an overview of the aggregation results.
| Path | Verification method | Source identification key | Arrival time |
|---|---|---|---|
| Classic (PutMetricData) | ListMetrics + GetMetricData (Metrics Insights SQL) | :@aws.account / :@aws.region (dimension) |
Approx. 5 minutes |
| OTel (OTLP) | PromQL API (awscurl) | @aws.account / @aws.region (attribute) |
Approx. 5 minutes |
Classic Path (Metrics Insights)
Running list-metrics from the destination account confirmed that 8 metrics from the source account were available with :@aws.account / :@aws.region dimensions.
aws cloudwatch list-metrics --namespace CWAgent --recently-active PT3H --region ap-northeast-1
| Metric | :@aws.account | :@aws.region |
|---|---|---|
| cpu_usage_idle | 222222222222 | ap-northeast-1 |
| mem_used_percent | 222222222222 | ap-northeast-1 |
| netstat_tcp_established | 222222222222 | ap-northeast-1 |
| disk_used_percent | 222222222222 | ap-northeast-1 |
| ... (8 metrics total) |
Confirm that actual data can also be retrieved with GetMetricData.
aws cloudwatch get-metric-data \
  --metric-data-queries '[{
    "Id": "cpu_idle",
    "Expression": "SELECT AVG(\"cpu_usage_idle\") FROM \"CWAgent\" WHERE \":@aws.account\" = '\''222222222222'\''",
    "Period": 60
  }]' \
  --start-time 2026-06-29T09:50:00Z \
  --end-time 2026-06-29T10:10:00Z \
  --region ap-northeast-1
{
  "Values": [98.43, 99.19, 98.87],
  "Timestamps": ["2026-06-29T19:06:00+09:00", "2026-06-29T19:02:00+09:00", "2026-06-29T19:01:00+09:00"]
}
Data points arrived approximately 5 minutes after rule creation.
OTel Path (PromQL)
On the CWAgent of the monitored account, in addition to the Classic configuration, an OTel YAML was added via append-config to run OTLP endpoint metric transmission in parallel.
OTel YAML (CWAgent append-config)
receivers:
  hostmetrics/cwagent:
    collection_interval: 60s
    scrapers:
      cpu: {}
      memory: {}
      disk: {}
      filesystem: {}

processors:
  batch/cwagent: {}
  resource/cwagent:
    attributes:
      - key: service.name
        value: "ec2-metrics-source"
        action: upsert

exporters:
  otlphttp/cwagent:
    metrics_endpoint: https://monitoring.ap-northeast-1.amazonaws.com/v1/metrics
    auth:
      authenticator: sigv4auth/cwagent

extensions:
  sigv4auth/cwagent:
    region: "ap-northeast-1"
    service: "monitoring"

service:
  extensions: [sigv4auth/cwagent]
  pipelines:
    metrics/cwagent:
      receivers: [hostmetrics/cwagent]
      processors: [resource/cwagent, batch/cwagent]
      exporters: [otlphttp/cwagent]
The CloudWatch Agent on the same EC2 instance runs the traditional CloudWatch metric transmission (PutMetricData, Classic path) and OTLP transmission (OTel path) in parallel. The /cwagent suffix is added to component names to avoid conflicts with existing configurations, and the sigv4auth extension uses instance profile credentials for authentication.
OTel path metrics are verified using PromQL. Since the CloudWatch PromQL API does not have a dedicated subcommand in the AWS CLI, it is called directly using awscurl.
awscurl --service monitoring --region ap-northeast-1 \
  -X POST \
  -H "Content-Type: application/x-www-form-urlencoded" \
  -d 'query={"__name__"="system.cpu.time", "@aws.account"="222222222222"}' \
  "https://monitoring.ap-northeast-1.amazonaws.com/api/v1/query"
From the response, it was confirmed that @aws.account / @aws.region were added. The resource attribute @resource.service.name also propagated to the destination.
{
  "metric": {
    "@aws.account": "222222222222",
    "@aws.region": "ap-northeast-1",
    "@resource.service.name": "ec2-metrics-source",
    "__name__": "system.cpu.time",
    "__type__": "Sum",
    "cpu": "cpu0",
    "state": "idle"
  },
  "value": [1782727830.413, "5327538.25"]
}
When specifying labels such as @aws.account or @resource.service.name in CloudWatch PromQL, enclose the label names in double quotes.
{"__name__"="system.cpu.time", "@aws.account"="222222222222", "state"="idle"}
Integration with Vended Metric Enrichment
In this verification, AWS vended metrics such as EC2 CPUUtilization could not be confirmed from the destination without Enrichment enabled. However, when Vended Metric Enrichment is enabled, they are generated as OTel metrics (ExponentialHistogram type) and become targets for Centralization.
The CWAgent hostmetrics confirmed in the previous section (such as system.cpu.time) were explicitly sent via OTLP. The Enrichment metrics handled here are automatically generated by AWS, and differ in that EC2 tags and ARNs are added as attributes.
Centralization Propagation of Enrichment Metrics
In the verification, Vended Metric Enrichment was enabled on both the monitored account and the destination account.
Running PromQL on the destination account, it was possible to filter the CPUUtilization metrics generated by Enrichment based on tags. @aws.tag.Name is used to specify a particular EC2 instance.
awscurl --service monitoring --region ap-northeast-1 \
  -X POST \
  -H "Content-Type: application/x-www-form-urlencoded" \
  -d 'query=histogram_avg({"CPUUtilization", "@aws.account"="222222222222", "@aws.tag.Name"="ec2-instance-name"})' \
  "https://monitoring.ap-northeast-1.amazonaws.com/api/v1/query"
Metrics that can be treated as ExponentialHistogram via Enrichment support histogram_avg() and histogram_quantile(). The same histogram functions cannot be used with Classic PutMetricData metrics.
Verifying Log Aggregation
Log Group Arrival and Stream Naming Convention
When log aggregation is enabled in the Centralization Rule, a log group with the same name as the source account's log group is automatically created at the destination.
aws logs describe-log-streams \
  --log-group-name "/aws/ec2/ec2-instance/system" \
  --region ap-northeast-1
[
    {
        "name": "i-0123456789abcdef0/messages-222222222222-ap-northeast-1",
        "lastEvent": 1782733095809
    }
]
The stream name is automatically suffixed with -{source account ID}-{source region}. This naming convention suggests a design where the source can be identified by stream name even when log groups with the same name from multiple source accounts are aggregated (this verification used a single source account).
Searching with filter-log-events
It was confirmed that filter-log-events filter pattern searches work correctly on aggregated logs.
aws logs filter-log-events \
  --log-group-name "/aws/vendedlogs/states/resource-monitor" \
  --filter-pattern "ExecutionSucceeded" \
  --region ap-northeast-1 \
  --limit 1
{
    "logStreamName": "states/resource-monitor/2026-06-29-11-40/00000000-222222222222-ap-northeast-1",
    "message": "{\"type\":\"ExecutionSucceeded\",\"details\":{\"output\":\"{\\\"totalChecks\\\":9,\\\"criticalCount\\\":0,...}\"}}"
}
Step Functions execution logs also arrived at the destination and could be searched using filter patterns.
Logs Insights
Logs Insights also worked correctly on aggregated logs. However, immediately after aggregation, there was a time lag of approximately 15–20 minutes before the results were reflected in queries.
aws logs start-query \
  --log-group-name "/aws/ec2/ec2-instance/system" \
  --start-time $(date -d '1 hour ago' +%s) \
  --end-time $(date +%s) \
  --query-string 'fields @timestamp, @message, @logStream | sort @timestamp desc | limit 5' \
  --region ap-northeast-1
The @logStream field displays the stream name (with suffix), so the source account can also be identified from Logs Insights query results.
Alarm Configuration
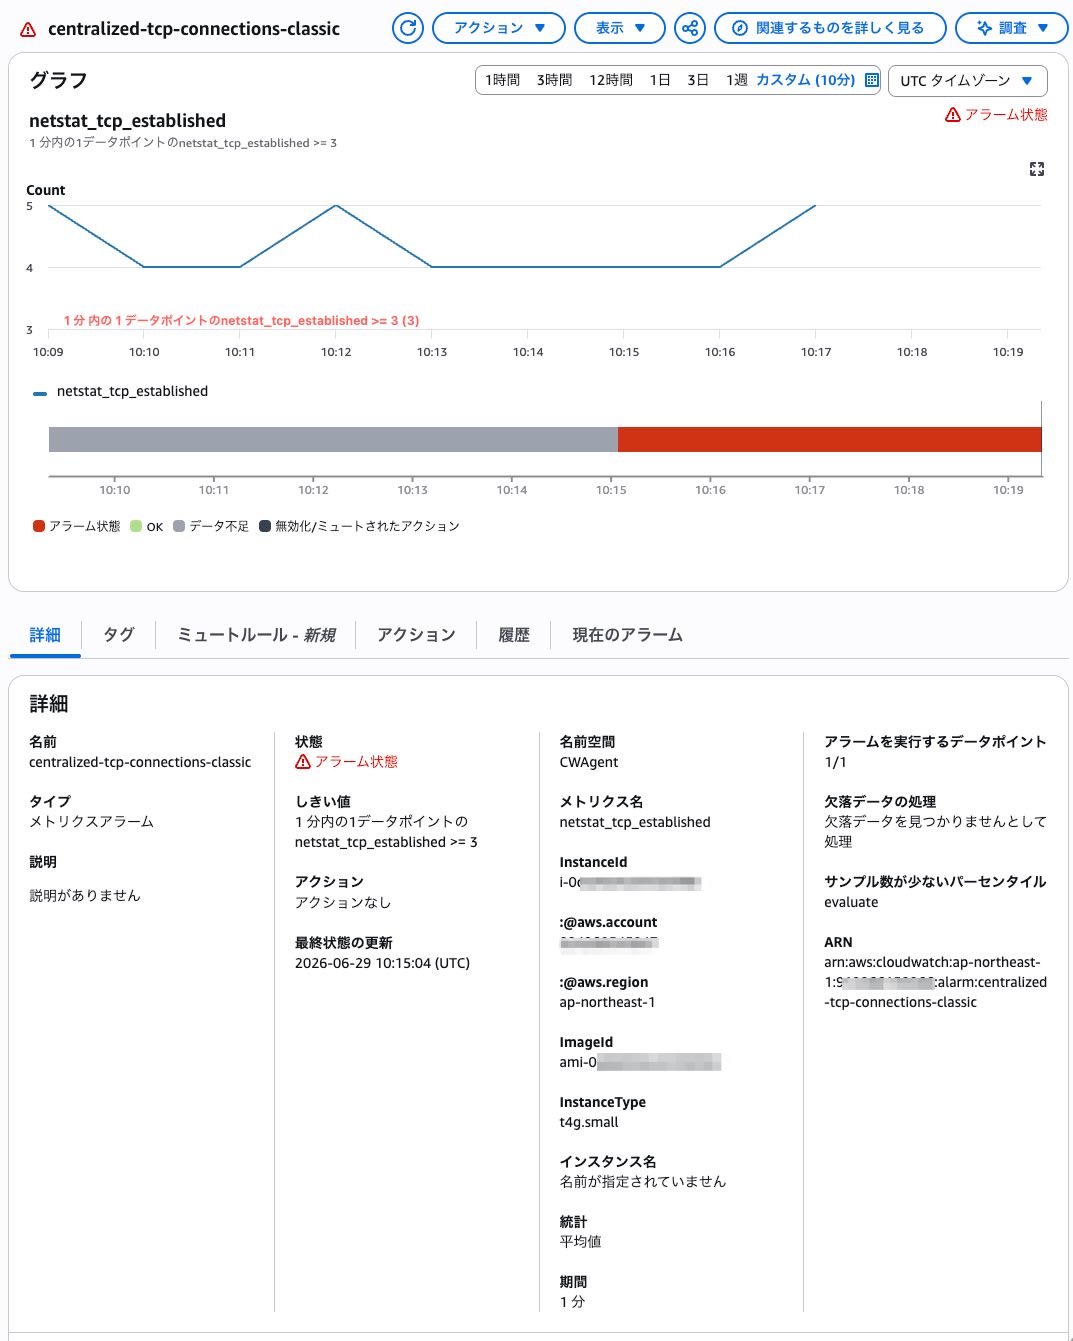
Classic Alarm (MetricStat)
The source account was filtered using the :@aws.account dimension, and a threshold was set on the number of TCP connections.
aws cloudwatch put-metric-alarm \
  --alarm-name "centralized-tcp-connections-classic" \
  --comparison-operator GreaterThanOrEqualToThreshold \
  --evaluation-periods 1 \
  --metric-name netstat_tcp_established \
  --namespace CWAgent \
  --period 60 \
  --statistic Average \
  --threshold 3 \
  --treat-missing-data missing \
  --dimensions '[
    {"Name":"InstanceId","Value":"i-0123456789abcdef0"},
    {"Name":":@aws.account","Value":"222222222222"},
    {"Name":":@aws.region","Value":"ap-northeast-1"}
  ]' \
  --region ap-northeast-1
It transitioned to ALARM in approximately 1 minute.
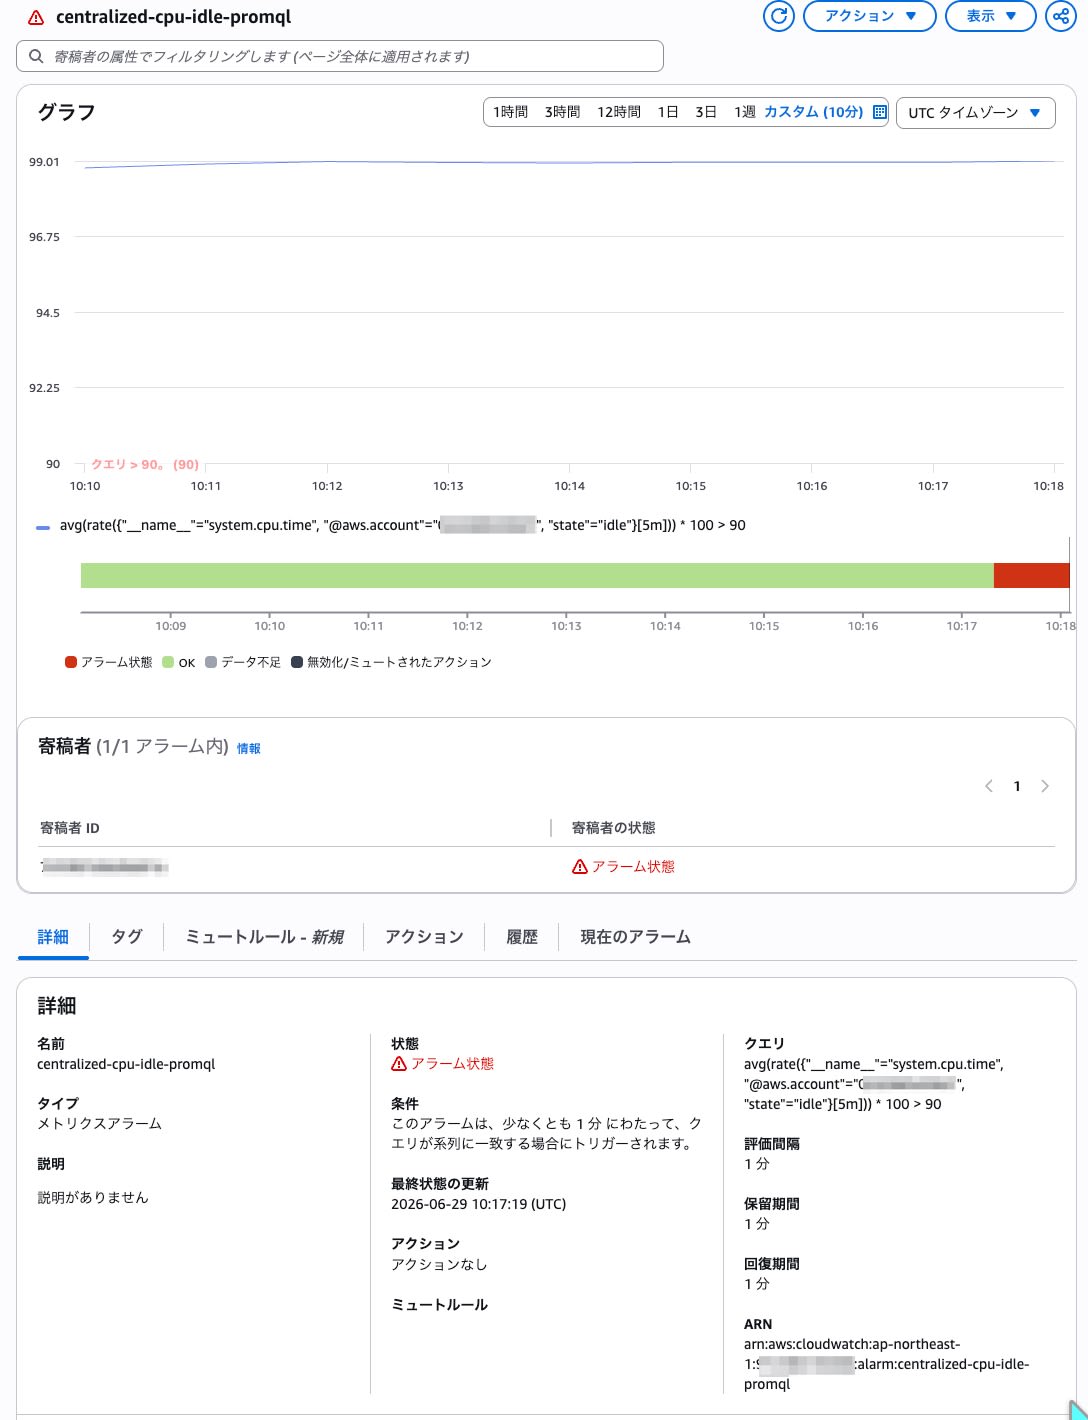
PromQL Alarm (EvaluationCriteria)
PromQL-based alarms are used for OTel path metrics. Since configuration is done via EvaluationCriteria.PromQLCriteria, the JSON must be passed using --cli-input-json.
aws cloudwatch put-metric-alarm \
  --cli-input-json '{
    "AlarmName": "centralized-cpu-idle-promql",
    "EvaluationCriteria": {
      "PromQLCriteria": {
        "Query": "avg(rate({\"__name__\"=\"system.cpu.time\", \"@aws.account\"=\"222222222222\", \"state\"=\"idle\"}[5m])) * 100 > 90",
        "PendingPeriod": 60,
        "RecoveryPeriod": 60
      }
    },
    "EvaluationInterval": 60
  }' \
  --region ap-northeast-1
This alarm is configured to trigger ALARM when the CPU idle value (rate of idle state × 100) exceeds 90 for ease of verification. For monitoring CPU usage in production, the state filtering and aggregation method would need to be designed appropriately.
PromQL alarm syntax points:
- The threshold condition is included within the query (
> 90). The traditional--threshold/--comparison-operatorcannot be specified PendingPeriod: Number of seconds before transitioning to ALARMRecoveryPeriod: Number of seconds before returning to OK- The initial state is OK (unlike Classic's INSUFFICIENT_DATA)
It transitioned to ALARM in approximately 3 minutes. The transition time depends on PendingPeriod, evaluation interval, metric arrival delay, and the range specification in PromQL.
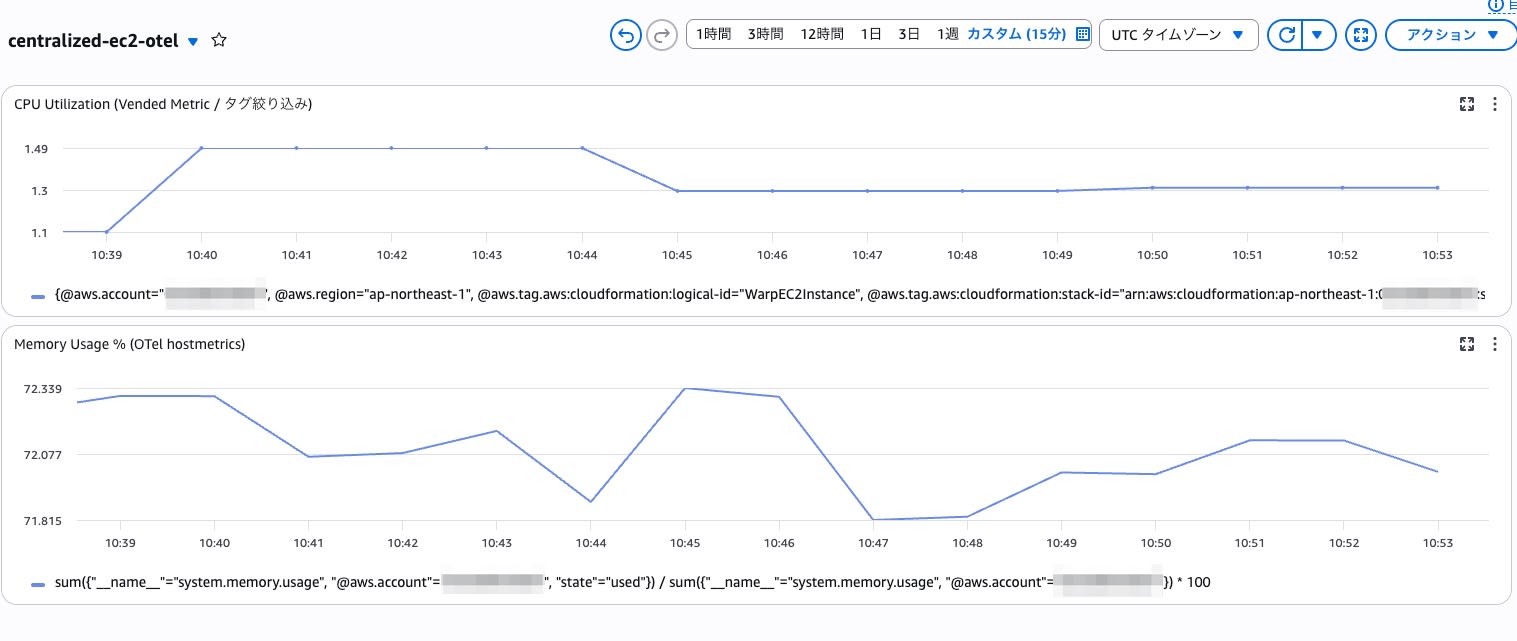
Building a Dashboard
Dashboard Definition
aws cloudwatch put-dashboard \
  --dashboard-name "centralized-ec2-otel" \
  --dashboard-body '{
    "widgets": [
      {
        "type": "chart",
        "x": 0, "y": 0, "width": 6, "height": 6,
        "properties": {
          "view": "line",
          "title": "CPU Utilization (Vended Metric / Tag Filtering)",
          "region": "ap-northeast-1",
          "data": {
            "queries": [{
              "id": "A",
              "type": "cloudwatch-metrics",
              "language": "PromQL",
              "query": "histogram_avg({\"CPUUtilization\", \"@aws.account\"=\"222222222222\", \"@aws.tag.Name\"=\"ec2-instance-name\"})"
            }]
          },
          "plotOptions": {
            "legend": {"position": "bottom", "show": true},
            "xAxis": {"type": "datetime"},
            "yAxis": [{"type": "linear"}],
            "style": {
              "label": {"position": "top", "show": false},
              "lineOptions": {"filled": false, "pattern": "solid", "spline": false, "stacked": false, "width": 2}
            }
          }
        }
      },
      {
        "type": "chart",
        "x": 6, "y": 0, "width": 6, "height": 6,
        "properties": {
          "view": "line",
          "title": "Memory Usage % (OTel hostmetrics)",
          "region": "ap-northeast-1",
          "data": {
            "queries": [{
              "id": "A",
              "type": "cloudwatch-metrics",
              "language": "PromQL",
              "query": "sum({\"__name__\"=\"system.memory.usage\", \"@aws.account\"=\"222222222222\", \"state\"=\"used\"}) / sum({\"__name__\"=\"system.memory.usage\", \"@aws.account\"=\"222222222222\"}) * 100"
            }]
          },
          "plotOptions": {
            "legend": {"position": "bottom", "show": true},
            "xAxis": {"type": "datetime"},
            "yAxis": [{"type": "linear"}],
            "style": {
              "label": {"position": "top", "show": false},
              "lineOptions": {"filled": false, "pattern": "solid", "spline": false, "stacked": false, "width": 2}
            }
          }
        }
      }
    ]
  }' \
  --region ap-northeast-1
Notes on PromQL dashboards:
- Use
"chart"as the widget type. The traditional"metric"is for Metric Math / Metrics Insights SQL - In the
chartwidget definition used this time,plotOptionswas required. Omitting it resulted in a "Something went wrong" error in the console - If a
chartwidget created via CLI results in an error, an alternative approach is to add a widget from the console's Query Studio and pin it to the dashboard
Cost
The official Pricing page states "The first copy of centralized metrics is free," meaning no additional transfer costs are incurred for the first centralization destination for metric copying. Normal CloudWatch pricing applies separately for log aggregation, query execution, alarms, etc.
Summary
Using CloudWatch Metrics Centralization, it was confirmed that metrics and logs within AWS Organizations can be aggregated to a destination account, and that alarms, dashboards, and queries can be executed from the destination.
In this verification, CWAgent Classic path (PutMetricData) metrics were aggregated with :@aws.account / :@aws.region dimensions, making them available from Metrics Insights and standard CloudWatch alarms. On the other hand, OTel path metrics were aggregated with @aws.account / @aws.region attributes, making them accessible from the PromQL API and PromQL alarms.
In addition, when combined with Vended Metric Enrichment, it was confirmed that EC2 CPUUtilization could be handled via PromQL, with tag-based filtering and histogram_avg() applied to ExponentialHistogram. Since Enrichment adds attributes such as tags and ARNs, it seems well-suited for attribute-based analysis that would be difficult with Classic metrics alone.
Regarding logs, it was confirmed that aggregation can be configured with the same Centralization Rule, that a log group with the same name is created at the destination, and that log stream names are suffixed with the source account ID and region. Aggregated logs can also be searched using filter-log-events and Logs Insights.
Unlike OAM, which cross-references telemetry from source accounts, the distinguishing characteristic of Metrics Centralization is that copied data at the destination can be treated as local resources. This looks like a promising option when you want to handle monitoring data from accounts under Organizations together in a destination account.