I observed ChatGPT Web's DOM, communications, and API responses using the CDP capability of the Codex App
This page has been translated by machine translation. View original
Hey! I'm Nishimura Yuji from the Ops team!
In Codex's Browser Developer mode, in addition to a high-level API for browser operations, you can use the cdp capability to directly call the Chrome DevTools Protocol (CDP).
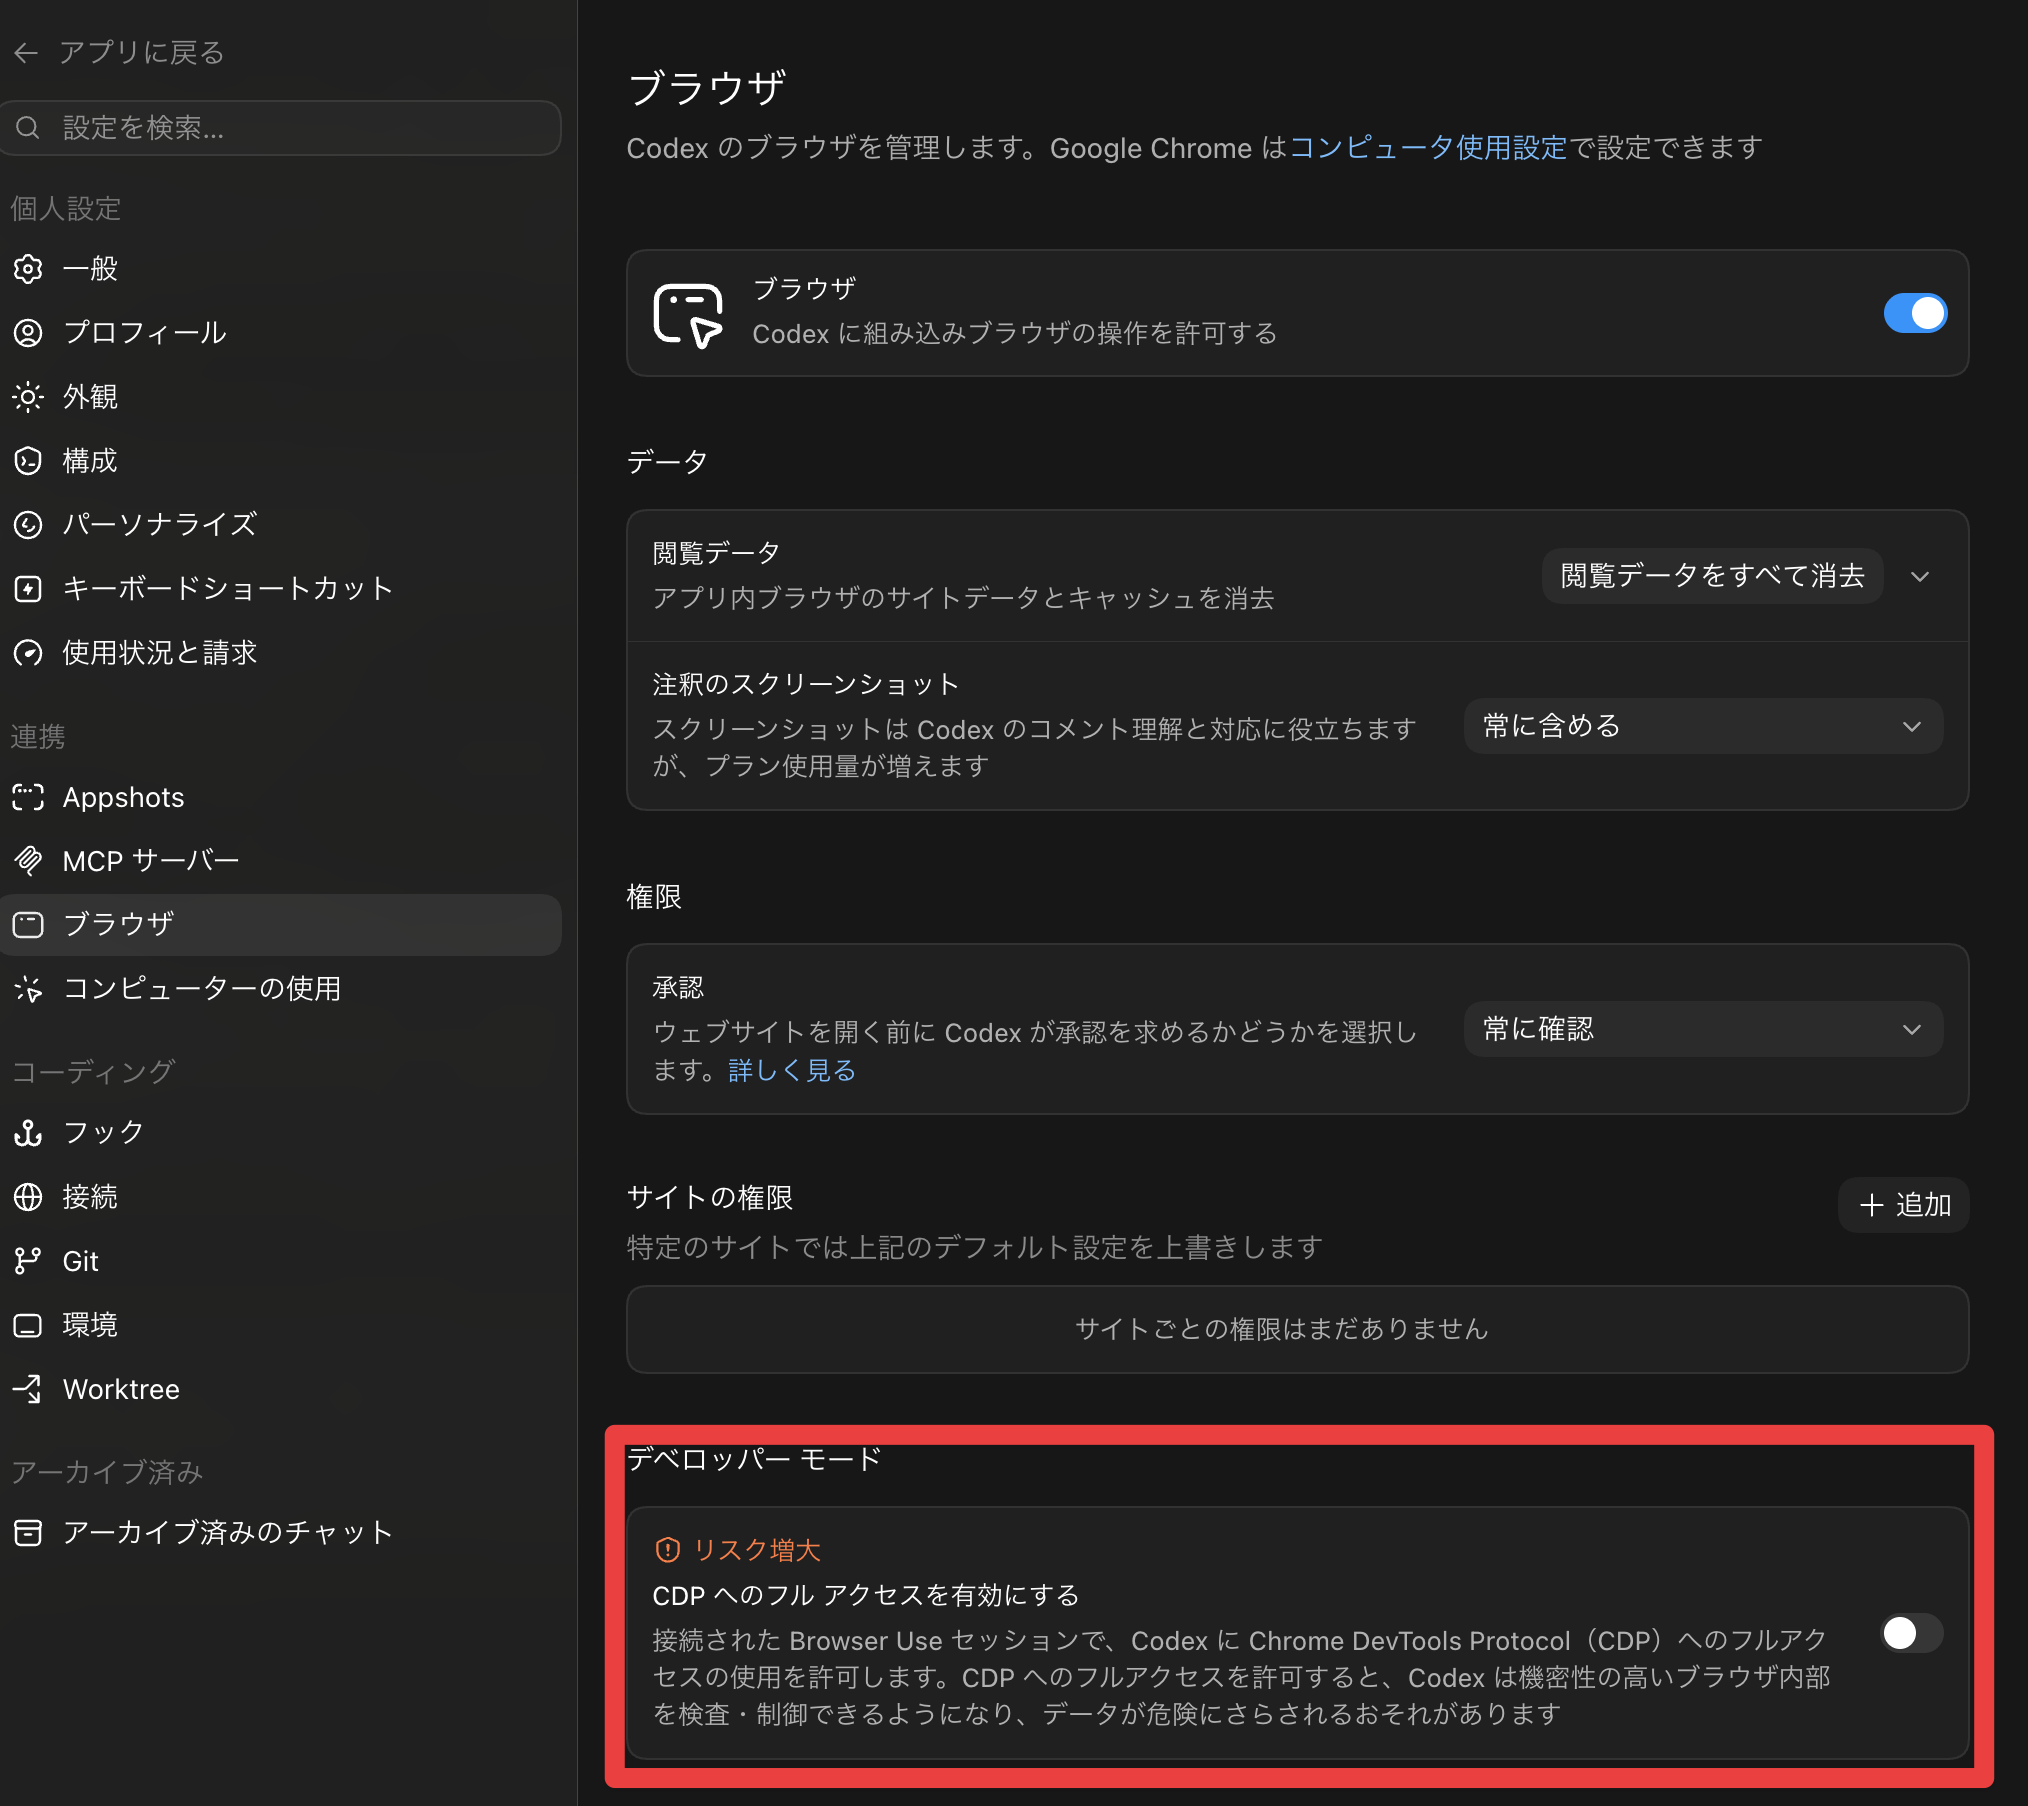
I confirmed this Developer mode / full CDP access locally with the Codex App's openai-bundled browser / chrome 26.609.71450.
You need to enable CDP in advance.
This time, I opened a logged-in ChatGPT from the Codex App and actually posted a short message, while testing how much could be observed with CDP.
This article covers the following 7 items.
- Observing DOM changes
- Monitoring network communication
- Retrieving API response bodies
- Taking screenshots
- Generating PDFs
- Retrieving console logs
- Retrieving performance metrics
To get straight to the conclusion: click operations, console logs, and network communication were all controllable and observable from the Agent side. In practice, it seemed most manageable to delegate clicks and input to high-level APIs like tab.playwright, and delegate communication, responses, PDF, and Performance metrics observation to CDP.
What I Wanted to Test
CDP is the protocol used internally by Chrome DevTools. By sending commands to domains such as Network, Runtime, Page, and Performance, you can retrieve what's happening in the browser from the outside.
What I wanted to see was whether I could "operate an authenticated web app from the Codex App and retrieve information similar to what you'd see in DevTools' Network tab or Performance tab, all in the same flow."
The target, ChatGPT Web, returns a streaming response after sending a message and dynamically updates the screen. It seemed like a good subject for looking at DOM, Network, API responses, and Performance together.
Environment
- Codex CLI 0.140.0
- Codex App Browser / Chrome Plugin (openai-bundled browser / chrome 26.609.71450)
- Browser Developer mode / full CDP access enabled
- Logged-in ChatGPT session in Google Chrome
- macOS 15.7.4
- Confirmed on: 2026-06-16
First, Request the Observation from Codex
This time, I asked Codex App's chat to perform CDP observation targeting ChatGPT Web.
The request was roughly as follows.
Target the ChatGPT website and use CDP (Chrome DevTools Protocol) to observe browser behavior.

Actually post a message to the chat and check the following that occurs during that time.

- DOM manipulation
- Network communication monitoring
- Direct retrieval of API responses
- Screenshot capture
- PDF generation
- Console log retrieval
- Performance measurement
Since CDP can retrieve a lot of information, it's easier to organize the logs by deciding in advance what scope to look at.
Overall Flow
The actual verification proceeded in the following steps. It handled the operations without getting stuck anywhere.
- Open ChatGPT Web via the Chrome Plugin
- Enable CDP's
Page,DOM,Runtime,Network,Performance, etc. - Retrieve the CDP event cursor before sending
- Send a short test post to ChatGPT
- Read Network events and Runtime events after the cursor
- Retrieve the API response body from the necessary requestId
- Save screenshots, PDF, and Performance metrics
At minimum, the CDP setup looks like this.
const cdp = await tab.capabilities.get("cdp");

for (const [method, params] of [
  ["Page.enable", {}],
  ["DOM.enable", {}],
  ["Runtime.enable", {}],
  ["Log.enable", {}],
  ["Network.enable", {}],
  ["Performance.enable", {}],
]) {
  await cdp.send(method, params);
}
On the other hand, for entering text in ChatGPT's input field and submitting, it used tab.playwright rather than CDP.
const prompt = "This is a CDP observation test. Please respond briefly with just 'Observation OK'.";

const input = tab.playwright.getByRole("textbox", {
  name: "Chat with ChatGPT",
});
await input.fill(prompt);

const sendButton = tab.playwright.getByRole("button", {
  name: "Send prompt",
});
await sendButton.click();
Rather than pushing all page operations to CDP, it's more readable and easier to isolate failures to separate input and clicks into high-level APIs and observation into CDP.
Results on Screen
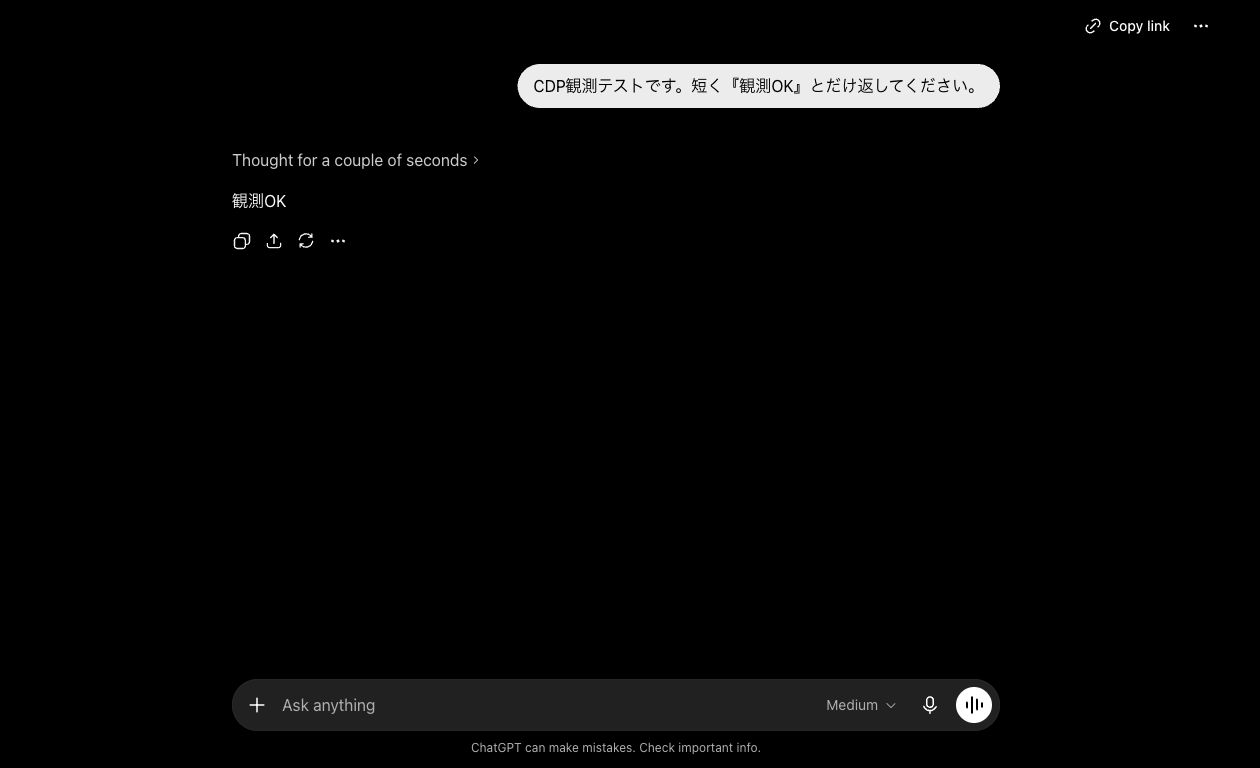
The following test post was sent to ChatGPT.
This is a CDP observation test. Please respond briefly with just 'Observation OK'.
The on-screen response was Observation OK. The screenshot below was also captured by the Agent.
From here, the Agent retrieved what was happening behind the scenes during this single post and summarized the content. Let's take a look at that.
What Was Visible in the DOM
DOM changes were observed by placing a MutationObserver inside the page with Runtime.evaluate. The target was elements under main.
The results were as follows.
| Item | Result |
|---|---|
| Total mutations | 37 |
| childList | 33 |
| characterData | 4 |
| Added nodes | 19 |
| Removed nodes | 14 |
From when the Thinking display appeared to when the response body was shown, it could be tracked as childList and characterData changes.
Additionally, the DOM structure at that point in time was also retrieved with DOMSnapshot.captureSnapshot.
| Item | Result |
|---|---|
| document | 3 |
| node | 1,563 |
| layout node | 1,085 |
| string table | 1,381 |
MutationObserver seems suited for tracking "what changed," while DOMSnapshot seems suited for recording "what the structure looked like at that point in time."
What Was Visible in Network
For Network events, a cursor was taken before the message was sent, and only events after that cursor were read after sending.
const before = await cdp.readEvents({
  limit: 1,
  timeoutMs: 1000,
});

// Send message after this

const observed = await cdp.readEvents({
  afterSequence: before.cursor,
  limit: 1000,
  methods: [
    "Network.requestWillBeSent",
    "Network.responseReceived",
    "Network.loadingFinished",
    "Network.loadingFailed",
  ],
  timeoutMs: 5000,
});
After the pre-send cursor, 381 CDP events and 163 Network requests were observed.
The main endpoints visible were as follows.
| Method | Path | Observed Content |
|---|---|---|
| POST | /backend-api/f/conversation |
Message sending and response stream |
| POST | /backend-api/f/conversation/prepare |
Preparation before sending conversation |
| GET | /backend-api/conversation/{id}/stream_status |
Stream status |
| GET | /backend-api/conversation/{id}/textdocs |
Retrieving textdocs |
| GET / POST | /backend-api/sentinel/* |
Sentinel-related |
| POST | /ces/v1/* |
Telemetry / event-related |
The target communication is /backend-api/f/conversation, but in an actual web app, related preparation processes, status checks, and telemetry all flow simultaneously. When reading with CDP, it's good to assume you'll be filtering by URL, method, and mimeType.
What Was Visible in the API Response Body
By recording the requestId from Network.responseReceived, you can retrieve the response body with Network.getResponseBody.
The main subject this time was the text/event-stream from /backend-api/f/conversation.
const responseBody = await cdp.send("Network.getResponseBody", {
  requestId: conversationRequestId,
});

const lines = responseBody.body
  .split("\n")
  .filter((line) => line.startsWith("data: "))
  .map((line) => line.slice("data: ".length));
The retrieved SSE body was 24,750 characters. There were 27 data: events, and [DONE] was confirmed at the end.
On screen, Observation OK was displayed, but the same string was also confirmed as an assistant response delta in the API stream.
assistant delta: $.v[0].v = "Observation OK"
Supplementary APIs were also confirmed.
| API | Result |
|---|---|
/backend-api/conversation/{id}/stream_status |
{"status":"IS_STREAMING"} |
/backend-api/conversation/{id}/textdocs |
[] |
/backend-api/f/conversation/prepare |
{"status":"ok", ...} |
The conversation/prepare response contained a short-lived token, so the value was not saved, and only the fact that it returned status: ok was recorded.
Saving Screenshots and PDFs
Screenshots were taken using tab.screenshot(), the high-level API on the Codex App side.
const screenshot = await tab.screenshot({
  fullPage: false,
  clip: {
    x: 270,
    y: 0,
    width: 1260,
    height: 768,
  },
});
Initially the entire screen was saved, but it included the personal area in the sidebar. For images used in public articles, only the conversation body side was cropped.
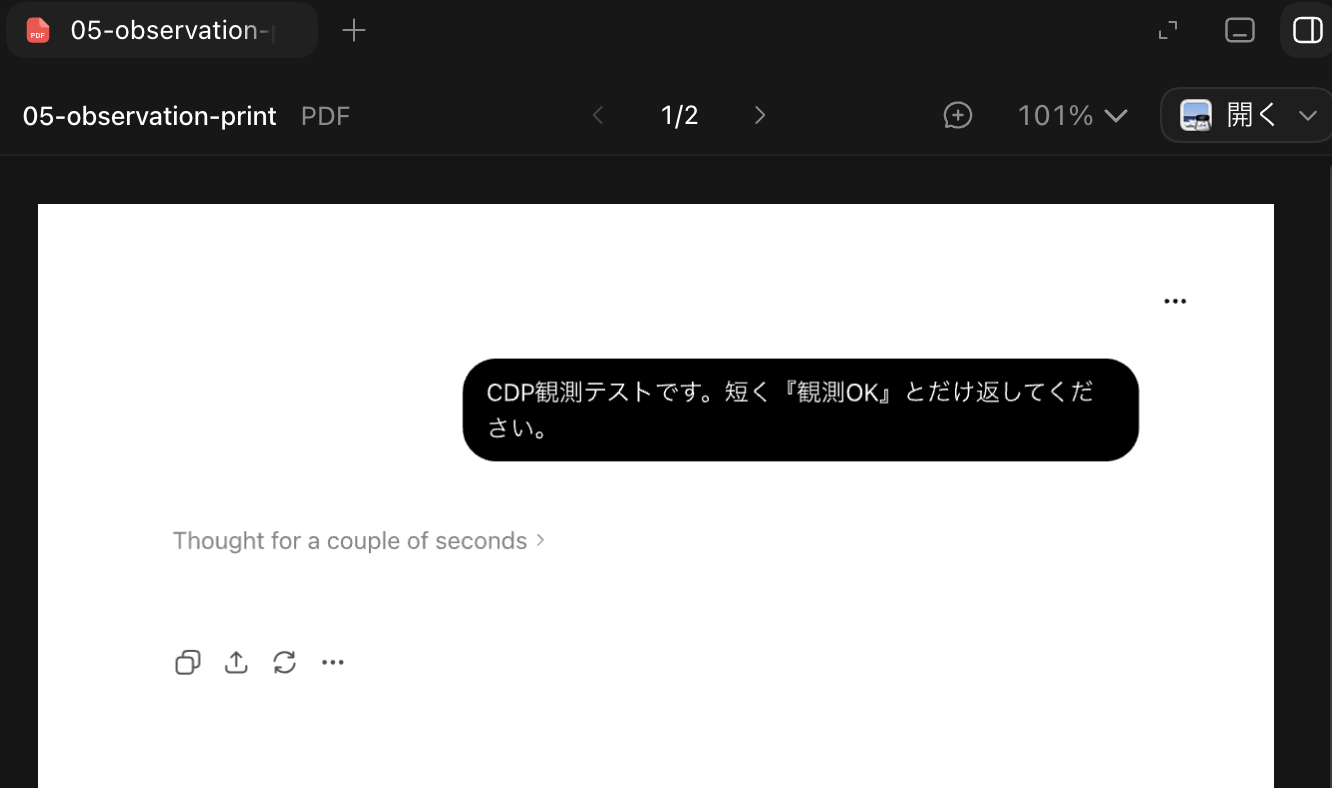
The PDF was generated with CDP's Page.printToPDF.
const pdf = await cdp.send("Page.printToPDF", {
  printBackground: true,
  preferCSSPageSize: true,
});
The PDF generated this time was 2 pages, approximately 49 KB. Screenshots seem useful for visual confirmation, while PDFs seem useful as artifacts to preserve the page state at the time of verification.
Console and Performance Can Also Be Retrieved
Console logs were retrieved by subscribing to Runtime.consoleAPICalled. This time, as a confirmation of log retrieval, one console.info was fired via CDP and the event was read.
As a result, one info event from Runtime.consoleAPICalled was retrieved. This was not an investigation of naturally occurring app errors, but a confirmation that console events can be captured.
For Performance metrics, Performance.getMetrics was called before and after the message was sent, and the difference was examined.
| Metric | Difference |
|---|---|
LayoutCount |
+234 |
RecalcStyleCount |
+2,675 |
LayoutDuration |
+0.064289 |
RecalcStyleDuration |
+0.835087 |
ScriptDuration |
+0.837414 |
TaskDuration |
+4.095959 |
Nodes |
+2,087 |
These numbers are from a single execution, so they are not rigorous benchmarks. They are values mixed with the transition from a new ChatGPT chat to the conversation URL, frame cleanup after initialization, and response rendering.
However, they could be useful for running the same operation multiple times and comparing, or for looking at trends before and after changes.
Organizing the Division of Roles
Within the scope tested this time, it was more practical to divide roles than to push everything to CDP.
| What You Want to Do | More Convenient Approach |
|---|---|
| Clicks, input, on-screen element operations | tab.playwright |
| Observing DOM changes | Runtime.evaluate + MutationObserver |
| Monitoring communication | Network.* events |
| Retrieving API response bodies | Network.getResponseBody |
| PDF generation | Page.printToPDF |
| Performance metrics | Performance.getMetrics |
CDP seems to fit best not as "the only means of operating the browser," but as a tool for incorporating DevTools-equivalent observation into the Codex App's work log.
Impressions from Trying It Out
Until now, when I needed to check the backend of a web app, I would manually open the browser's DevTools and visually inspect the Network tab or Console tab. Using the Codex App's CDP capability, the Agent can handle those checks, making investigations much easier. Also, since it can be written out as steps, it becomes easier to retrace the same observation later.
What was particularly good was being able to compare the results visible on screen with the results on the API stream in one continuous flow without switching tools. This time, Observation OK was displayed on screen, and the same Observation OK was confirmed in the SSE assistant delta. It was possible to confirm that the display and communication matched within a single flow.
On the other hand, when handling an authenticated session, sensitive values not shown on screen can be retrieved, so caution is needed.
Summary
I opened ChatGPT Web via the Codex App's Chrome Plugin and used the CDP capability to confirm the following.
- DOM changes could be observed with MutationObserver and DOMSnapshot
- The SSE communication for
/backend-api/f/conversationcould be tracked from Network events - The response delta
Observation OKcould be directly confirmed withNetwork.getResponseBody - The conversation page could be converted to PDF with
Page.printToPDF Runtime.consoleAPICalledandPerformance.getMetricscould also be retrieved
When you want to check both the "results shown on screen" and "the communication happening in the background" of a web app in the same verification log, the Codex App's CDP capability seems practically usable.
I hope this is helpful to someone.
Reference Links:
- Codex GitHub Repository
- Codex app - In-app browser: Developer mode
- Codex app settings - Browser
- Codex managed configuration - browser_use_full_cdp_access
- OpenAI Developers announcement mirror: Developer mode for browser use
- Chrome DevTools Protocol documentation
- Chrome DevTools Protocol - Network domain
- Chrome DevTools Protocol - Page domain
- Chrome DevTools Protocol - Performance domain