
I tested PostgreSQL 18's async I/O performance on RDS (benchmark for io_method: sync vs worker)
This page has been translated by machine translation. View original
TL;DR
- When comparing
io_method: syncandio_method: workeron RDS PostgreSQL v18 (db.m6g.large, 2 vCPU, 8GB RAM, scale 1000), there was almost no performance difference in this environment (about 1% difference in pgbench) io_method: io_uringappears to be the most effective, but it's not available on RDS (parameter group only allows "Allowed values: sync, worker")- Increasing
io_workerstoo much can be counterproductive (in this environment, increasing to 32 degraded performance by 45%) - In this test, increasing EBS IOPS (gp2 → gp3, about 2x improvement) and improving cache hit ratio were more effective for performance improvement
Reference: Detailed performance test article by pganalyze Waiting for Postgres 18: Accelerating Disk Reads with Asynchronous I/O
Introduction
I heard that PostgreSQL 18 introduced asynchronous I/O which significantly improves read performance. I decided to test it on RDS to see how it actually performs.
Test Environment
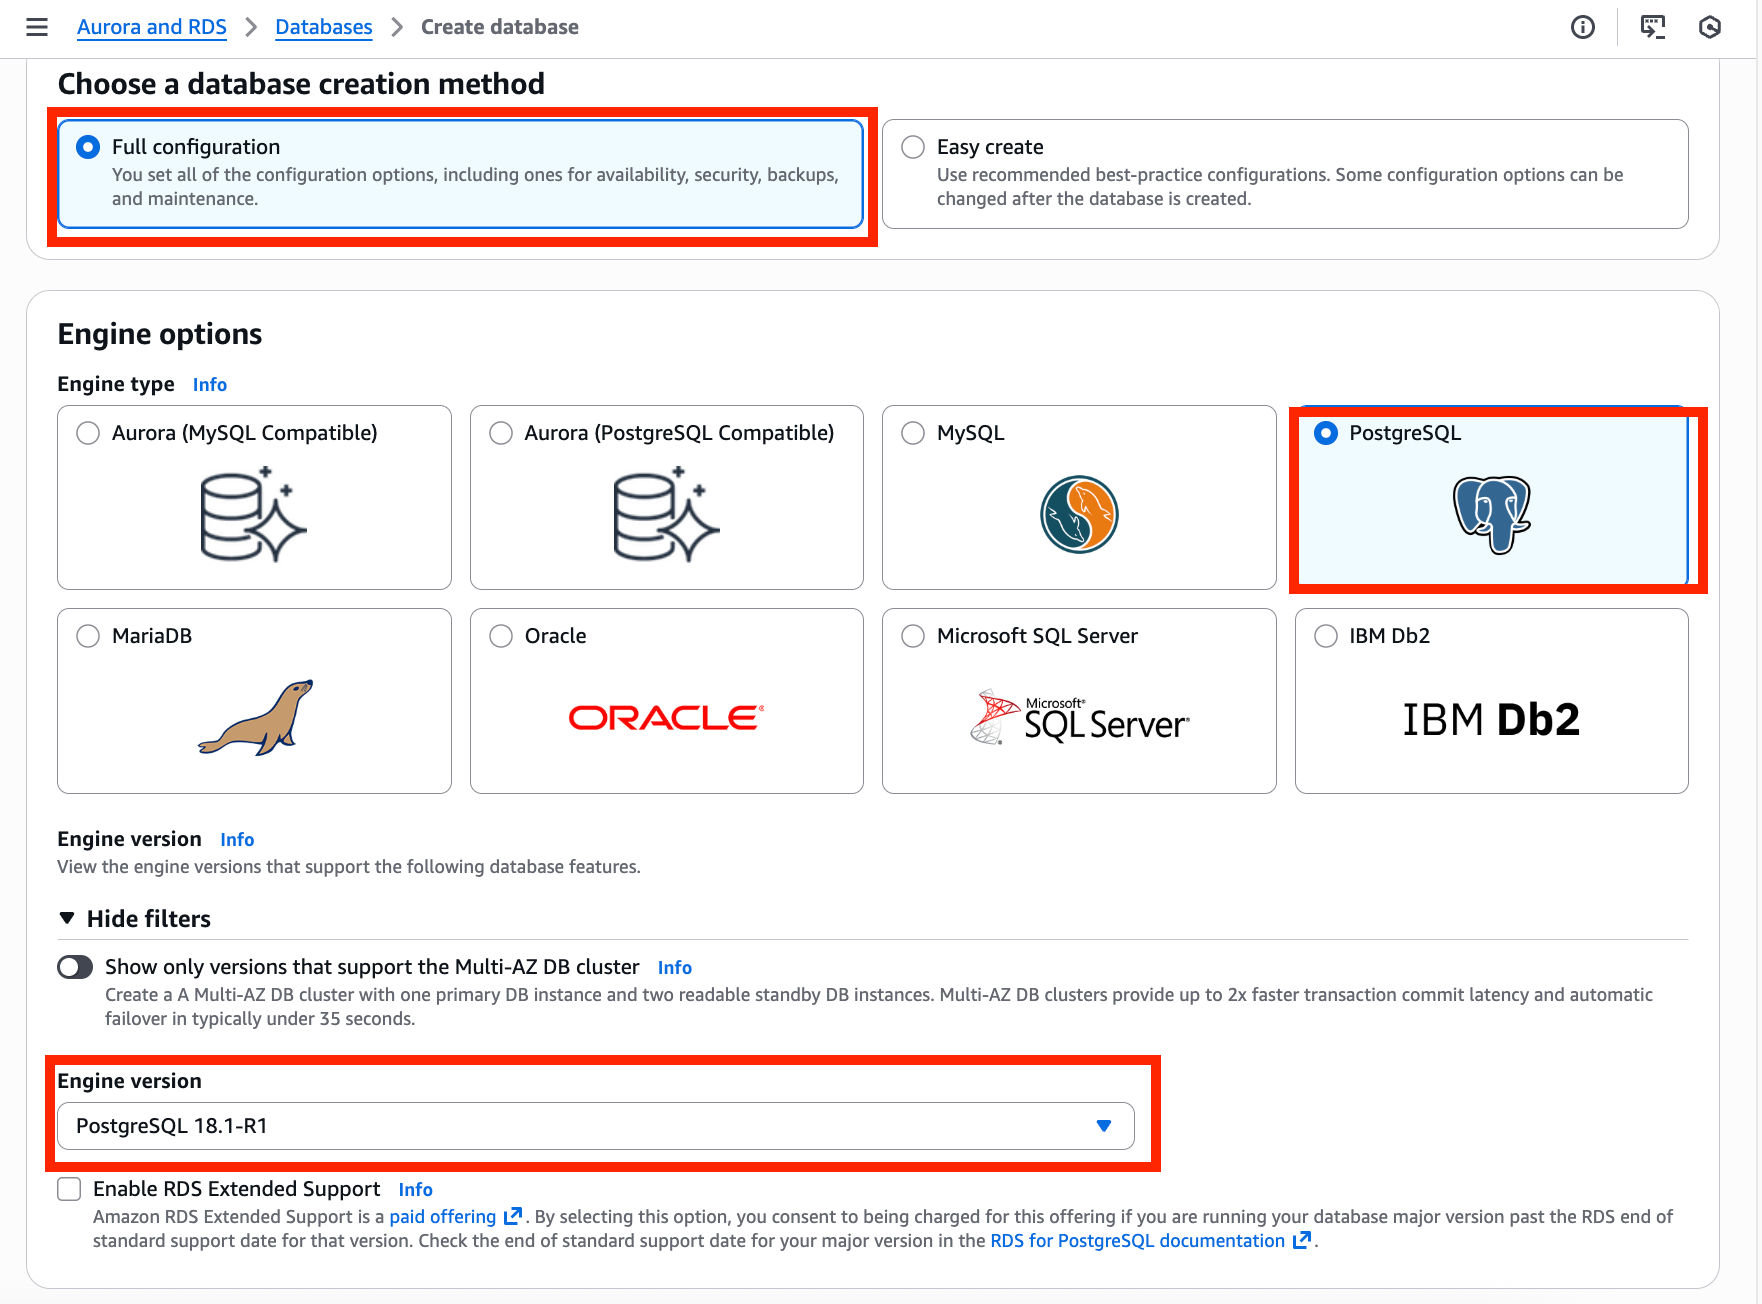
RDS Configuration
| Item | Value |
|---|---|
| Engine version | PostgreSQL 18.1-R1 |
| Instance class | db.m6g.large (2 vCPU, 8GB RAM) |
| EBS (initial) | gp2 40GB (baseline 120 IOPS) |
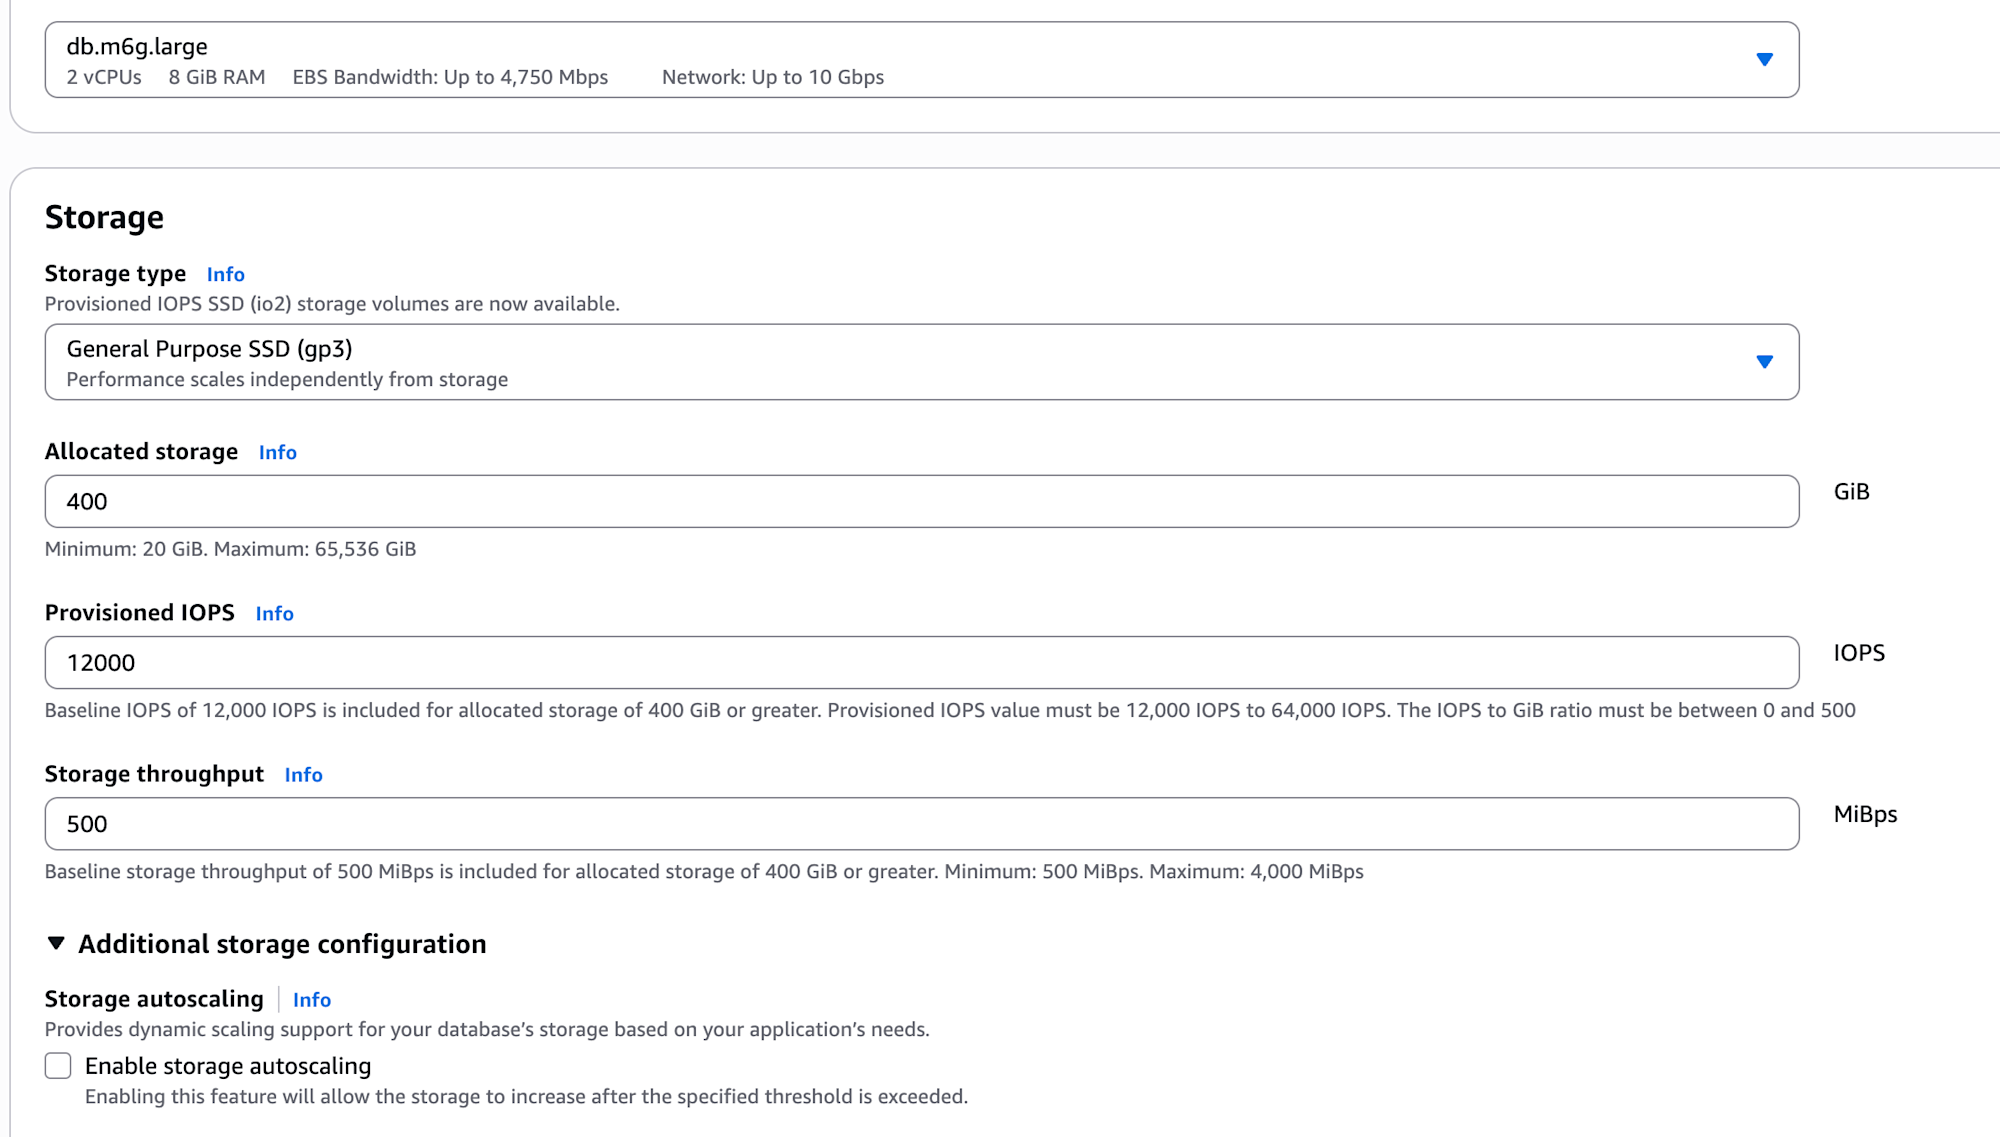
| EBS (later) | gp3 400GB (12,000 IOPS, 500 MB/s) |
| Region | ap-northeast-1 (Tokyo) |
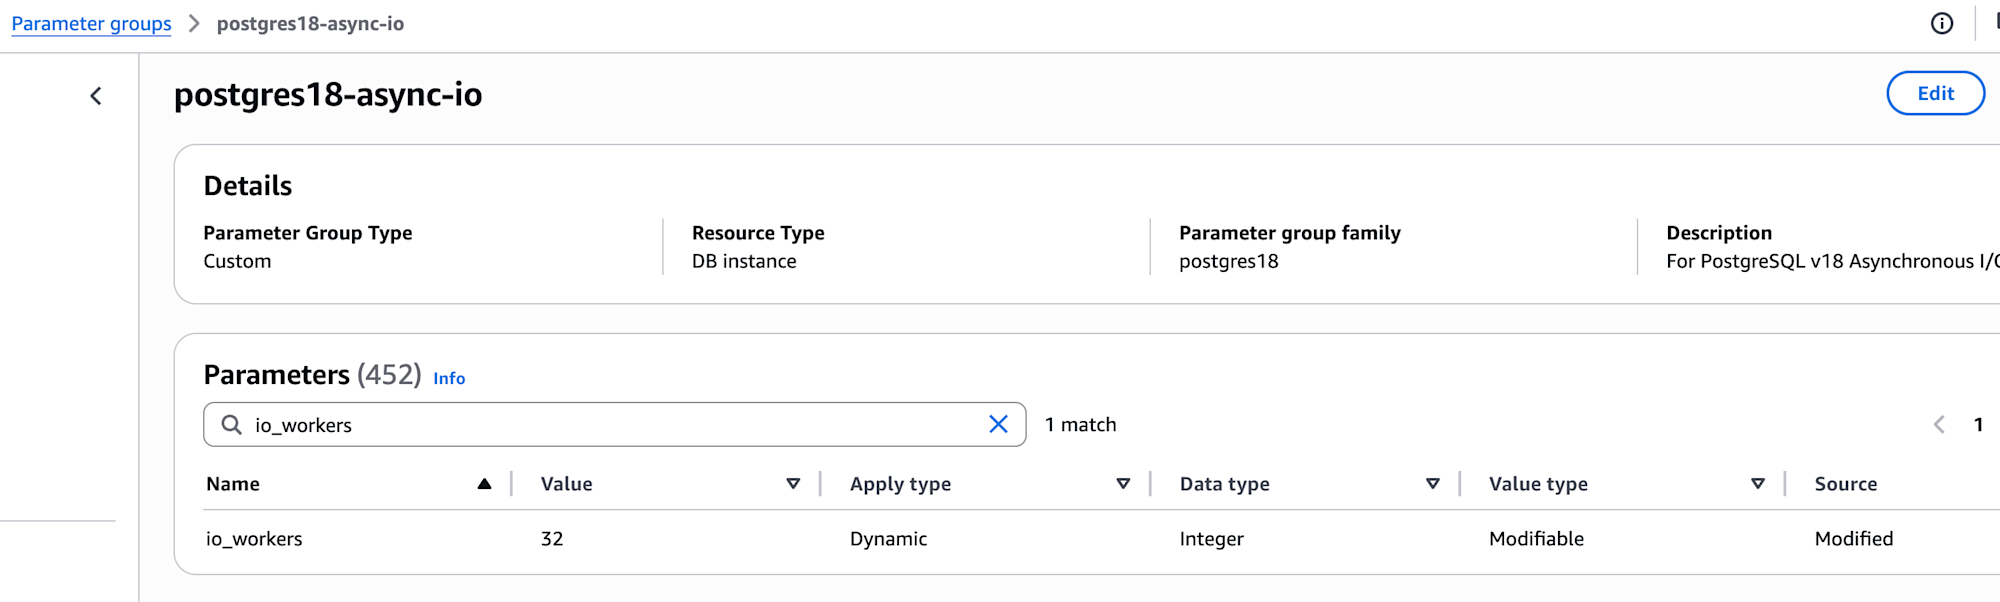
Parameter Groups
Created two for comparison:
- postgres18-sync:
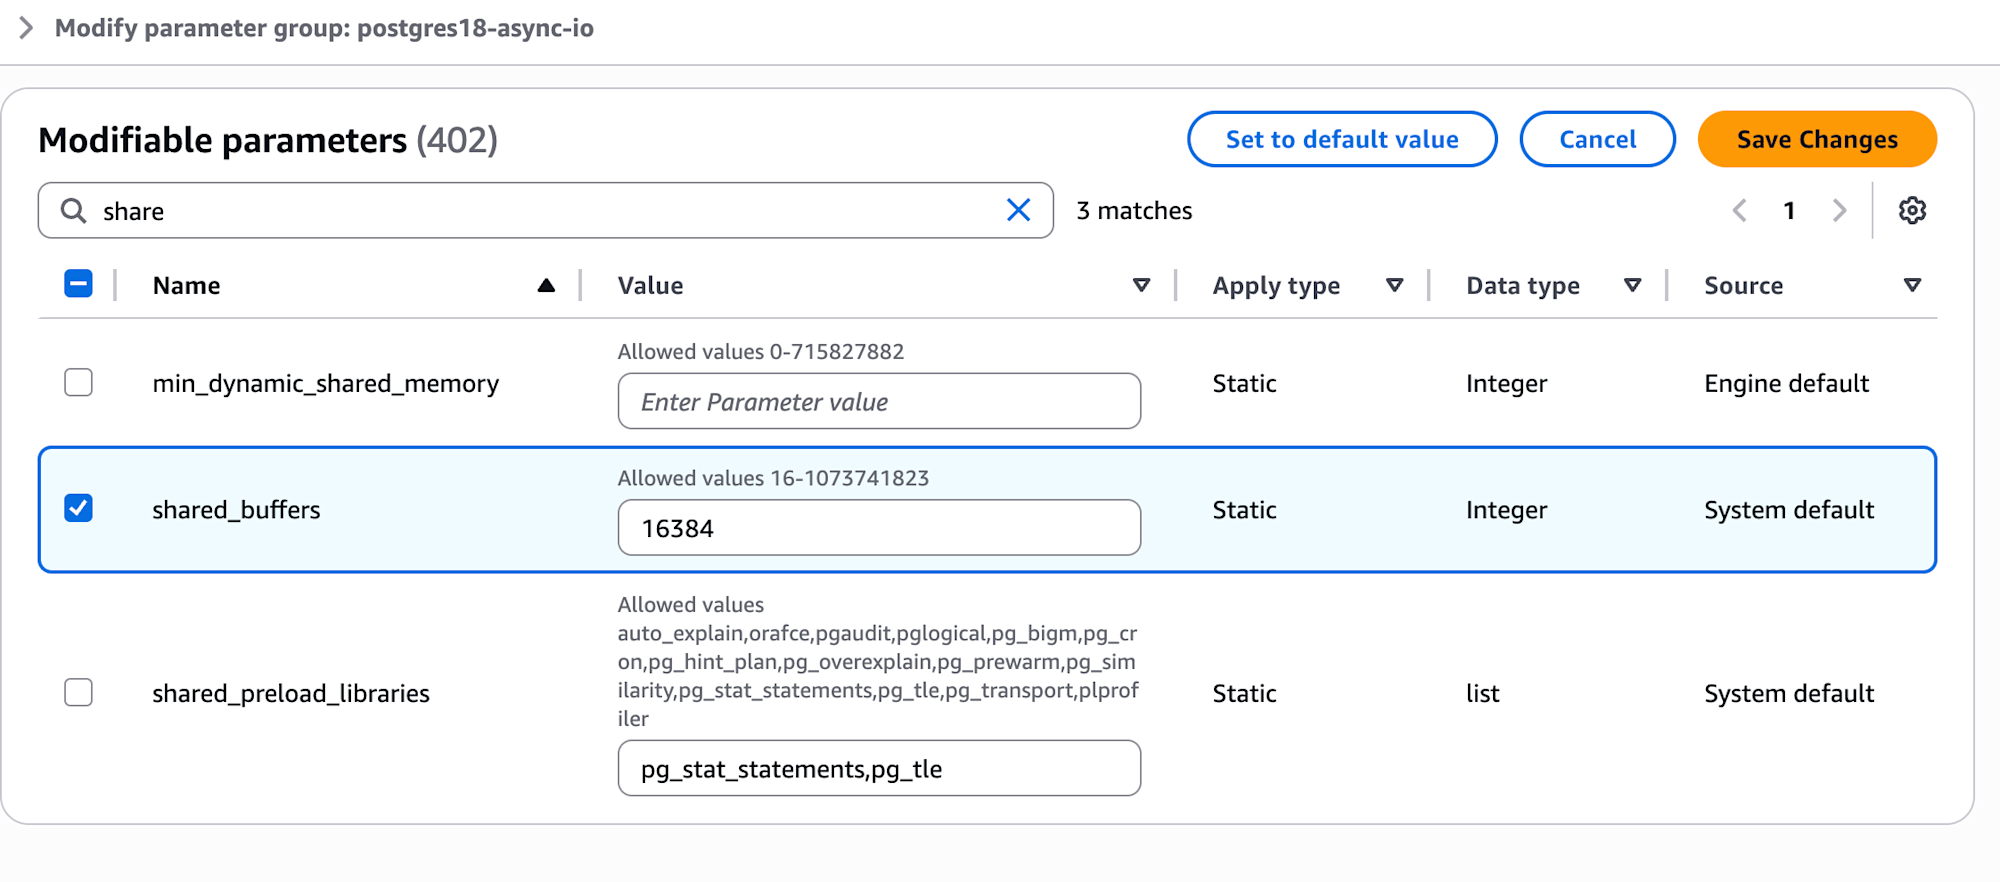
io_method = sync,shared_buffers = 16384(128MB) - postgres18-worker:
io_method = worker,shared_buffers = 16384(128MB)
Client Environment
Local Container (Debian):
# Install PostgreSQL client
sudo apt-get install postgresql-client-18
sudo apt-get install -y postgresql-contrib-18

# Verify
psql --version    # psql (PostgreSQL) 18.1 (Debian 18.1-1.pgdg12+2)
pgbench --version # pgbench (PostgreSQL) 18.1 (Debian 18.1-1.pgdg12+2)
AWS CloudShell:
# Install PostgreSQL 17 (PostgreSQL 18 wasn't available for Amazon Linux 2023 yet)
sudo dnf remove -y postgresql15 postgresql15-private-libs
sudo dnf install -y postgresql17 postgresql17-contrib

# Verify
psql --version    # PostgreSQL 17.7
pgbench --version # PostgreSQL 17.7
Benchmark Commands
Before each test, the RDS instance was restarted to clear the cache.
pgbench Initialization
# scale 1000 = 100 million accounts, about 15GB
PGPASSWORD='<password>' pgbench -i -s 1000 \
  -h <rds-endpoint>.rds.amazonaws.com \
  -U <user> -d postgres
Full Scan Test SQL
cat > /tmp/full-scan-test.sql << 'EOF'
SELECT COUNT(*) FROM pgbench_accounts;
SELECT SUM(abalance) FROM pgbench_accounts;
SELECT aid % 1000 as bucket, COUNT(*), AVG(abalance) FROM pgbench_accounts GROUP BY bucket;
SELECT COUNT(*) FROM pgbench_accounts a CROSS JOIN pgbench_branches b WHERE a.bid = b.bid;
SELECT COUNT(*) FROM pgbench_accounts WHERE abalance > 0;
EOF
Test Execution
# Full scan test
PGPASSWORD='<password>' psql \
  -h <rds-endpoint>.rds.amazonaws.com \
  -U <user> -d postgres \
  -c "\timing on" \
  -f /tmp/full-scan-test.sql

# pgbench TPC-B (5 minutes, 20 clients)
PGPASSWORD='<password>' pgbench \
  -h <rds-endpoint>.rds.amazonaws.com \
  -U <user> -d postgres \
  -c 20 -j 4 -T 300 -P 60

# Check cache hit ratio
PGPASSWORD='<password>' psql \
  -h <rds-endpoint>.rds.amazonaws.com \
  -U <user> -d postgres \
  -c "SELECT relname, heap_blks_read as disk, heap_blks_hit as cache,
      round(100.0 * heap_blks_hit / NULLIF(heap_blks_hit + heap_blks_read, 0), 2) as hit_ratio
    FROM pg_statio_user_tables
    WHERE relname LIKE 'pgbench%';"
Test Results
Tests from Local Container (Summary)
First, I ran pgbench from my local environment connecting to RDS (Tokyo).
| Test | Scale | io_method | TPS | Notes |
|---|---|---|---|---|
| Free tier (t4g.micro) | 50 | sync | 46.7 | Baseline |
| Free tier (t4g.micro) | 50 | worker | 42.7 | -8.5% (CPU throttling) |
| m6g.large | 250 | sync | 130 | Baseline |
| m6g.large | 250 | worker | 133 | +2.3% |
The network latency (about 140ms) was too high to see the effect of async I/O. Since this wasn't a valid comparison, I switched to CloudShell.
Tests from CloudShell (gp2, 120 IOPS)
Tests from CloudShell in the same region. Network latency improved to about 17ms.
| Test | Scale | io_method | TPS | Latency |
|---|---|---|---|---|
| CloudShell | 250 | sync | 1,206 | 16.58ms |
| CloudShell | 250 | worker | 1,190 | 16.80ms |
| CloudShell | 1000 | sync | 837 | 23.88ms |
| CloudShell | 1000 | worker | 838 | 23.87ms |
TPS improved significantly, but there was almost no difference between sync and worker. I suspected that the gp2 baseline IOPS (120) was the bottleneck, so I decided to change the EBS configuration.
Tests from CloudShell (gp3, 12,000 IOPS)
Changed EBS to gp3 (400GB, 12,000 IOPS, 500 MB/s) and ran the tests again. This was the main test.
Full Scan Results
| Query | sync | worker | Difference |
|---|---|---|---|
| COUNT(*) | 98.0s | 82.6s | -16% |
| SUM() | 26.9s | 25.9s | -4% |
| GROUP BY | 33.4s | 40.4s | +21% |
| CROSS JOIN | 24.6s | 24.7s | ~0% |
| WHERE | 24.7s | 25.0s | +1% |
Note: COUNT(*) was compared in cold cache state after restart
Results were mixed. COUNT(*) improved by 16%, but GROUP BY was 21% worse.
pgbench TPC-B Results (5 minutes, 20 clients)
| Metric | sync | worker | Difference |
|---|---|---|---|
| TPS | 1,660 | 1,679 | +1% |
| Latency | 12.04ms | 11.91ms | -1% |
| Std. Dev. | 7.06ms | 7.67ms | +9% |
pgbench showed about 1% improvement - essentially within the margin of error.
Cache Hit Ratio
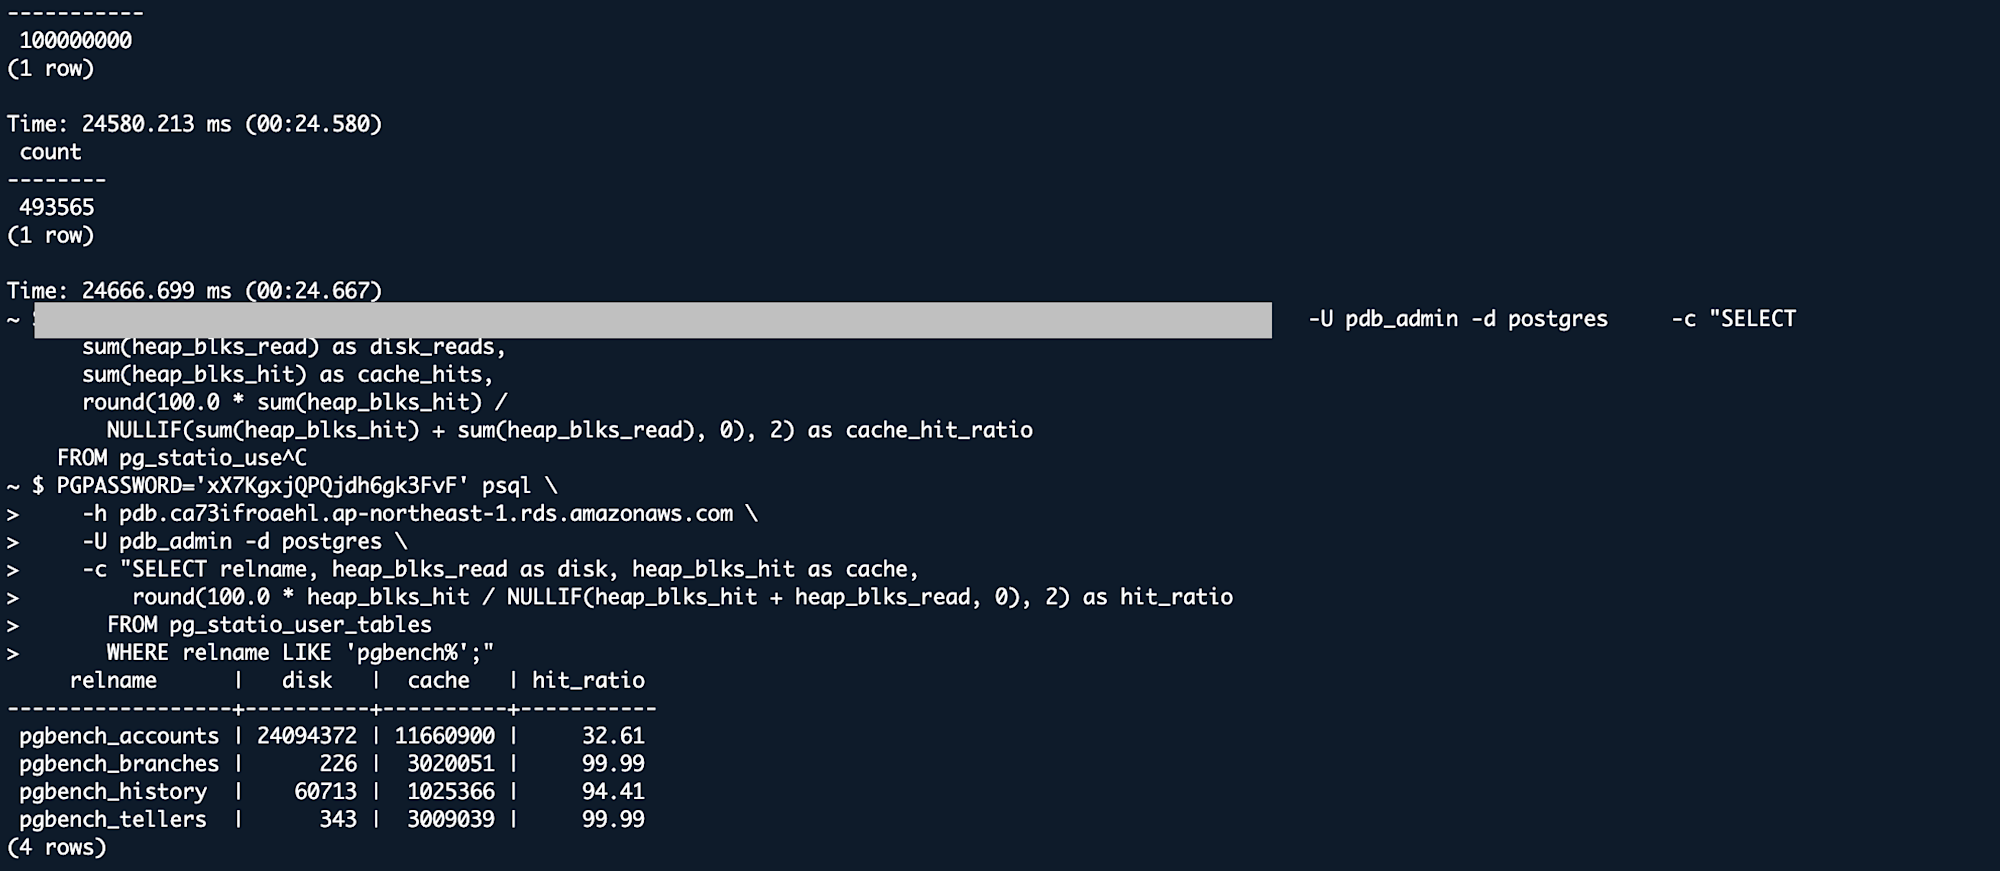
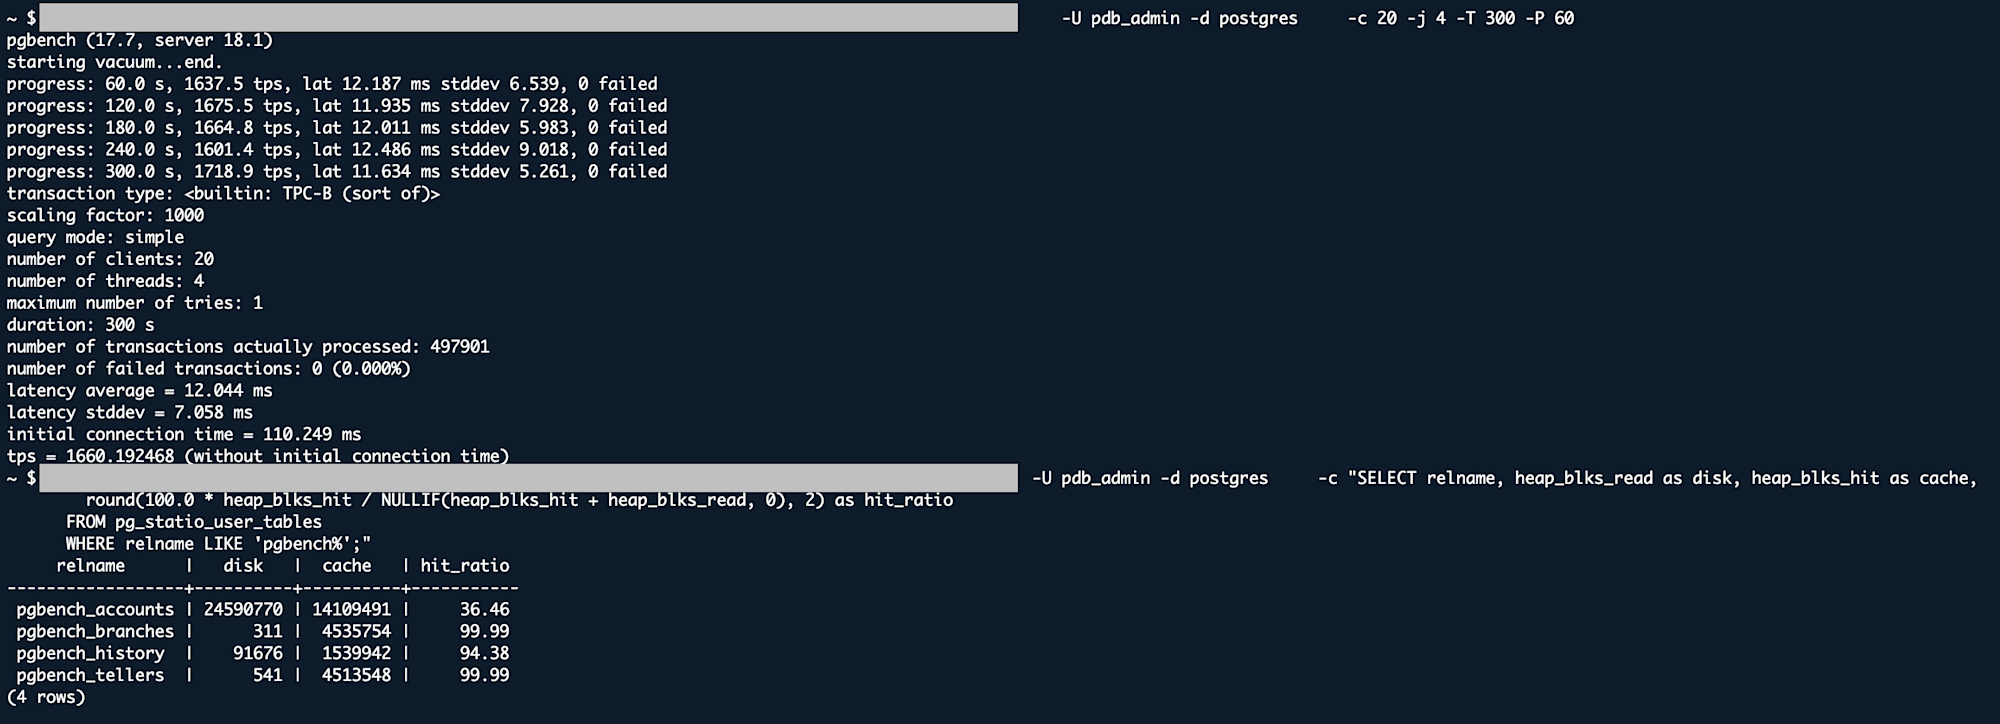
| Table | sync | worker |
|---|---|---|
| pgbench_accounts | 32.61% | 34.64% |
| pgbench_branches | 99.99% | 99.99% |
| pgbench_history | 94.41% | 94.38% |
| pgbench_tellers | 99.99% | 99.99% |
Even with 12,000 IOPS, the difference between sync and worker was only about 1% for pgbench, and full scan results were inconsistent.
io_workers=32 Experiment (I shouldn't have done this)
I thought "maybe increasing io_workers would help" and increased it from the default of 3 to 32.
Results
| Metric | io_workers=3 | io_workers=32 | Difference |
|---|---|---|---|
| TPS | 838 | 460 | -45% |
| Latency | 23.87ms | 43.37ms | +82% |
It had the opposite effect. Performance actually collapsed during the test.
Time Series Performance (gp2 environment)
Elapsed time:
├─ 1-2 min: 843-866 TPS  ← Normal
├─ 3 min:   574 TPS      ← Degradation begins
├─ 4 min:   13 TPS       ← Collapse (1509ms latency)
└─ 5 min:   13 TPS       ← Continuing (1546ms latency)
It seems that gp2 burst credits were depleted after about 3 minutes, dropping to the baseline (120 IOPS). The 32 workers all accessing storage at once created a major bottleneck.
Lesson: In this environment (2 vCPU, gp2 120 IOPS), increasing io_workers had no benefit and actually made things worse. Settings need to match the instance resources and storage performance.
Impact of EBS Storage
The biggest performance difference in this test came not from changing io_method, but from changing the EBS type.
| Item | gp2 (40GB) | gp3 (400GB) | Difference |
|---|---|---|---|
| Baseline IOPS | 120 | 12,000 | 100x |
| pgbench TPS | 837 | 1,679 | +100% (2x) |
| Full Scan | ~99s | ~25s | -75% (4x faster) |
Switching to gp3 was far more effective than trying to get a 1% improvement by changing io_method.
Looking at the cache hit ratios, pgbench_branches and pgbench_tellers showed 99.99% cache hit rates, indicating that frequently accessed data was being read from cache. Proper shared_buffers settings to utilize caching also significantly impact performance.
Why Doesn't Async I/O Show Much Effect on RDS?
Honestly, I'm not entirely sure. But there are a few possibilities.
No io_uring Support
Looking at the RDS parameter group, the choices for io_method are only sync and worker. You can't select io_uring. Reading the pganalyze article, it seems that the major performance improvements come from the io_uring mode, while improvements in worker mode are more limited.
Already Optimized?
It's possible that PostgreSQL's sequential scan and AWS EBS performance are already somewhat optimized. In a situation where there's not much room for improvement, adding async I/O might not show much effect.
Conclusion
What I confirmed through actual testing (db.m6g.large, scale 1000 environment):
| Change | Measured Performance Change |
|---|---|
| gp2 → gp3 (IOPS 100x) | +100% (2x) |
| io_method: sync → worker | +1% |
| io_workers: 3 → 32 | -45% (worse) |
Observations
- In this environment, storage IOPS and cache hit ratio had more impact on performance than changing io_method
- When increasing io_workers, you need to consider the balance with instance resources (CPU, memory) and storage performance. In this environment, increasing it was counterproductive
- The "3x faster" claims about async I/O seem to apply to environments where io_uring is available, but we didn't see such effects with RDS's
workermode
Results might differ in other environments (larger instances, io_uring-enabled environments, etc.).