
I tested connecting to DSQL from Lambda in large numbers to check for any errors

I am Iwata from the Retail App Co-Creation Department in Osaka.
Aurora DSQL, announced at re:Invent 2024, is described as a distributed SQL database that scales virtually without limits.
It's well known that traditional RDBs don't work well with Lambda due to maximum connection limitations, but since DSQL "scales virtually without limits," it seems the infrastructure will handle connection concerns automatically. I actually tested simultaneous access to DSQL by launching many Lambda functions concurrently, so I'd like to share the results.
Environment
Here's the environment used for this verification.
- Lambda
- Runtime: Node.js22x
- Architecture: arm64
- Region: Virginia (us-east-1)
- Memory allocation: 1769M
- EC2
- Instance type: m5.large
- Region: Virginia (us-east-1)
- hey: v0.1.4
- Libraries, etc.
- pg: 8.16.3
- @aws-sdk/dsql-signer: 3.864.0## Let's Try It
Let's go ahead with verification.
First, we'll prepare a test Lambda. I've prepared the following code for this purpose.
			import { Client } from 'pg'
import { DsqlSigner } from '@aws-sdk/dsql-signer';

const region = process.env.AWS_REGION;
const clusterEndpoint = `${process.env.DSQL_CLUSTER_IDENTIFIER}.dsql.${region}.on.aws`
const signer = new DsqlSigner({
      hostname: clusterEndpoint,
      region,
    });
const token = await signer.getDbConnectAdminAuthToken();
const getNewClient = () => (
  new Client({
      host: clusterEndpoint,
      port: 5432,
      database: 'postgres',
      user: 'admin',
      password: token,
      ssl:true
  })
);
let client = null;
let connected = false;

export const lambdaHandler = async (event, context) => {
  if (!connected) {
    client = getNewClient();
    await client.connect();
    connected = true;
  }
  await client.query(`SELECT pg_sleep(5)`);
  return {
    statusCode: 200,
    body: JSON.stringify({
      message: 'Hello from DSQL!',
    })
  }
};
This process connects to DSQL if a connection hasn't been established yet, and then simply executes SELECT pg_sleep(5). Any SQL would work, but using something like SELECT NOW() would finish instantly, making it difficult to increase Lambda's concurrent executions, which is why I'm using pg_sleep.
I'll deploy this Lambda with the following SAM template to create an API GW → Lambda configuration.
			AWSTemplateFormatVersion: '2010-09-09'
Transform: AWS::Serverless-2016-10-31
Globals:
  Function:
    Timeout: 10
    Tracing: Active
    MemorySize: 1769
  Api:
    TracingEnabled: true
Resources:
  Dsql:
    Type: AWS::DSQL::Cluster
    Properties:
      DeletionProtectionEnabled: false
  DsqlTestFunction:
    Type: AWS::Serverless::Function
    Properties:
      CodeUri: hello-world/
      Handler: app.lambdaHandler
      Runtime: nodejs22.x
      Architectures:
      - arm64
      Layers:
        - arn:aws:lambda:us-east-1:615299751070:layer:AWSOpenTelemetryDistroJs:8
      Role: !GetAtt LambdaRole.Arn
      Environment:
        Variables:
          OTEL_NODE_ENABLED_INSTRUMENTATIONS: pg
          AWS_LAMBDA_EXEC_WRAPPER: /opt/otel-instrument
          DSQL_CLUSTER_IDENTIFIER: !Ref Dsql
      Events:
        api:
          Type: Api
          Properties:
            Path: /dsql
            Method: get
  LambdaRole:
      Type: AWS::IAM::Role
      Properties:
        AssumeRolePolicyDocument:
          Version: '2012-10-17'
          Statement:
          - Effect: Allow
            Principal:
              Service:
              - 'lambda.amazonaws.com'
            Action: sts:AssumeRole
        Policies:
        -
          PolicyName: dsql-blog-policy
          PolicyDocument:
            Version: "2012-10-17"
            Statement:
            -
              Effect: "Allow"
              Action:
                - 'dsql:*'
                - "logs:*"
                - "xray:*"
              Resource: '*'

```To make it easier to analyze later, we connect the ADOT layer published by AWS `arn:aws:lambda:us-east-1:615299751070:layer:AWSOpenTelemetryDistroJs:8` and set the environment variable `OTEL_NODE_ENABLED_INSTRUMENTATIONS` to `pg` to enable detailed tracing of pg connection processes.

When ready, deploy the verification environment with `sam build && sam deploy`.

### Measuring with Lambda concurrency of 1,000

Once prepared, use the [hey](https://github.com/rakyll/hey) command to send requests to the API GW. This time, we sent 1,000 requests (almost) simultaneously with the following command.

Started at 10:50
hey -c 1000 -n 1000 https://<API GW ID>.execute-api.us-east-1.amazonaws.com/Prod/dsql
Note that before executing the command, we performed a `sam delete` and `sam deploy` to delete and redeploy all resources, so there should be no warm environments in Lambda or DSQL query processors, and cold starts should occur on first access. The results were as follows:
Summary:
Total: 8.4554 secs
Slowest: 8.4390 secs
Fastest: 7.3154 secs
Average: 7.9864 secs
Requests/sec: 118.2682
Total data: 30000 bytes
Size/request: 30 bytes
Response time histogram:
7.315 [1] |
7.428 [1] |
7.540 [6] |■
7.652 [3] |■
7.765 [73] |■■■■■■■■■■■■
7.877 [192] |■■■■■■■■■■■■■■■■■■■■■■■■■■■■■■■■■
7.990 [215] |■■■■■■■■■■■■■■■■■■■■■■■■■■■■■■■■■■■■■
8.102 [234] |■■■■■■■■■■■■■■■■■■■■■■■■■■■■■■■■■■■■■■■■
8.214 [217] |■■■■■■■■■■■■■■■■■■■■■■■■■■■■■■■■■■■■■
8.327 [52] |■■■■■■■■■
8.439 [6] |■
Latency distribution:
10% in 7.7795 secs
25% in 7.8664 secs
50% in 7.9947 secs
75% in 8.1087 secs
90% in 8.1809 secs
95% in 8.2224 secs
99% in 8.3095 secs
Details (average, fastest, slowest):
DNS+dialup: 0.5355 secs, 7.3154 secs, 8.4390 secs
DNS-lookup: 0.0695 secs, 0.0043 secs, 0.1601 secs
req write: 0.0735 secs, 0.0001 secs, 0.1683 secs
resp wait: 7.3768 secs, 6.8654 secs, 7.8326 secs
resp read: 0.0000 secs, 0.0000 secs, 0.0002 secs
Status code distribution:
[200] 1000 responses
As shown in the output `[200] 1000 responses`, no connection errors occurred!### Checking Various Metrics
Let's check various metrics after the test execution.
First, the Lambda concurrent executions.
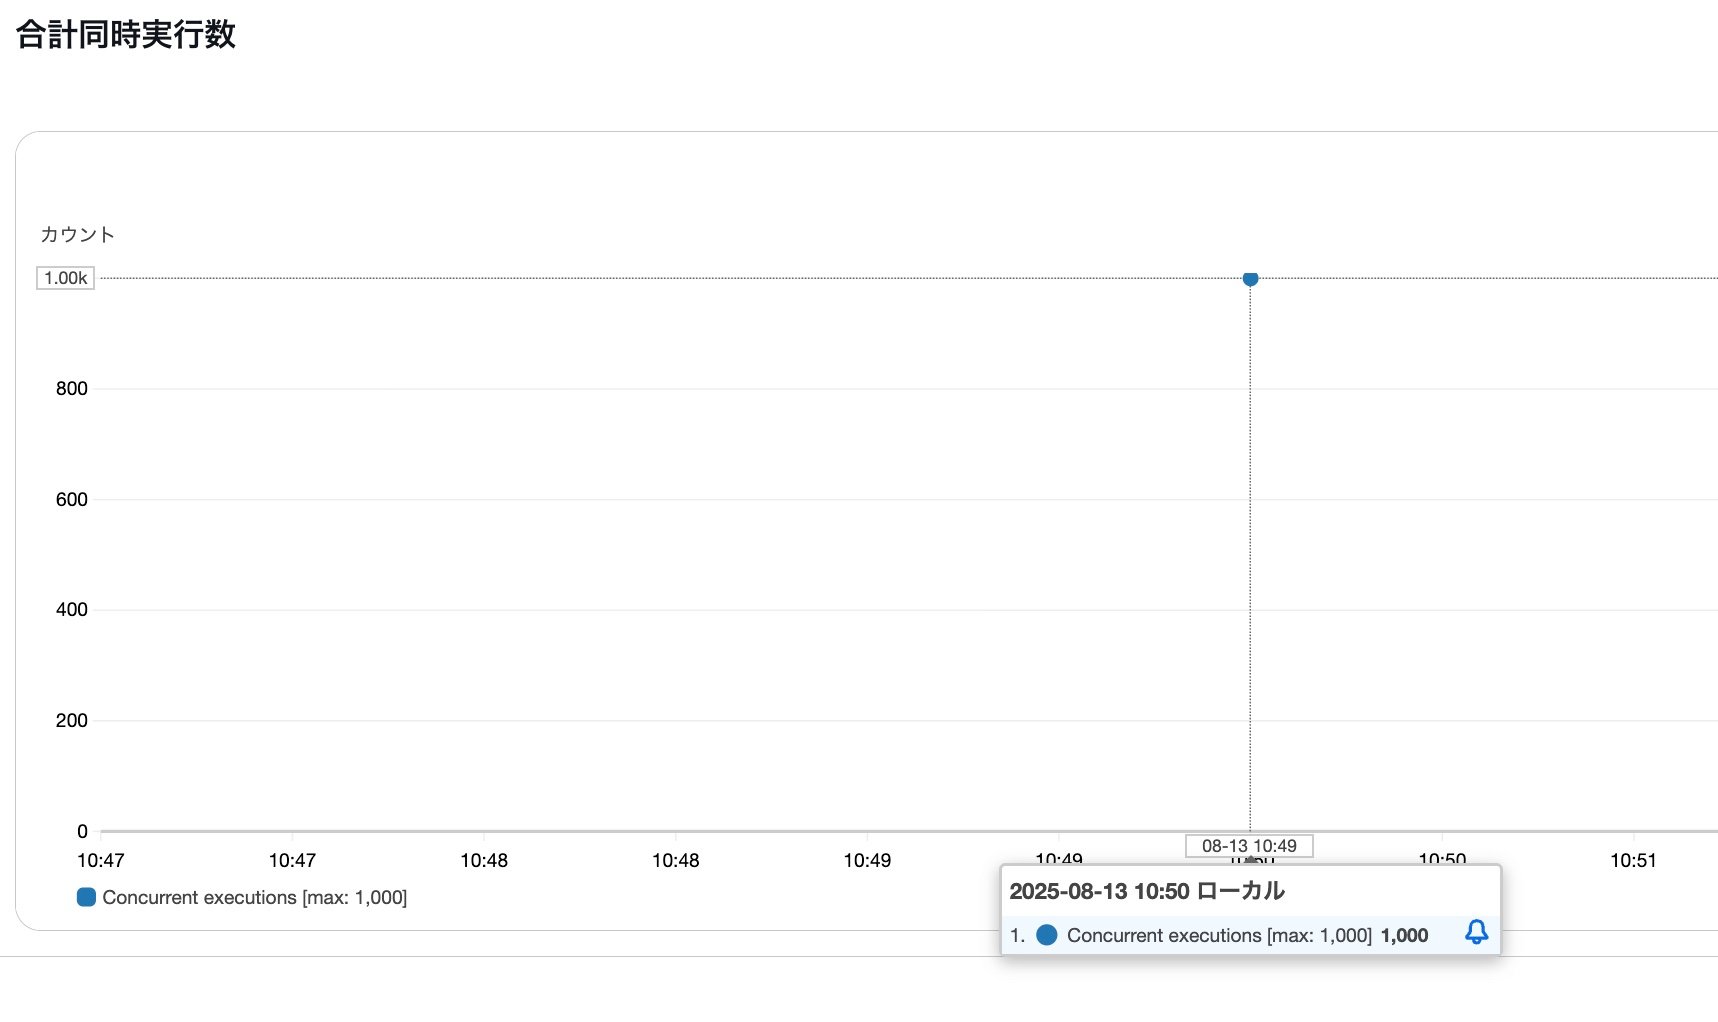
As expected, we achieved 1,000 concurrent executions.
I checked one trace result from X-Ray as a test.
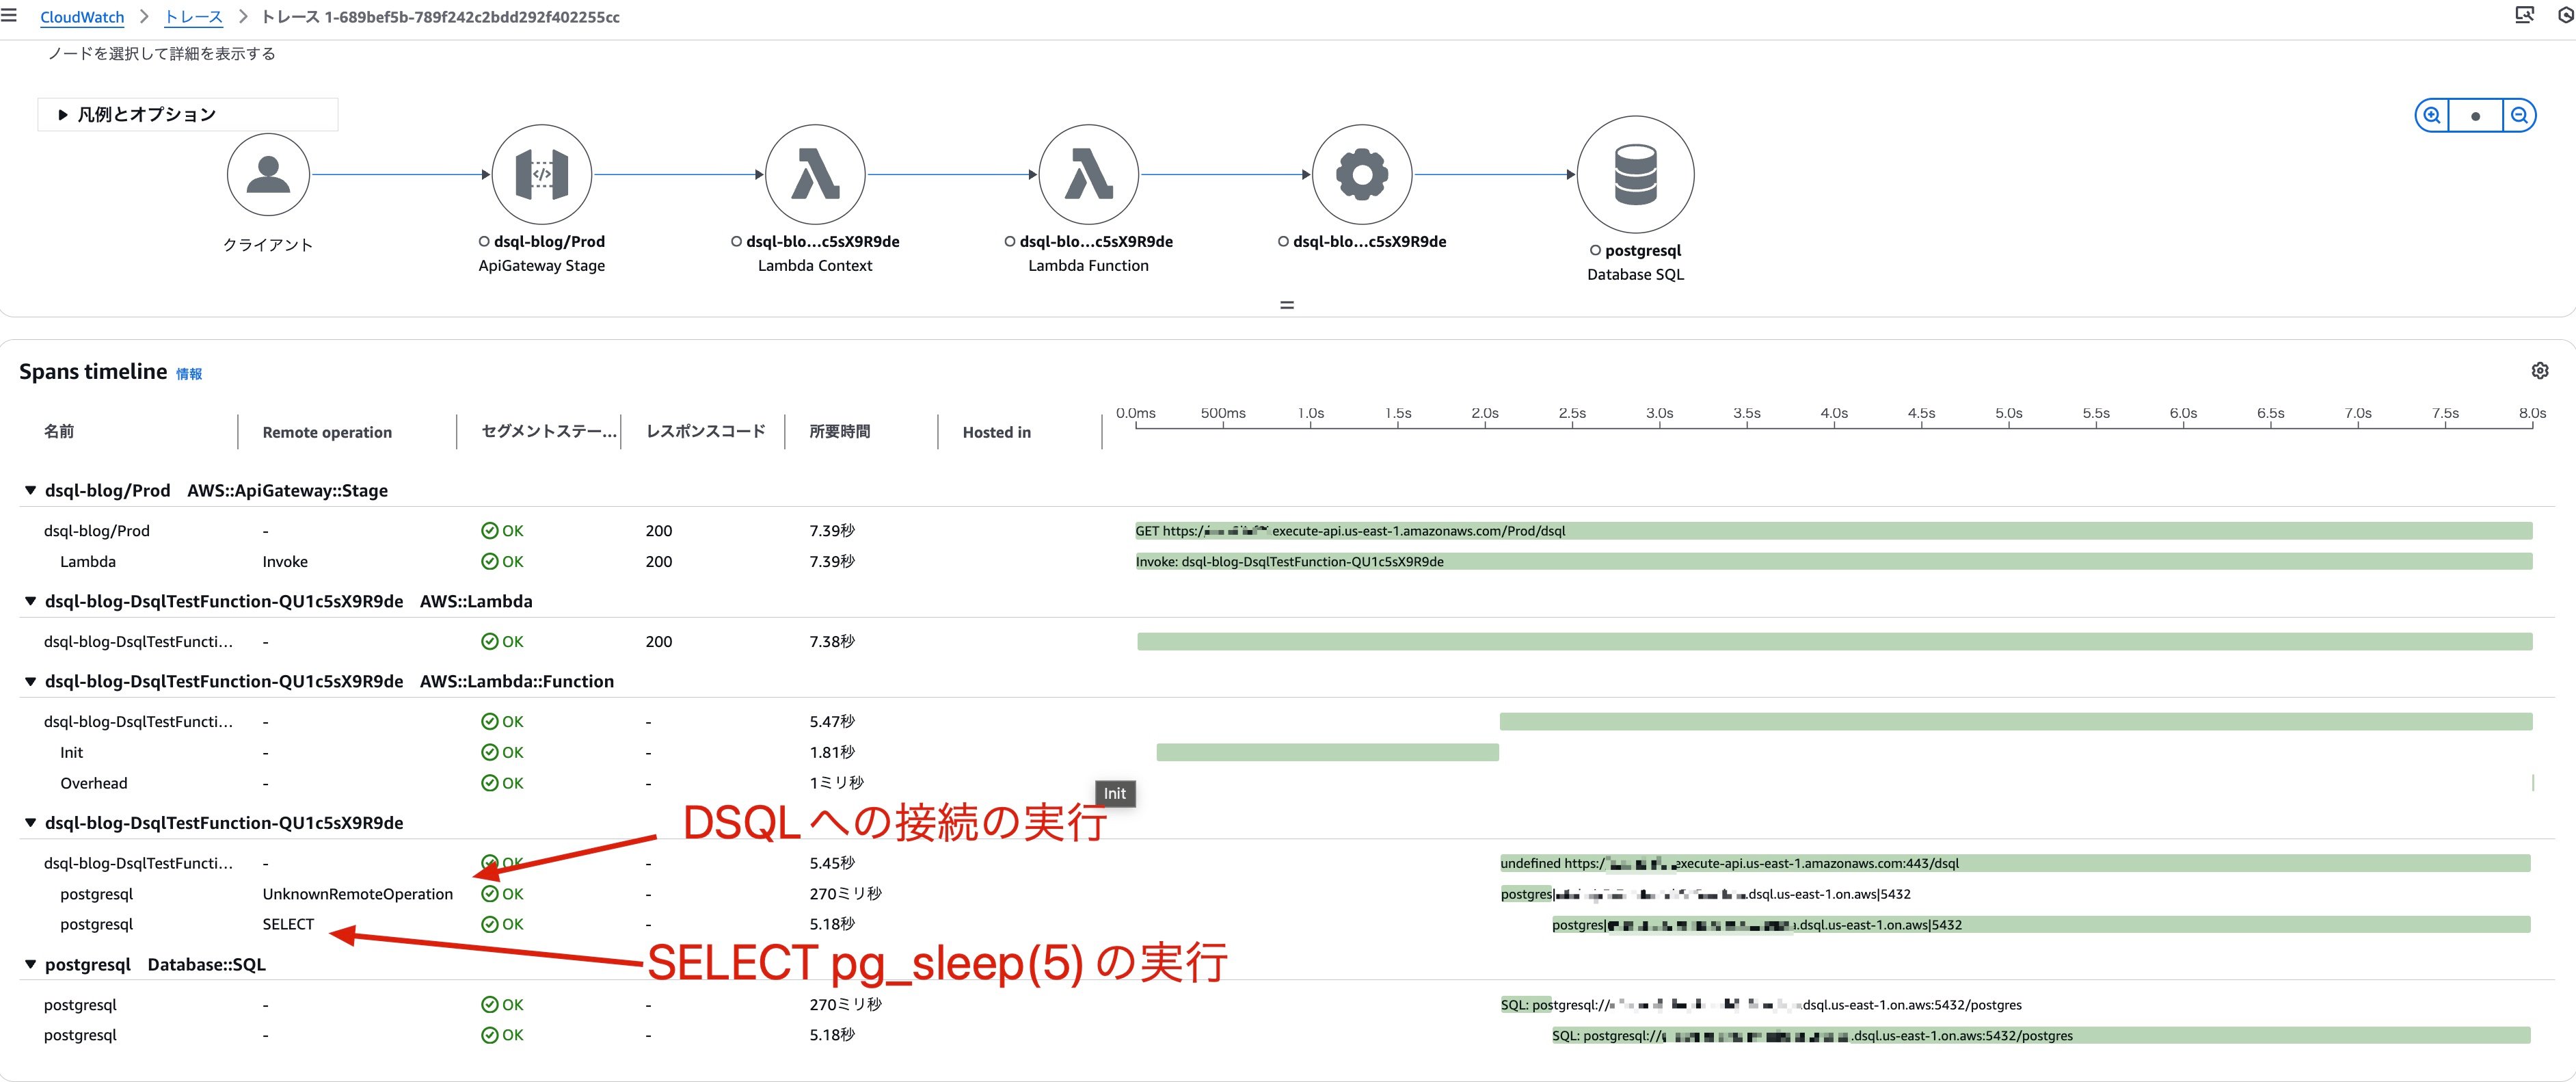
The `UnknownRemoteOperation` displayed in `Remote operation` is the process of connecting to DSQL with `await client.connect();`, and the one displaying `SELECT` is the process of issuing a SELECT statement to DSQL with `await client.query...`.
270 milliseconds for connection seems quite time-consuming. Perhaps the Firecracker MicroVM, which is the query processor entity, experienced a cold start? Currently, we can't determine cold starts from DSQL metrics, but it might be fun to speculate about these architectural details.
I used Transaction Search with the following query to aggregate latency for DB-related operations.
filter ispresent(attributes.db.name)
| stats count(*) as cnt,
min(durationNano / 1000000) as min,
max(durationNano / 1000000) as max,
avg(durationNano / 1000000) as avg,
pct(durationNano / 1000000, 95) as p95,
pct(durationNano / 1000000, 90) as p90,
pct(durationNano / 1000000, 50) as p50
by name
The results were as follows:

---
| Operation | Count | Min | Max | Avg | 95th percentile | 90th percentile | Median |
| --- | --- | --- | --- | --- | --- | --- | --- |
| pg.query:SELECT postgres | 1000 | 5117.8592 | 5395.1828 | 5173.2771 | 5301.3292 | 5264.3679 | 5129.325 |
| pg.connect | 1000 | 52.449 | 454.812 | 218.8274 | 334.3186 | 310.4837 | 233.0551 |
---

For pg.connect, the minimum value of 52.449ms versus the maximum value of 454.812ms shows quite a large variance. Could this be related to query processor cold starts? I'd like to investigate this further separately.### Scaling Lambda concurrency up to about 7,000

After confirming that Lambda with 1,000 concurrent executions doesn't produce any errors, I'll try increasing the concurrency even further. In a previous blog post I wrote, I had requested a limit increase for Lambda concurrency to 7,000, so I'll now attempt to test with 7,000 concurrent executions.

https://dev.classmethod.jp/articles/lambda-scaleout-improved-by-12times/

I recreated the test environment with `sam delete && sam deploy`, and this time I'll use the hey command to send 7,000 requests.
hey -c 7000 -n 250000 -q 1 https://<API GW ID>.execute-api.us-east-1.amazonaws.com/Prod/dsql
Here are the results:
Summary:
Total: 193.5898 secs
Slowest: 19.6279 secs
Fastest: 0.0110 secs
Average: 3.5422 secs
Requests/sec: 1265.5624
Total data: 7987410 bytes
Size/request: 32 bytes
Response time histogram:
0.011 [1] |
1.973 [84408] |■■■■■■■■■■■■■■■■■■■■■■■■■■
3.934 [15137] |■■■■■
5.896 [128119] |■■■■■■■■■■■■■■■■■■■■■■■■■■■■■■■■■■■■■■■■
7.858 [11581] |■■■■
9.819 [4061] |■
11.781 [1520] |
13.743 [78] |
15.705 [93] |
17.666 [0] |
19.628 [1] |
Latency distribution:
10% in 0.1668 secs
25% in 0.5442 secs
50% in 5.0286 secs
75% in 5.0340 secs
90% in 5.6061 secs
95% in 6.5266 secs
99% in 9.3013 secs
Details (average, fastest, slowest):
DNS+dialup: 0.1016 secs, 0.0110 secs, 19.6279 secs
DNS-lookup: 0.1359 secs, 0.0000 secs, 4.0230 secs
req write: 0.0358 secs, 0.0000 secs, 4.0838 secs
resp wait: 3.2332 secs, 0.0109 secs, 19.5949 secs
resp read: 0.0188 secs, 0.0000 secs, 2.4516 secs
Status code distribution:
[200] 138759 responses
[500] 97321 responses
[502] 8919 responses
Error distribution:
[1] Get "https://faawmhbgr0.execute-api.us-east-1.amazonaws.com/Prod/dsql": context deadline exceeded (Client.Timeout exceeded while awaiting headers)
This time we're seeing a large number of 500 errors. There's also an error on the load testing client side, but since it's just one instance, we can probably ignore it. Let's check the Lambda metrics.
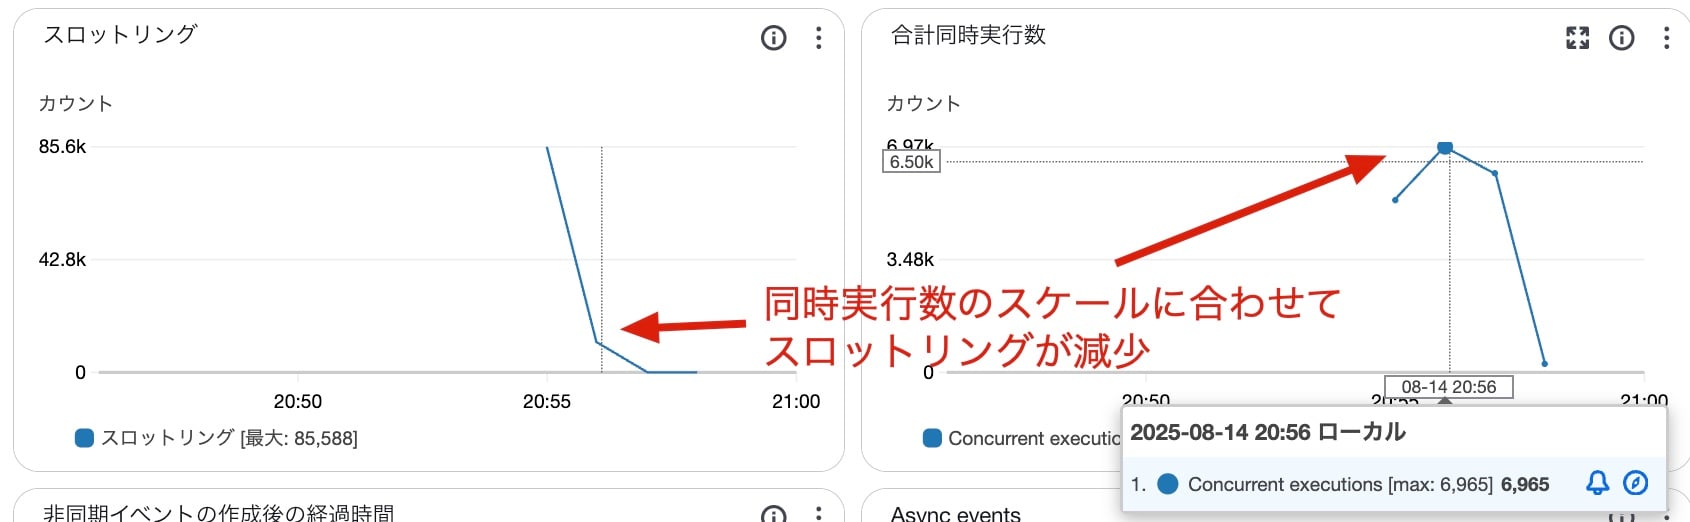
I started measuring around 20:55, and we can see that around 20:56, the concurrent executions scaled out to about 7,000, and at the same time, throttling errors decreased.
Let's look at the trace map for the overall picture.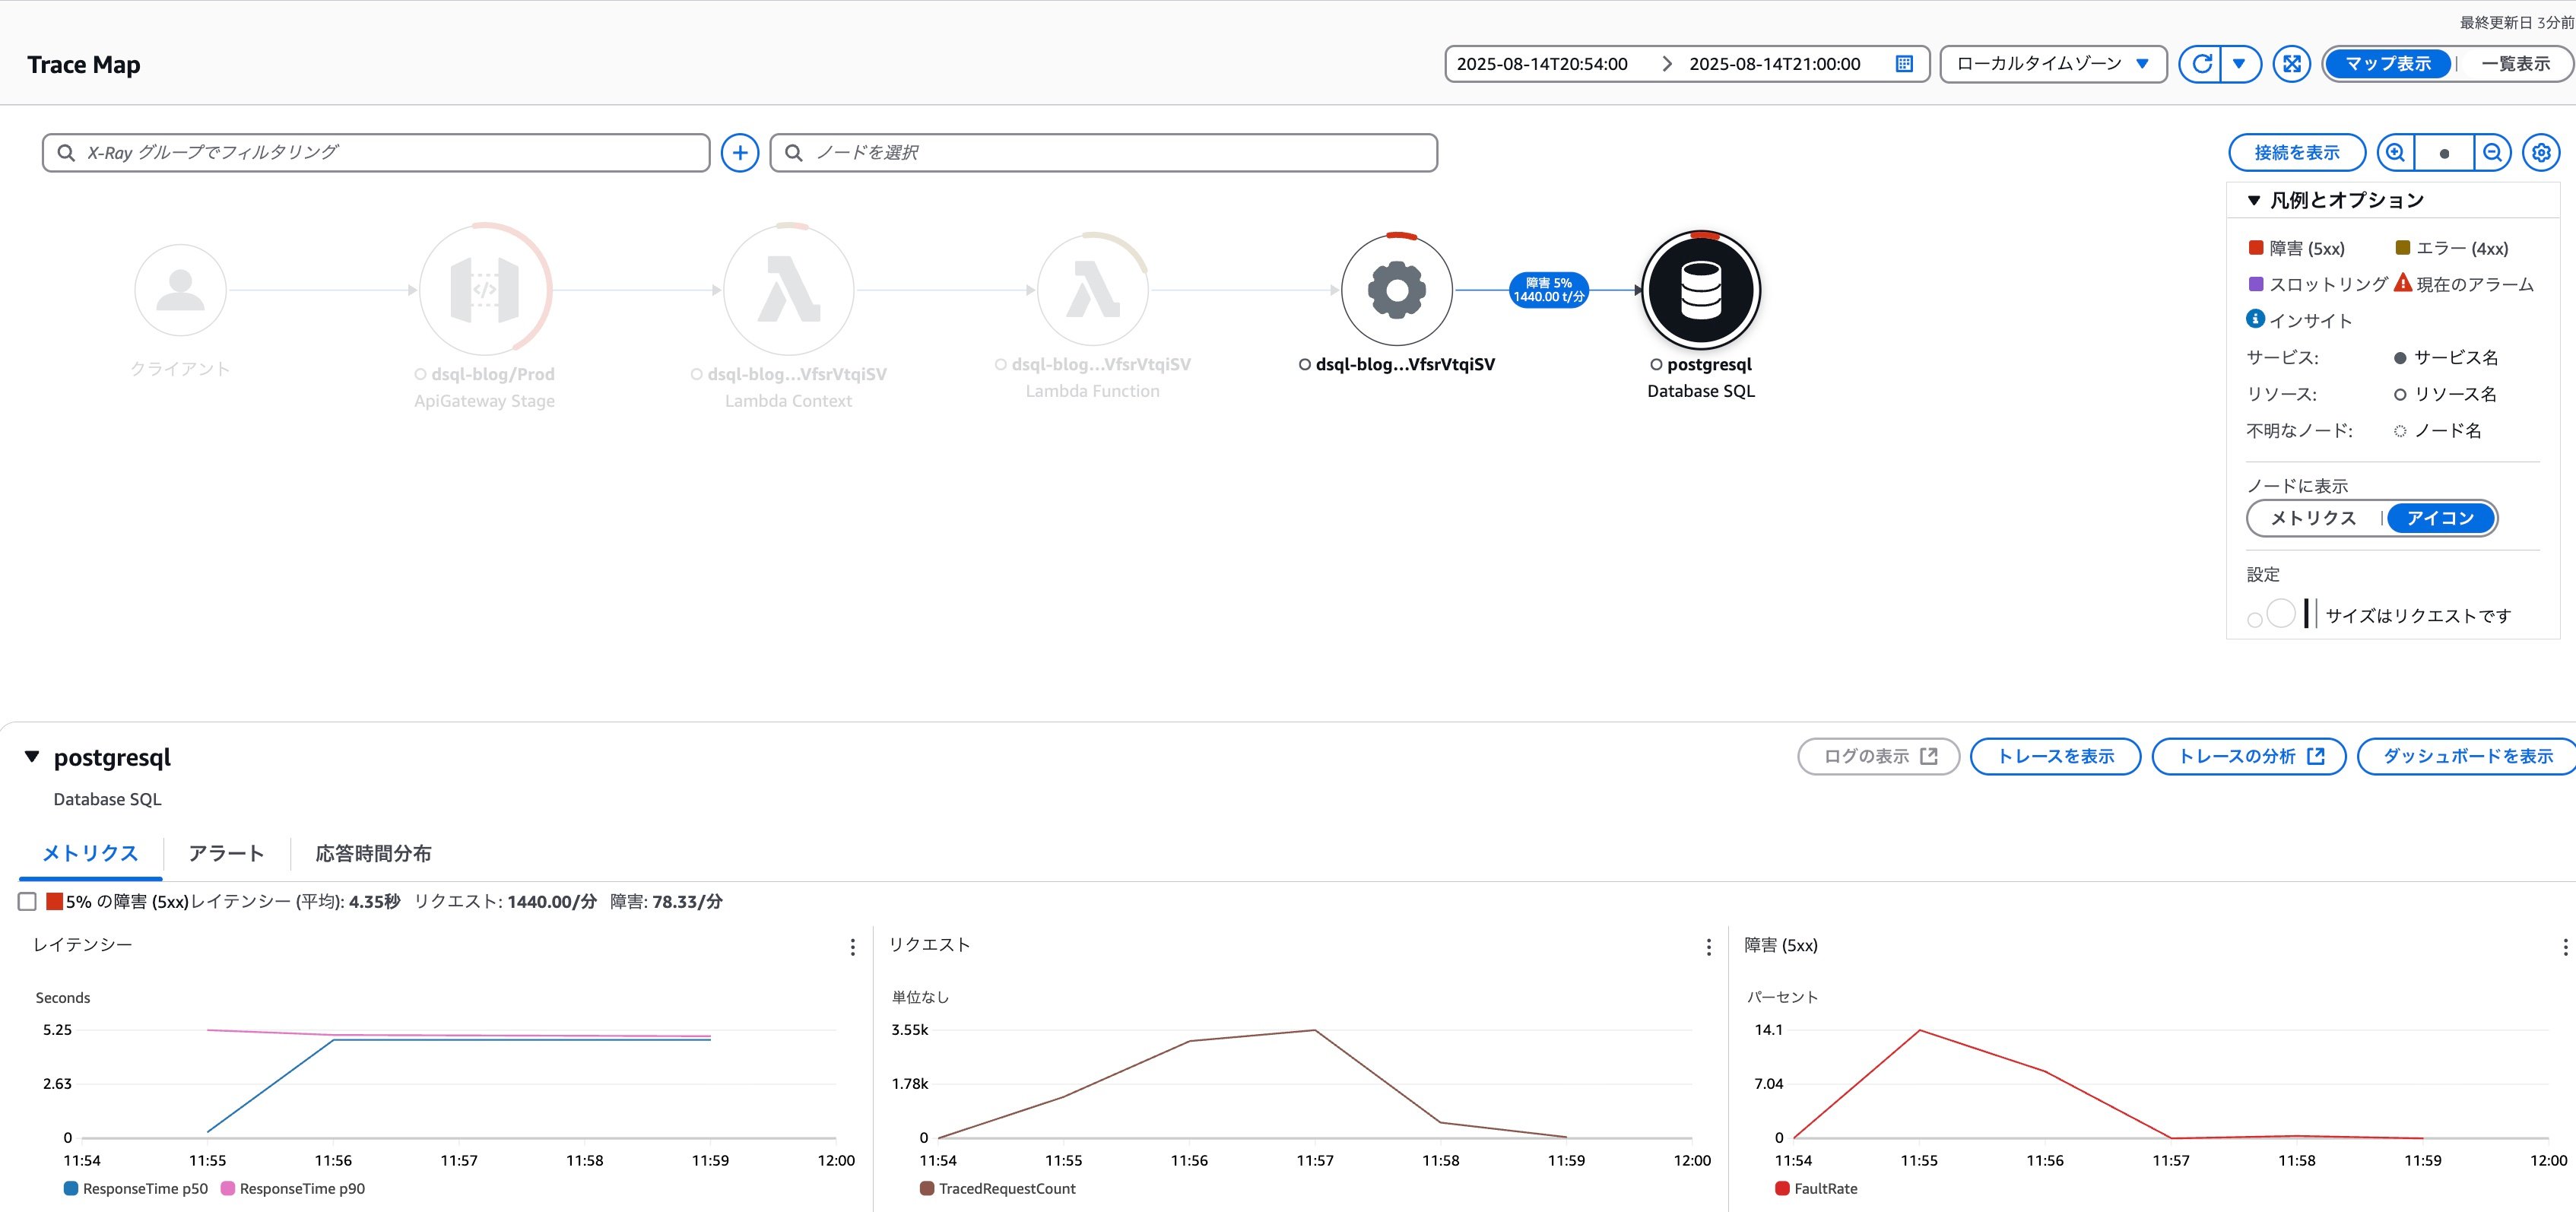
Although the proportion is lower than Lambda throttling errors, we can see that errors are also occurring in DSQL-related operations.
When checking the status of DSQL-related operations in Application Signals, we can see that 56% of connection processes experienced failures.
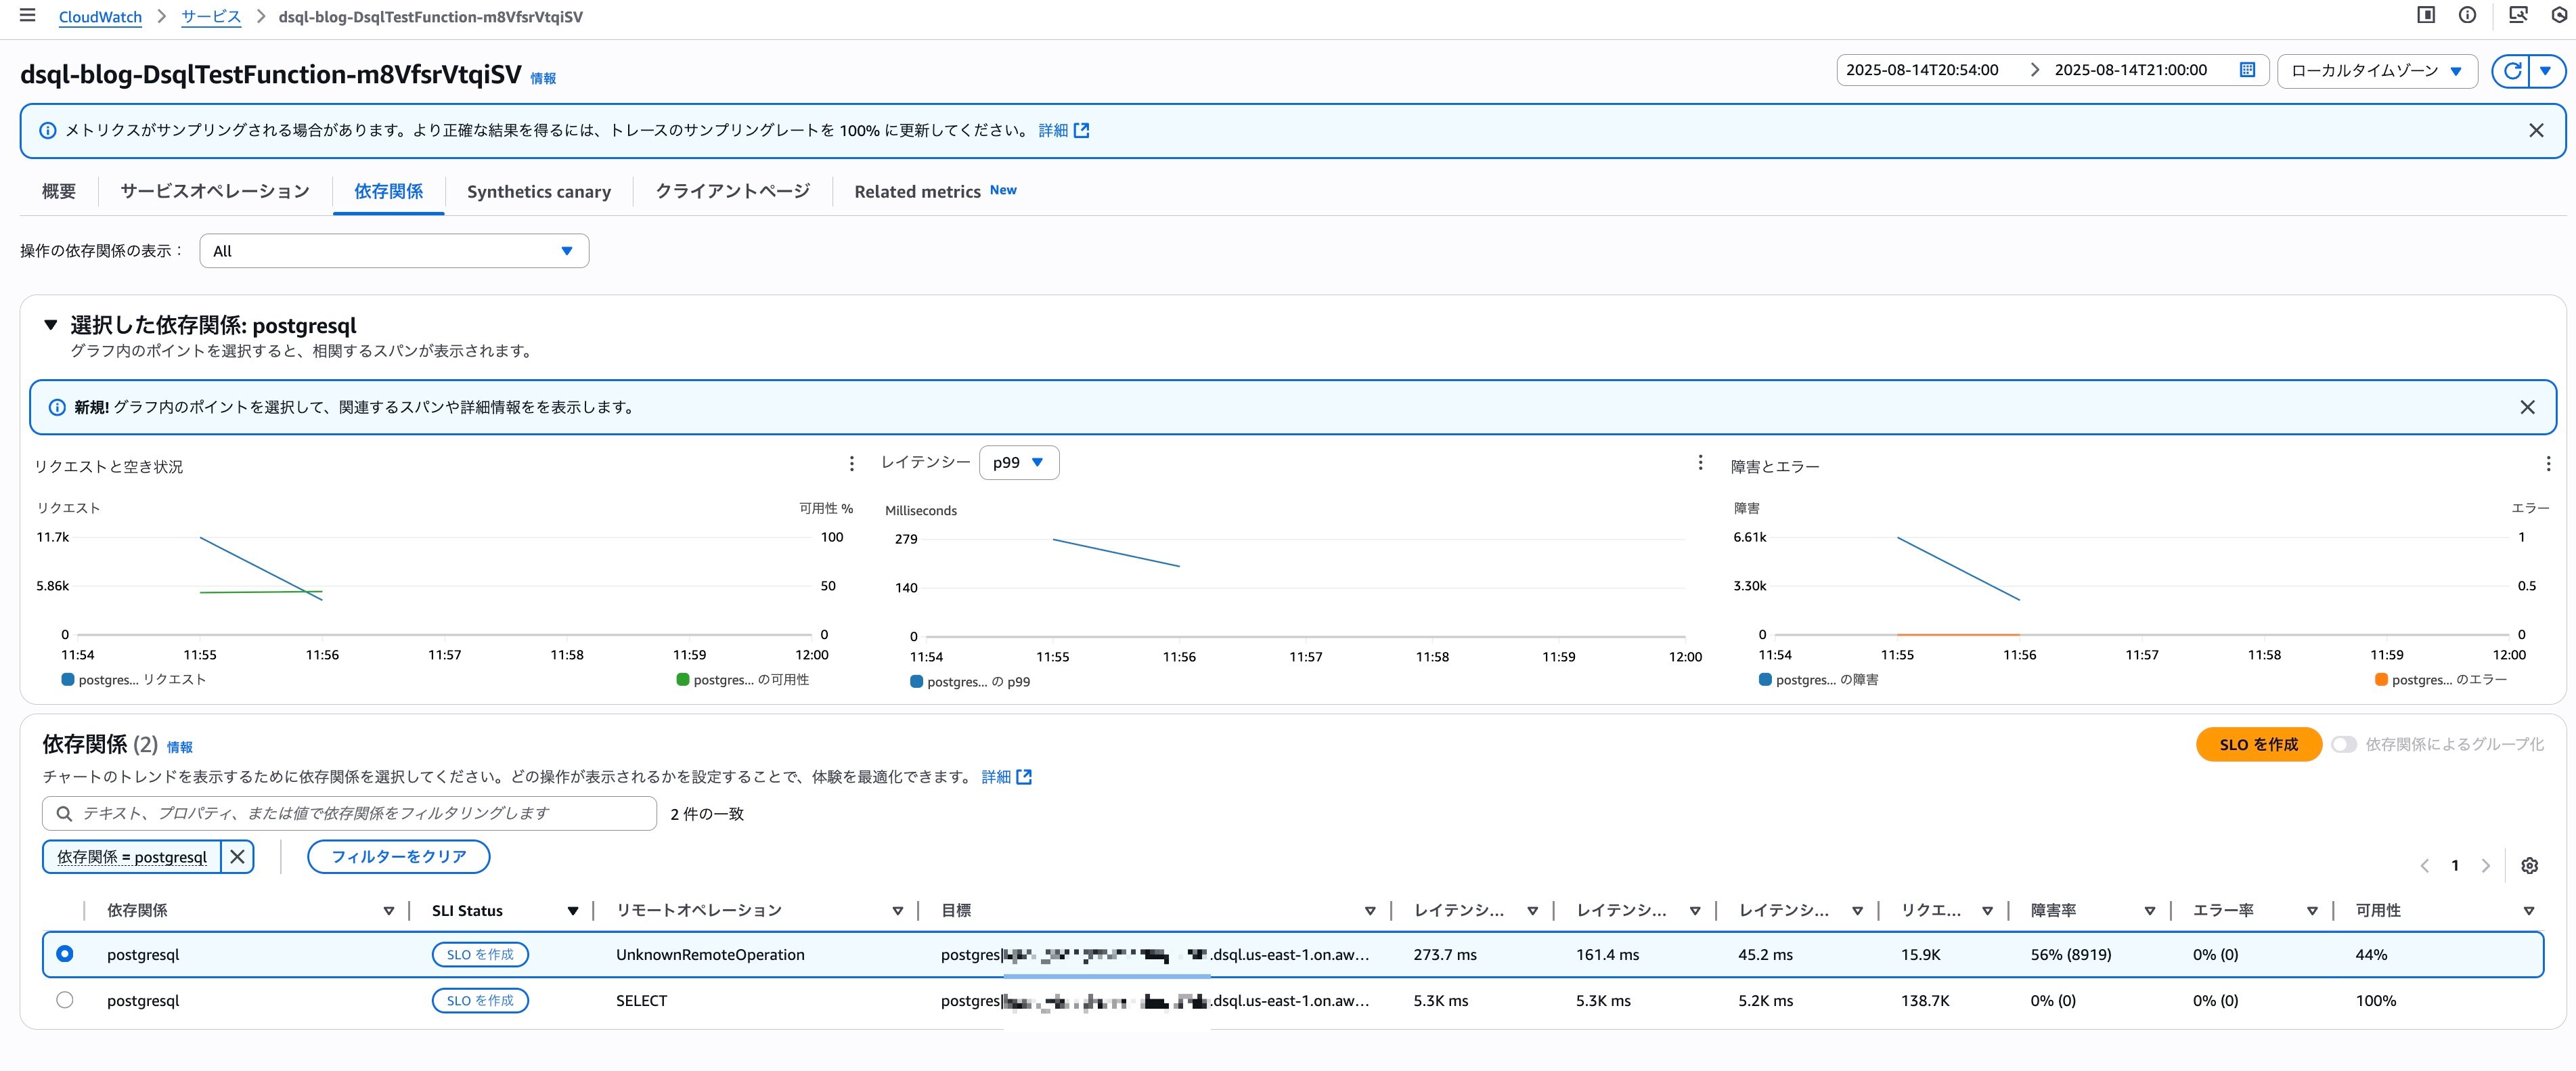
Next, let's check what kind of errors were occurring in DSQL-related operations from the Lambda logs.
When searching logs for the string `ERR`, the following logs were output in large quantities:
```json
{
"errorType": "error",
"errorMessage": "unable to accept connection, rate exceeded",
"code": "53400",
"length": 110,
"name": "error",
"severity": "FATAL",
"detail": "Session Id: svtcuhakmrll35mtgjvooj5gzy",
"stack": [
"error: unable to accept connection, rate exceeded",
" at Parser.parseErrorMessage (/var/task/node_modules/pg-protocol/dist/parser.js:285:98)",
" at Parser.handlePacket (/var/task/node_modules/pg-protocol/dist/parser.js:122:29)",
" at Parser.parse (/var/task/node_modules/pg-protocol/dist/parser.js:35:38)",
" at TLSSocket.<anonymous> (/var/task/node_modules/pg-protocol/dist/index.js:11:42)",
" at TLSSocket.emit (node:events:518:28)",
" at addChunk (node:internal/streams/readable:561:12)",
" at readableAddChunkPushByteMode (node:internal/streams/readable:512:3)",
" at Readable.push (node:internal/streams/readable:392:5)",
" at TLSWrap.onStreamRead (node:internal/stream_base_commons:189:23)",
" at TLSWrap.callbackTrampoline (node:internal/async_hooks:130:17)"
]
}
It seems that connections to DSQL couldn't be established due to hitting the rate limit.
Let's use a CW Logs Insights query to aggregate the number of errors per second by error message.
			filter ispresent(errorMessage)
| stats count(*) by errorMessage,bin(1s) as t
| sort t
The results are as follows. The error pattern was consistently "unable to accept connection, rate exceeded".
| errorMessage | t | count(*) |
| --- | --- | --- || unable to accept connection, rate exceeded | 2025-08-14 11:55:23.000 | 88 |
| unable to accept connection, rate exceeded | 2025-08-14 11:55:24.000 | 171 |
| unable to accept connection, rate exceeded | 2025-08-14 11:55:25.000 | 171 |
| unable to accept connection, rate exceeded | 2025-08-14 11:55:26.000 | 47 |
| unable to accept connection, rate exceeded | 2025-08-14 11:55:27.000 | 377 |
| unable to accept connection, rate exceeded | 2025-08-14 11:55:28.000 | 72 |
| unable to accept connection, rate exceeded | 2025-08-14 11:55:29.000 | 222 |
| unable to accept connection, rate exceeded | 2025-08-14 11:55:30.000 | 123 |
| unable to accept connection, rate exceeded | 2025-08-14 11:55:31.000 | 105 |
| unable to accept connection, rate exceeded | 2025-08-14 11:55:32.000 | 187 |
| unable to accept connection, rate exceeded | 2025-08-14 11:55:33.000 | 51 |
| unable to accept connection, rate exceeded | 2025-08-14 11:55:34.000 | 74 |
| unable to accept connection, rate exceeded | 2025-08-14 11:55:35.000 | 18 |
| unable to accept connection, rate exceeded | 2025-08-14 11:55:36.000 | 400 |
| unable to accept connection, rate exceeded | 2025-08-14 11:55:37.000 | 120 |
| unable to accept connection, rate exceeded | 2025-08-14 11:55:38.000 | 1571 |
| unable to accept connection, rate exceeded | 2025-08-14 11:55:39.000 | 490 |
| unable to accept connection, rate exceeded | 2025-08-14 11:55:40.000 | 133 |
| unable to accept connection, rate exceeded | 2025-08-14 11:55:41.000 | 6 |
| unable to accept connection, rate exceeded | 2025-08-14 11:55:42.000 | 27 |
| unable to accept connection, rate exceeded | 2025-08-14 11:55:43.000 | 86 |
| unable to accept connection, rate exceeded | 2025-08-14 11:55:45.000 | 26 |
| unable to accept connection, rate exceeded | 2025-08-14 11:55:46.000 | 76 |
| unable to accept connection, rate exceeded | 2025-08-14 11:55:47.000 | 1 |
| unable to accept connection, rate exceeded | 2025-08-14 11:55:48.000 | 5 || unable to accept connection, rate exceeded | 2025-08-14 11:55:49.000 | 75 |
| unable to accept connection, rate exceeded | 2025-08-14 11:55:50.000 | 1 |
| unable to accept connection, rate exceeded | 2025-08-14 11:55:51.000 | 83 |
| unable to accept connection, rate exceeded | 2025-08-14 11:55:52.000 | 282 |
| unable to accept connection, rate exceeded | 2025-08-14 11:55:53.000 | 215 |
| unable to accept connection, rate exceeded | 2025-08-14 11:55:54.000 | 447 |
| unable to accept connection, rate exceeded | 2025-08-14 11:55:55.000 | 21 |
| unable to accept connection, rate exceeded | 2025-08-14 11:55:56.000 | 60 |
| unable to accept connection, rate exceeded | 2025-08-14 11:55:57.000 | 236 |
| unable to accept connection, rate exceeded | 2025-08-14 11:55:58.000 | 163 |
| unable to accept connection, rate exceeded | 2025-08-14 11:55:59.000 | 357 |
| unable to accept connection, rate exceeded | 2025-08-14 11:56:00.000 | 69 |
| unable to accept connection, rate exceeded | 2025-08-14 11:56:01.000 | 130 |
| unable to accept connection, rate exceeded | 2025-08-14 11:56:02.000 | 259 |
| unable to accept connection, rate exceeded | 2025-08-14 11:56:03.000 | 85 |
| unable to accept connection, rate exceeded | 2025-08-14 11:56:04.000 | 166 |
| unable to accept connection, rate exceeded | 2025-08-14 11:56:05.000 | 85 |
| unable to accept connection, rate exceeded | 2025-08-14 11:56:06.000 | 166 |
| unable to accept connection, rate exceeded | 2025-08-14 11:56:07.000 | 265 |
| unable to accept connection, rate exceeded | 2025-08-14 11:56:08.000 | 99 |
| unable to accept connection, rate exceeded | 2025-08-14 11:56:09.000 | 254 |
| unable to accept connection, rate exceeded | 2025-08-14 11:56:10.000 | 132 |
| unable to accept connection, rate exceeded | 2025-08-14 11:56:11.000 | 146 |
| unable to accept connection, rate exceeded | 2025-08-14 11:56:12.000 | 86 |
| unable to accept connection, rate exceeded | 2025-08-14 11:56:13.000 | 199 || unable to accept connection, rate exceeded | 2025-08-14 11:56:14.000 | 75 |
| unable to accept connection, rate exceeded | 2025-08-14 11:56:15.000 | 26 |
| unable to accept connection, rate exceeded | 2025-08-14 11:56:16.000 | 6 |
| unable to accept connection, rate exceeded | 2025-08-14 11:56:17.000 | 45 |
| unable to accept connection, rate exceeded | 2025-08-14 11:56:18.000 | 19 |
| unable to accept connection, rate exceeded | 2025-08-14 11:56:19.000 | 1 |
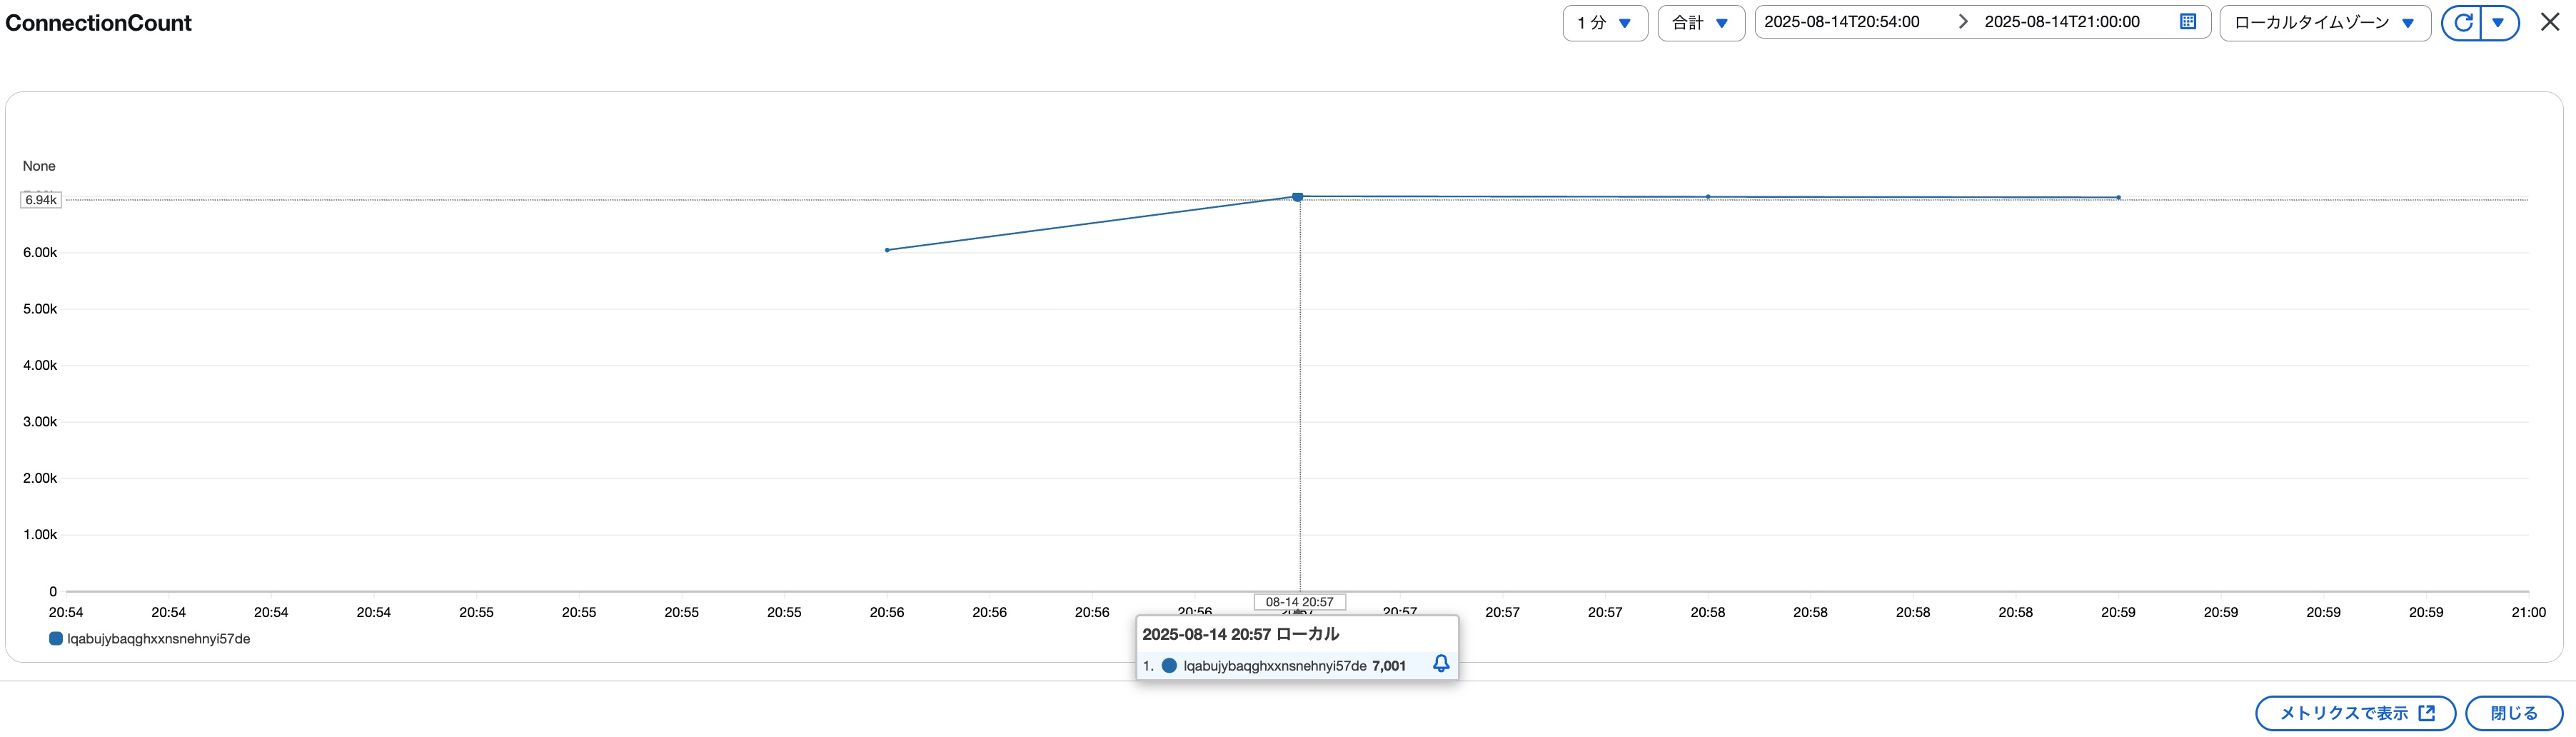
Let's check how ConnectionCount changed according to DSQL metrics. The results are as follows, reaching 7,001 connections at 20:57. *Note: The test scenario was expected to reach 7,000, but perhaps there was an error in some process?
Based on the connection logs we just checked, the last connection error occurred at around 20:56:19, so it makes sense that Lambda concurrent executions ≒ DSQL ConnectionCount at 20:57 is consistent.
 ## Reexamining DSQL Limitations
Summarizing the verification results so far, when we spiked Lambda's concurrent executions up to 1,000, no errors occurred, but when we increased it to 7,000, we encountered the unable to accept connection, rate exceeded error. Though it may seem out of order, let's review the DSQL limitation documentation again. As of August 2025, the following limitations exist.
Note: Only connection-related items excerpted from the official documentation
| Description | Default Limit | Configurable? | Aurora DSQL Error Code | Error Message |
|---|---|---|---|---|
| Maximum connections per cluster | 10,000 connections | Yes | TOO_MANY_CONNECTIONS(53300) |
Unable to accept connection, too many open connections. |
| Maximum connection rate per cluster | 100 connections/second | No | CONFIGURED_LIMIT_EXCEEDED(53400) |
Unable to accept connection, rate exceeded. |
| Maximum connection burst capacity per cluster | 1,000 connections | No | No error code | No error message |
| Connection refill rate | 100 connections/second | No | No error code | No error message |
From the error message, we can see that our test hit the Maximum connection rate per cluster limit of 100 connections/second. The Maximum connections per cluster has a default of 10,000 connections, so our test pattern's upper limit of 7,000 connections should be well within this limit.
What's puzzling is the initial test with 1,000 concurrent Lambda executions. Given the Maximum connection rate per cluster limit of 100 connections/second, we should have seen errors, but we didn't. Was it a client-side issue where the RPS didn't actually reach 100? Or does the Maximum connection burst capacity per cluster mean that bursts up to 1,000 connections/second are possible?
Let's check the logs from when we tested with 1,000 concurrent Lambda executions. We'll run the following query in Transaction Search:
			filter name = "pg.connect"
| stats count(*) as cnt by ceil(startTimeUnixNano/1000000/1000) as startTimeUnix
| display startTimeUnix, fromMillis(startTimeUnix * 1000) as approximateStartTime,  cnt
| sort startTimeUnix
This extracts how many logs exist per second by rounding the start time of pg.connect execution to the second level. For clarity,
The results were as follows:
| startTimeUnix | approximateStartTime | cnt || ------------- | ----------------------- | ---- |
| 1755049821 | 2025-08-13 01:50:21.000 | 190 |
| 1755049822 | 2025-08-13 01:50:22.000 | 810 |
We can see that at UTC 01:50:22, there were 810 connection attempts. Since there were no connection errors, it appears that the maximum connection burst capacity per cluster is indeed the burst capacity for the connection rate.
When executing the same query for the time period when Lambda concurrent executions were increased to 7,000, the results were as follows:
| startTimeUnix | approximateStartTime | cnt |
|---|---|---|
| 1755172519 | 2025-08-14 11:55:19.000 | 134 |
| 1755172520 | 2025-08-14 11:55:20.000 | 826 |
| 1755172521 | 2025-08-14 11:55:21.000 | 261 |
| 1755172522 | 2025-08-14 11:55:22.000 | 110 |
| 1755172523 | 2025-08-14 11:55:23.000 | 97 |
| 1755172524 | 2025-08-14 11:55:24.000 | 186 |
| 1755172525 | 2025-08-14 11:55:25.000 | 274 |
| 1755172526 | 2025-08-14 11:55:26.000 | 230 |
| 1755172527 | 2025-08-14 11:55:27.000 | 221 |
| 1755172528 | 2025-08-14 11:55:28.000 | 430 |
| 1755172529 | 2025-08-14 11:55:29.000 | 188 |
| 1755172530 | 2025-08-14 11:55:30.000 | 329 |
| 1755172531 | 2025-08-14 11:55:31.000 | 187 |
| 1755172532 | 2025-08-14 11:55:32.000 | 276 |
| 1755172533 | 2025-08-14 11:55:33.000 | 213 |
| 1755172534 | 2025-08-14 11:55:34.000 | 195 |
| 1755172535 | 2025-08-14 11:55:35.000 | 95 |
| 1755172536 | 2025-08-14 11:55:36.000 | 184 |
| 1755172537 | 2025-08-14 11:55:37.000 | 556 |
| 1755172538 | 2025-08-14 11:55:38.000 | 224 |
| 1755172539 | 2025-08-14 11:55:39.000 | 1581 |
| 1755172540 | 2025-08-14 11:55:40.000 | 630 |
| 1755172541 | 2025-08-14 11:55:41.000 | 164 |
| 1755172542 | 2025-08-14 11:55:42.000 | 183 |
| 1755172543 | 2025-08-14 11:55:43.000 | 68 |
| 1755172544 | 2025-08-14 11:55:44.000 | 164 |
| 1755172545 | 2025-08-14 11:55:45.000 | 94 |
| 1755172546 | 2025-08-14 11:55:46.000 | 181 |
| 1755172547 | 2025-08-14 11:55:47.000 | 189 |
| 1755172548 | 2025-08-14 11:55:48.000 | 4 |
| 1755172550 | 2025-08-14 11:55:50.000 | 148 |
| 1755172551 | 2025-08-14 11:55:51.000 | 132 |
| 1755172552 | 2025-08-14 11:55:52.000 | 174 |
| 1755172553 | 2025-08-14 11:55:53.000 | 393 |
| 1755172554 | 2025-08-14 11:55:54.000 | 316 |
| 1755172555 | 2025-08-14 11:55:55.000 | 570 |
| 1755172556 | 2025-08-14 11:55:56.000 | 65 |
| 1755172557 | 2025-08-14 11:55:57.000 | 208 |
| 1755172558 | 2025-08-14 11:55:58.000 | 313 |
| 1755172559 | 2025-08-14 11:55:59.000 | 316 |
| 1755172560 | 2025-08-14 11:56:00.000 | 427 |
| 1755172561 | 2025-08-14 11:56:01.000 | 165 |
| 1755172562 | 2025-08-14 11:56:02.000 | 233 |
| 1755172563 | 2025-08-14 11:56:03.000 | 318 |
| 1755172564 | 2025-08-14 11:56:04.000 | 234 |
| 1755172565 | 2025-08-14 11:56:05.000 | 275 |
| 1755172566 | 2025-08-14 11:56:06.000 | 165 |
| 1755172567 | 2025-08-14 11:56:07.000 | 281 |
| 1755172568 | 2025-08-14 11:56:08.000 | 309 |
| 1755172569 | 2025-08-14 11:56:09.000 | 263 |
| 1755172570 | 2025-08-14 11:56:10.000 | 292 |
| 1755172571 | 2025-08-14 11:56:11.000 | 268 |
| 1755172572 | 2025-08-14 11:56:12.000 | 243 |
| 1755172573 | 2025-08-14 11:56:13.000 | 227 |
| 1755172574 | 2025-08-14 11:56:14.000 | 230 |
| 1755172575 | 2025-08-14 11:56:15.000 | 212 |
| 1755172576 | 2025-08-14 11:56:16.000 | 116 |
| 1755172577 | 2025-08-14 11:56:17.000 | 159 |
| 1755172578 | 2025-08-14 11:56:18.000 | 52 |
| 1755172579 | 2025-08-14 11:56:19.000 | 70 |
| 1755172580 | 2025-08-14 11:56:20.000 | 20 |
| 1755172581 | 2025-08-14 11:56:21.000 | 29 |
| 1755172582 | 2025-08-14 11:56:22.000 | 24 |
| 1755172602 | 2025-08-14 11:56:42.000 | 1 |
Combined with the previous error log summary, it looks like this.
| Time Period | Connection Attempts | Connection Errors |
|---|---|---|
| 2025-08-14 11:55:19.000 | 134 | 0 |
| 2025-08-14 11:55:21.000 | 261 | 0 |
| 2025-08-14 11:55:22.000 | 110 | 0 |
| 2025-08-14 11:55:23.000 | 97 | 88 |
| 2025-08-14 11:55:24.000 | 186 | 171 |
| 2025-08-14 11:55:25.000 | 274 | 171 |
| 2025-08-14 11:55:26.000 | 230 | 47 |
| 2025-08-14 11:55:27.000 | 221 | 377 |
| 2025-08-14 11:55:28.000 | 430 | 72 |
| 2025-08-14 11:55:29.000 | 188 | 222 |
| 2025-08-14 11:55:30.000 | 329 | 123 |
| 2025-08-14 11:55:31.000 | 187 | 105 |
| 2025-08-14 11:55:32.000 | 276 | 187 |
| 2025-08-14 11:55:33.000 | 213 | 51 |
| 2025-08-14 11:55:34.000 | 195 | 74 |
| 2025-08-14 11:55:35.000 | 95 | 18 |
| 2025-08-14 11:55:36.000 | 184 | 400 |
| 2025-08-14 11:55:37.000 | 556 | 120 |
| 2025-08-14 11:55:38.000 | 224 | 1571 |
| 2025-08-14 11:55:39.000 | 1581 | 490 |
| 2025-08-14 11:55:40.000 | 630 | 133 |
| 2025-08-14 11:55:41.000 | 164 | 6 |
| 2025-08-14 11:55:42.000 | 183 | 27 |
| 2025-08-14 11:55:43.000 | 68 | 86 |
| 2025-08-14 11:55:44.000 | 164 | 0 |
| 2025-08-14 11:55:45.000 | 94 | 26 |
| 2025-08-14 11:55:46.000 | 181 | 76 |
| 2025-08-14 11:55:47.000 | 189 | 1 |
| 2025-08-14 11:55:48.000 | 4 | 5 |
| 2025-08-14 11:55:49.000 | 198 | 75 |
| 2025-08-14 11:55:50.000 | 148 | 1 |
| 2025-08-14 11:55:51.000 | 132 | 83 |
| 2025-08-14 11:55:52.000 | 174 | 282 |
| 2025-08-14 11:55:54.000 | 316 | 447 |
| 2025-08-14 11:55:55.000 | 570 | 21 |
| 2025-08-14 11:55:56.000 | 65 | 60 |
| 2025-08-14 11:55:57.000 | 208 | 236 |
| 2025-08-14 11:55:58.000 | 313 | 163 |
| 2025-08-14 11:55:59.000 | 316 | 357 |
| 2025-08-14 11:56:00.000 | 427 | 69 |
| 2025-08-14 11:56:01.000 | 165 | 130 |
| 2025-08-14 11:56:02.000 | 233 | 259 |
| 2025-08-14 11:56:03.000 | 318 | 85 |
| 2025-08-14 11:56:04.000 | 234 | 166 |
| 2025-08-14 11:56:05.000 | 275 | 85 |
| 2025-08-14 11:56:06.000 | 165 | 166 |
| 2025-08-14 11:56:07.000 | 281 | 265 |
| 2025-08-14 11:56:08.000 | 309 | 99 |
| 2025-08-14 11:56:09.000 | 263 | 254 |
| 2025-08-14 11:56:10.000 | 292 | 132 |
| 2025-08-14 11:56:11.000 | 268 | 146 |
| 2025-08-14 11:56:12.000 | 243 | 86 |
| 2025-08-14 11:56:13.000 | 227 | 199 |
| 2025-08-14 11:56:14.000 | 230 | 75 |
| 2025-08-14 11:56:15.000 | 212 | 26 |
| 2025-08-14 11:56:16.000 | 116 | 6 |
| 2025-08-14 11:56:17.000 | 159 | 45 |
| 2025-08-14 11:56:18.000 | 52 | 19 |
| 2025-08-14 11:56:19.000 | 70 | 1 |
| 2025-08-14 11:56:20.000 | 20 | 0 |
| 2025-08-14 11:56:21.000 | 29 | 0 |
| 2025-08-14 11:56:22.000 | 24 | 0 |
| 2025-08-14 11:56:42.000 | 1 | 0 |
Summary
I tested the availability of DSQL. In this test, the SQL executed was only pg_sleep, so the processing was completed at the DSQL router → query processor stage, with no access occurring from the query processor → storage. In actual workloads, storage would also be used, so these test results should be considered as reference information. Nevertheless, I was able to confirm that both the router and query processor are resilient to spike access. With this level of resilience to simultaneous connections, it seems unlikely that problems would occur when combined with Lambda.
While there appear to be various points to consider besides simultaneous connections, I would like to test these aspects gradually as well.
