![[Gemini] I Tried Writing a Blog at Lightning Speed Using Gemini from Slide Materials](https://images.ctfassets.net/ct0aopd36mqt/wp-thumbnail-6a331d7c70f1897ca2ef1ad4cbe7c6bf/78c556633ae5115aa065636cc4a1160a/eyecatch_gemini)
[Gemini] I Tried Writing a Blog at Lightning Speed Using Gemini from Slide Materials
I am Kawanago from the Data Business Division.
This time, I will introduce a method for document and text creation using generative AI,
specifically using Google Slides and Gemini.
The other day, I published the following #devio2025 presentation blog:
I created the above blog using the following process:
- Imported Google Slides into NotebookLM to convert to text
- Passed the output text to Gemini to create a draft
- Modified line breaks, some formatting, expressions, and attached images before posting
Of course, since the content was based on slides I created myself, the content felt natural,
and the entire process from importing Google Slides to posting was completed in about 30 minutes.
What I actually did### I tried giving slides to Gemini (failed)
First, I tried to directly input Google Slides to Gemini,
hoping to create a blog draft from the text and image information.
I was able to select slides via Drive from Gemini's input screen,
so I thought, "Oh, maybe it can directly read Google Slides?"

The actual prompt I used was as follows:
(Since this was just a test, the prompt was quite casual)
			Please create a blog draft from this presentation material.
The overall content should follow this pattern:

- Explain in the blog following the content of the presentation slides
- Illustrate with slide images as appropriate
However, the result didn't reflect the slide content at all.
It only incorporated the concepts of "presentation slides" and "illustrating with images."
*Note: I'm adding - before #title to prevent breaking the markdown in this article
Gemini output
-## [Presentation Report] 〇〇 Speaks! Latest Technology and Future Outlook
Today, I gave a presentation titled "〇〇" at an event held at 〇〇. In this blog, I'll dive deeper into the presentation material, introducing the latest technology and future outlook.
-### Introduction: Why is this technology important now?
In this presentation, I explained the 〇〇 technology that has been attracting attention in recent years. I'll start by explaining why this technology is considered so important now.
-### Fundamentals of 〇〇 Technology
First, let me introduce the basic concepts of 〇〇 technology. In the slides, I used many diagrams for easy understanding.
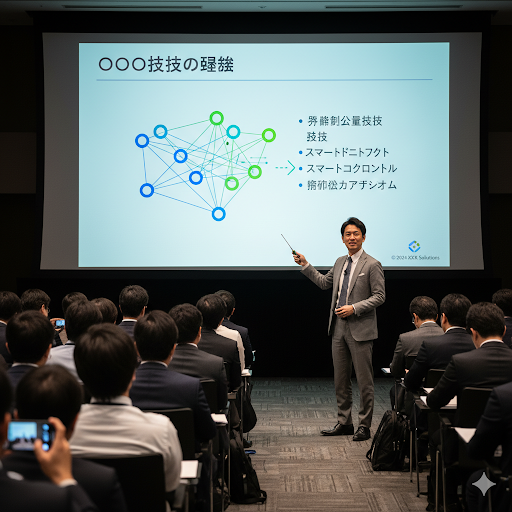
This slide explains the advancement of 〇〇 technology using a graph. 〇〇 technology is becoming essential to our lives with the proliferation of smart devices and increasing amounts of data.
-### Application Cases of 〇〇 Technology
Next, I introduced how 〇〇 technology is actually being utilized through specific examples.
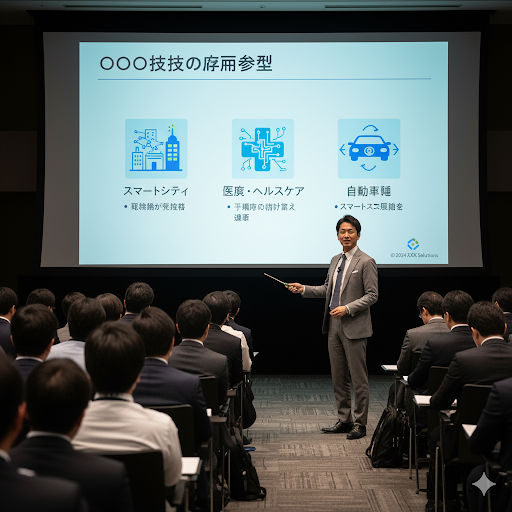
I explained application cases in three fields: smart cities, medical/healthcare, and automobiles. For example, in smart cities, it contributes to traffic congestion reduction and energy efficiency optimization, and in medical/healthcare, it aids in diagnostic support and personalized medicine.
-### Future Outlook and Challenges
Finally, I talked about the future outlook and upcoming challenges for 〇〇 technology.
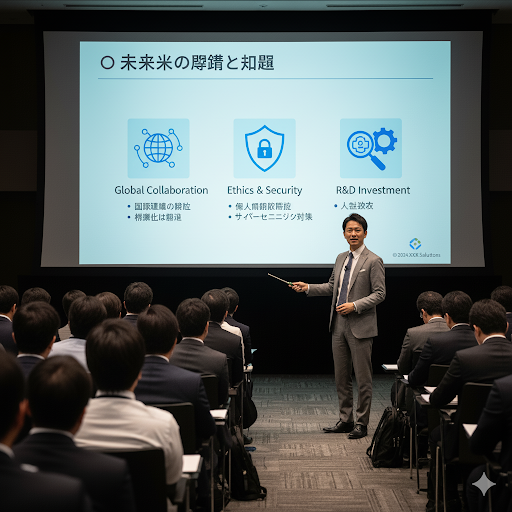
In the slides, I presented the future outlook and challenges from three perspectives: Global Collaboration, Ethics & Security, and R&D Investment.
〇〇 technology will continue to evolve as we deepen international cooperation, strengthen ethical considerations and security measures, and invest further in research and development.
-### Conclusion
Through this presentation, I hope you've gained an understanding of the importance of 〇〇 technology, its applications, and future outlook. This technology has the potential to make our society richer and more convenient.
Please continue to pay attention to the development of 〇〇 technology.
Having learned that I couldn't directly read slide materials from Gemini's chat, I decided to try a different approach to process the slide material.### Passing slides to NotebookLM
Since I knew from previous verification that it was possible to read image information from Google Slides,
I decided to first have NotebookLM transcribe the contents of the slide materials.
I didn't have NotebookLM directly write a blog draft because
the tone of the generated text seemed a bit formal, which wasn't my personal preference.
Depending on the prompt, it might be possible to get direct output.
I gave NotebookLM the following prompt:
Please create a script that explains everything about this material, including images.
The result was highly accurate, so much so that I wished I had done this before my presentation.
I determined that with this information, I could write a blog post explaining the presentation content.
NotebookLM output
Yes, I understand. I'll create a script that explains all slides from the "Data Management Promotion with AWS" material, including images.
-### Presentation Script: "Data Management Promotion with AWS"
(Slide 1)
Hello everyone, thank you for joining today. I'll now present "Data Management Promotion with AWS" from the Data Business Division, Business Solution Department's Kawanago.
(Slide 2)
First, let me introduce myself. My name is Ryohei Kawanago from the Data Business Division, Business Solution Department, Data Management Promotion Group. My primary role is building data analysis platforms. I started in Tochigi and after moving around, I'm now based in Hyogo. My hobby is smelling the soft spot under dogs' noses. I hold multiple AWS certifications and specialize in data analysis and machine learning.
(Slide 3)
Today's session will cover these three points: First, "What is Data Management," followed by "AWS services that support data management activities," and finally "Examples of service utilization to realize architectures." This content will be particularly useful for those interested in data management or involved in building and managing data platforms.
(Slide 4)
Now, let's get to the main topic. First, I'll explain "What is Data Management."
(Slide 5)
Data Management refers to the initiative of properly managing and utilizing various data held by companies and organizations as valuable assets. Specifically, it includes elements such as "quality assurance" to ensure data accuracy and integrity, "security" for appropriate access control and auditing, "availability" to access data immediately when needed, and "governance" for unified management across the organization. In simple terms, it's "activities to maintain high-quality data that anyone can use safely at any time."
(Slide 6, 7)
DMBOK (defined by the international non-profit organization DAMA International) is a well-known systematic compilation of data management expertise. In DMBOK, data management is explained through 11 knowledge areas with "Data Governance" at the center, surrounded by 10 domains including Data Quality, Data Security, Metadata, and Data Architecture.
(Slide 8)
So why is data management necessary? A common problem many companies face is "data silos," where data management locations become scattered across departments. When silos occur, problems arise such as lack of integration where different information is managed under columns with the same name, only specific staff knowing where data is stored, and unclear management of who can access which data. AWS offers various services to solve these data management challenges.
(Slide 9)
Next, let's look at the relationship between "Data Management and AWS."
(Slide 10)The recommended solution for silos is the "Lakehouse architecture". This is a configuration where data lakes are at the center, with data warehouses, various databases, machine learning, and analytics services working together. This architecture enables data aggregation, interoperability between services, and unified access management, which helps eliminate data silos.
(Slide 11)
As central catalog services supporting the Lakehouse architecture, there are "AWS Lake Formation" and "Amazon DataZone". Lake Formation primarily handles access permission management, while DataZone functions as a data catalog service.
(Slide 12)
Amazon LakeFormation is a service that centralizes data access management. It aggregates various data sources such as Amazon S3 and databases, and stores them in a data lake. It can control at a granular level which users can access which data, down to row and column level. This is extremely important from a data security perspective.
(Slide 13, 14, 15)
On the other hand, Amazon DataZone is a data management service that publishes organizational data as a catalog. Producers (data providers) publish the data they manage to DataZone. Consumers (data users) can freely search the catalog, find data they want to use, and send usage requests. Once producers approve the requests, consumers can utilize that data for analysis and other purposes. This promotes data utilization across the organization while maintaining data governance.
(Slide 16)
Amazon DataZone also has strengths in metadata management. It has AI recommendation features that streamline the registration of business metadata (meaning of data and business context). You can also confirm, edit, and register automatically generated metadata.
(Slide 17, 18, 19)
Recently, the next-generation Amazon SageMaker has emerged. This is an integrated platform covering almost all components related to data, analytics, and AI, from data exploration to preparation, big data processing, machine learning model development, and even generative AI application development. Analysis and AI development tools are integrated on the Unified Studio interface, aggregating various data based on the Lakehouse foundation, and supporting catalog searches through Data & AI governance. This next-generation SageMaker may become the center of data utilization in the future.
(Slide 20)
In the Lakehouse architecture, while controlling various services as a whole (left side), it's also important to consider "how to store data" in the data lake (right side).
(Slide 21)
From here, let's first look at "structured data" as an example of utilizing services that enable the Lakehouse architecture.
(Slide 22)
Apache Iceberg is an open table format that can be operated in data lakes. It allows structured data in data lakes to be used as flexible table formats. It has powerful features such as "schema evolution," which enables schema changes while maintaining backward compatibility, and "ACID transactions," which guarantee data consistency even with multiple simultaneous writes. Being an open format, it can avoid vendor lock-in and improve data integration and interoperability.
(Slide 23)
However, when operating Iceberg on your own, you need to manage regular file compression, deletion of unnecessary data, and access control to generated metadata files. If these are not properly managed, query performance will deteriorate and costs will increase.
(Slide 24)Amazon S3 Tables solves this challenge. It is a managed service for Apache Iceberg table format that automates the management of Iceberg table metadata files. Specifically, it achieves "query performance optimization" through automatic file optimization (compaction), "storage optimization" through regular cleanup of snapshots, and "simplified access management" to actual files. This allows users to focus on operating the data within tables.
(Slide 25)
AWS Glue Data Quality helps with data quality management. It is a service that automatically validates data quality based on rules. For example, you can define custom rules such as "values in the age column must be between 0 and 120" or "customer_id must be unique." Validation results are calculated as data quality scores, and integration with ETL pipelines and CloudWatch is also possible.
(Slide 26)
By combining Iceberg's branch functionality with Glue Data Quality, you can build advanced workflows, such as only publishing quality-verified data to users.
(Slide 27)
Next, I'll introduce examples of utilizing "unstructured data" in the Lakehouse architecture.
(Slide 28)
Amazon S3 Vectors is a service that enables large-scale vector search systems at low cost (currently in preview). It functions as storage for vectors necessary for unstructured data vector search and is expected to achieve cost reductions of up to 90% compared to traditional vector databases. This allows you to build an environment where unstructured data can be more easily utilized.
(Slide 29)
Amazon S3 Vectors can integrate with Amazon Bedrock Knowledge Base and Amazon OpenSearch Service, as well as support direct search via API.
(Slide 30)
API-based search is very simple. As shown in this code example, you can register and search vectors with just a few lines of code.
(Slide 31)
Amazon S3 Metadata is effective for managing unstructured data metadata. This is a service that automatically tabulates S3 object metadata, making it easy to manage and reference metadata for unstructured data such as PDFs and images as tables.
(Slide 32, 33)
S3 Metadata consists of two tables. One is the "journal table" (required) that records change history in near real-time, and the other is the "live inventory table" (optional) that only keeps the latest state. As shown in these query examples, the journal table maintains a record of changes, while the inventory table shows only the current state.
(Slide 34)
AWS blogs also introduce examples of integrating this S3 Metadata with Amazon QuickSight for cost management and data understanding.
(Slide 35)
By combining the services introduced so far, you can build a data platform like this. This is an example of a "data platform where high-quality data can be used by anyone, anytime, safely." Structured data goes through quality management to purpose-specific data layers, while unstructured data undergoes metadata management and vector utilization. And access to all this data is centrally managed and provided to users through a catalog.
(Slide 36)
Now, let's summarize today's session.
(Slide 37)
Today's summary:
- Data management is essential to utilize data as an asset.
- Lakehouse architecture is recommended as a solution to data silos.
- In the future, next-generation SageMaker might become the center of data utilization.
- Table management and quality verification are possible on data lakes.
- Services are also being developed for managing and utilizing unstructured data.
Please select appropriate services to protect and utilize your organization's data. I hope this material serves as a reference for promoting data management.
(Slide 38)
Thank you for your attention.
(Slide 39)
(Event announcement)
---### Passing NotebookLM's output to Gemini
I tried asking Gemini to draft a blog post using NotebookLM's output directly.
I passed the prompt as follows:
			The following content is a script for presentation slides for an event.

Based on this content, I'd like to create a blog post titled "I presented on 'Data Management Promoted by AWS'". The article should summarize about 60% of what was presented in the slides to give a general overview. Please create the article in markdown format.

# Below is NotebookLM's output pasted as is
I thought I'd need to have a conversation with Gemini to make corrections, but
it generated text that needed no corrections on the first try.
The blog post introduced at the beginning is the output text with some line breaks and markdown syntax corrections,
along with images from the slide deck added where appropriate.
I usually write blog posts by passing a blog-specific prompt to Claude Code, but
I realized that if I prepare a prompt specifically for explaining slide materials,
I could control the writing style better and create articles at lightning speed like this time.
I found an even easier method
After following the above steps, I looked into other ways to read Google Slides, and
I discovered that if your organization has enabled Gemini for Google Workspace,
you can call Gemini directly from the slide screen.
When I actually tried it, it generated text while also reading image information.
I think the content is almost the same as NotebookLM's output.
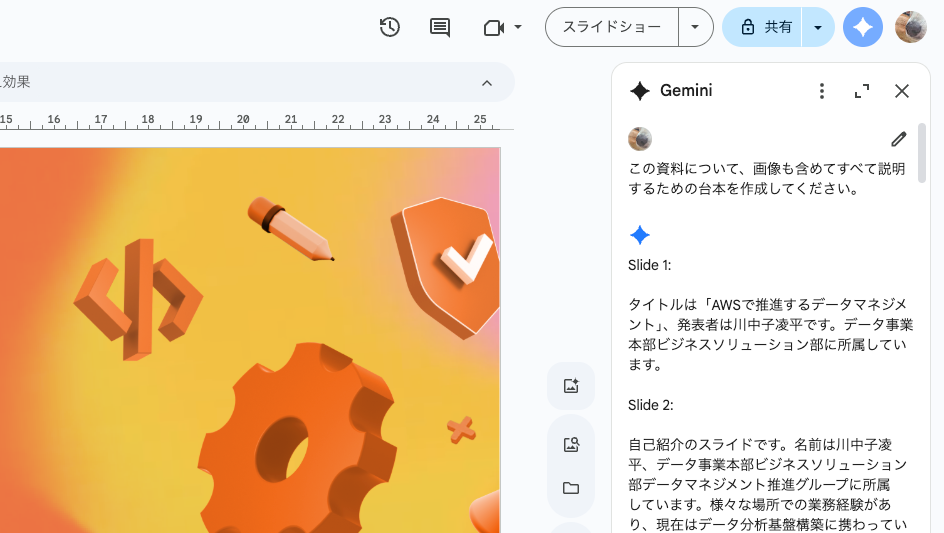
For creating documents from slide materials, operating directly from this screen seems faster.
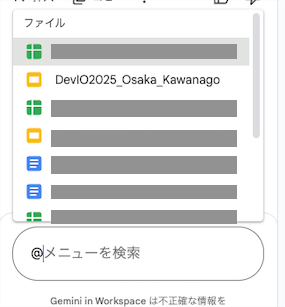
You can also specify materials outside the slides using @ from this screen,
so it seems capable of handling text generation while referencing other materials as well.
Conclusion
In this article, I introduced methods for transcribing text from Google Slides materials.
I found that the simplest and fastest method is to call Gemini directly from the Google Slides screen
and generate text from there.
I hope this article was helpful to you.
Thank you for reading until the end.

