I tried running Meta's open-weight Muse Glimmer 30B on DGX Spark

This page has been translated by machine translation. View original
Introduction
Hello, I'm Morishige from Classmethod's Manufacturing Business Technology Department.
Meta has released the weights for Muse Glimmer 30B. It's a 30B model explicitly designed to be "a local agent that runs all the time," licensed under Apache-2.0.
This is Meta's first open-weight release since Llama 4 in April 2025 — a gap of about 1 year and 4 months. The distributing organization has also changed from meta-llama to meta-models, dropping "Llama" from the name. During this period, the center of gravity for open weights had shifted toward Qwen, DeepSeek, and Gemma, so this return was a surprising piece of news.
The reason I tried it on the day it was released is that the official recipe lists DGX Spark as verified hardware and even designates it as the default configuration. Yet neither the vLLM nor the SGLang benchmark lists include a row for DGX Spark. It says it works, but there are no numbers. Since I have one unit on hand, I decided to fill in that gap.
To state the conclusion upfront: Japanese, code fixes, and tool calls all worked. When I ran the comparison models Qwen3.6-27B and Gemma4-31B through the same tests, there was no difference in correctness. The differences showed up in the tokens and time spent reaching the same answer, and in the conventions for making calls.
In particular, how many tool calls are packed into a single message varies by situation. Sometimes it returns 4 at once; other times it splits 2 calls into separate messages. This is a difference I wanted to verify before mounting it on an existing agent framework.
In this article, I present the results of running Muse Glimmer 30B on a single DGX Spark and measuring speed, Japanese language capability, and agent use cases under the same conditions as Qwen3.6-27B and Gemma4-31B. I hope it's useful for anyone looking for a locally-running model suited for agents.
A Dense 30B — And It's Actually a VLM
When I heard "dense 30B model," the first thing I imagined was a text-only language model, but opening the model card revealed something slightly different. Of the 29.6B parameters, approximately 1.8B belong to a ViT-G/14 image encoder, with the remainder being the text decoder. In other words, it's multimodal out of the box.
The text side has 52 layers, hidden size 6656, GQA at a 32-to-2 ratio, and FFN uses SwiGLU with intermediate dimension 19,968. Attention alternates between 3 Local layers followed by 1 Global layer, with the Local window set at 2048 tokens. The vocabulary size is 202,048, of which 2,048 are allocated as special tokens. The training context length was 131,072.
The license is Apache-2.0, the knowledge cutoff is January 4, 2026, and the training data covers more than 100 languages. There was also a note that it was created by distillation from the larger Muse Spark model. The BF16 weights are 59.55 GB, so on a DGX Spark with 128 GB of unified memory, they fit without quantization.
Extracting the rows from Meta's published comparison table relevant to the three axes I'm measuring here gives the following. The comparison targets are Gemma4-31B and Qwen3.6-27B.
| Benchmark | Muse Glimmer 30B | Gemma4-31B | Qwen3.6-27B |
|---|---|---|---|
| MCP Atlas | 75.5 | 54.2 | 62.5 |
| DeepSearch QA | 74.6 | 61.7 | 71.1 |
| τ3-Banking | 23.5 | 15.1 | 16.7 |
| SWE-Bench Pro | 51.2 | 36.9 | 50.2 |
| SWE-Bench Verified | 76.0 | 66.6 | 77.2 |
| TerminalBench 2.1 | 51.7 | 43.4 | 60.7 |
| AIME 2026 | 94.7 | 89.2 | 94.1 |
| IFBench | 77.0 | 76.0 | 70.8 |
On tasks that involve repeatedly calling tools to make progress, Muse Glimmer clearly pulls ahead, while on standalone coding and terminal operations it loses to Qwen3.6-27B. Since this model bills itself as "agent-oriented," both where it wins and where it loses are consistent with that label. What I'm curious about is whether these differences appear in the same direction in my local environment — that's the main subject of this article.
Tools Are Not Called with JSON
Assuming it would naturally use JSON like any new model, I sent a request and got back XML. Each turn is written as a chain of messages with destinations, and tool calls within them are expressed in XML.
to=self<|message|>...thinking...<|eom|>
<|start|>assistant to=<tool><|message|><atem:function_calls>
<atem:invoke name="<tool>">
<atem:parameter name="<arg>">value</atem:parameter>
</atem:invoke>
</atem:function_calls><|eom|>
<|start|>assistant to=user<|message|>...final answer...<|eot|>
to=self is thinking, to=<tool> is a tool call, and to=user is the answer shown to the reader. Channels are separated by switching the destination.
Incidentally, the chat template for the comparison model Qwen3.6-27B also uses XML, nesting <function=name> and <parameter=key> inside <tool_call>. I feel like I've been tripping over the implicit assumption that tool calls use JSON lately... What's novel about Muse Glimmer isn't the XML itself but the way it separates thinking, tools, and the user-facing answer using destinations.
Running on a Single DGX Spark
The official recipe lists DGX Spark as verified hardware and even designates it as the default configuration. Since it uses a single GPU, there's no tensor parallel setting.
vllm serve Inferact/Muse-Glimmer-30B-NVFP4-W4A4 \
  --served-model-name muse-glimmer \
  --enable-auto-tool-choice --tool-call-parser muse_glimmer \
  --reasoning-parser muse_glimmer \
  --generation-config auto
--generation-config auto is not decorative — it's needed to pick up stop tokens from generation_config.json. If you add <|eom|> as a stop token here, the turn will end at the close of the thinking channel and tool calls won't complete. There are three weight options.
| Type | Source | Size |
|---|---|---|
| BF16 | meta-models/Muse-Glimmer-30B |
59.55 GB |
| NVFP4 | Inferact/Muse-Glimmer-30B-NVFP4-W4A4 |
25.42 GB |
| GGUF | unsloth/Muse-Glimmer-30B-GGUF UD-Q4_K_XL |
15.88 GB |
NVFP4 is 4-bit yet still takes 25 GB. That's because not everything is quantized — only the 364 projections on the text side are quantized. The embeddings, lm_head, and the image encoder remain as-is. That's why it doesn't come out to the roughly 15 GB you'd expect from a uniform 4-bit quantization.
I launched with NVFP4. Of the 121.69 GiB unified memory, 25.3 GiB went to weights and 76.6 GiB was allocated to the KV cache, forming a pool of 4,819,435 tokens. That means up to 73.54 simultaneous sessions at 64K context. The official recipe states 26.8M tokens on a 4-card GB300 setup, so this is about 1/5.6 of that. One thing that stood out was startup time.
| Time from start to first response | |
|---|---|
| vLLM (NVFP4) | 371 sec |
| llama.cpp (GGUF) | 15 sec |
On the vLLM side, after loading the weights, torch.compile, FP4 GEMM autotuning, and CUDA graph capture run in sequence. Looking at the logs, engine initialization alone took 145 seconds, of which compilation was 28.77 seconds and graph capture was 33 seconds. If you're running it as a persistent service this doesn't matter, but the feel when "just testing something quick" is quite different.
How Fast Is It?
I fixed output length at 256 tokens and varied concurrent requests from 1 to 8. The two comparison models were re-measured with the same image, same settings, and same prompts.
| Model | Single tok/s | TTFT | 8-parallel total | 8-parallel per request |
|---|---|---|---|---|
| Muse Glimmer 30B | 11.67 | 0.406 sec | 88.61 | 11.31 |
| Qwen3.6-27B | 12.41 | 0.145 sec | 84.75 | 10.96 |
| Gemma4-31B-IT | 6.84 | 0.213 sec | 53.56 | 6.75 |
Single-request Qwen is slightly faster, but at 8 parallel Muse Glimmer pulls ahead. The per-request degradation is also smaller for Muse Glimmer, dropping only 3% from 11.67 to 11.31. Gemma4-31B is clearly the slowest of the three, coming in at about 60% of Muse Glimmer's single-request speed. The difference was even more pronounced on the KV cache side.
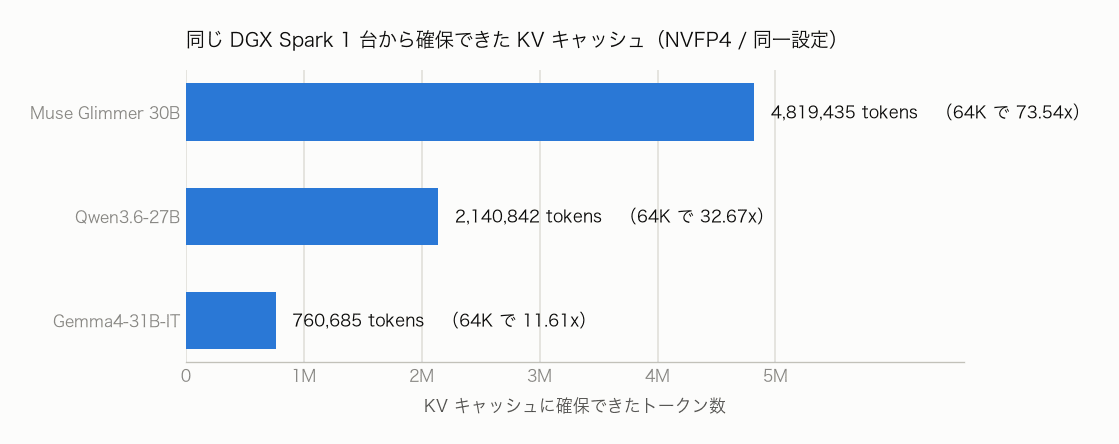
From the same unified memory, it secures 6.3× more tokens than Gemma and 2.2× more than Qwen. That's likely due to the architecture where 3 out of 4 layers use sliding window attention, and KV heads are trimmed down to a 32-to-2 ratio. This is where the difference shows up most when running many long contexts in parallel rather than in raw throughput speed.
Speculative Decoding Roughly Doubles the Speed
Muse Glimmer distributes a draft model called DFlash for speculative decoding in a separate repository. Adding it roughly doubled single-request decode speed.
| Single tok/s | TTFT | 8-parallel total | |
|---|---|---|---|
| vLLM (no speculation) | 11.67 | 0.406 sec | 88.61 |
| vLLM + DFlash | 21.57 | 0.256 sec | 159.43 |
| SGLang (no speculation) | 11.16 | 0.454 sec | 86.51 |
| SGLang + DFlash | 23.74 | 0.323 sec | 155.69 |
For single requests, SGLang is fastest at 2.13×, while vLLM achieves 1.85×. At 8 parallel, vLLM takes the lead. The number of tokens passing per speculation step was around 2–3 for both. Either way gets you roughly 2× improvement, so the choice comes down to how you parallelize.
There's a cost too. Startup time grows from 371 to 411 seconds, and the KV cache pool shrinks about 25% from 4,819,435 to 3,579,383 tokens, since the draft model draws from the same unified memory. The output itself was unchanged — all 4 Japanese questions and all 5 tool call questions returned the same results with speculation enabled. And the time for the 4 Japanese questions shrank from 202.9 seconds to 77.9 seconds. It helped not just on synthetic benchmarks with fixed lengths, but on real tasks too.
How Each Engine Performs
Here's a summary of what I verified across the three engines. (As of August 11, 2026)
| vLLM | llama.cpp | SGLang | |
|---|---|---|---|
| Startup | ✅ | ✅ | ✅ |
| Tool calls (5 questions) | ✅ 5/5 | ✅ 5/5 | ✅ 5/5 |
| Thinking/answer separation | ✅ | ✅ | ✅ |
| Streaming survival | ✅ | ✅ | ✅ |
tool_choice: "required" |
❌ Ignored | ✅ | ✅ |
| Speculative decoding | ✅ 1.85× (needs patch) | 🟡 No effect | ✅ 2.13× |
| Image input | Untested | ✅ 3/3 correct | ❌ Weights missing |
The top 4 rows passed consistently across all engines. The bottom 3 rows diverged. If you want speed, go with SGLang or vLLM; if you also need image input, llama.cpp is the choice. The SGLang NVFP4 checkpoint doesn't include the image-side weights, so using images there would require loading the full BF16 59.55 GB.
Note that on launch day, neither vLLM nor SGLang had their model-support PRs merged yet, so I was running distribution images. Only llama.cpp was merged into mainline on the same day. This lineup will likely change within a few days, so it's worth checking each repository's status before trying.
Images Worked Too
Since it's a VLM out of the box, I tested images as well. With llama.cpp, you just pass the image encoder (mmproj) bundled with the GGUF via --mmproj, and startup stays at 5 seconds.
The task was to identify personal protective equipment from a construction site photo — an image where correct answers had been verified with a different model. The correct answers were: white helmet (woman), yellow helmet (man), and high-visibility vest (woman).
Woman on the left:
* Helmet … white safety helmet
* High-visibility safety vest … fluorescent yellow-green safety vest / high-visibility vest
Man on the right:
* Helmet … yellow safety helmet
* Protective clothing … dark navy work coveralls / overalls

Gloves, safety shoes, protective eyewear, etc. are not visible in the image.
All three items were correctly identified. What impressed me most was the final line — it stated that items not visible were not visible. The two people in the photo are bare-handed, one holding a tablet and the other a radio. When asked to "list all safety protective equipment," there's a temptation to fill in plausible items, but it didn't do that. For applications handling site photos, the ability to not fabricate things that aren't visible matters more than the ability to list things that are.
The time per question was 53 seconds (630 tokens, 1,519 characters of thinking). Even with images, it thinks carefully before answering.
How Is the Japanese?
The official material only says it was trained on more than 100 languages, with no specific numbers for Japanese. So I ran 4 questions of my own: a length-constrained answer (within 50 characters), a free-response question, code generation, and simple numerical reasoning. Correctness for the length, code, and calculation questions was judged automatically.
To cut to the conclusion: all 4 were correct. The 50-character constraint was met in 21 characters, dedup_sort returned sorted(set(nums)), and both the total of 360 yen and 1 mikan at 40 yen were correctly identified. The Japanese itself was also natural.
What caught my attention wasn't correctness but time. I tried all 4 levels of reasoning strength.
| effort | 4-question correctness | Output tokens | Thinking characters | Time |
|---|---|---|---|---|
| low | All correct | 1,409 | 3,126 | 123.9 sec |
| medium | All correct | 2,386 | 6,142 | 210.1 sec |
| high | All correct | 2,306 | 5,939 | 202.9 sec |
| xhigh | All correct | 2,790 | 7,137 | 245.8 sec |
All levels were perfectly correct; only the time and tokens changed. xhigh used exactly twice as many tokens as low to reach the same answer. The extreme case was the 50-character constraint question: at high, it used 1,028 tokens and took 90.55 seconds to produce a 21-character answer. At low, it was 411 tokens and 36.1 seconds.
The difference between medium and high is within the noise of single runs. The readable signal is "low vs. everything else." For just 4 non-difficult questions, it at least suggests that low is sufficient for routine Japanese processing.
Results didn't change with different quantization. Neither NVFP4 W4A4 (25.4 GB) with activations also quantized to 4-bit, nor the K-quant compressed to 15.9 GB caused any degradation on these 4 questions. Output tokens were nearly identical at 2,306 and 2,311, and for the code generation question, both returned exactly the same implementation.
Now, how did the two comparison models do? Here are the results of running the same 4 questions with the same sampling settings and the same limits.
| Model | Condition | 4-question correctness | Output tokens | Thinking characters | Time |
|---|---|---|---|---|---|
| Gemma4-31B-IT | No thinking channel | All correct | 284 | 0 | 41.9 sec |
| Qwen3.6-27B | thinking off | All correct | 509 | 0 | 42.9 sec |
| Muse Glimmer 30B | effort low | All correct | 1,409 | 3,126 | 123.9 sec |
| Muse Glimmer 30B | effort high | All correct | 2,306 | 5,939 | 202.9 sec |
| Qwen3.6-27B | thinking on | All correct | 4,034 | 8,670 | 330.2 sec |
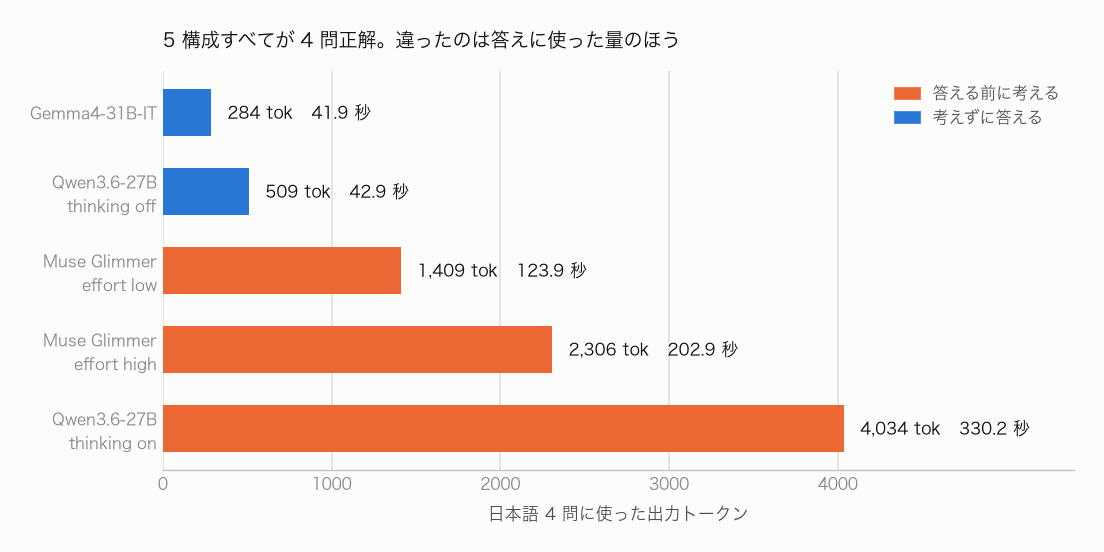
All 5 configurations were perfectly correct. Since correctness doesn't differentiate them, what remains is a comparison of consumption — and there the gap was 14×. What's interesting is how the rankings shift. Gemma4-31B has the slowest single-request decode speed at 6.84 tok/s among the three, yet because its output fit in 284 tokens, it was the fastest in wall-clock time for the 4 Japanese questions. Judging speed by tokens per second alone will mislead you about actual elapsed time. The source of this gap is whether the model thinks before answering.
Muse Glimmer always thinks internally before writing its answer. Even for "Describe Japan's capital in 50 characters or fewer," it thinks for 2,806 characters first, then writes a 21-character answer. And this thinking cannot be turned off. The Reasoning strength setting has 4 levels — low / medium / high / xhigh — with no "off" value. The chat template simply embeds the passed string directly, so I tried passing none and off, getting 1,243 and 1,999 characters of thinking respectively. Rather than stopping, off actually produced longer thinking than none. Even at the lightest documented setting of low, it still thinks for at least 1,244 characters.
Qwen and Gemma are different. Setting Qwen's enable_thinking to false skips the thinking step entirely, answering the same question in 18 tokens. Gemma has no mechanism for specifying thinking strength, and for all 4 questions in this test it answered without any thinking step.
One reaches the same answer by thinking then writing, while the other writes immediately. If the answer doesn't change, the thinking time is pure waiting time. It's the difference between using 1,028 tokens and 90 seconds for a 50-character answer versus returning immediately in 18 tokens. For workloads that handle many short responses, this difference translates directly into processing time and cost. I think the design of "think before acting" — which is this model's selling point as an agent-oriented model — becomes expensive for tasks that don't require thinking. The Japanese correctness itself is perfectly fine; what gives me pause is the time it takes to get there.
Coding and Agent Capabilities
Since this model bills itself as agent-oriented, I want to see how it performs when given tools to work with.
All 5 Tool Call Questions Pass
Starting with single calls. The 5 questions cover: a minimal weather query, selecting the correct tool from two options, arguments mixing nested objects, enums, and integers, using Japanese in arguments, and a case where "not using a tool is the correct answer."
All 5 passed. Nested arguments are assembled correctly as {"assignee": {"name": "Sato", "team": "infra"}, "estimated_hours": 8}, Japanese flows naturally as {"keyword": "ほうじ茶ラテ"}, and no unnecessary tool calls were made in response to a greeting. Since the XML on the model side is received as ordinary tool_calls on the client side, existing code works as-is up to this point. Even during streaming, both tool_calls and thinking arrive as deltas.
Returns 2 Calls Separately, But 4 Calls Together?
Here's where it gets interesting. When I asked about the weather in Tokyo and Osaka at the same time, this is what happened:
| Turn | # of calls | City |
|---|---|---|
| 1 | 1 | Tokyo |
| 2 | 1 | Osaka |
The first response contained only one call — for Tokyo. After returning that result and running again, Osaka comes back. When I sent the same question to the two comparison models, both Qwen3.6-27B and Gemma4-31B returned 2 calls in a single response, so this appears to be a quirk of Muse Glimmer.
However, a different task showed a different behavior. This was a task asking it to investigate a small broken repository through a pseudo-filesystem.
| Turn | # of calls | Content |
|---|---|---|
| 1 | 1 | list_dir |
| 2 | 4 | read_file for 4 files at once |
| 3 | 1 | read_file |
All four of app/__init__.py, app/cart.py, app/discount.py, and tests/test_cart.py came back in a single message. The same pattern appeared in vLLM, llama.cpp, and SGLang. So it's not that it can't batch calls — it batches or splits them depending on the situation.
What makes this tricky is that either assumption can be wrong. An implementation that expects "only 1 call at a time" will drop 3 of the 4 when they arrive together. An implementation that expects "they always come together" will do unnecessary round trips on situations like the 2-city weather query. The safest approach is to treat the number of calls per response as variable, and verify with your own workloads before migrating.
Don't Rely on tool_choice: "required"
The recipe says "don't use required or name-specific tool choice with this model." When I actually sent it, there was no error — it silently returned 0 calls.
| Model and engine | Tool calls returned | Time |
|---|---|---|
| Muse Glimmer / vLLM | 0 | 40.43 sec |
| Gemma4-31B-IT / vLLM | 0 | — |
| Qwen3.6-27B / vLLM | 1 | 27.43 sec |
| Muse Glimmer / llama.cpp | 1 | 18.81 sec |
All return HTTP 200 with no exceptions. It spends 40 seconds and returns nothing, so client code written assuming "a call will always be made" breaks silently. Looking at the comparison models too, only Qwen honored it. The llama.cpp side works because when tools are provided, the ATEM format itself becomes a syntactic constraint, making required effective.
Same weights, same request — yet results differ by engine and model combination. The safe design is to not depend on this setting.
Fixing a Repository with 3 Bugs
Finally, I handed it a small Python project with 5 failing tests and asked it to fix everything using only read_file, write_file, and run_tests. Grading was done by running pytest in the harness — not based on the model's self-report.
| Configuration | Tests fixed | Turns | Tool calls | Time | Output tokens |
|---|---|---|---|---|---|
| Muse Glimmer / effort high | 5/5 | 12 | 11 | 186.0 sec | 1,998 |
| Muse Glimmer / effort low | 5/5 | 13 | 12 | 142.2 sec | 1,559 |
| Muse Glimmer / llama.cpp | 5/5 | 12 | 11 | 132.6 sec | 1,619 |
| Qwen3.6-27B / thinking on | 5/5 | 5 | 10 | 107.7 sec | 1,232 |
| Qwen3.6-27B / thinking off | 5/5 | 9 | 12 | 103.0 sec | 1,143 |
| Gemma4-31B-IT | 5/5 | 14 | 13 | 121.1 sec | 784 |
All 6 configurations turned all 12 tests green. Argument JSON was never malformed. Here again, no correctness differences appeared — only round trips and elapsed time differed.
Muse Glimmer took exactly 12 turns and 11 tool calls regardless of which engine was used, following the same path to the same destination. That consistency is a manageable property. Qwen, on the other hand, was able to batch multiple calls and finished in 5 turns, while Gemma used the fewest output tokens at 784 but took 14 turns.
The approach also had distinctive characteristics. At high, it spent the first 7 turns on read_file, then at turn 8 ran 2,539 characters of thinking all at once to decide its fix strategy, after which it wrote changes decisively and went green on the first try. Many round trips, but no backtracking.
7 turns to read 7 files — one at a time. Earlier in the pseudo-filesystem task it batched 4 at once, yet in this task it went one per turn all the way through. Notably, Gemma4-31B also went one-at-a-time for 14 turns, so this isn't unique to Muse Glimmer. Compared to Qwen batching 3 at a time and finishing in 5 turns, the difference in steps shows up directly in elapsed time.
Let me compare these results against the published benchmarks. Meta states MCP Atlas 75.5 vs. 62.5 and τ3-Banking 23.5 vs. 16.7, claiming Muse Glimmer clearly outperforms Qwen3.6-27B on tasks that require multiple tool calls. On coding however, it loses: SWE-Bench Verified 76.0 vs. 77.2 and TerminalBench 51.7 vs. 60.7. My results showed neither advantage in either direction. Everything scored perfectly, and the only differences were in round trips and time — and in that efficiency, Qwen's ability to batch calls gave it the advantage.
I think this means the tasks were simply too easy. All models aced the 5 tool call questions and the small repository with 5 failing tests on the first try. That's a different kind of measurement than benchmarks like MCP Atlas or τ3-Banking, which test whether a model can complete a long multi-step procedure without going off course. To be honest, the tasks I used here weren't able to verify the claims on the label.
Summary
Muse Glimmer 30B loaded cleanly onto a single DGX Spark. With NVFP4 it fits in 25 GB, securing a KV cache pool of 4.8 million tokens. That's 2.2× Qwen3.6-27B and 6.3× Gemma4-31B — the clearest advantage in this comparison. For workloads that run many long contexts in parallel, this is where it will make a difference.
On the other hand, I was unable to measure differences in raw capability. Japanese (4 questions), tool calls (5 questions), root cause identification in a pseudo-filesystem, and fixing a repository with 5 failing tests — all three models passed everything, regardless of reasoning strength, engine, or quantization.
The differences showed up in tokens and time spent reaching the same answer. And in that efficiency, the comparison models had the advantage. Qwen can batch multiple tool calls, cutting round trips to less than half, and can skip the thinking step for lighter responses. Gemma's raw decode speed is the slowest of the three, yet because it answers without thinking, it was the fastest in wall-clock time for the 4 Japanese questions. For a model that sells itself on "think before acting," this was a somewhat anticlimactic result.
My assessment is that the tasks were too easy. What Meta claims as a differentiator is the kind of benchmark that tests whether long multi-step procedures can be completed without going off track — and that's outside what can be assembled in a one-day harness. Within what's measurable locally on day one, I wasn't able to verify the label's claims.
What mattered in practice was the conventions. The number of tool calls per message varies by situation; tool_choice: "required" is silently ignored without an error; the way to extract thinking differs by engine. All of these cause existing code to break silently without raising exceptions, so verifying them before migration will prevent incidents.
On the engine side, answers changed within a single day. On launch day, only SGLang had speculative decoding working end-to-end, but by the next day vLLM had caught up, achieving 1.85× on my unit. However, this isn't in the distribution image yet, so anyone trying now will hit the same wall as launch day. For image input, llama.cpp is the easiest route — just add --mmproj and you're done. For now, the answer seems to depend on your use case and timing.
The next homework item is preparing more difficult tasks and finding the conditions under which the claimed advantages actually appear. The Muse Spark 1.2 weights are reportedly coming soon, so I'd like to try those as well when they're out.
One more thing. The results here are a modest "no difference on my tasks," but separate from that, I think it's significant that Meta has returned to this arena after 1 year and 4 months. Apache-2.0, 30B, fits on one machine. On launch day, three inference engines moved to add support, quantizations appeared overnight, and even the speculative decoding bug I chased in this article was fixed by the next morning. That's what happens when a major player comes back. Whatever these numbers show, I'm more interested in how this return will affect the open-weight ecosystem going forward.