
Tried running Kimi K3 2.8T on a single DGX Spark

This page has been translated by machine translation. View original
Introduction
Hello, I'm Morishige from Classmethod's Manufacturing Business Technology Department.
When using DGX Spark, the unified memory figure of 121 GiB becomes a hard ceiling. Models larger than this simply won't run. Even with two units connected, the upper limit is around 170GB, and beyond that there was no choice but to give up.
In the midst of this, I found an engine that operates while ignoring the installed memory ceiling. It's called Pulsar. It places MoE routed experts on NVMe and reads them out token by token during inference.
To state the conclusion upfront: Kimi K3 with 2.8 trillion parameters ran on a single machine at its full 634.6GB — 4.9 times the 121 GiB capacity, and 3.7 times the previous upper limit. GLM-5.2 744B also ran at three stages from 211GB to 434GB. "It ran" might be the more accurate expression :)
However, getting there required overturning several assumptions. The conventional tuning wisdom shared for dGPUs barely works with unified memory. Increasing the cache didn't speed things up, and llama.cpp's --n-cpu-moe actually made things 39% slower.
In a previous article, I used llama.cpp on the same machine to fit DeepSeek V4 Flash on a single unit.
Pulsar runs with experts staying on NVMe
In MoE models, routed experts account for the vast majority of parameters. Moreover, only a handful of them are used per token. DeepSeek V4 Flash uses only 6 out of 256, and Kimi K3 uses only 16 out of 896.
Pulsar leverages this property. It keeps experts on NVMe and reads only those that are needed. Only the attention, router, and shared experts — the parts that are always used — remain resident. To borrow the README's phrasing, it's a design where disk read speed directly becomes generation speed.
It's written in Rust and CUDA, and reads standard llama.cpp GGUF files. The author's benchmarks look like this:
| Model | Total params | active | GGUF | decode |
|---|---|---|---|---|
| Qwen3.6-35B-A3B | 35B | 3B | 22GB | 51.8 |
| Laguna-S-2.1 | 118B | 8B | 36GB | 17.3 |
| DeepSeek-V4-Flash | 284B | ~8B | 87GB | 8.2 |
| GLM-5.2 | 744B | 40B | 211GB | 2.7 |
| Kimi K2.7 | ~1T | 32B | 339GB | 1.3 |
The reference box is an RTX 5060 Ti 16GB and RTX 4060 Ti 16GB, Ryzen 9900X, 30GB system RAM, and Gen5 NVMe. That works out to running a 339GB model with a combined 32GB of VRAM.
What caught my attention in this table is the relationship between Laguna-S-2.1 and DeepSeek-V4-Flash. Both have 8B active parameters, yet there's a 2x gap between 17.3 and 8.2. The only difference is the GGUF size. Since the author has 30GB of RAM, the 36GB Laguna fits almost entirely in the host cache, while only one-third of the 87GB V4 Flash fits. This suggests that what determines speed isn't the number of active parameters, but how much of the expert pool fits in the cache.
If that's the case, DGX Spark with 121 GiB of unified memory should have an advantage — it has four times the cache budget of the author's setup.
Building on DGX Spark and measuring NVMe performance
The README requires Linux and an NVIDIA GPU, stating that GTX 10 series and later should work. There's no mention of aarch64. The DGX Spark's GB10 has compute capability 12.1, also known as sm_121.
Reading crates/kernels/build.rs, the default behavior was to emit SASS from sm_61 through sm_89 and fall back to JIT from PTX for anything beyond that. The comment mentioned that PULSAR_CUDA_ARCH could override this, so I tried specifying sm_121 directly. CUDA 13.0 supports native code generation for GB10.
export PATH="$HOME/.cargo/bin:/usr/local/cuda/bin:$PATH"
export PULSAR_CUDA_ARCH=121
export CXX=g++-13
cargo build --release -p engine -p serve -p quant
Without touching the source at all, it compiled in 53.5 seconds. Since there were no reports of building on aarch64 even upstream, it was perhaps lucky that it worked as-is.
Next, I measured NVMe speed. Since Pulsar explicitly states that disk speed determines generation speed, the results can't be interpreted without knowing this. However, there were no records of actual NVMe measurements for DGX Spark — neither in my past verifications nor in the community.
Reading through the page cache would show faster-than-actual numbers, so I measured with dd using O_DIRECT, reading 20 GiB from a GGUF file on hand.
dd if=<GGUF over 20GB> of=/dev/null bs=16M count=1250 iflag=direct
| Block size | Bandwidth |
|---|---|
| 1 MiB | 4.9 GB/s |
| 4 MiB | 6.8 GB/s |
| 16 MiB | 11.1 GB/s |
A 2.3x variation based on block size was surprising. It seems that I/O dispatch overhead becomes dominant with smaller blocks. Going up to 16 MiB, we reach 11.1 GB/s.
The author's Gen5 NVMe is reportedly around 7 GB/s, so we exceed that in bandwidth. The host cache is also 4x larger. Not a bad starting point.
First, confirming how much llama.cpp can hold
Before trying Pulsar, I wanted to clearly establish how many GiB llama.cpp could actually handle. Without knowing this, there's no basis for deciding when SSD streaming is warranted.
Last time, I loaded DeepSeek V4 Flash at UD-IQ3_XXS, fitting 97.1 GiB. This time, re-measuring showed 19GB remaining, suggesting a bit more headroom. One step up, UD-IQ3_S, is 116GB — or 108.1 GiB.
It loaded successfully.
| Quantization | Size | used | Remaining | Load | decode |
|---|---|---|---|---|---|
| UD-IQ3_XXS | 97.1 GiB | 102GB | 19GB | 421s | 16.63 tok/s |
| UD-IQ3_S | 108.1 GiB | 113GB | 8GB | 482s | 16.15 tok/s |
| UD-Q3_K_XL | 119.2 GiB | — | — | — | Unlikely to fit |
With 8GB remaining, ctx 2048 runs. The next quantization is 119.2 GiB, leaving only about 2GB — not enough room for the KV cache. The practical upper limit for llama.cpp on DGX Spark appears to be around 108.1 GiB.
I also ran the same UD-IQ3_XXS as last time with the same build and benchmark script. Last time was 16.56 tok/s, this time 16.63 tok/s — a difference of 0.4%. This confirms the environment hasn't changed since then. It's a minor point, but it determines whether the subsequent numbers can be read alongside the previous article.
Pushing past the wall, testing up to 434GB
I chose GLM-5.2 744B. antirez distributes three levels of quantization.
| File | Size | vs 121 GiB (~130GB) |
|---|---|---|
| UD-IQ2_XXS_RoutedIQ2XXS_blk78Q2K | 211GB | 1.6x |
| UD-Q2_K_RoutedQ2K | 262GB | 2.0x |
| UD-Q4_K_RoutedQ4K | 434GB | 3.3x |
211GB loaded in 23.6 seconds and went straight into generation. This is the same machine that had a 170GB upper limit even with two nodes. It worked surprisingly easily.
Comparing all three stages, something changes in the middle.
| Quantization | Size | vs 121 GiB (~130GB) | host cache | effective disk | decode | vs previous |
|---|---|---|---|---|---|---|
| IQ2_XXS | 211GB | 1.6x | 84% | 16% | 2.12 tok/s | — |
| Q2_K | 262GB | 2.0x | 81% | 19% | 2.07 tok/s | −2.4% |
| Q4_K | 434GB | 3.3x | 73% | 27% | 1.13 tok/s | −45% |
Going from 211GB to 262GB, a 24% size increase causes only a 2.4% drop. But at 434GB, there's a 45% drop. There's a clear cliff — neither linear nor logarithmic.
The hit rate explains where the cliff falls. Against an 80GB cache budget, the popular experts for 211GB and 262GB fit within it. At 434GB, they overflow, and the proportion read from disk rises to 27%. What matters isn't the total model size, but whether the frequently used portions fit within the budget.
And here, the cache budget takes effect straightforwardly. For the 211GB model, ranging from 20GB to 80GB yields 1.66 to 2.12 tok/s, a +28% improvement. Once the model exceeds physical memory, Pulsar returns to its original disk-bound behavior.
Note that raising the budget to 100GB made the machine unresponsive. MLA-type models keep about 14GB of attention stack resident at all times, so combined with the cache, it exhausts the 121 GiB. The practical upper limit on this machine was around 80GB.
Kimi K3 with 2.8T parameters ran
Finally, Kimi K3. 2.8 trillion parameters, UD-IQ1_S at 634.6GB, split into 14 shards. 4.9 times the 121 GiB.
K3 doesn't appear in the README's model table. At first I took that to mean it was unsupported, but opening the source revealed crates/engine/src/real/k3.rs with 659 lines — the implementation exists, but even the author hasn't benchmarked it.
After downloading 634.6GB and running it:
pulsar: split gguf: 14 shards as one virtual file
pulsar-cli: blk.0.ssm_f_b.weight: expected f16, got Q8_0
ssm_f_b is the forget gate bias of KDA, Kimi Delta Attention. In unsloth's distributed files, this is Q8_0, while the loader expects f16 and rejects it.
Looking at the relevant code, within the same struct, only one line was handled differently:
f_a:    MatW::load(&file, &gguf, &t("ssm_f_a.weight"))?,
f_b:    upload_f16_as_f32(&file, &gguf, &t("ssm_f_b.weight"))?,  // only this one requires f16
beta_w: MatW::load(&file, &gguf, &t("ssm_beta.weight"))?,
a:      upload_as_f32(&file, &gguf, &t("ssm_a"))?,
Just below, ssm_a uses upload_as_f32, which doesn't care about the type. And in the comment for that function, the answer was written:
pulsar-quant falls back to q8_0 for rows that are a multiple of 32 but not 256, which is how ssm_alpha/ssm_beta arrive on some GDN models. Dequantize rather than refuse the file.
For GDN (Gated DeltaNet)-type models, ssm tensors arrive as q8_0. Dequantize rather than reject the file — the author wrote this themselves. KDA is a derivative of Gated DeltaNet, so K3 is exactly this case. It appears one line was simply missed in an update.
Replacing it with upload_as_f32 and rebuilding took 31.6 seconds. It worked.
pulsar: split gguf: 14 shards as one virtual file
pulsar: loaded in 66.4s (93 layers, 896 experts x top-16)
pulsar: unified memory detected - zero-copy expert resolve
pulsar: prefill 23 tokens in 39.17s
pulsar: 64 tokens in 91.80s (0.70 tok/s), vram cache 0% hits, host cache 37% of remainder
A 2.8 trillion parameter model ran at 0.70 tok/s on a machine with 121 GiB of unified memory. The configuration of 93 layers with 896 experts selecting top-16 is displayed directly.
1.4 seconds per token. Watching 2.8 trillion parameters being squeezed out from a single desktop machine — slower than a human reading aloud — was a rather compelling sight. Whether it's practical is another question, but since something that shouldn't run is running, I'll call it good enough.
For K3 alone, increasing the cache actually made things slower. 0.70 tok/s at 20GB, 0.63 tok/s at 40GB. With 896 experts selecting 16 per token, the pool is 3.5 times larger and reads are 2x compared to GLM's 256 selecting 8.
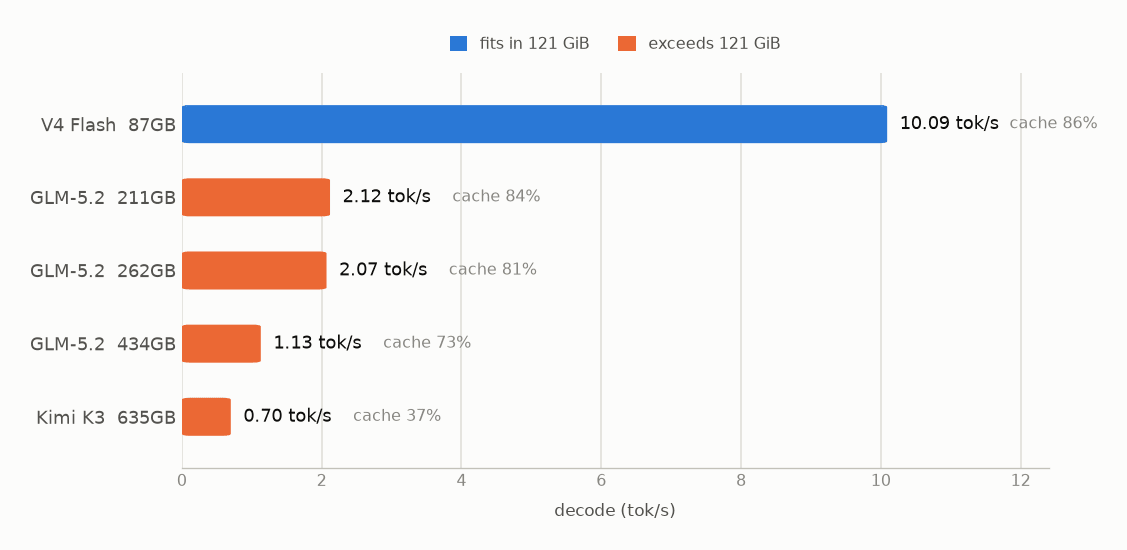
Decode speeds arranged in order of model size. Blue represents models that fit within 121 GiB of unified memory, orange represents those that exceed it. The faint numbers on the right are host cache hit rates — the lower they fall, the lower the speed. 211GB and 262GB are nearly equal, while 434GB drops one step and 635GB drops another.
But llama.cpp is faster for models that fit in memory
Just because large models ran doesn't mean Pulsar is better for smaller models too — it isn't.
Let's compare using DeepSeek V4 Flash, which fits within 121 GiB. This is the same UD-IQ2_M at 84.7 GiB measured with llama.cpp last time.
pulsar: loaded in 6.0s (43 layers, 256 experts x top-6)
pulsar: unified memory detected - zero-copy expert resolve
pulsar: 128 tokens in 18.46s (6.94 tok/s), vram cache 0% hits, host cache 90% of remainder
Measuring at two different generation lengths and separating the fixed overhead from the slope gives a steady-state 8.04 tok/s. Since it's the exact same file, these numbers can be directly compared with last time's figures.
| Engine | Model | Residency method | Load | decode |
|---|---|---|---|---|
| llama.cpp | UD-IQ2_M 84.7 GiB | Full memory-resident | 6 min 22 s | 17.35 tok/s |
| Pulsar | UD-IQ2_M 84.7 GiB | Expert streaming | 6.0 s | 8.04 tok/s |
llama.cpp is 2.2x faster for generation speed. There was indeed no reason to use streaming for models that fit in memory.
There was also an interesting finding. Even with the same V4 Flash, using a GGUF built with Pulsar's ds4 recipe yields 10.09 tok/s — 25% faster than the unsloth version. It keeps attention at Q8_0 for high precision while pushing only routed experts down to 2 bits, which pairs well with Pulsar's approach of streaming only experts. It's worth keeping in mind that the choice of quantization changes when using Pulsar.
However, load time is reversed. Compared to 6 minutes 22 seconds, 6.0 seconds is a 64x difference. With llama.cpp on 121 GiB of unified memory, GPU buffers and page cache compete with each other, forcing 1.4x the file size to be re-read. Since Pulsar doesn't keep experts resident, that problem simply doesn't arise.
The division of labor seems to be: llama.cpp for long-running servers, Pulsar for one-off launches.
Three conventional approaches that don't work with unified memory
Tuning techniques shared for dGPUs largely failed to work.
The cause traces back to a single point: one fewer level in the memory hierarchy.
What doesn't fit in VRAM spills to RAM; what doesn't fit in RAM spills to disk. When this two-tier fallback collapses to one tier, existing optimizations just shuffle data within the same physical memory — adding overhead without benefit.
llama.cpp's --n-cpu-moe becomes counterproductive
This option offloads routed experts from VRAM to system RAM. Reports show it running a 108 GiB model at 12.5 tok/s on a 24GB RTX 3090, and a 4.87x speedup measured on a 12GB RTX 5070.
Since V4 Flash has 43 layers, I swept the number of offloaded layers:
--n-cpu-moe |
used | buff/cache | Total | Load | prefill | decode |
|---|---|---|---|---|---|---|
| 0 | 113GB | 4GB | 117GB | 482s | 394.51 | 16.15 tok/s |
| 10 | 90GB | 31GB | 121GB | 361s | 216.31 | 9.86 |
| 22 | 62GB | 59GB | 121GB | 201s | 42.84 | 6.58 |
| 43 | 13GB | 103GB | 116GB | 50s | 1.14 | 4.67 |
The more layers offloaded, the slower it got. Offloading all layers brought prefill from 394.51 down to 1.14 tok/s — a 346x reduction.
The reason is visible in the total column. As used decreases, buff/cache increases by the same amount, keeping the total steady at 116–121GB. Since the offload destination is the same memory, only the overhead of shuffling increases.
Load time, however, dropped from 482 seconds to 50 seconds — a 10x improvement. It might be useful as a knob for faster startup at the expense of inference speed.
Increasing cache budget doesn't improve speed
According to the README, the host cache budget is the primary tuning lever for Pulsar. I swept from 10GB to 100GB (10x) for the 87GB model.
| Condition | host cache | decode |
|---|---|---|
PULSAR_CACHE_GB=10 |
60% | 6.68 tok/s |
PULSAR_CACHE_GB=100 |
86% | 6.92 tok/s |
10x the cache, +3.6%. Hit rate moved from 60% to 86%, but speed didn't follow. The CPU lane that boosted V4 Flash from 8.2 to 11.3 tok/s in the author's environment gave only +1.0% here.
That's because the 87GB model fits entirely within the 121 GiB budget, so it's barely reading from disk in the first place. By the same logic as the +28% seen with GLM's 211GB earlier, disk only becomes the bottleneck once the model exceeds physical memory.
The VRAM cache is never used
vram cache 0% hits appeared under all conditions. Tracing the source, when unified memory is detected, the process of allocating the VRAM pool is skipped entirely, and PULSAR_DEV_CACHE_GB is never even read.
// (unified boxes keep the 1-byte cache: zero-copy resolve)
dev_cache: DeviceSlabCache::new(1, max_slab)?,
Overriding auto-detection with PULSAR_UNIFIED=0 forces the VRAM path, but comparing with equal cache sizes showed zero-copy was 6.8% faster. Since it's just making a copy within the same physical memory, the extra copy overhead is a net loss. The author's auto-detection was making the right call.
Summary
On a single DGX Spark, Kimi K3 with 2.8 trillion parameters ran. 634.6GB — 4.9 times the unified memory. Since the previous upper limit on this machine was 170GB across two nodes, the effective range has been extended to 3.7x.
What I did: measured disk speed, fixed one line of source code, downloaded 634GB, crashed the machine once, and finally got 0.70 tok/s. Not bad for a summer research project.
The division of use cases also became clear.
| Approach | decode | When to use |
|---|---|---|
| llama.cpp full load | 16.15~16.63 tok/s | Up to 108.1 GiB |
| Pulsar | 10.09 tok/s | When fast startup matters |
llama.cpp --n-cpu-moe |
9.86 tok/s or below | No reason to choose with unified mem |
| Pulsar (GLM-5.2 434GB) | 1.13 tok/s | Beyond 121 GiB |
| Pulsar (Kimi K3 634.6GB) | 0.70 tok/s | 4.9x the 121 GiB |
Up to 108.1 GiB, llama.cpp is fastest. Beyond that, Pulsar takes over. The middle ground of --n-cpu-moe simply doesn't work with unified memory.
Whether 0.70 tok/s counts as practical depends on the use case, but it's a model that shouldn't be running at all. For batch jobs where you submit a long prompt and read the result later, it's a viable option. GLM-5.2 at 211GB delivers 2.12 tok/s, which might even be tolerable for interactive use.
Personally, I came to appreciate that unified memory trades the advantage of "the GPU can use all 121 GiB" for the loss of tiered memory fallback. That's precisely why the idea of offloading to disk becomes effective here.
There's more left to try. The UD-IQ1_S used this time compresses 2.78 trillion parameters into 634.6GB, giving 1.83 bits per parameter — the generated text was somewhat thin. unsloth also distributes higher-bit versions, which might improve practical quality, but disk constraints ruled those out this time. Next I'd like to try a higher-quantization K3, or building a custom mixed-quantization model with pulsar-quant.
Reference Links
- giannisanni/pulsar — SSD streaming inference engine
- pulsar PR #24 — The K3 loader fix submitted this time
- antirez/GLM-5.2-GGUF — Three-tier quantization for GLM-5.2 744B
- unsloth/Kimi-K3-GGUF — GGUF for Kimi K3 2.8T
- unsloth/DeepSeek-V4-Flash-0731-GGUF — Quantization variants of V4 Flash
- Running DeepSeek V4 Flash-0731 on a Single DGX Spark with llama.cpp (Previous article published 2026-08-02)