I tried the Warehouse Blueprint of VSS 3.0.0 EA on DGX Spark

This page has been translated by machine translation. View original
Introduction
Hello, I'm Morishige from Classmethod's Manufacturing Business Technology Department.
In the previous article, I ran the VSS (Video Search and Summarization) Agent on DGX Spark and tried out the basic usage of the video search AI along with swapping in a Japanese LLM. By switching to Nemotron 9B-v2-Japanese, I was able to confirm a significant improvement in Japanese Q&A quality.
The previous article used 2.4.x for verification, but VSS already has a 3.0.0 Early Access release available. The architecture has been revamped from monolithic to microservices, with MCP-based orchestration, industry-specific Blueprints, and integrated video and text Embedding (Cosmos-Embed1) — quite a lot has changed internally.
Since it's EA (Early Access), production use is not recommended, but that's precisely why I thought there was value in reporting "what works at this stage and what has changed," so I decided to get an early hands-on experience on DGX Spark.
VSS 2.4.x and 3.0.0 — What Changed
First, let me summarize what changed between the previous 2.4.x and this 3.0.0 EA.
Architecture Overhaul
2.4.x had a monolithic structure where a single VSS Engine container handled everything from video ingestion to retrieval. In 3.0.0, this has been decomposed into 3 layers of microservices.
The RTVI (Real-Time Video Intelligence) layer handles real-time video processing, the analytics layer performs behavior analysis and calibration, and the agent layer orchestrates everything with MCP-based coordination.
Key Changes
| Item | 2.4.x | 3.0.0 EA |
|---|---|---|
| Architecture | Monolithic (VSS Engine) | 3-layer microservices (RTVI / Analytics / Agent) |
| Orchestration | config.yaml-based | MCP (FastMCP)-based |
| Search Infrastructure | Milvus + Neo4j (CA-RAG) | Elasticsearch + Milvus |
| Video Embedding | Text Embedding only | Cosmos-Embed1 (Video + Text unified) |
| CV Pipeline | None (VLM only) | DeepStream 8.0 (RT-DETR object detection) |
| Behavior Analysis | None | Behavior Analytics (safety event detection) |
| Deployment | GitHub repository + docker compose | NGC package + docker compose |
| Industry Templates | None | Warehouse / Smart City / Public Safety |
| VLM | Cosmos-Reason2 | Cosmos-Reason2 / Qwen3-VL |
| LLM | Llama 3.1 8B / Ollama replaceable | Nemotron Nano 9B-v2 (default) |
| DGX Spark Support | IS_SBSA=1 flag |
Official support via Warehouse Blueprint |
In 2.4.x, swapping out Embeddings or Rerankers required building a custom NIM-compatible proxy, and the CV pipeline had to be set up separately — there were parts that were difficult to replace. The microservice architecture of 3.0.0 is heading in a direction that fundamentally resolves these constraints.
Industry-Specific Blueprints
3.0.0 comes with 3 types of industry-specific Blueprints.
| Blueprint | Target Domain | Main Use Cases |
|---|---|---|
| Warehouse | Warehouse/Factory/Logistics | Space management, asset tracking, forklift and person proximity detection |
| Smart City | Traffic/Urban surveillance | Traffic flow measurement, illegal stopping detection, wrong-way detection. Sim2Real with CARLA + Cosmos Transfer |
| Public Safety | Public safety | Tailgating detection (detecting unauthorized passage following an authorized person) |
Each is a reference implementation built on top of a common VSS core platform, with industry-specific detection models, behavior analysis logic, and agent configurations layered on top. This time I'll use the "Warehouse Blueprint" for warehouses. It officially supports DGX Spark, and according to NVIDIA's published performance measurements, end-to-end latency is 102ms at 4 streams 30fps. As a reference value, this is faster than IGX Thor (222ms).
The available profiles are the following 4:
| Profile | BP_PROFILE Value | Description |
|---|---|---|
| 2D Vision AI (Kafka) | bp_wh_kafka |
Object detection and tracking + Kafka |
| 2D Vision AI (Redis) | bp_wh_redis |
Object detection and tracking + Redis |
| 2D Vision AI with Agents | bp_wh |
Above plus VSS Agent, VLM, LLM integration |
| 3D Vision AI | — | Multi-camera 3D tracking with Sparse4D |
This time I'll use the Warehouse Operations Blueprint, "2D Vision AI with Agents" (bp_wh) profile. It's a full-stack configuration that can run everything from object detection with DeepStream to event detection with Behavior Analytics, and natural language queries with VSS Agent.
Preparing to Deploy on DGX Spark
Prerequisites
I verified the environment needed to run 3.0.0 EA on DGX Spark.
| Item | Requirement | DGX Spark (measured) | Status |
|---|---|---|---|
| OS | Ubuntu 24.04 | Ubuntu 24.04.4 LTS | OK |
| NVIDIA Driver | 580.105.08+ | 580.126.09 | OK |
| Docker | 27.2.0+ | 29.1.3 | OK |
| Docker Compose | v2.29.0+ | v5.0.1 | OK |
| NGC CLI | 4.10.0+ | 4.14.0 (manually installed) | OK |
| Disk | Sufficient space | 2.3TB | OK |
Only the NGC CLI wasn't installed on DGX Spark, so I downloaded the ARM64 version from the NGC official site and installed it.
# Installing NGC CLI (ARM64)
curl -sL "https://api.ngc.nvidia.com/v2/resources/nvidia/ngc-apps/ngc_cli/versions/4.14.0/files/ngccli_arm64.zip" \
  -o /tmp/ngccli_arm64.zip
unzip /tmp/ngccli_arm64.zip -d /tmp/ngc-cli-install
mkdir -p ~/.local/bin
cp -r /tmp/ngc-cli-install/ngc-cli ~/.local/ngc-cli
ln -sf ~/.local/ngc-cli/ngc ~/.local/bin/ngc

# Configuration
ngc config set
Getting the NGC Package
Download the compose package for the Warehouse Blueprint from NGC.
ngc registry resource download-version \
  "nvidia/vss-warehouse/vss-warehouse-compose:3.0.0"
A 46.72MB package is downloaded. When extracted, the structure looks like this:
vss-warehouse-compose_v3.0.0/
├── deployments/
│   ├── compose.yml           # Main Compose definition
│   ├── foundational/         # Kafka, Elasticsearch, Redis, etc.
│   ├── monitoring/           # Prometheus / Grafana
│   ├── vst/                  # Video Storage Tool
│   ├── warehouse/            # Warehouse Blueprint main
│   │   ├── .env              # Environment variables (edit here)
│   │   ├── warehouse-2d-app/ # 2D pipeline
│   │   └── vss-agent/        # VSS Agent configuration
│   ├── nim/                  # LLM / VLM NIM definitions
│   ├── agents/               # Agent + UI
│   ├── rtvi/                 # RTVI microservices
│   ├── lvs/                  # Long Video Summarization
│   └── auto-calib/           # Camera calibration
└── modules/                  # Utility scripts
With 2.4.x, you cloned a GitHub repository and had to decipher the compose.yaml inside, but 3.0.0 is organized as an NGC package. The compose.yml is split by module, with the main compose.yml loading each service via include.
.env Configuration for DGX Spark
This was the most time-consuming part of this deployment. The .env file requires several DGX Spark-specific settings, and it won't work with the defaults.
# Hardware profile (changed from H100 → DGX-SPARK)
HARDWARE_PROFILE='DGX-SPARK'

# Use shared mode for single GPU
LLM_MODE=local_shared
VLM_MODE=local_shared

# Device ID (DGX Spark has GPU 0 only)
LLM_DEVICE_ID='0'
VLM_DEVICE_ID='0'

# Path settings
MDX_SAMPLE_APPS_DIR="/path/to/deployments"
MDX_DATA_DIR="/path/to/vss-warehouse-app-data"
HOST_IP='<DGX Spark IP address>'

# NGC API Key
NGC_CLI_API_KEY='<your-ngc-api-key>'
For DGX Spark (ARM64 / SBSA), container image tags also need to be changed. There were commented-out DGX-SPARK settings in the .env file.
# Image tag for Perception (DeepStream)
PERCEPTION_TAG="3.0.0-sbsa"    # x86 uses "3.0.0"

# Image tags for VST containers (change all 7 to -sbsa)
VST_SENSOR_IMAGE_TAG="3.0.0-sbsa"
VST_RTSPSERVER_IMAGE_TAG="3.0.0-sbsa"
VST_RECORDER_IMAGE_TAG="3.0.0-sbsa"
VST_STORAGE_IMAGE_TAG="3.0.0-sbsa"
VST_REPLAYSTREAM_IMAGE_TAG="3.0.0-sbsa"
VST_LIVESTREAM_IMAGE_TAG="3.0.0-sbsa"
NVSTREAMER_IMAGE_TAG="3.0.0-sbsa"
DGX Spark Support Status of the EA Package
While reading through compose.yaml, I noticed that the EA package's DGX Spark support still had parts requiring manual work. Although the official documentation states "DGX-SPARK: Supported," running it as-is requires several additional steps.
| Issue | Details | Resolution |
|---|---|---|
| Missing NIM hw env files | hw-DGX-SPARK.env doesn't exist for either Nemotron Nano V2 or Cosmos Reason2 |
Manually created based on DGX-THOR env |
| VLM profile undefined | No DGX-SPARK profile in Cosmos Reason2's compose |
Manually added to compose.yml |
| Default device IDs | LLM_DEVICE_ID='1', VLM_DEVICE_ID='2' (assumes multi-GPU) |
Changed to '0' |
Since it's an EA (Early Access) stage, I think these areas will be cleaned up toward GA. This time I referred to the DGX-THOR settings (same ARM64 / Grace Hopper architecture) and manually created a hw profile for DGX Spark.
Deployment
Starting Up
Once configured, start all services with compose up.
cd /path/to/vss-warehouse-compose_v3.0.0/deployments

docker compose -f compose.yml \
  --env-file warehouse/.env \
  up --detach --pull always --force-recreate --build
On first run, 36 container images need to be pulled, so depending on your network speed, it may take more than 30 minutes. For DGX Spark, images with the -sbsa tag are automatically selected.
Troubleshooting Pitfalls
When actually starting things up, a few additional steps were necessary.
Registering the NVIDIA Container Runtime
The NVIDIA runtime may not be registered with Docker daemon on DGX Spark. If you get an unknown or invalid runtime name: nvidia error, register it with the following command:
sudo nvidia-ctk runtime configure --runtime=docker
sudo systemctl restart docker
Pre-creating Data Directories
Containers won't start if the bind mount destination directories for Elasticsearch and Redis don't exist. I read through the compose volume definitions and pre-created the necessary directories.
mkdir -p /path/to/data/data_log/{elastic/{logs,data},kafka,redis/{data,log}}
mkdir -p /path/to/data/videos/nv-warehouse-4cams
mkdir -p /path/to/data/models
Directory Permissions
There were cases where Docker created directories as root, causing Redis to fail to start with Permission denied. I resolved this by fixing ownership with chown and permissions with chmod.
LLM NIM ARM64 Issue
This was the biggest obstacle in this verification.
The VLM (Cosmos-Reason2-8B) NIM officially supports ARM64 and started without issues. However, the LLM (Nemotron-Nano-9B-v2) NIM failed to start with exec format error.
exec /opt/nvidia/nvidia_entrypoint.sh: exec format error
The Docker multi-architecture manifest includes arm64/linux, and docker image inspect also shows Architecture: arm64, but the binaries inside the container appear to actually be built for x86. Even /bin/bash couldn't be executed.
This appears to be an issue with the EA-stage image build.
Using NGC vLLM as an Alternative
Since NIM wouldn't work, I used the vLLM container (nvcr.io/nvidia/vllm) published by NVIDIA on NGC as an alternative. This officially supports ARM64.
docker run -d --name vllm-nemotron-nano \
  --runtime nvidia \
  -p 30081:8000 \
  --shm-size 16g \
  -e NVIDIA_VISIBLE_DEVICES=0 \
  -e HF_TOKEN=$HF_TOKEN \
  nvcr.io/nvidia/vllm:26.01-py3 \
  python3 -m vllm.entrypoints.openai.api_server \
    --model nvidia/NVIDIA-Nemotron-Nano-9B-v2 \
    --served-model-name nvidia/nvidia-nemotron-nano-9b-v2 \
    --trust-remote-code \
    --enable-auto-tool-choice \
    --tool-call-parser hermes \
    --gpu-memory-utilization 0.2 \
    --max-model-len 16384 \
    --max-num-seqs 4
By setting --served-model-name to the same nvidia/nvidia-nemotron-nano-9b-v2 as NIM, you can connect without changing the VSS Agent configuration. Since the OpenAI-compatible API endpoint format is the same, a drop-in replacement is possible.
However, there is one caveat. NGC vLLM 26.02 requires CUDA 13.1 / Driver 590+, causing a compatibility error with DGX Spark's Driver 580.126.09. It was necessary to use 26.01 (supporting CUDA 13.0).
Startup Results
In the end, 41 compose services + the vLLM container, a total of 42 services, were running. Since ds-configurator exits after generating its configuration, the number of actively running services is 41.
NAME                           STATUS
alert-bridge                   Up 35 minutes
bp-configurator-2d             Up 45 minutes (healthy)
cosmos-reason2-8b-shared-gpu   Up 39 minutes (healthy)
mdx-elastic                    Up 45 minutes (healthy)
mdx-kafka                      Up 45 minutes (healthy)
mdx-kibana                     Up 45 minutes (healthy)
mdx-nvstreamer-2d              Up 9 minutes
metropolis-vss-ui              Up 35 minutes
perception-sdr-2d              Up 45 minutes
vss-agent                      Up 35 minutes (healthy)
vss-auto-calibration           Up 45 minutes (healthy)
vss-behavior-analytics-2d      Up 45 minutes
vss-va-mcp                     Up 44 minutes (healthy)
vss-video-analytics-api-2d     Up 45 minutes
vss-video-analytics-ui         Up 44 minutes
vst-mcp-2d                     Up 44 minutes
# ... 25 other services omitted
GPU memory usage is as follows:
| Process | VRAM |
|---|---|
| VLM (Cosmos-Reason2-8B NIM) | ~32 GB |
| LLM (Nemotron-Nano-9B-v2 vLLM) | ~31 GB |
| VST (video streaming × 2) | ~350 MB |
| Total | ~64 GB / 128 GB |
About half of the GB10's 128 GB unified memory is being used. In 2.4.x, VLM + LLM used around 20 GB, so 3.0.0 seems to be allocating memory more generously. By adjusting --gpu-memory-utilization on the vLLM side, it's also possible to reduce memory consumption further.
Service Configuration
When starting with the bp_wh (2D with Agents) profile, the following services are launched:
| Service | Port | Role |
|---|---|---|
| Agentic UI | 3000 | Chat UI for VSS Agent |
| Video Analytics UI | 3002 | Video analytics dashboard |
| Kibana | 5601 | Elasticsearch dashboard |
| Phoenix UI | 6006 | Agent tracing |
| Video Analytics API | 8081 | REST API for analytics data |
| Calibration Toolkit | 8003 | Camera calibration |
| Nemotron NIM | 30081 | LLM (Nemotron Nano 9B-v2) |
| Cosmos Reason2 NIM | 30082 | VLM (Cosmos-Reason2-8B) |
| NvStreamer | 31000 | Video streaming |
| VIOS | 30888 | Video Storage Tool |
With 2.4.x there was only a Web UI (:9100) and the backend VSS Engine, but in 3.0.0, dedicated UIs are separated by purpose.
Running It
Opening the UI
Once all services are started, you can access 3 web UIs. Based on Next.js, these give a considerably more polished impression compared to the simple UI of 2.4.x.
VSS Agent UI (:3000)
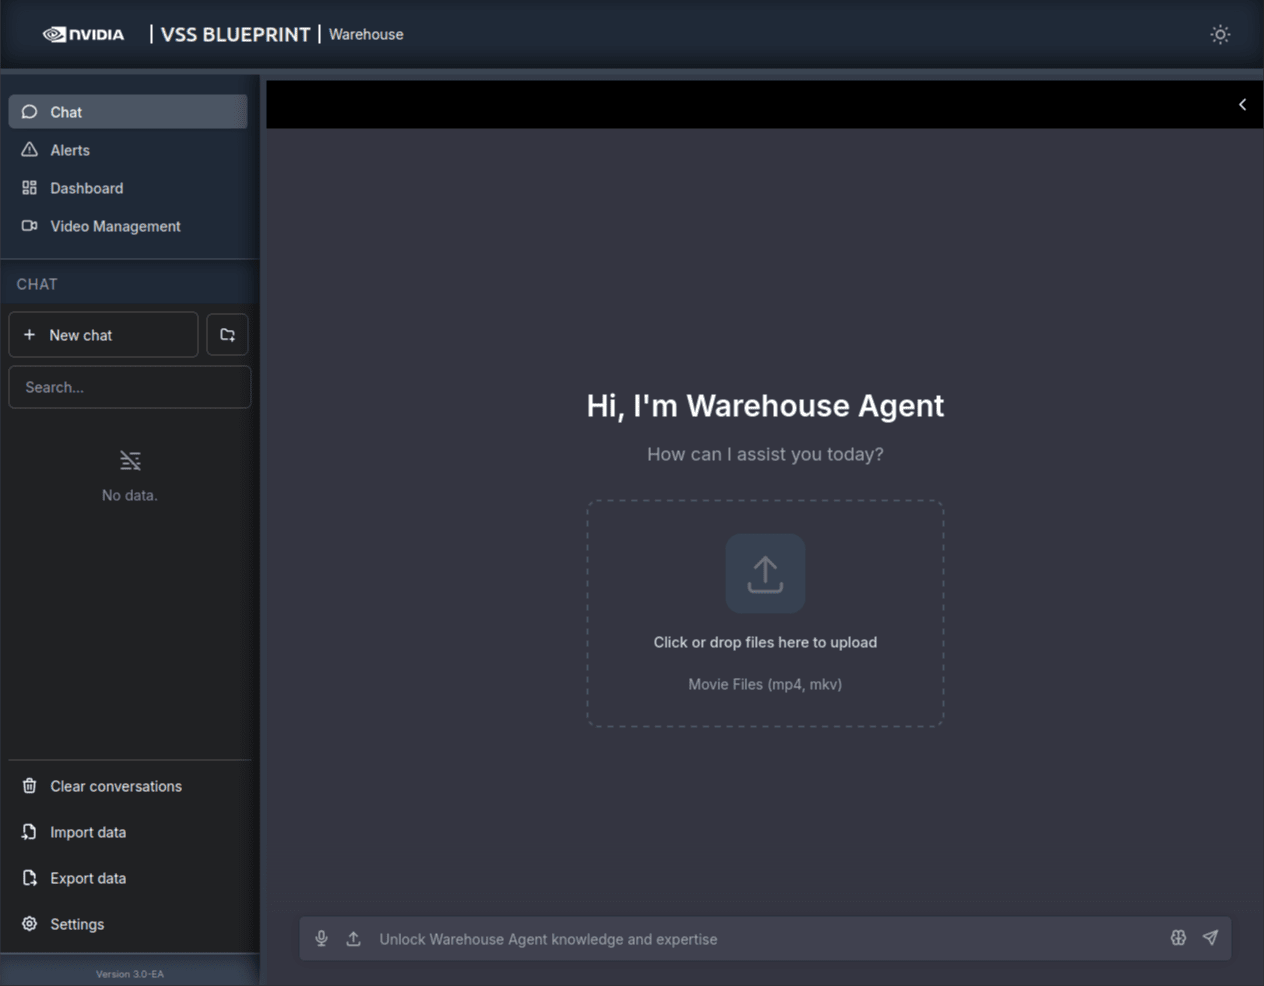
A ChatGPT-like interface that displays "Hi, I'm Warehouse Agent." It has a 4-tab layout: Chat / Alerts / Dashboard / Video Management, and also supports drag & drop video uploads. In the bottom left, you can see the "Version 3.0-EA" label.
Video Analytics UI (:3002)
A video analytics dashboard based on NVIDIA Metropolis. You can check DeepStream detection results in real time.
Kibana (:5601)
An Elasticsearch dashboard used to visualize event data detected by Behavior Analytics.
Chatting with the Agent
I queried the Agent via the VSS Agent UI chat field or through the API.
curl -s -X POST http://localhost:8000/generate \
  -H "Content-Type: application/json" \
  -d '{"messages": [{"role": "user", "content": "Hello, can you describe what you can do?"}]}'
The Agent returned the following response:
I can help with several tasks related to warehouse video surveillance:
- Sensor/Camera Information
- Occupancy Monitoring
- Snapshots/Pictures
- Incident Reporting
While 2.4.x mainly focused on vector search and Q&A over video, 3.0.0 provides more practical capabilities through MCP tools, including sensor management, occupancy monitoring, and incident report generation.
However, one problem arose here.
The Tool Calling Wall and Its Resolution
VSS Agent uses the LLM's tool calling feature internally to invoke MCP tools. The first issue I hit was a mismatch between Nemotron-Nano-9B-v2's tool call format and vLLM's built-in parser.
Nemotron uses an array format like <TOOLCALL>[{...}, {...}]</TOOLCALL>, but vLLM's hermes parser expects individual tag format like <tool_call>{...}</tool_call>. When started as-is, the raw TOOLCALL tags were returned directly as responses.
The solution is to apply a custom template using vLLM's --chat-template option. Based on the model's default template, I modified it to unify the tag name to <tool_call> and output tool calls with individual tags rather than as an array.
# Start with a custom template specified
python3 -m vllm.entrypoints.openai.api_server \
  --model nvidia/NVIDIA-Nemotron-Nano-9B-v2 \
  --chat-template /tmp/chat_template.jinja \
  --enable-auto-tool-choice \
  --tool-call-parser hermes \
  ...
With this fix, VSS Agent's tool integration worked correctly. When asked "Show me available sensors," the Agent automatically calls the get_sensor_ids tool and returns a list of 5 camera streams.
Here are the available sensors:
1. warehouse_cam4
2. warehouse
3. warehouse_cam3
4. warehouse_cam1
5. warehouse_cam2
With the combination of NGC vLLM + custom template, I was able to confirm that the full-stack Agent functionality including tool calling works even in environments where NIM cannot be used.
Restoring the Perception Pipeline
The Perception pipeline (object detection/tracking) using DeepStream didn't work on the first startup. Checking the error logs, there was a message saying the object detection model could not be found.
ERROR: Cannot access ONNX file '/opt/storage/rtdetr_warehouse_v1.0.fp16.onnx'
ERROR: failed to build network since parsing model errors.
Upon investigation, the startup script ds-start.sh was designed to copy models/mtmc/*.onnx from the base image to the working directory, but this directory didn't exist at all in the Perception base image. Only an ITS (Intelligent Traffic Systems) model (resnet50_market1501.etlt) was present in models/rtdetr-its/, and the Warehouse-specific RT-DETR ONNX model didn't appear to be bundled yet. Since it's at the EA stage, this area will likely be addressed going forward.
However, the model itself was published in the NGC catalog. Under the name nvidia/tao/rtdetr_2d_warehouse, it's an RT-DETR + EfficientViT/L2 backbone model trained with TAO Toolkit. It's a warehouse-specific model detecting 7 classes (Person, Humanoid ×2, Nova Carter, Transporter, Forklift, Pallet), provided under the NVIDIA Open Model License (commercially usable).
# Download RT-DETR Warehouse model from NGC
ngc registry model download-version \
  nvidia/tao/rtdetr_2d_warehouse:deployable_efficientvit_l2_v1.0

# Place FP16 ONNX model (136MB) in the mount directory
cp rtdetr_2d_warehouse_vdeployable_efficientvit_l2_v1.0/rtdetr_warehouse_v1.0.fp16.onnx \
  $MDX_DATA_DIR/models/mtmc/

# Fix permissions (container runs as UID 1000, so read permission is required)
chmod 644 $MDX_DATA_DIR/models/mtmc/rtdetr_warehouse_v1.0.fp16.onnx

# Restart Perception container
docker restart perception-2d
On first startup, a TensorRT engine build runs. Looking at the logs, building with explicit FP16 flags failed first, then it fell back to strongly typed mode (using the FP16 operations built into the model as-is) and succeeded. Since there are forum reports of nan occurring from LayerNorm overflow when running RT-DETR in FP16 on DeepStream, the automatic fallback to strongly typed mode was actually a favorable outcome.
After the engine build completed, the pipeline ran normally.
** INFO: <bus_callback:623>: Pipeline running
**PERF:
30.00000 (31.19770)  source_id : 0 stream_name warehouse
The warehouse stream is being processed at 30fps. This matches the DGX Spark performance listed in the NGC model card (supporting 3 streams at 30fps).
Note that this Perception pipeline is a newly added layer in 3.0.0. Whereas the previous 2.4.x handled video understanding with VLM alone, the 3.0.0 Warehouse Blueprint is a hybrid configuration that uses DeepStream's CV pipeline for real-time object detection and tracking in addition to VLM.
What Worked and What Didn't
Here is a summary of the verification results.
| Component | Status | Notes |
|---|---|---|
| VLM NIM (Cosmos-Reason2-8B) | Working | ARM64 officially supported, approx. 32 GB VRAM |
| LLM NIM (Nemotron-Nano-9B-v2) | Failed to start | ARM64 image is broken |
| LLM (NGC vLLM alternative) | Working | Tool calling resolved with custom template |
| NvStreamer (video streaming) | Working | 5-stream RTSP delivery |
| VSS Agent (MCP orchestration) | Working | LLM connection OK, health check passed |
| VA-MCP Server | Working | Provides Video Analytics MCP |
| Perception (DeepStream) | Working | Restored by manually placing NGC models, 30fps |
| Behavior Analytics | Working | Operational after perception recovery |
| Kafka / Elasticsearch / Kibana | Working | No issues at the infrastructure layer |
| Various UIs (:3000 / :3002 / :5601) | Working | Accessible |
| Alert Bridge (VLM-as-Verifier) | Working | Restored with 4 patches applied (described later) |
| Agent report generation | Working | Markdown / PDF + snapshots |
The LLM NIM ARM64 image and the Alert Bridge configuration each required attention, but with alternative solutions and patches applied, the result was a nearly full-stack working system.
Overview of UI and Pipeline
Let's look at the relationship between the actually deployed services using the official architecture diagram. The setup has browsers accessing each UI, while behind the scenes a data pipeline of Perception → Behavior Analytics → Elasticsearch keeps running at 30fps.
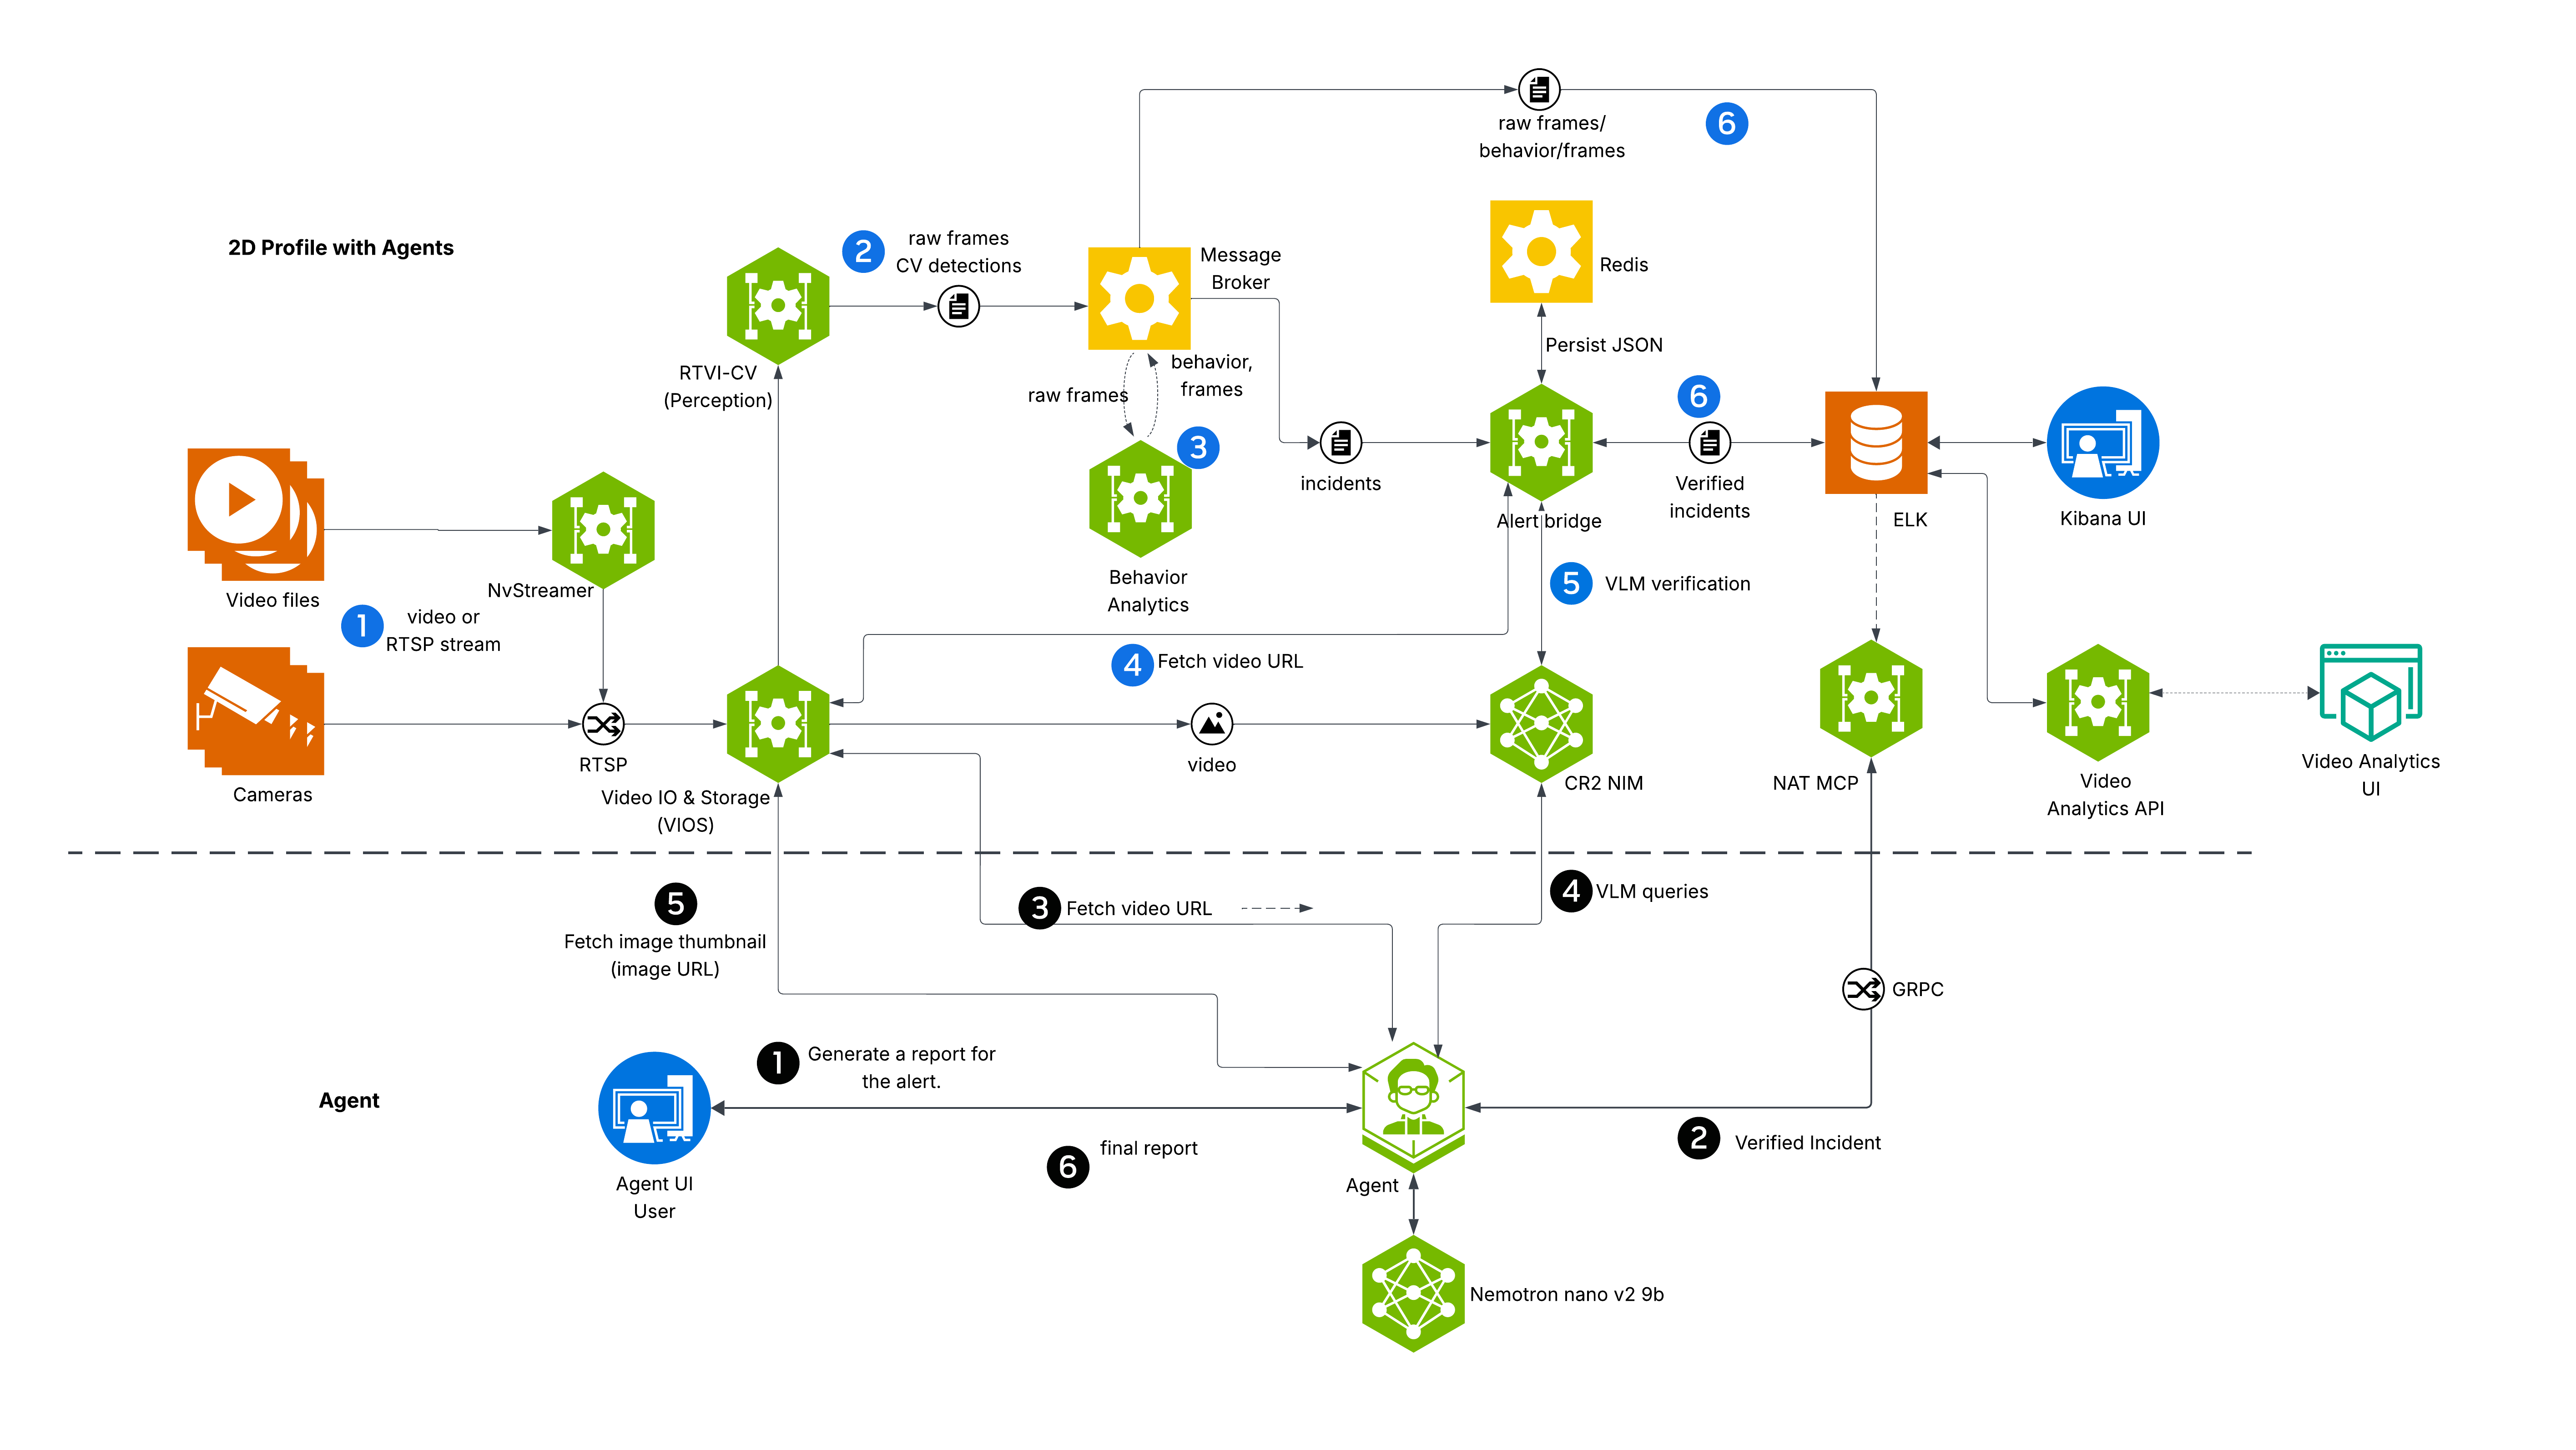
Source: NVIDIA VSS 3.0.0 Warehouse Blueprint - 2D Vision AI with Agents Profile
Video flows from the Input Source (NvStreamer) on the left, through VIOS, to DeepStream (Perception), and detection metadata is passed via Kafka to Behavior Analytics. Analysis results are accumulated in the ELK Stack (Elasticsearch + Kibana) and can be referenced from the UIs on the right.
The VSS UI (:3000) is the overall entry point. When you ask the Warehouse Agent a question from the Chat tab, the Agent pulls data from Elasticsearch via VA-MCP and generates a response using the LLM. The Dashboard tab embeds Kibana in an iframe, visualizing Perception detection data in real time.
MCP Server Configuration
One of the flagship features of 3.0.0 is MCP (Model Context Protocol)-based orchestration. The VSS Agent internally communicates with the VA-MCP Server (Video Analytics MCP Server) to retrieve video analysis results.
Looking at the VSS Agent's config.yml, two MCP clients are defined: video_analytics_mcp and vst_mcp.
function_groups:
  video_analytics_mcp:
    _type: mcp_client
    server:
      transport: streamable-http
      url: ${VIDEO_ANALYSIS_MCP_URL}/mcp
    include:
      - video_analytics.get_incidents
      - video_analytics.get_incident
      - video_analytics.get_fov_histogram
      - video_analytics.get_sensor_ids

  vst_mcp:
    _type: mcp_client
    server:
      transport: streamable-http
      url: ${VST_MCP_URL}/mcp
In 2.4.x, pipelines were statically defined in config.yaml, whereas in 3.0.0 features are exposed as MCP tools. This is a configuration where the agent decides "which tool to use" depending on the situation.
Running the VLM-as-Verifier Pipeline
Up to this point, we covered basic deployment and confirming operation of each component. From here, we'll try running the VLM-as-Verifier pipeline, which is the highlight of the 3.0.0 Warehouse Blueprint.
How Two-Stage Detection Works
Safety monitoring in the Warehouse Blueprint uses a two-stage detection design.
- Rule-based detection (Behavior Analytics): Based on DeepStream object detection results, detects intrusion into or crossing of ROIs (regions of interest) and tripwires. Generates incident candidates based on thresholds.
- VLM visual verification (Alert Bridge → Cosmos-Reason2-8B): For incident candidates, passes the video at the relevant timestamp to a VLM to visually verify "is this really an incident?"
It's a hybrid configuration that uses CV to broadly and quickly narrow down candidates, then uses VLM to verify deeply and accurately.
Metadata detected by Perception at 30fps is passed via Kafka to Behavior Analytics, and sent back to Kafka as incident candidates. Alert Bridge receives them, deduplicates via Redis, retrieves the relevant video from VST, and performs visual verification with the VLM (Cosmos-Reason2-8B). The verification results accumulate in the mdx-vlm-incidents index in Elasticsearch.
Incident Detection Configuration
To generate incidents with Behavior Analytics, you configure ROIs and tripwires in calibration.json. This time we used the official sample calibration and set up a tripwire in the warehouse aisle.
# Configure in the Calibration UI (:8003), or edit the JSON directly
# After configuration, restart Behavior Analytics
docker restart vss-behavior-analytics-2d
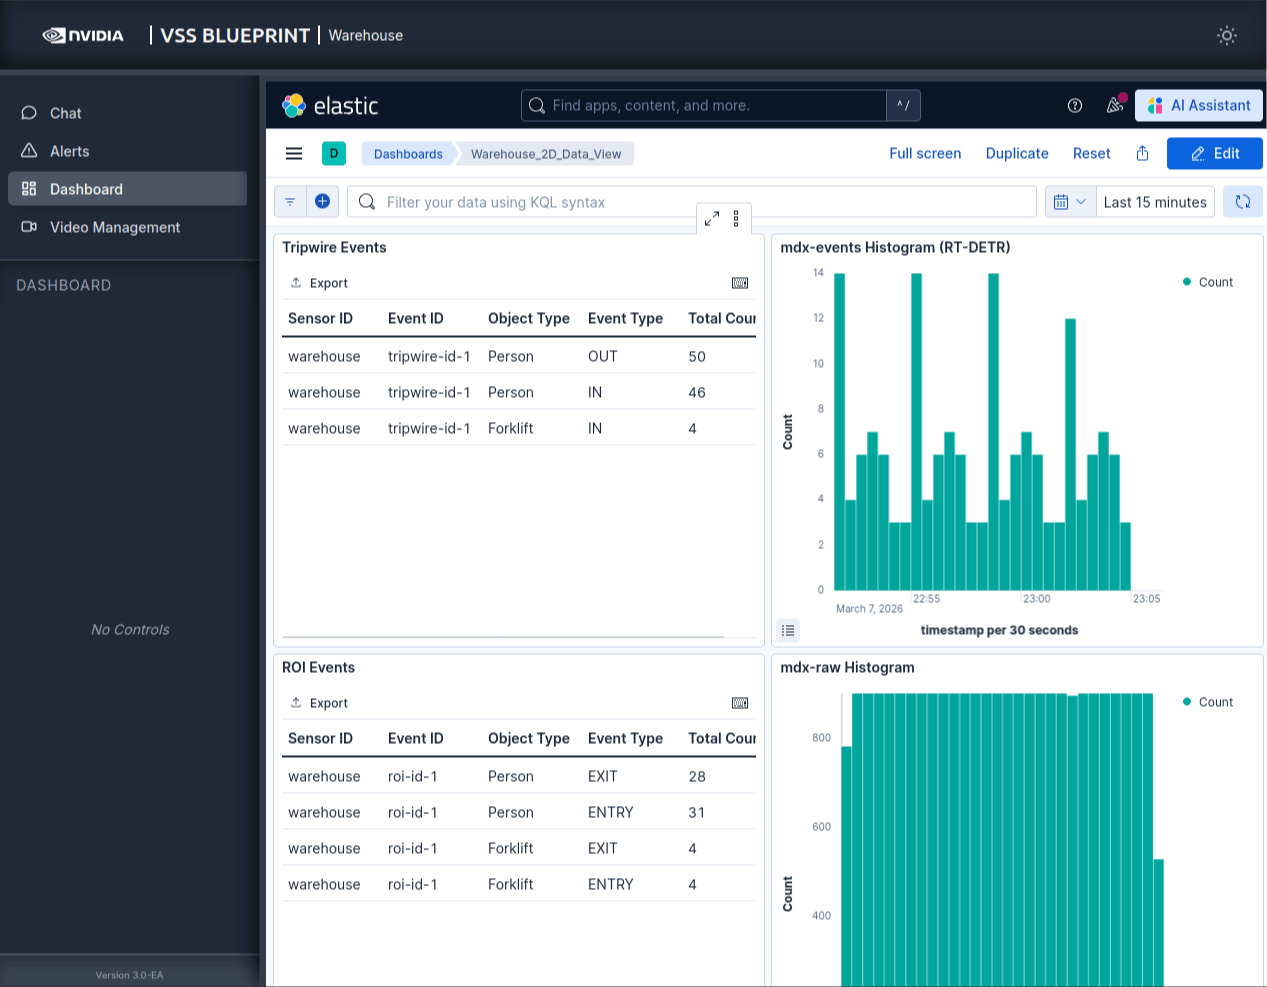
When calibration is applied while the Perception pipeline is running at 30fps, an incident is sent to Kafka every time a Person crosses the tripwire. You can confirm this in real time on the Kibana Dashboard.
Pain Points in the VLM Pipeline
However, even though Behavior Analytics was generating incidents, the VLM analysis results weren't reaching Elasticsearch. This is where the EA-style debugging began. We worked through the causes one by one.
Invalid Stream ID Header in VST
When Alert Bridge retrieves video from VST, there is code that adds a streamId to the HTTP header, but this header was causing VST to return 503.
- headers = {"streamId": stream_id}
- response = await client.get(url, headers=headers)
+ response = await client.get(url)
It seems that streamId, which should be passed as a URL parameter, was being double-sent as a header.
Uninitialized video_url
In Alert Bridge's enhance_alert_with_vlm.py, when the video URL couldn't be retrieved from VST, the video_url variable was passed to subsequent processing while undefined, causing it to crash with an UnboundLocalError.
+ video_url = None
  try:
      video_url = await get_video_from_vst(...)
  except Exception as e:
      logger.error(f"Failed to get video: {e}")
A classic variable scope issue — maybe it was only tested with the happy path?
Misconfigured VLM Endpoint
In Alert Bridge's config.yaml, the VLM endpoint was pointing to an external IP (left as the default value), causing connection timeouts. Also, the model name was still set to the old version cosmos-reason1-7b.
vlm:
  base_url: "http://localhost:30082/v1"  # ← container uses host network
  model: "nvidia/cosmos-reason2-8b"
  num_frames: 5
num_workers was also changed from the default of 10 to 1. In a single-GPU environment, it's more stable to limit the VLM parallelism.
Stream ID Resolution Failure Due to Deleted Sensors
When trying to generate an incident report from VSS Agent, the sensor_list API of VST MCP returned a sensor list containing old sensors with state: "removed", and when the Agent searched by the name "warehouse", it would pick up the stream ID of the deleted sensor.
  for sensor in result:
      if isinstance(sensor, dict) and "sensorId" in sensor:
+         if sensor.get("state") == "removed":
+             continue
          sensor_id = sensor["sensorId"]
          sensor_objects[sensor_id] = sensor
The cause was that sensors deleted when the configuration was changed from 4 cameras to 1 camera kept persisting in the API response.
Additionally, Redis dedup keys (TTL 300 seconds) remained after restart, blocking reprocessing of the same incidents. This was resolved by manually deleting vlm:warehouse:* keys via redis-cli.
VLM Analysis Results
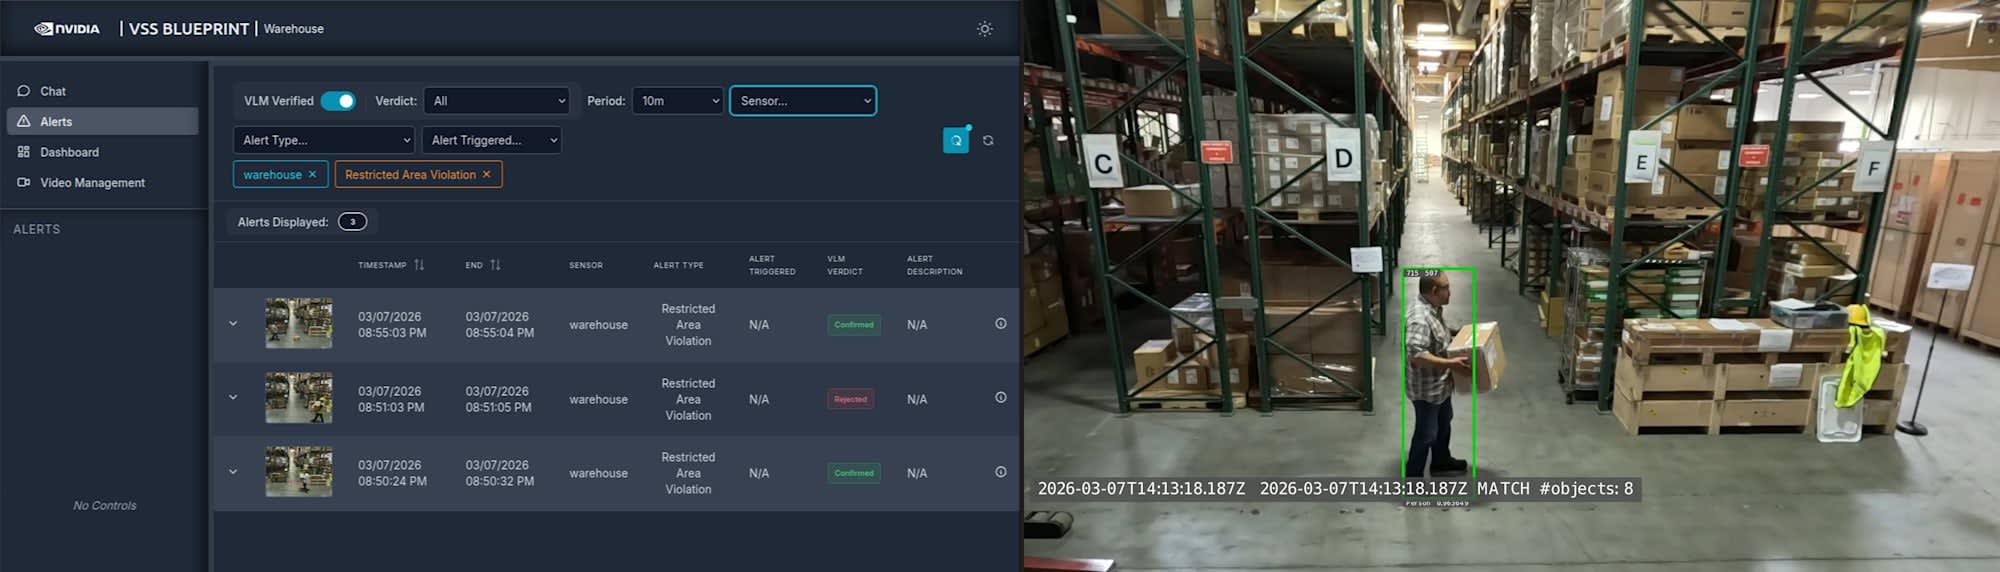
After applying the four patches, the VLM-as-Verifier pipeline started working. Cosmos-Reason2-8B analyzed warehouse video, and results began accumulating in Elasticsearch's mdx-vlm-incidents index.
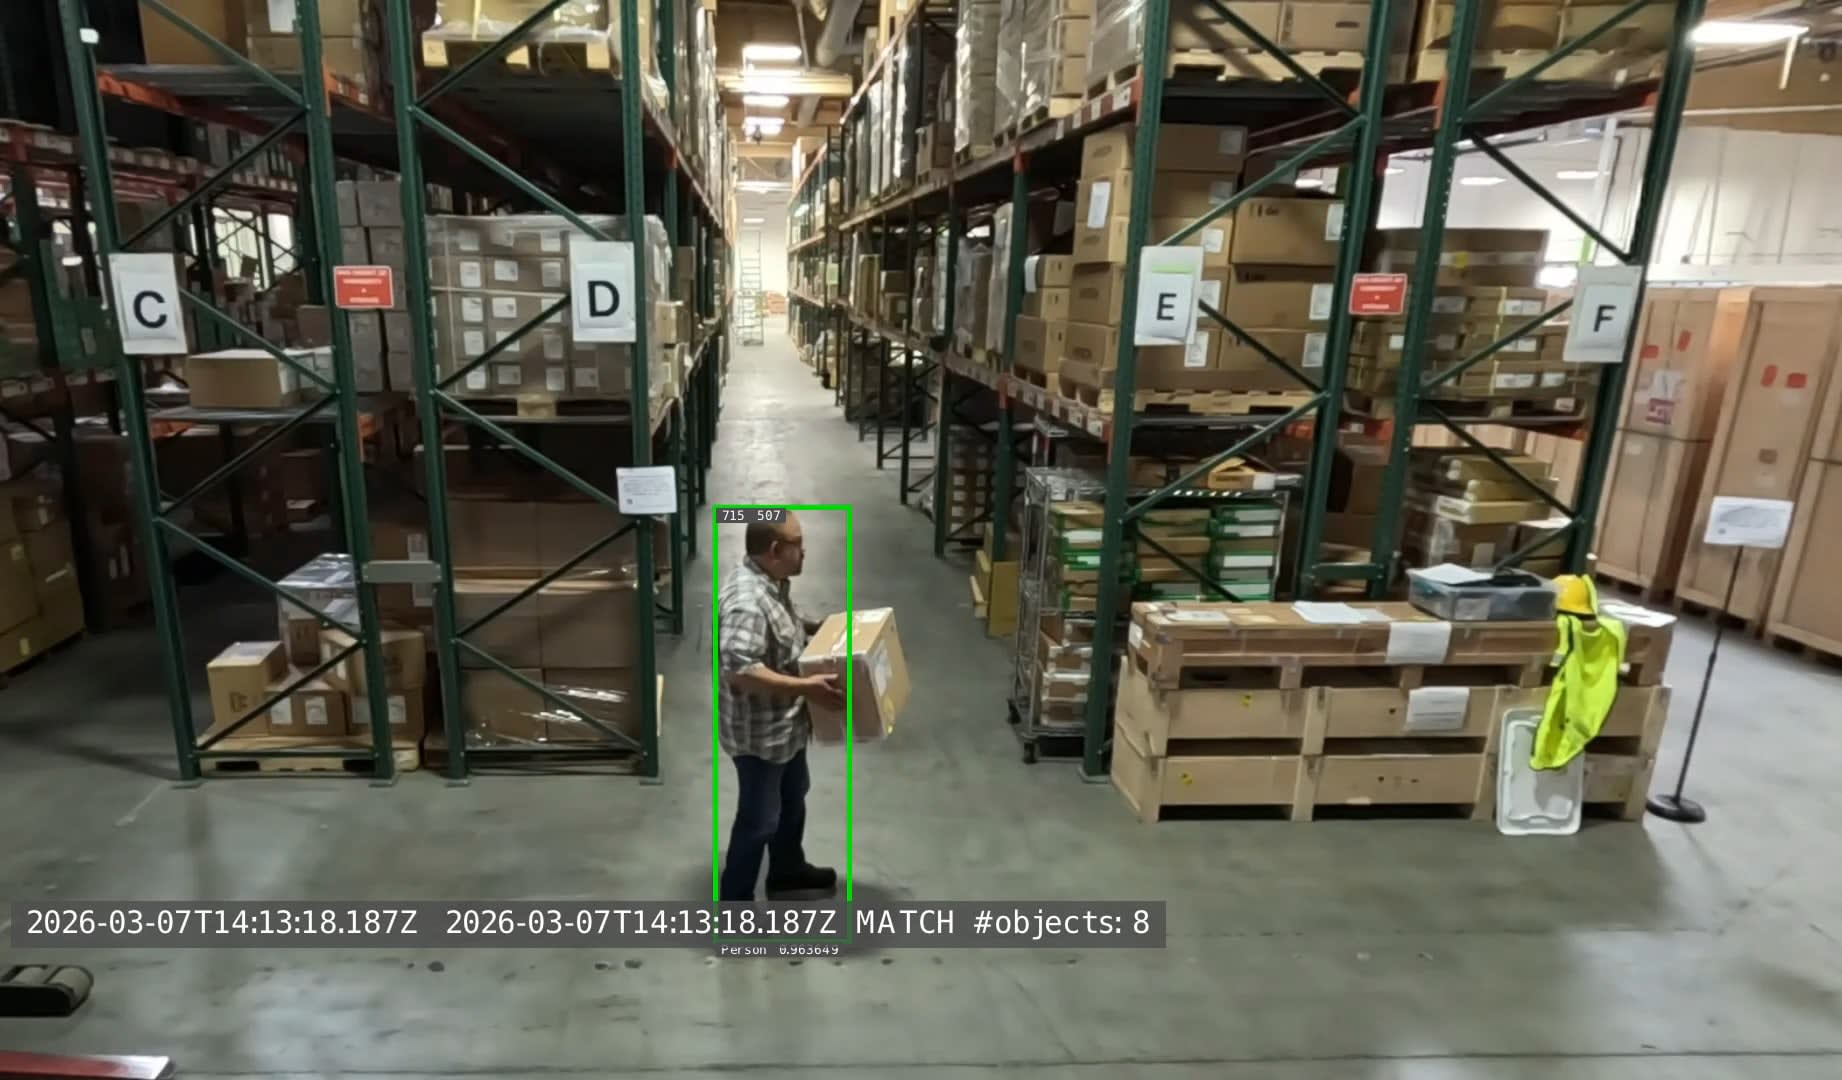
Inference time was approximately 19–30 seconds per incident. It extracts 5 frames, passes them to the VLM, and analyzes PPE (personal protective equipment) and helmet usage, and worker behavior. The VLM even read shelf labels (C–F) and included location information in the report.
Incident Report Generation by Agent
For incidents verified by VLM-as-Verifier, you can generate reports from the VSS Agent Chat UI.
Generate a report for incident <incident_id> with sensor id warehouse.
The Agent internally calls multiple MCP tools to collect detailed information about the incident, snapshots at the relevant timestamp, and video clips, then generates a report.
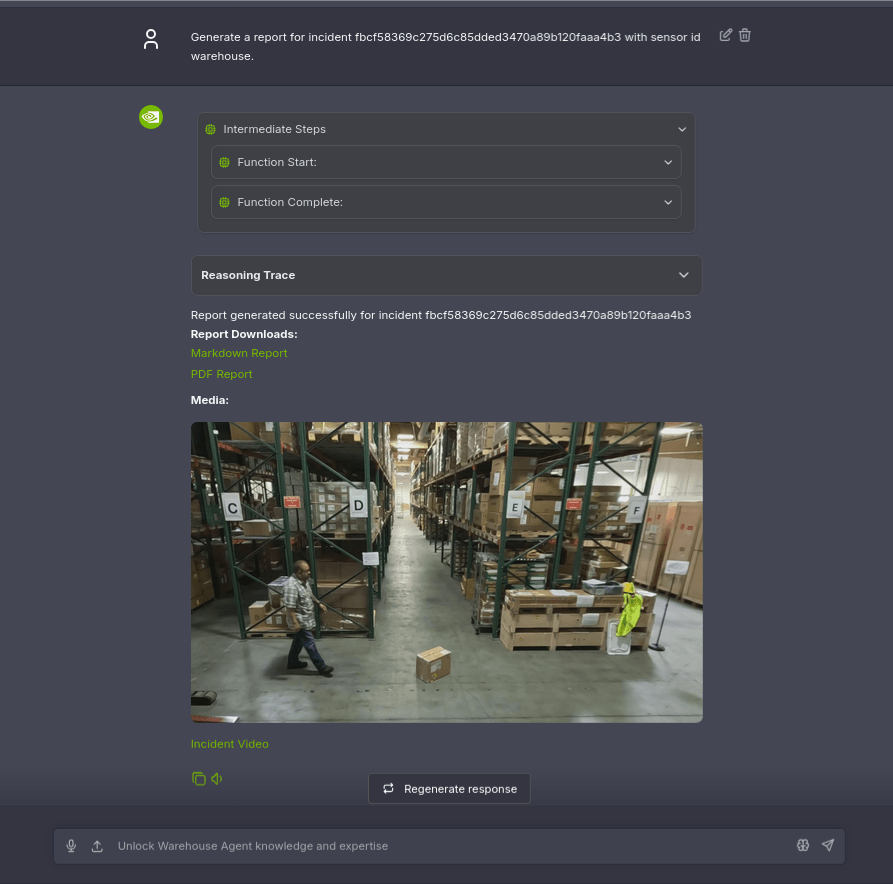
The generated report can be downloaded in Markdown / PDF format and includes links to video snapshots and clips. The VLM determined the incident type as "Box Retrieval" and described in detail the situation of a worker retrieving cardboard boxes near shelf D. It's a structured report that includes even the floor condition (smooth concrete) and lighting conditions (bright artificial lighting).
Excerpt from the Agent-generated report
| Field | Value |
|---|---|
| Type of Incident | Box Retrieval |
| Detailed Description | A worker in a warehouse aisle (between shelves labeled "D" and "E") notices a cardboard box lying on the concrete floor. He retrieves it, carries it to shelf "D," and places it there before exiting the scene. |
| Location Description | Warehouse aisle flanked by tall green metal shelving units labeled alphabetically (C to F). |
| Light Condition | Bright artificial lighting. |
| Floor Condition | Smooth concrete. |
In 2.4.x, vector search over video and natural language Q&A were the main features. In 3.0.0, a safety monitoring workflow of rule-based detection → VLM verification → structured report generation is integrated via MCP, representing evolution in a more practical direction.
Switching to a Japanese LLM
Since we're using NGC vLLM instead of NIM this time, we can switch to any model on HuggingFace just by changing the --model parameter. Taking advantage of this, we tried switching to Nemotron 9B-v2-Japanese, which we also used in V1.
docker run -d --name vllm-nemotron-jp \
  --runtime nvidia --network host --shm-size 16g \
  -e NVIDIA_VISIBLE_DEVICES=0 -e HF_TOKEN=$HF_TOKEN \
  nvcr.io/nvidia/vllm:26.01-py3 \
  python3 -m vllm.entrypoints.openai.api_server \
    --model nvidia/NVIDIA-Nemotron-Nano-9B-v2-Japanese \
    --served-model-name nvidia/nvidia-nemotron-nano-9b-v2 \
    --trust-remote-code \
    --enable-auto-tool-choice --tool-call-parser hermes \
    --chat-template /tmp/nemotron_hermes_template.jinja \
    --gpu-memory-utilization 0.2 --max-model-len 16384 --max-num-seqs 4 \
    --port 30081
By setting --served-model-name to the same name as the default Nemotron, no changes to the VSS Agent configuration are needed.
When we asked in Japanese "please tell me what you can do," the Agent responded entirely in Japanese.
Hello. I am a routing agent that supports incident reporting in warehouse video surveillance systems. I can do the following:
- List sensors/cameras
- Check real-time congestion status
- Capture snapshots
- List incidents
- Generate detailed incident reports
In V1, responses would sometimes revert to English depending on the question, but with the 3.0.0 + vLLM configuration, Japanese is maintained stably.
Generating Incident Reports in Japanese
We tried passing incident data accumulated in Elasticsearch to the Japanese model to generate a report. Since Nemotron 9B-v2-Japanese has a thinking mode, we use /no_think during report generation so the entire response can be used as the report body.
The results were quite practical. When passing incident data for a restricted area violation, the following report is returned:
Incident Summary
On March 8, 2026 at 2:17:56 AM (UTC), a restricted area violation incident occurred in a limited area (Room-1) within the warehouse facility. Detected by sensor "warehouse," it was confirmed that object ID "329" had entered the ROI.Recommended Actions
- Promptly share the relevant video with stakeholders and investigate to identify the intruder and their motives.
- Consider expanding the monitoring coverage of the restricted area and installing additional cameras to eliminate blind spots.
- It is recommended to strengthen the automated access permission check function and introduce a system that detects and warns in real time when someone approaches an unauthorized area.
UTC to JST conversion, and classification into immediate response, medium-to-long-term measures, and legal response were all output in Japanese. For a 9B parameter model, this quality seems sufficient for a simple on-site report.
However, in this verification, 42 microservices and vLLM are all coexisting on a single DGX Spark, so resources are always stretched thin. It sometimes takes several minutes for the Agent Chat UI to return a response, and service-to-service timeouts can occur during tool calls.
Since there's no issue with the LLM's report generation capability on its own, this is more a constraint of the environment where everything is on one machine rather than the model's limitations. If the LLM and VLM could be distributed to separate nodes, stable operation in a Japanese environment should be achievable.
Points to Note for EA
Here is a summary of the EA-stage constraints we noticed from actually running it.
Since DGX Spark operates on a single GPU (GB10), the LLM and VLM share the same GPU in local_shared mode. Memory management is tight, and as with 2.4.x, techniques to reduce LLM memory consumption via Ollama may be effective.
It's worth noting that Cosmos-Embed1 (video + text integrated Embedding), a new feature in 3.0.0, was trained on English only, and search performance with Japanese text is likely to degrade. The maximum token count for text is also relatively short at 128. The search profile that uses vector search with this Cosmos-Embed1 is also in Alpha state, and in the current Warehouse Blueprint (bp_wh), CV-based event detection by Behavior Analytics is used by default.
The config.yaml and REST API from 2.4.x are not compatible with 3.0.0, and no migration guide is available at this time. It is not possible to migrate an environment built on 2.4.x as-is. As for DGX Spark-specific issues, as mentioned earlier, the LLM NIM ARM64 image not working was a deployment blocker. We were able to substitute with NGC vLLM + custom template, but including manual placement of Perception models, some hands-on work is to be expected at the EA stage.
There are also some known issues listed in the official release notes. The VA-MCP initialization delay is caused by unauthenticated requests to HuggingFace returning HTTP 429 (Rate Limit), which can be resolved by setting HF_TOKEN in .env. Snapshot timestamps may also have slight discrepancies due to implementation limitations in frame extraction, which is reportedly scheduled to be fixed in the next release.
Summary
We ran VSS 3.0.0 EA on DGX Spark.
The "inflexibility due to monolithic design" that we felt in 2.4.x is being resolved through microservice architecture and MCP-based orchestration. A configuration of 42 services working together may look complex at first glance, but the design allowing you to select only needed functionality via compose profiles is a good direction.
There were also some EA-stage pain points. The LLM NIM ARM64 image was broken, Perception models weren't included in the package, and Alert Bridge had code bugs in 4 places. However, by finding workarounds for each — LLM substitution with NGC vLLM + custom template, manual model placement from NGC, and patching Alert Bridge — we were able to get the full video AI pipeline running on a single DGX Spark.
Personally, the most rewarding part was the VLM-as-Verifier pipeline. The two-stage configuration of using CV to quickly narrow down incident candidates and then having the VLM visually verify the video feels highly practical as an approach to reducing false positives while enabling deep analysis. The fact that everything ran end-to-end including Agent report generation gave a strong impression of completeness.
On the other hand, the limits of running everything on a single DGX Spark also became apparent. In an environment where 42 services + LLM + VLM coexist, both GPU memory and CPU are constantly under heavy load, with Agent chat responses sometimes taking several minutes and service-to-service communication timeouts occurring.
However, this is also the flip side of the 3.0.0 microservice architecture working well. While distributed deployment was difficult with the monolithic architecture of 2.4.x, in 3.0.0 you can resolve bottlenecks simply by moving the LLM or VLM to separate nodes. I feel that with load distributed across multiple machines, it would come quite close to being ready for production use.