I tried building everything from GCP budget alert configuration to BigQuery billing export and Data Portal integration using OpenTofu

This page has been translated by machine translation. View original
Introduction
Have you ever felt uneasy while operating a GCP project, wondering "How much am I spending this month?" or "Would I even notice if costs suddenly spiked?"
The Cloud Console billing reports are convenient, but needs arose for notifications when thresholds are exceeded and for visualizing costs alongside other dashboards in Data Portal.
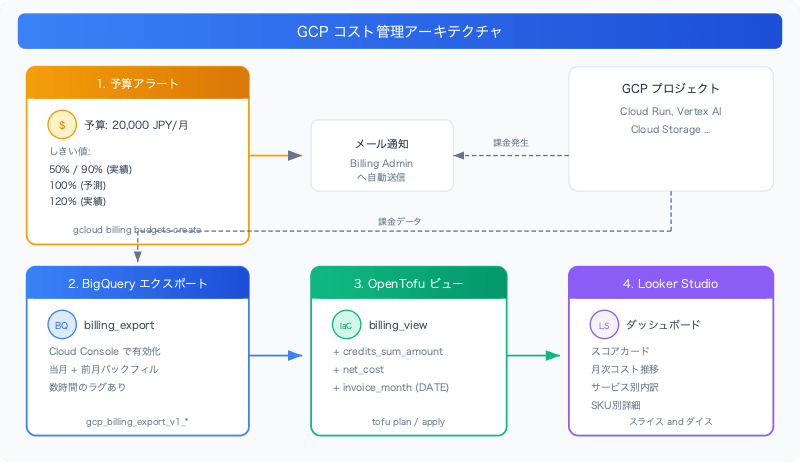
In this article, I actually tried the following three things:
- Setting up budget alerts with the gcloud CLI (including threshold design)
- Enabling billing data export to BigQuery
- Creating a BigQuery view with OpenTofu and using it as a data source for Data Portal
Prerequisites & Environment
- GCP project: Already created
- gcloud CLI: Installed and authenticated
- OpenTofu: v1.12 (installed with
brew install opentofu) - Billing account: Organization-managed (Billing Account ID required)
Setting Up Budget Alerts
Checking the Billing Account ID
A Billing Account ID is required to create a budget. You can find it in Cloud Console under Billing → Account Management.
To check via CLI, use the following command (requires Billing Account Viewer permissions or higher):
gcloud billing accounts list
If you don't have the necessary permissions, check via the Console or contact your organization administrator.
Enabling the Billing Budget API
The Cloud Billing Budget API is required to create budgets.
gcloud services enable billingbudgets.googleapis.com --project=YOUR_PROJECT_ID
Threshold Design
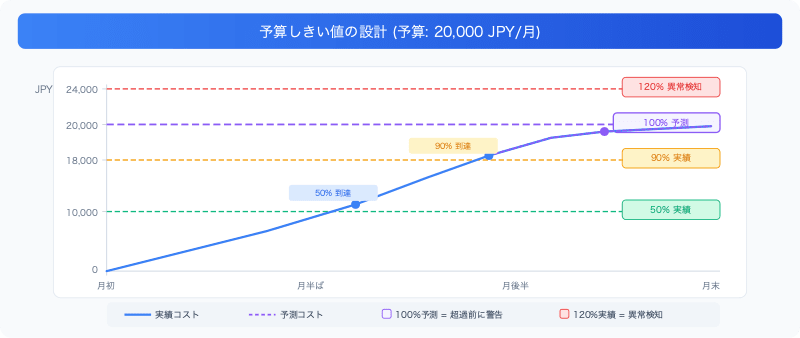
The budget alert thresholds were designed as follows:
| Threshold | Type | Approximate Amount | Purpose |
|---|---|---|---|
| 50% | Actual spend | ¥10,000 | Mid-month sanity check |
| 90% | Actual spend | ¥18,000 | Approaching budget limit |
| 100% | Forecasted spend | ¥20,000 | Early warning for end-of-month overage |
| 120% | Actual spend | ¥24,000 | Anomaly detection |
The key point is setting 100% to forecasted spend (forecasted-spend). With actual spend, you get notified after exceeding the budget, but with forecasted spend, you get a warning mid-month saying "at this rate, you're likely to exceed it."
Creating the Budget
gcloud billing budgets create \
  --billing-account="YOUR_BILLING_ACCOUNT_ID" \
  --display-name="your-project monthly" \
  --budget-amount=20000JPY \
  --filter-projects="projects/YOUR_PROJECT_ID" \
  --threshold-rule=percent=0.5,basis=current-spend \
  --threshold-rule=percent=0.9,basis=current-spend \
  --threshold-rule=percent=1.0,basis=forecasted-spend \
  --threshold-rule=percent=1.2,basis=current-spend
It is recommended to set the budget amount to approximately 3–4 times your current costs. In this case, I set it to ¥20,000 against a monthly spend of around ¥5,000. If set too low, alerts fire frequently and tend to get ignored; if set too high, anomalies go undetected.
Notes:
- Budget alerts are notifications only and will not automatically stop resources
- Billing data has a lag of several hours, making it unsuitable for real-time monitoring
- If automatic shutoff is needed, it can be handled with Pub/Sub + Cloud Functions
Exporting Billing Data to BigQuery
Why Export Is Necessary
The Cloud Console billing reports provide sufficient information, but exporting to BigQuery offers the following advantages:
- Visualization in Data Portal: Can be integrated with other operational dashboards
- Analysis with SQL: Freely aggregate by SKU, day, region, and more
- Long-term retention: Console reports have a limited time range, but BigQuery lets you retain data as long as you want
Creating the Export Dataset
bq mk --dataset --location=US YOUR_PROJECT_ID:billing_export
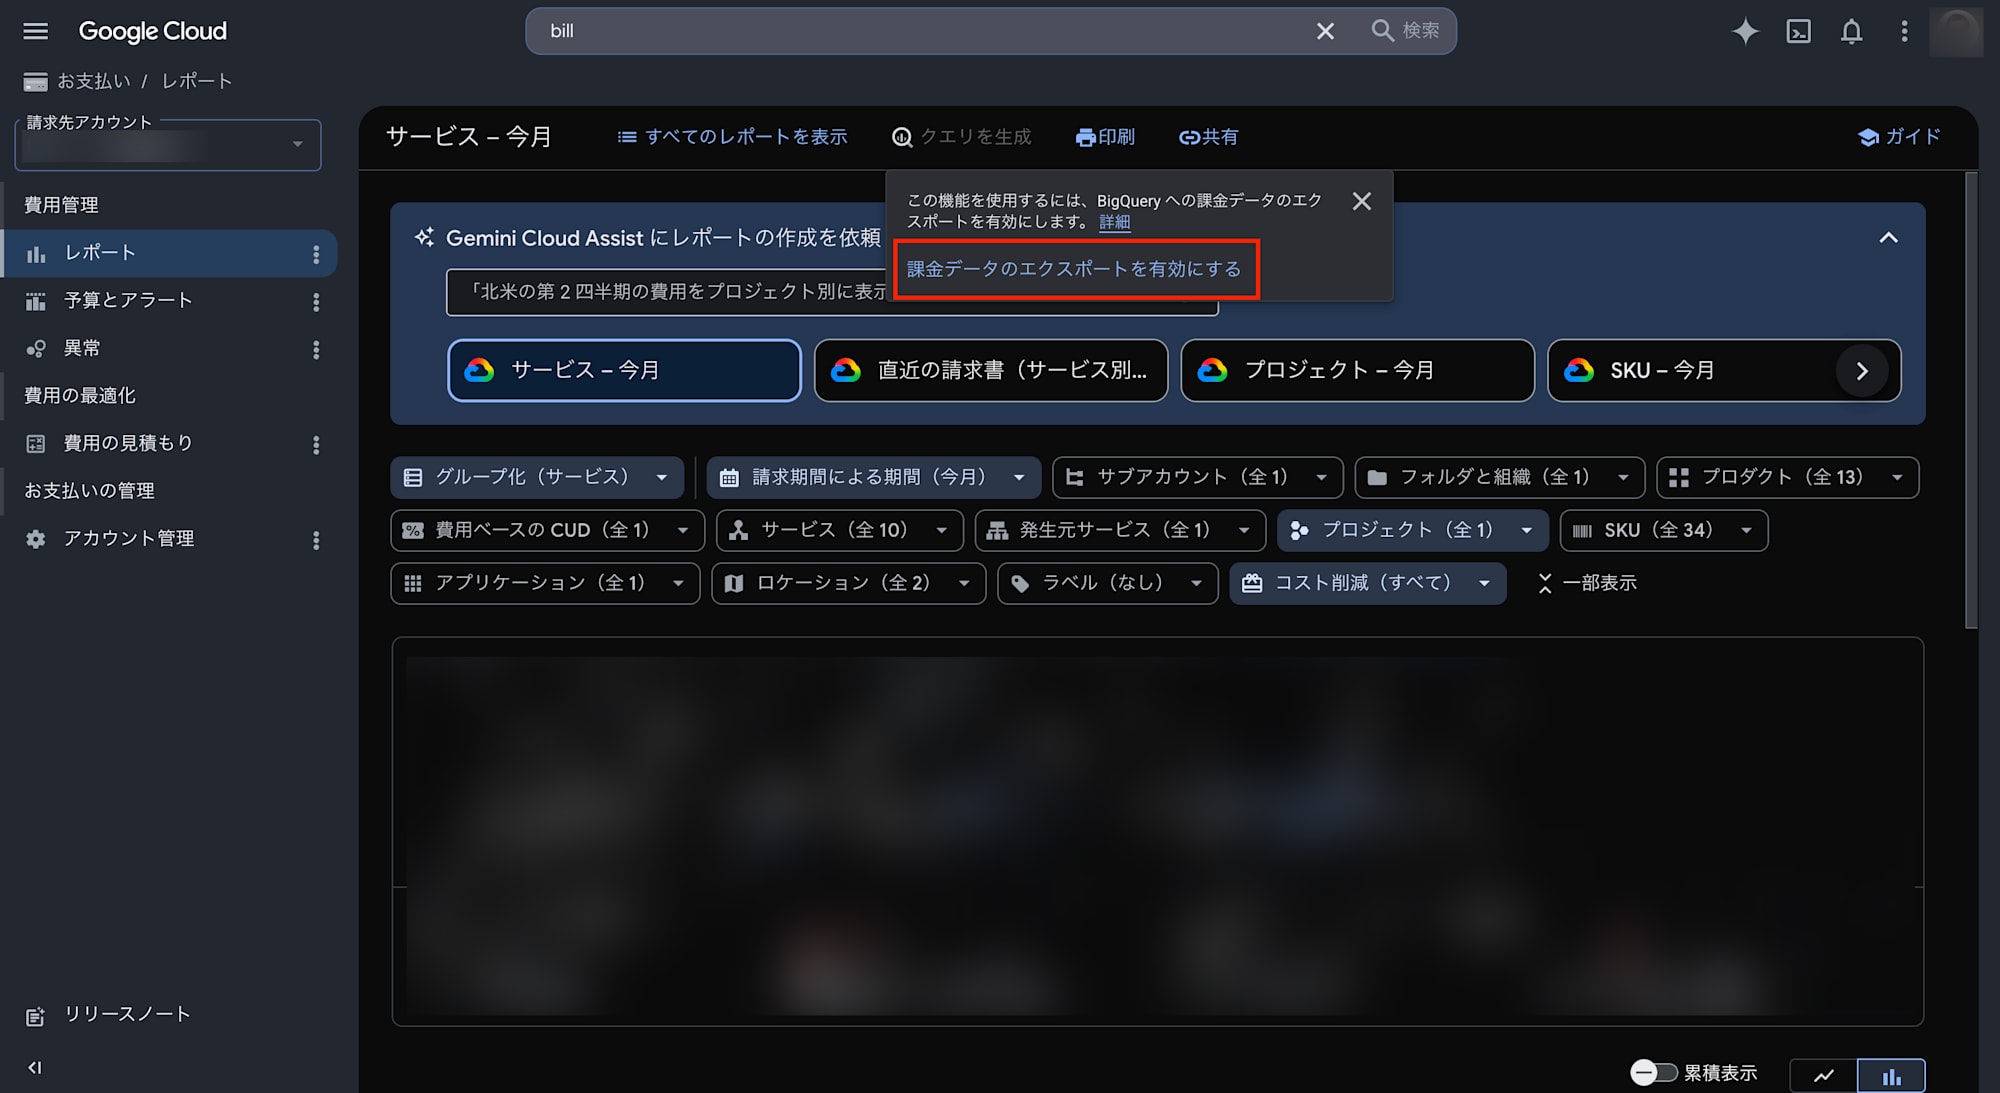
Enabling the Export
This step is done from the Cloud Console (no CLI command is provided). Billing Account Administrator permissions are also required.
- Cloud Console → Billing → Reports → Billing data export
- Edit the settings for "Standard usage cost"
- Select your project and dataset (
billing_export) and save
Confirming Data Arrival
Once you enable the export, the current month's and previous month's data will be backfilled (this may take up to 5 days).
bq ls YOUR_PROJECT_ID:billing_export
The table name will be created in a format like gcp_billing_export_v1_XXXXXX_XXXXXX_XXXXXXX.
Once the data arrives, let's verify it with a simple query.
SELECT
  invoice.month AS month,
  service.description AS service,
  ROUND(SUM(cost), 0) AS total_cost_jpy
FROM `YOUR_PROJECT_ID.billing_export.gcp_billing_export_v1_XXXXXX_XXXXXX_XXXXXXX`
GROUP BY 1, 2
HAVING total_cost_jpy != 0
ORDER BY 1 DESC, 3 DESC
Creating a BigQuery View with OpenTofu
Why Manage Views with IaC
When visualizing billing data in Data Portal, you could use the raw export table directly, but inserting a view provides the following benefits:
- Calculate
net_costaccounting for credits (free trial, SUD discounts, etc.) - Parse
invoice_monthas a DATE type to simplify time-series charts in Data Portal - Limit the reference period to reduce scan costs from unnecessary historical data
Google's official terraform-google-billing-dashboard module adopts a similar approach.
Approach: Flat View vs. Pre-aggregation
Initially, I tried to create multiple pre-aggregated views for different purposes, such as monthly totals by service and daily trends. However, after referencing the official Google template, I found that a single flat view with added calculated fields, leaving aggregation to the Data Portal side, is a better approach.
| Approach | Advantages | Disadvantages |
|---|---|---|
| Pre-aggregation (multiple views) | Lighter queries | Less flexibility in Data Portal |
| Flat view (single) | Freely slice & dice in Data Portal | Query volume increases slightly |
Since Data Portal lets you freely change dimensions and metrics with drag and drop, the flat view is overwhelmingly easier to work with.
Terraform Configuration
OpenTofu uses the same HCL syntax as Terraform, so terraform blocks and provider definitions can be reused as-is. Simply run tofu init / tofu plan / tofu apply.
terraform {
  required_version = ">= 1.5"

  required_providers {
    google = {
      source  = "hashicorp/google"
      version = "~> 6.0"
    }
  }
}

provider "google" {
  project = var.project_id
}

resource "google_bigquery_dataset" "billing_dashboard" {
  dataset_id = var.dataset_id
  project    = var.project_id
  location   = var.location

  labels = {
    purpose = "billing-dashboard"
  }
}

resource "google_bigquery_table" "billing_view" {
  dataset_id = google_bigquery_dataset.billing_dashboard.dataset_id
  table_id   = "billing_view"
  project    = var.project_id

  view {
    use_legacy_sql = false
    query          = <<-SQL
      SELECT
        *,
        COALESCE((SELECT SUM(c.amount) FROM UNNEST(credits) c), 0) AS credits_sum_amount,
        cost + COALESCE((SELECT SUM(c.amount) FROM UNNEST(credits) c), 0) AS net_cost,
        PARSE_DATE('%Y%m', invoice.month) AS invoice_month
      FROM `${var.billing_export_table}`
      WHERE _PARTITIONDATE > DATE_SUB(CURRENT_DATE(), INTERVAL ${var.lookback_months} MONTH)
        -- The billing export contains data from all projects under the billing account, so filter to the target project only
        AND project.id = '${var.project_id}'
    SQL
  }

  deletion_protection = false
}
variable "project_id" {
  description = "GCP project ID"
  type        = string
  default     = "YOUR_PROJECT_ID"

  validation {
    condition     = can(regex("^[a-z][a-z0-9-]{4,28}[a-z0-9]$", var.project_id))
    error_message = "project_id must be a valid GCP project ID (6-30 chars, lowercase, digits, hyphens)."
  }
}

variable "billing_export_table" {
  description = "Fully qualified billing export table ID"
  type        = string
  default     = "YOUR_PROJECT_ID.billing_export.gcp_billing_export_v1_XXXXXX_XXXXXX_XXXXXXX"
}

variable "dataset_id" {
  description = "BigQuery dataset for billing dashboard views"
  type        = string
  default     = "billing_dashboard"
}

variable "location" {
  description = "BigQuery dataset location"
  type        = string
  default     = "US"
}

variable "lookback_months" {
  description = "Number of months of billing data to include"
  type        = number
  default     = 12
}
Key Points of the View
credits_sum_amount: Total amount of GCP credits (free trial, SUD discounts, etc.)net_cost: Actual cost after credits are applied. Use this in dashboardsinvoice_month: Parses theYYYYMMstring to a DATE type so it can be used on the time-series axis in Data Portallookback_months: Suppresses unnecessary data scans with partition pruningproject.idfilter: The billing export table contains data for all projects under the billing account, so without filtering byproject.id, costs from other projects will be mixed in. Filtering withvar.project_idlimits to the target project only
.gitignore Configuration
Add the following to .gitignore to avoid including Terraform-generated files in your repository.
# OpenTofu / Terraform
**/.terraform/
*.tfstate
*.tfstate.backup
*.tfplan
Please commit .tf files (source code) and .terraform.lock.hcl (provider version lock). Since tfstate contains information such as resource IDs, it is a golden rule not to include it in the repository.
Deployment
cd infra/billing-dashboard
tofu init
tofu plan
tofu apply
Review the resources to be created with tofu plan before running tofu apply.
Plan: 2 to add, 0 to change, 0 to destroy.

Outputs:
  dataset_id = "billing_dashboard"
  view_id    = "billing_view"
Using in Data Portal
Once the view is created, add it as a new data source to an existing Data Portal report.
- Open the report in Data Portal
- Resource → Manage added data sources → Add a data source
- Select BigQuery → Project →
billing_dashboard→billing_view - Add a new page and create charts
Recommended chart configuration:
| Chart Type | Dimension | Metric | Purpose |
|---|---|---|---|
| Scorecard | — | net_cost (SUM) |
Current month total cost |
| Time series chart | invoice_month |
net_cost (SUM) |
Monthly cost trend |
| Bar/Pie chart | service.description |
net_cost (SUM) |
Breakdown by service |
| Table | sku.description |
net_cost (SUM) |
SKU-level details |
Summary
I built GCP cost management in three stages.
- Budget alerts: Set a ¥20,000/month budget with the gcloud CLI. Notifications at four levels: 50% / 90% / 100% (forecasted) / 120%
- Billing data export: Exported to BigQuery, enabling free analysis with SQL
- View management with OpenTofu: Referencing the official Google template, added
net_costandinvoice_monthto a flat view. Configured for free slicing and dicing in Data Portal
Keep in mind these two points: budget alerts are notifications only with no automatic shutoff, and billing data has a lag of several hours. If automatic shutoff is needed, additional construction with Pub/Sub + Cloud Functions is required.
Cost management tends to be put off, but by managing it with IaC, you can roll out the same configuration across additional projects as they grow. Why not start by setting up budget alerts?