
I presented at DevelopersIO 2025 Osaka with the title "Developing Dashboards with Generative AI Using Grafana's Git Sync Feature"! #devio2025

Introduction
I gave a presentation titled "Developing dashboards with Grafana's Git Sync feature together with generative AI" at DevelopersIO 2025 Osaka held on Wednesday, September 3, 2025!
Presentation Materials
Key Points
Why I chose this theme
First, why did I choose this theme?
I chose this theme because I was wondering if I could combine Claude Code and Grafana, which I use regularly in my work, to operate Grafana dashboards with natural language. It seemed feasible.
Some challenges I feel when working with Grafana are:
- Different query languages for each data source
- Too many Grafana options, making it difficult to know which features to use to create desired dashboards
- Wanting to reduce dashboard construction time
And so on.
In this presentation, I tried to solve these issues using Claude Code.
What is needed?
So, what do we need to operate Grafana with Claude Code?
While there are various elements, I narrowed it down to three:
- Converting dashboards to code
- Transferring code between remote and local environments
- Reflecting remote code changes in dashboards
Code conversion is clear, as Grafana automatically creates code (JSON) for dashboards as a standard feature.
Next, to achieve code management between local and remote environments, I first tried the Grafana API.
I've written a blog about this before, so please check it out if you're interested.
While the Grafana API somewhat achieved what I wanted to do, it required some workarounds, especially for version control.
Grafana Git Sync
This is where I found Grafana Git Sync.
I've also written a blog about the Git Sync feature in the past, so please check that out if you're interested.
Simply put, Git Sync is a feature that synchronizes JSON files defining Grafana dashboards with GitHub.
Using this, you can (almost) synchronously reflect JSON files uploaded from local environments to Grafana dashboards.### Input to Claude Code
While I understand that we can manage code with the Git Sync feature, what's crucial is the input when editing JSON files in Claude Code.
Simply saying "create a nice dashboard" might generate something that looks like a dashboard, but it won't create a usable dashboard.
To get a better dashboard output, I think it's important to provide input that explains what you want to achieve, your purpose, and usage scenarios.
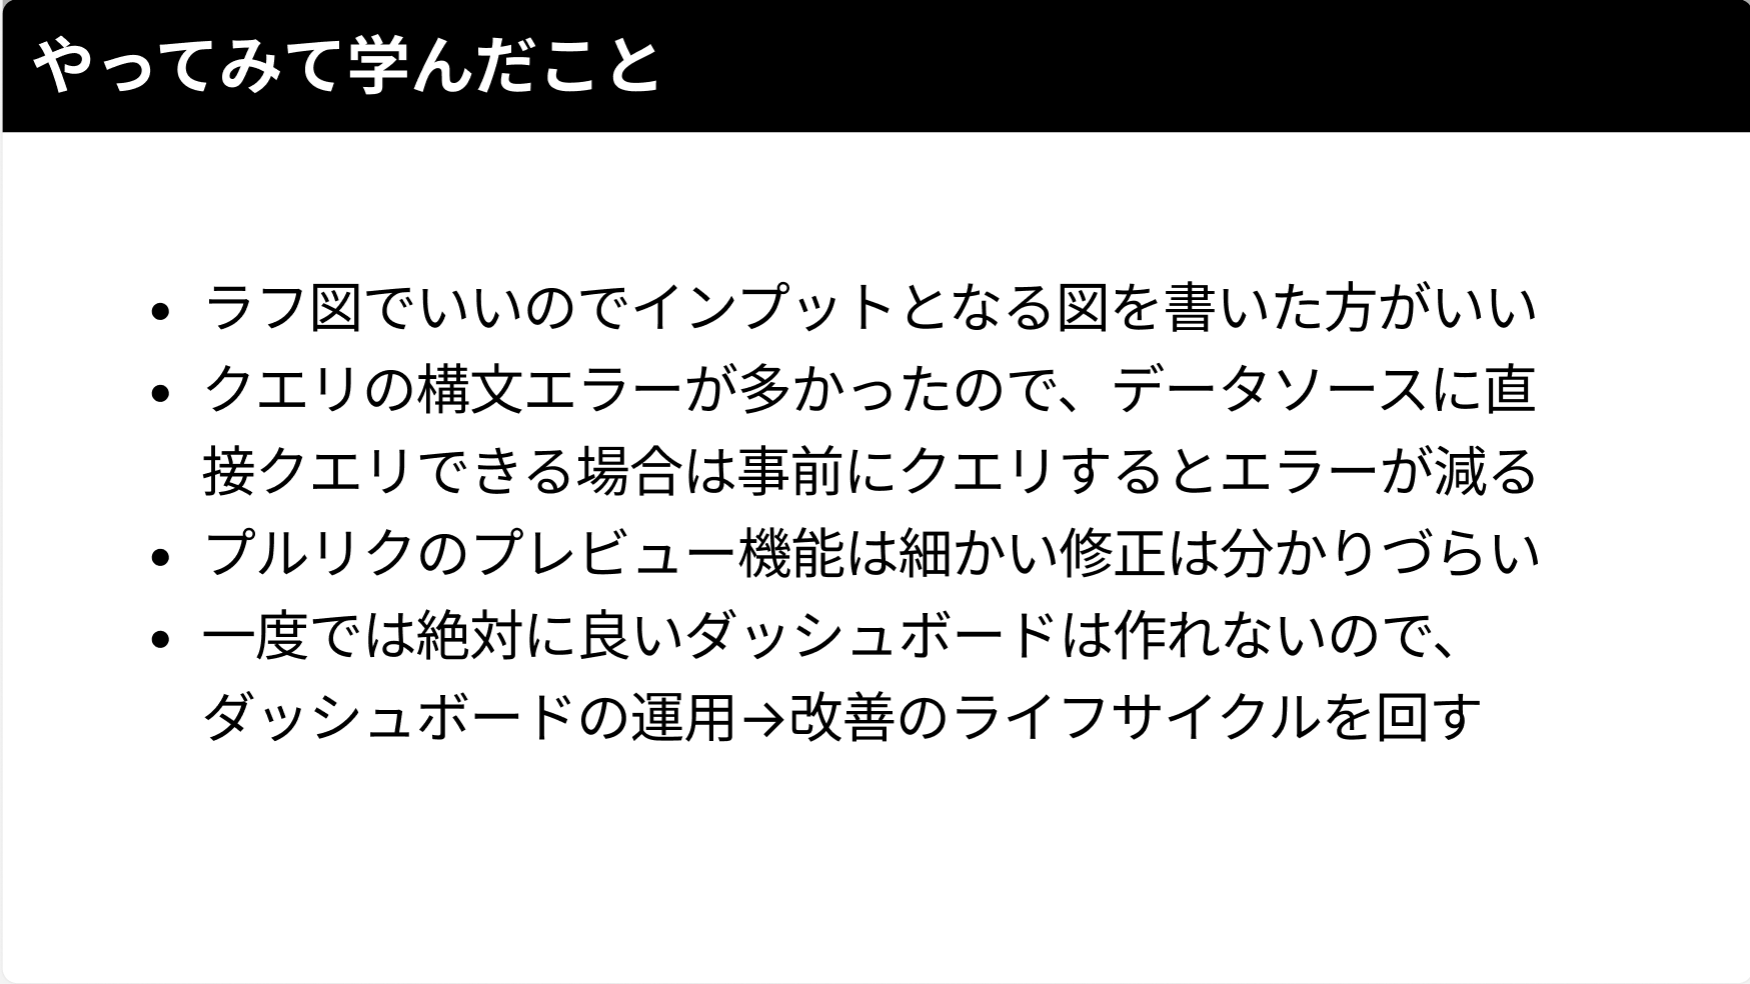
The easiest way to accomplish this is by creating a rough sketch of the dashboard in Figma and providing it.
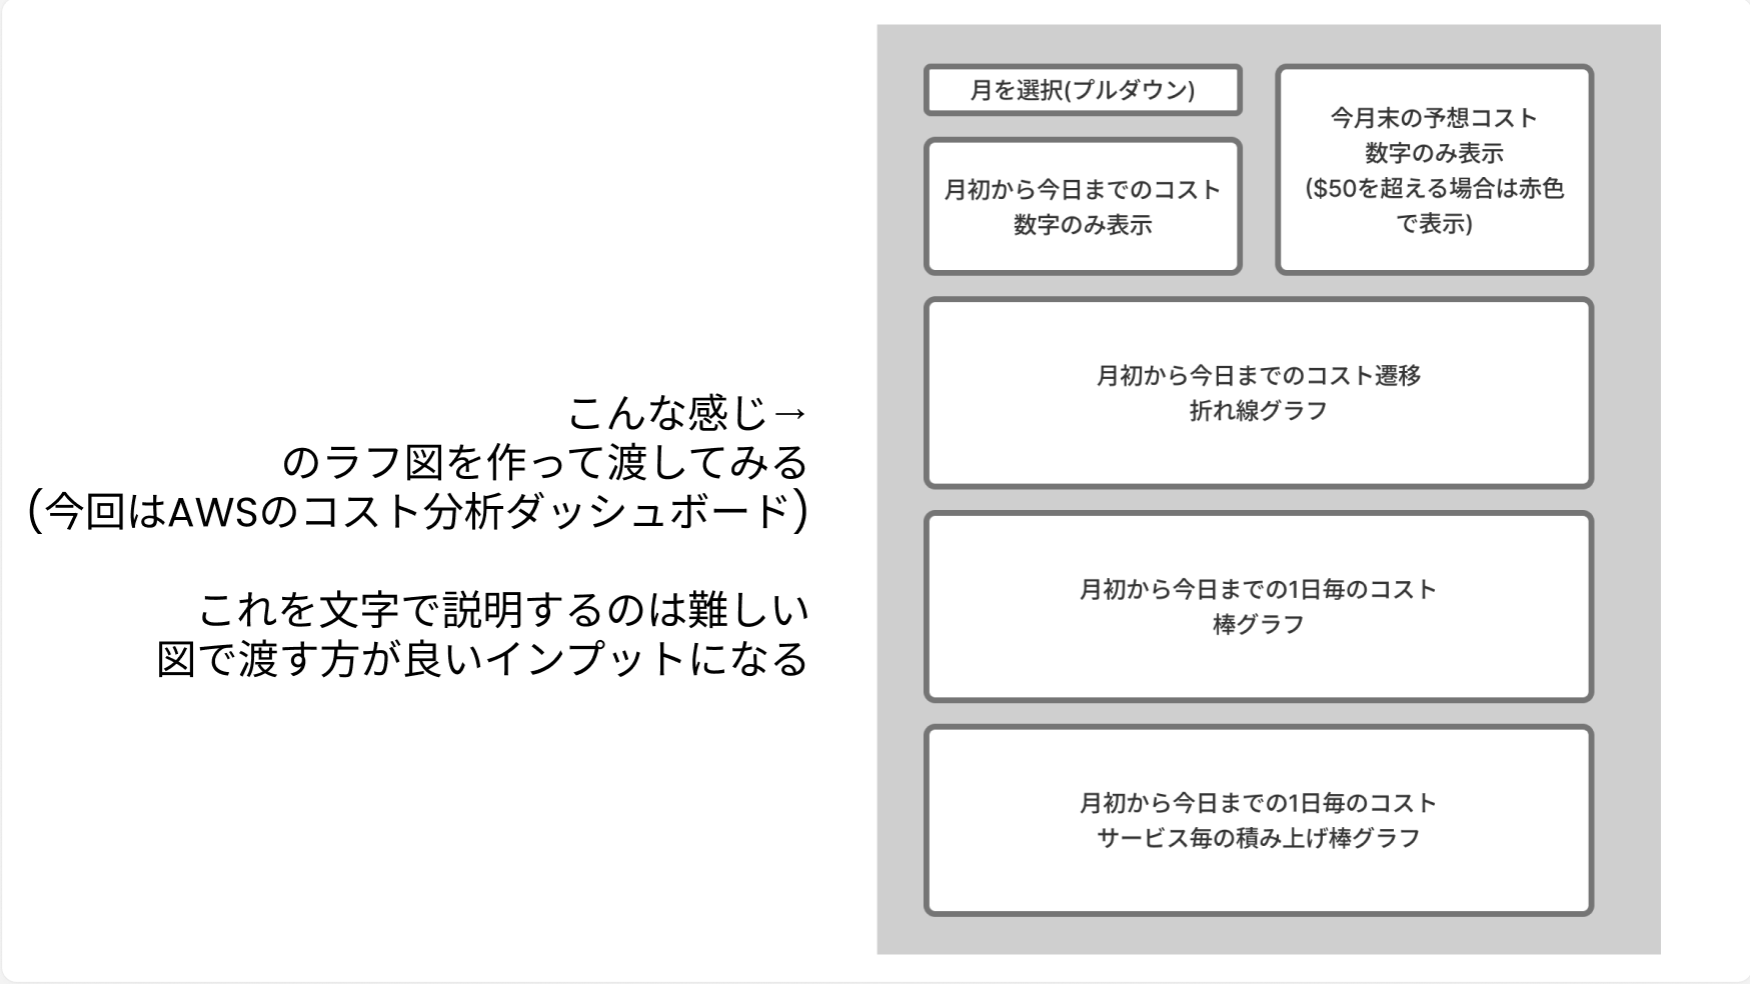
Since it's difficult to convey dashboard requirements as text input, using a diagram makes it easier to communicate the placement of each panel.
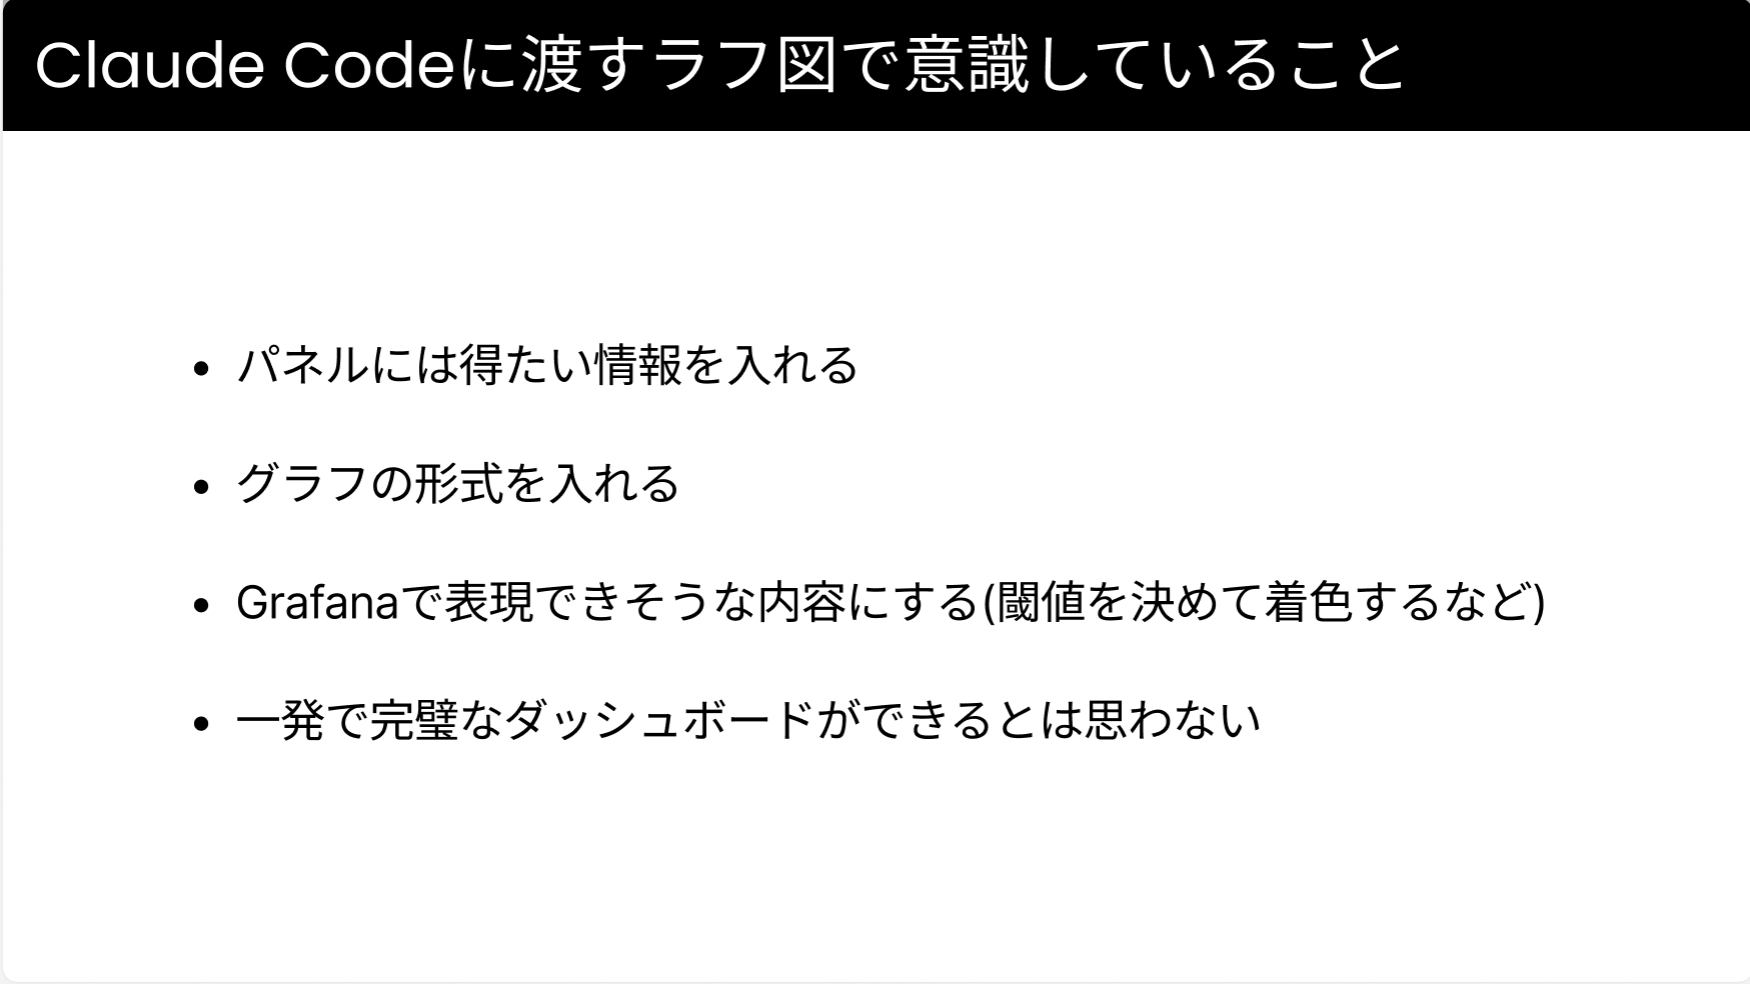
Also, when creating rough sketches, I pay attention to the following:
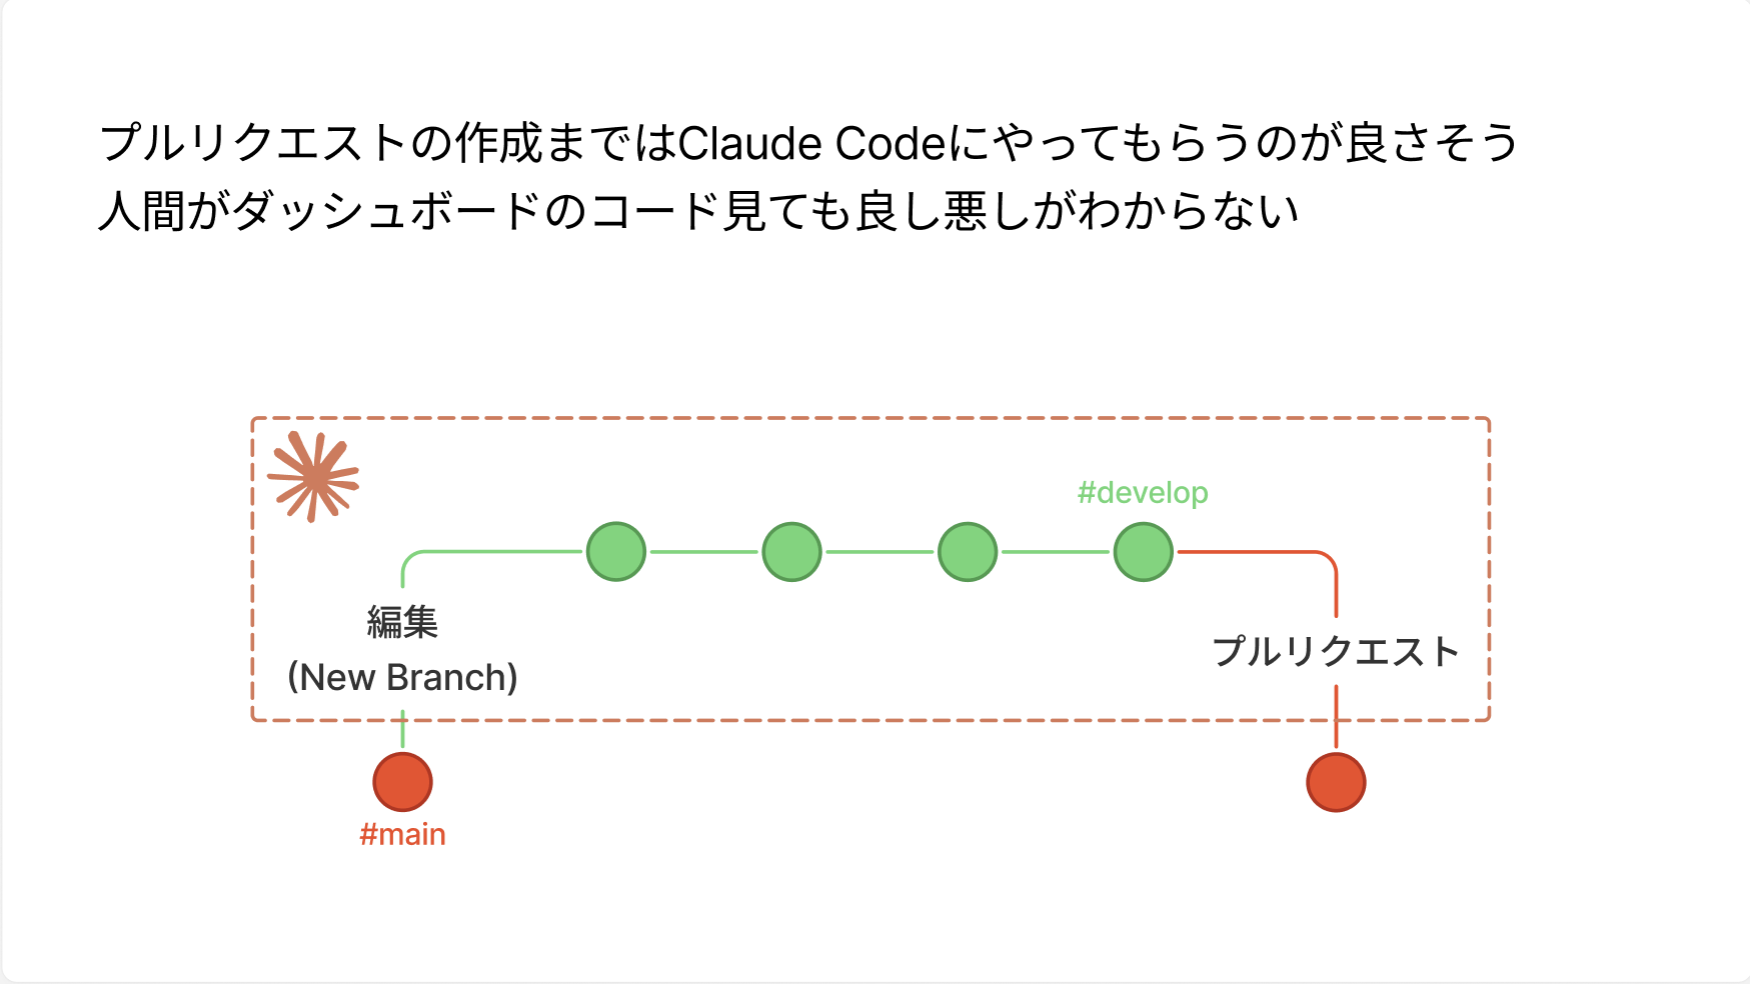
The easiest approach is to have Claude Code create a new branch and submit a pull request with the output generated from the rough sketch.
I think it's difficult for humans to understand dashboard code just by looking at it.
However, this way we can't see the changes until we merge and apply them to the dashboard.
That defeats the purpose of creating a pull request.
This is where Git Sync has a useful "pull request preview" feature.
It's a bit hard to understand, but as shown in the image below, you can include before and after images in the pull request.
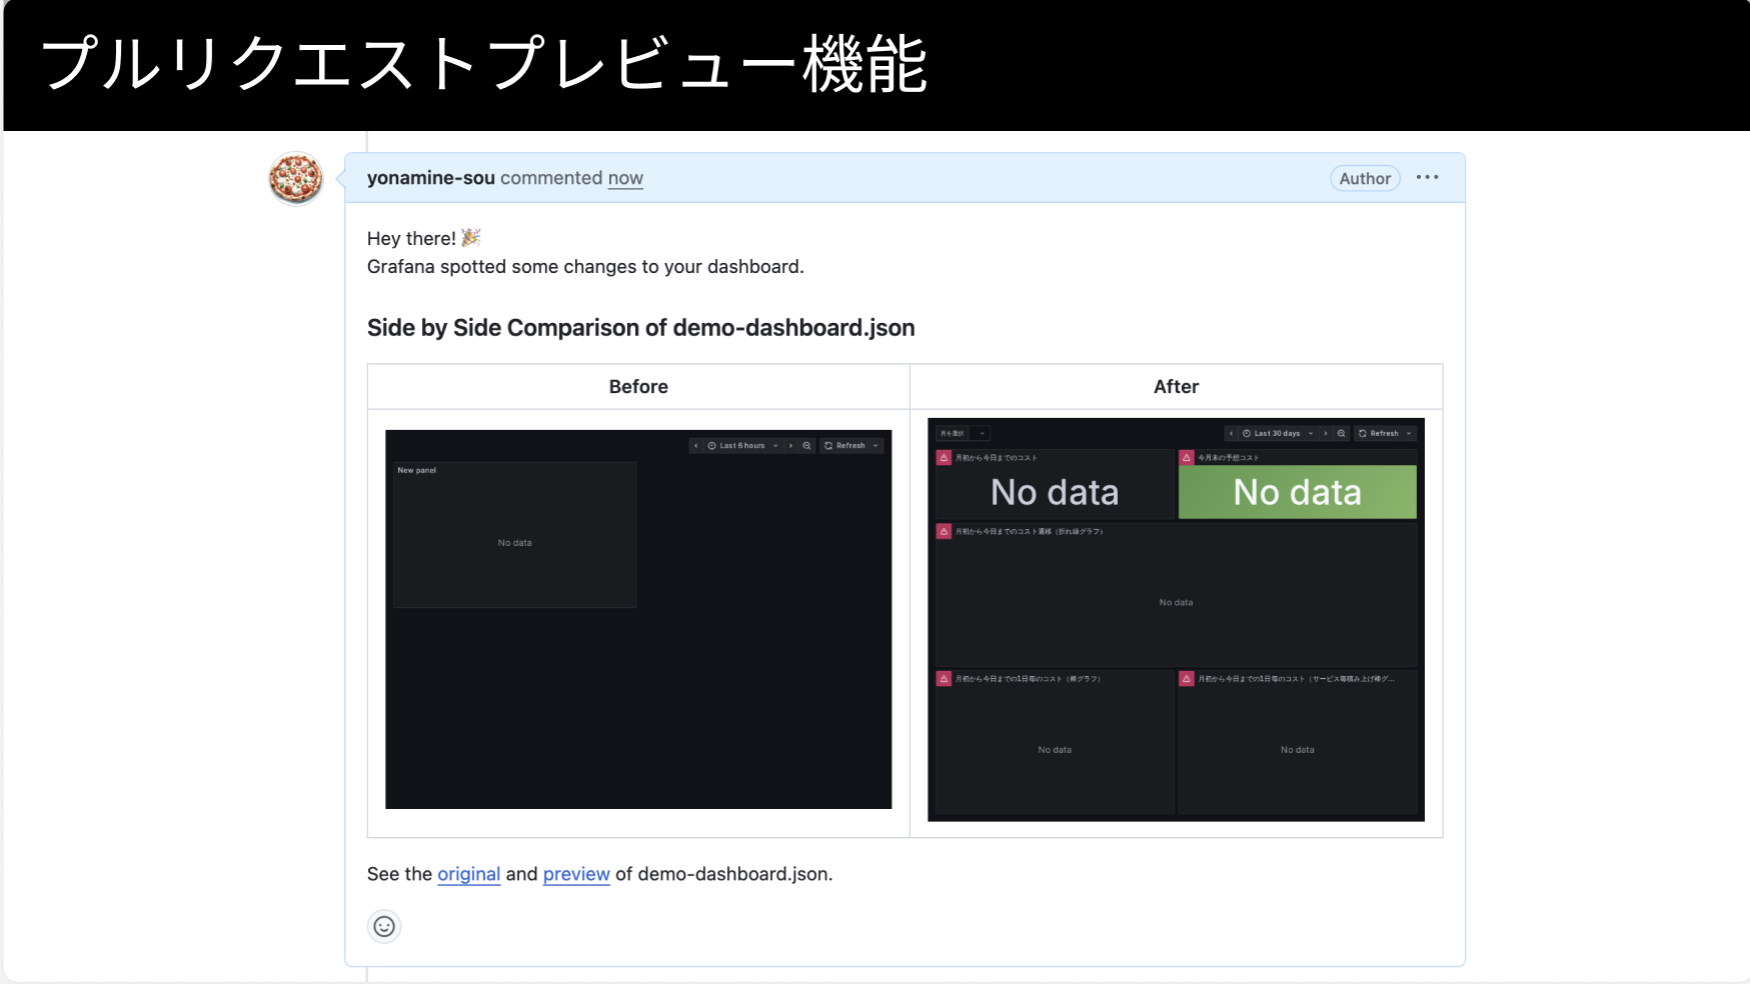
Personally, I think this is an extremely cool feature!!
By combining these features and cycling through usage and modifications after building, I believe it will grow into a dashboard that gets used.
Use the created dashboard → edit areas of concern, and by repeating this process, I eventually ended up with a dashboard like this:
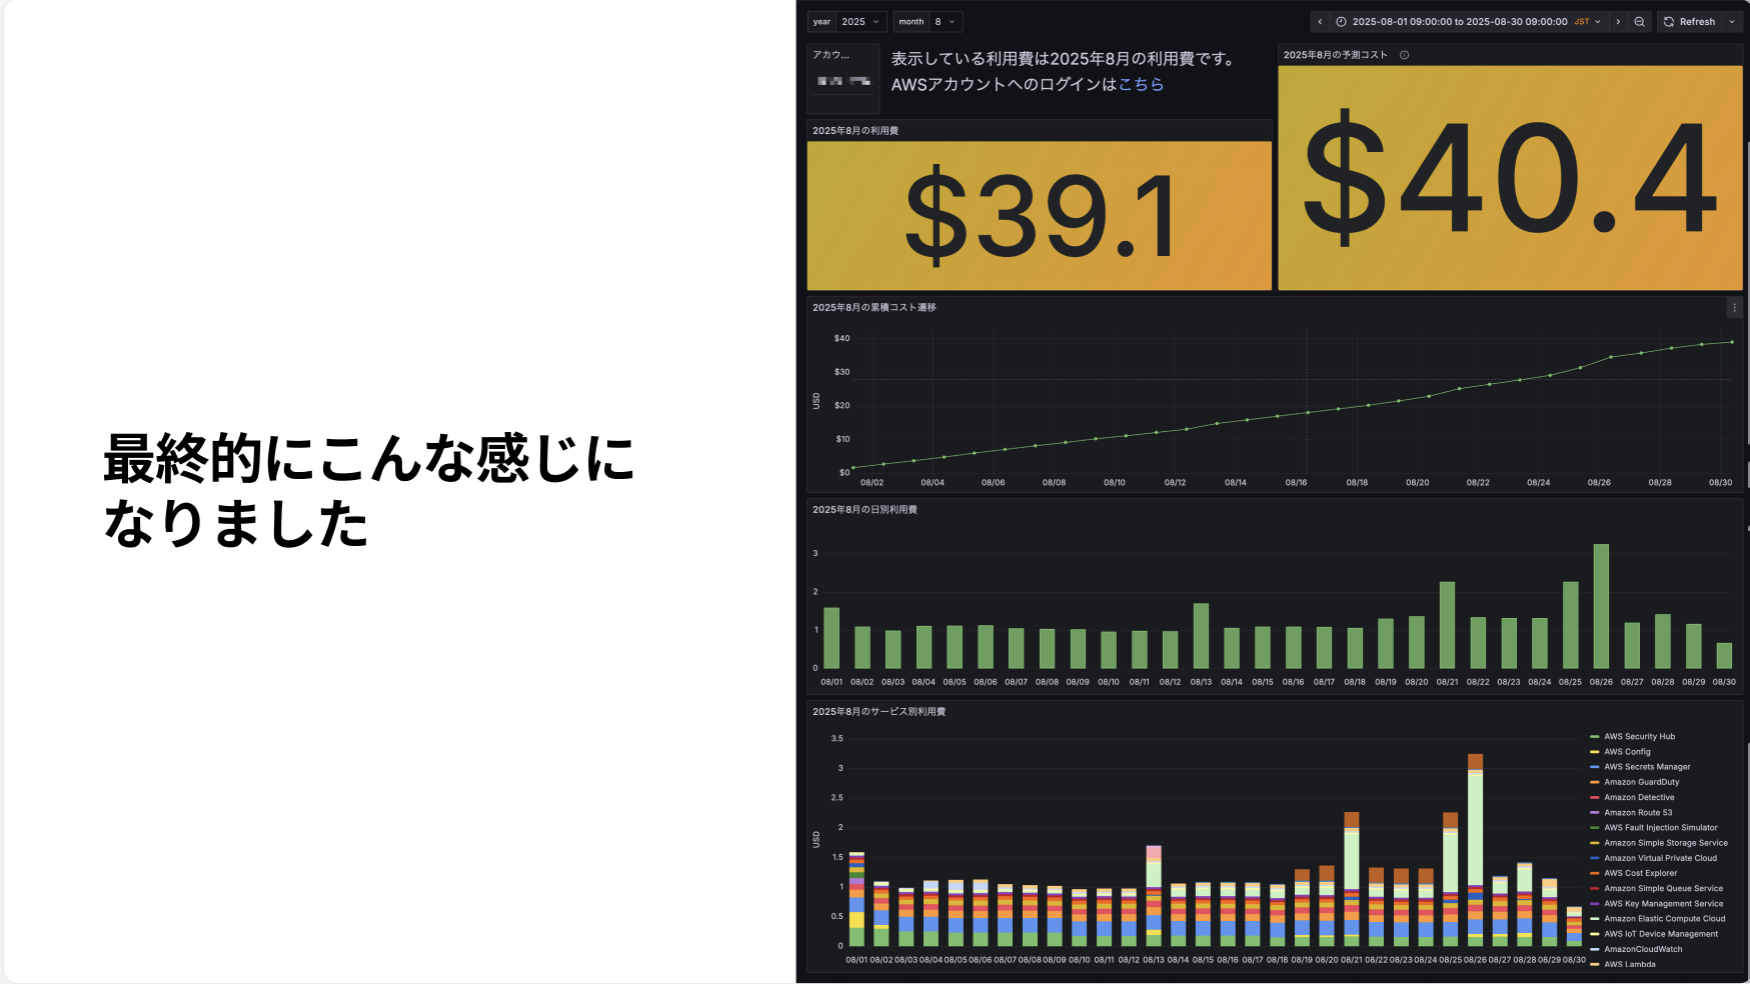
What do you think? It's serving well as my daily AWS cost analysis dashboard.
Finally, after combining Claude Code with Grafana, I learned the following:
 ## Finally
This time, I tried building dashboards using Grafana's Git Sync feature combined with Claude Code.
As a next step, I'd like to try having Claude Code or another AI create the rough sketches as well.
I've tried with Claude Code several times, but ultimately when viewed by human eyes, there were many panels that seemed unnecessary, or panels where I wanted to drill down and explore deeper.
While this might depend on how inputs are provided, at this point, it's actually faster to create these myself than to have the AI do it.
As new technologies continue to emerge, I'd like to incorporate AI into dashboard requirements definition and design as well.