Thinking About How to Branch with Grafana Git Sync

Introduction
Last time, I wrote an article titled "Trying out Git Sync announced in Grafana v12".
While actually using this feature, I felt the way branches are used is somewhat distinctive, so I'm writing this article.
The Git Sync feature is still a preview feature at this point, so there's a possibility that the functionality may change in the future.
For the test environment, I've continued to use the Enterprise version of Grafana.
The version is 12.1.0-pre.
			$ grafana -v
grafana version 12.1.0-pre
Creating a New Branch
First, let's try the normal flow from creating a new branch to merging via pull request.
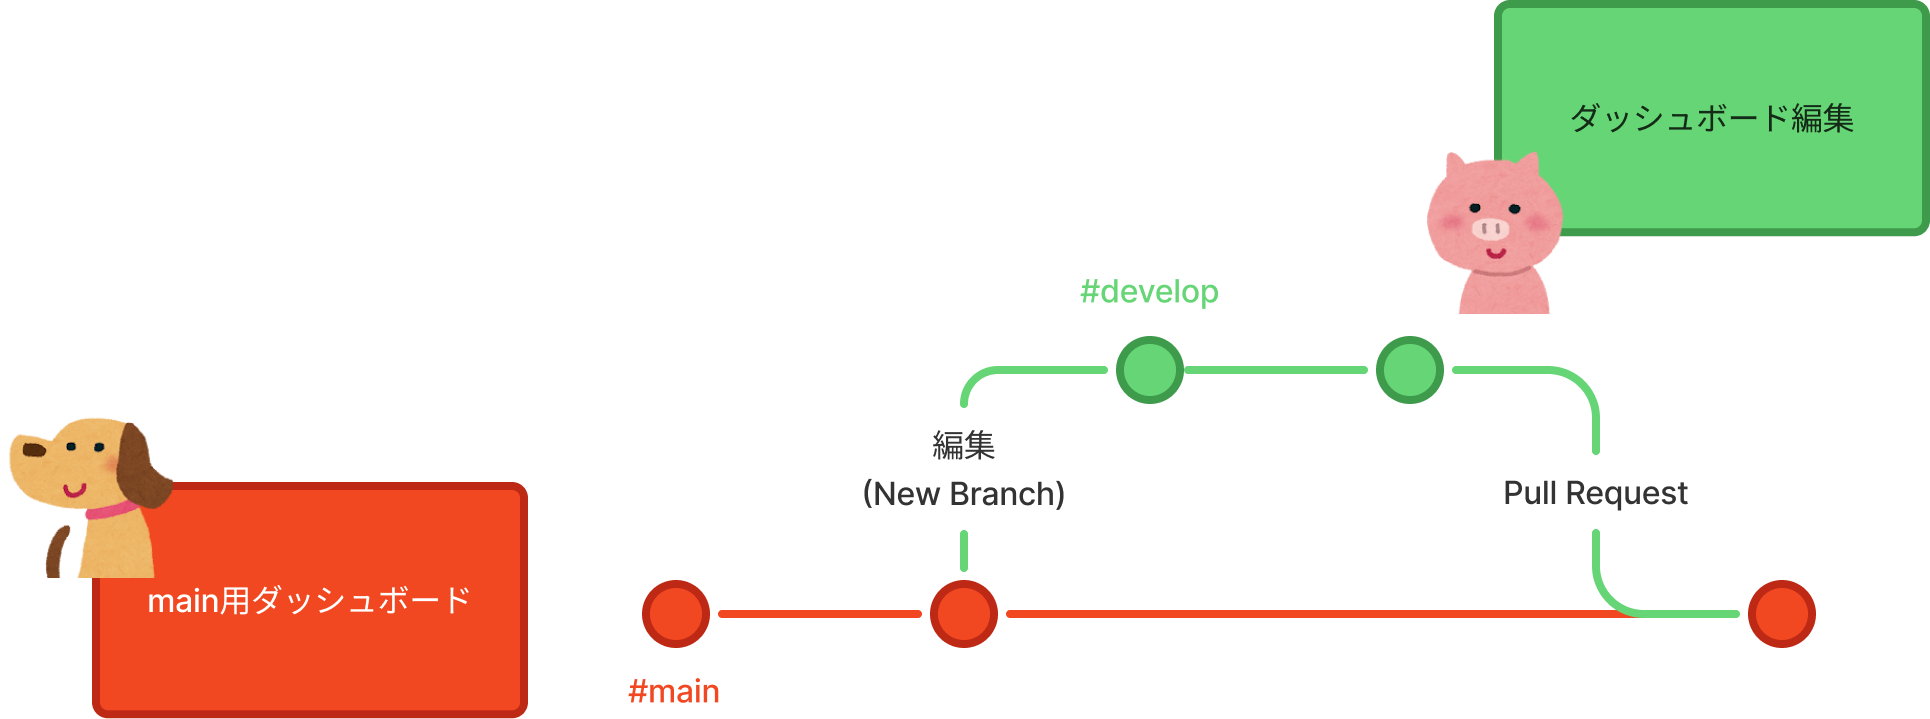
First, I prepare a dashboard and save it as the main branch.
I also leave a message as the initial commit.
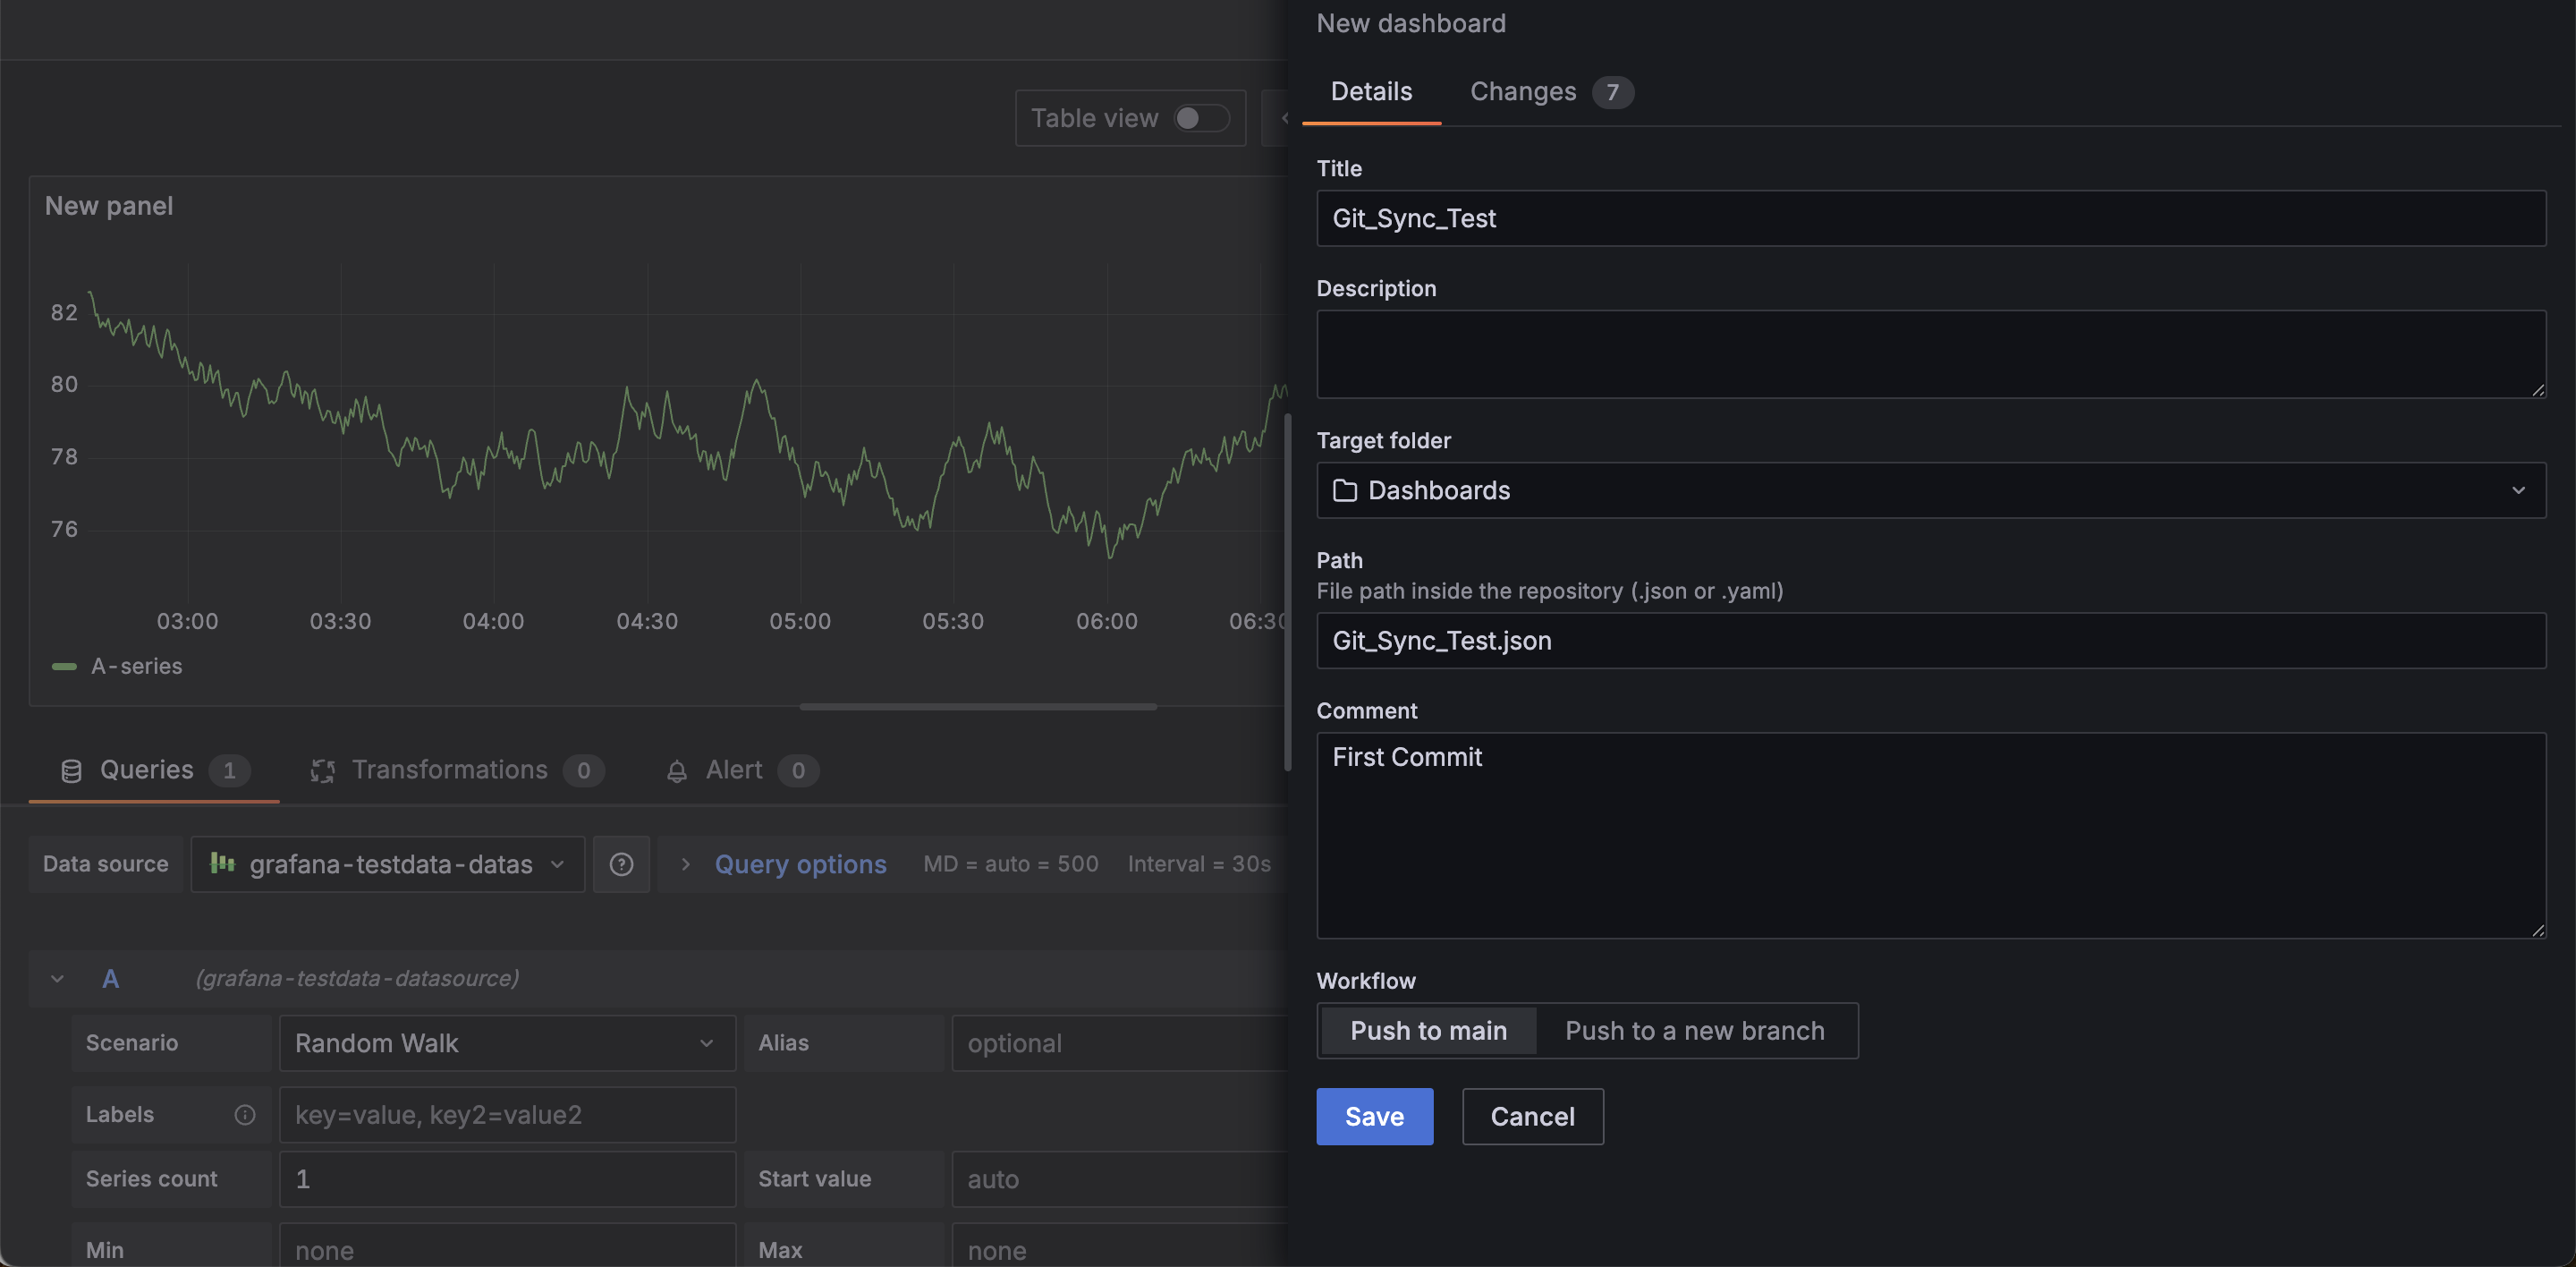
Next, I edit some panels.
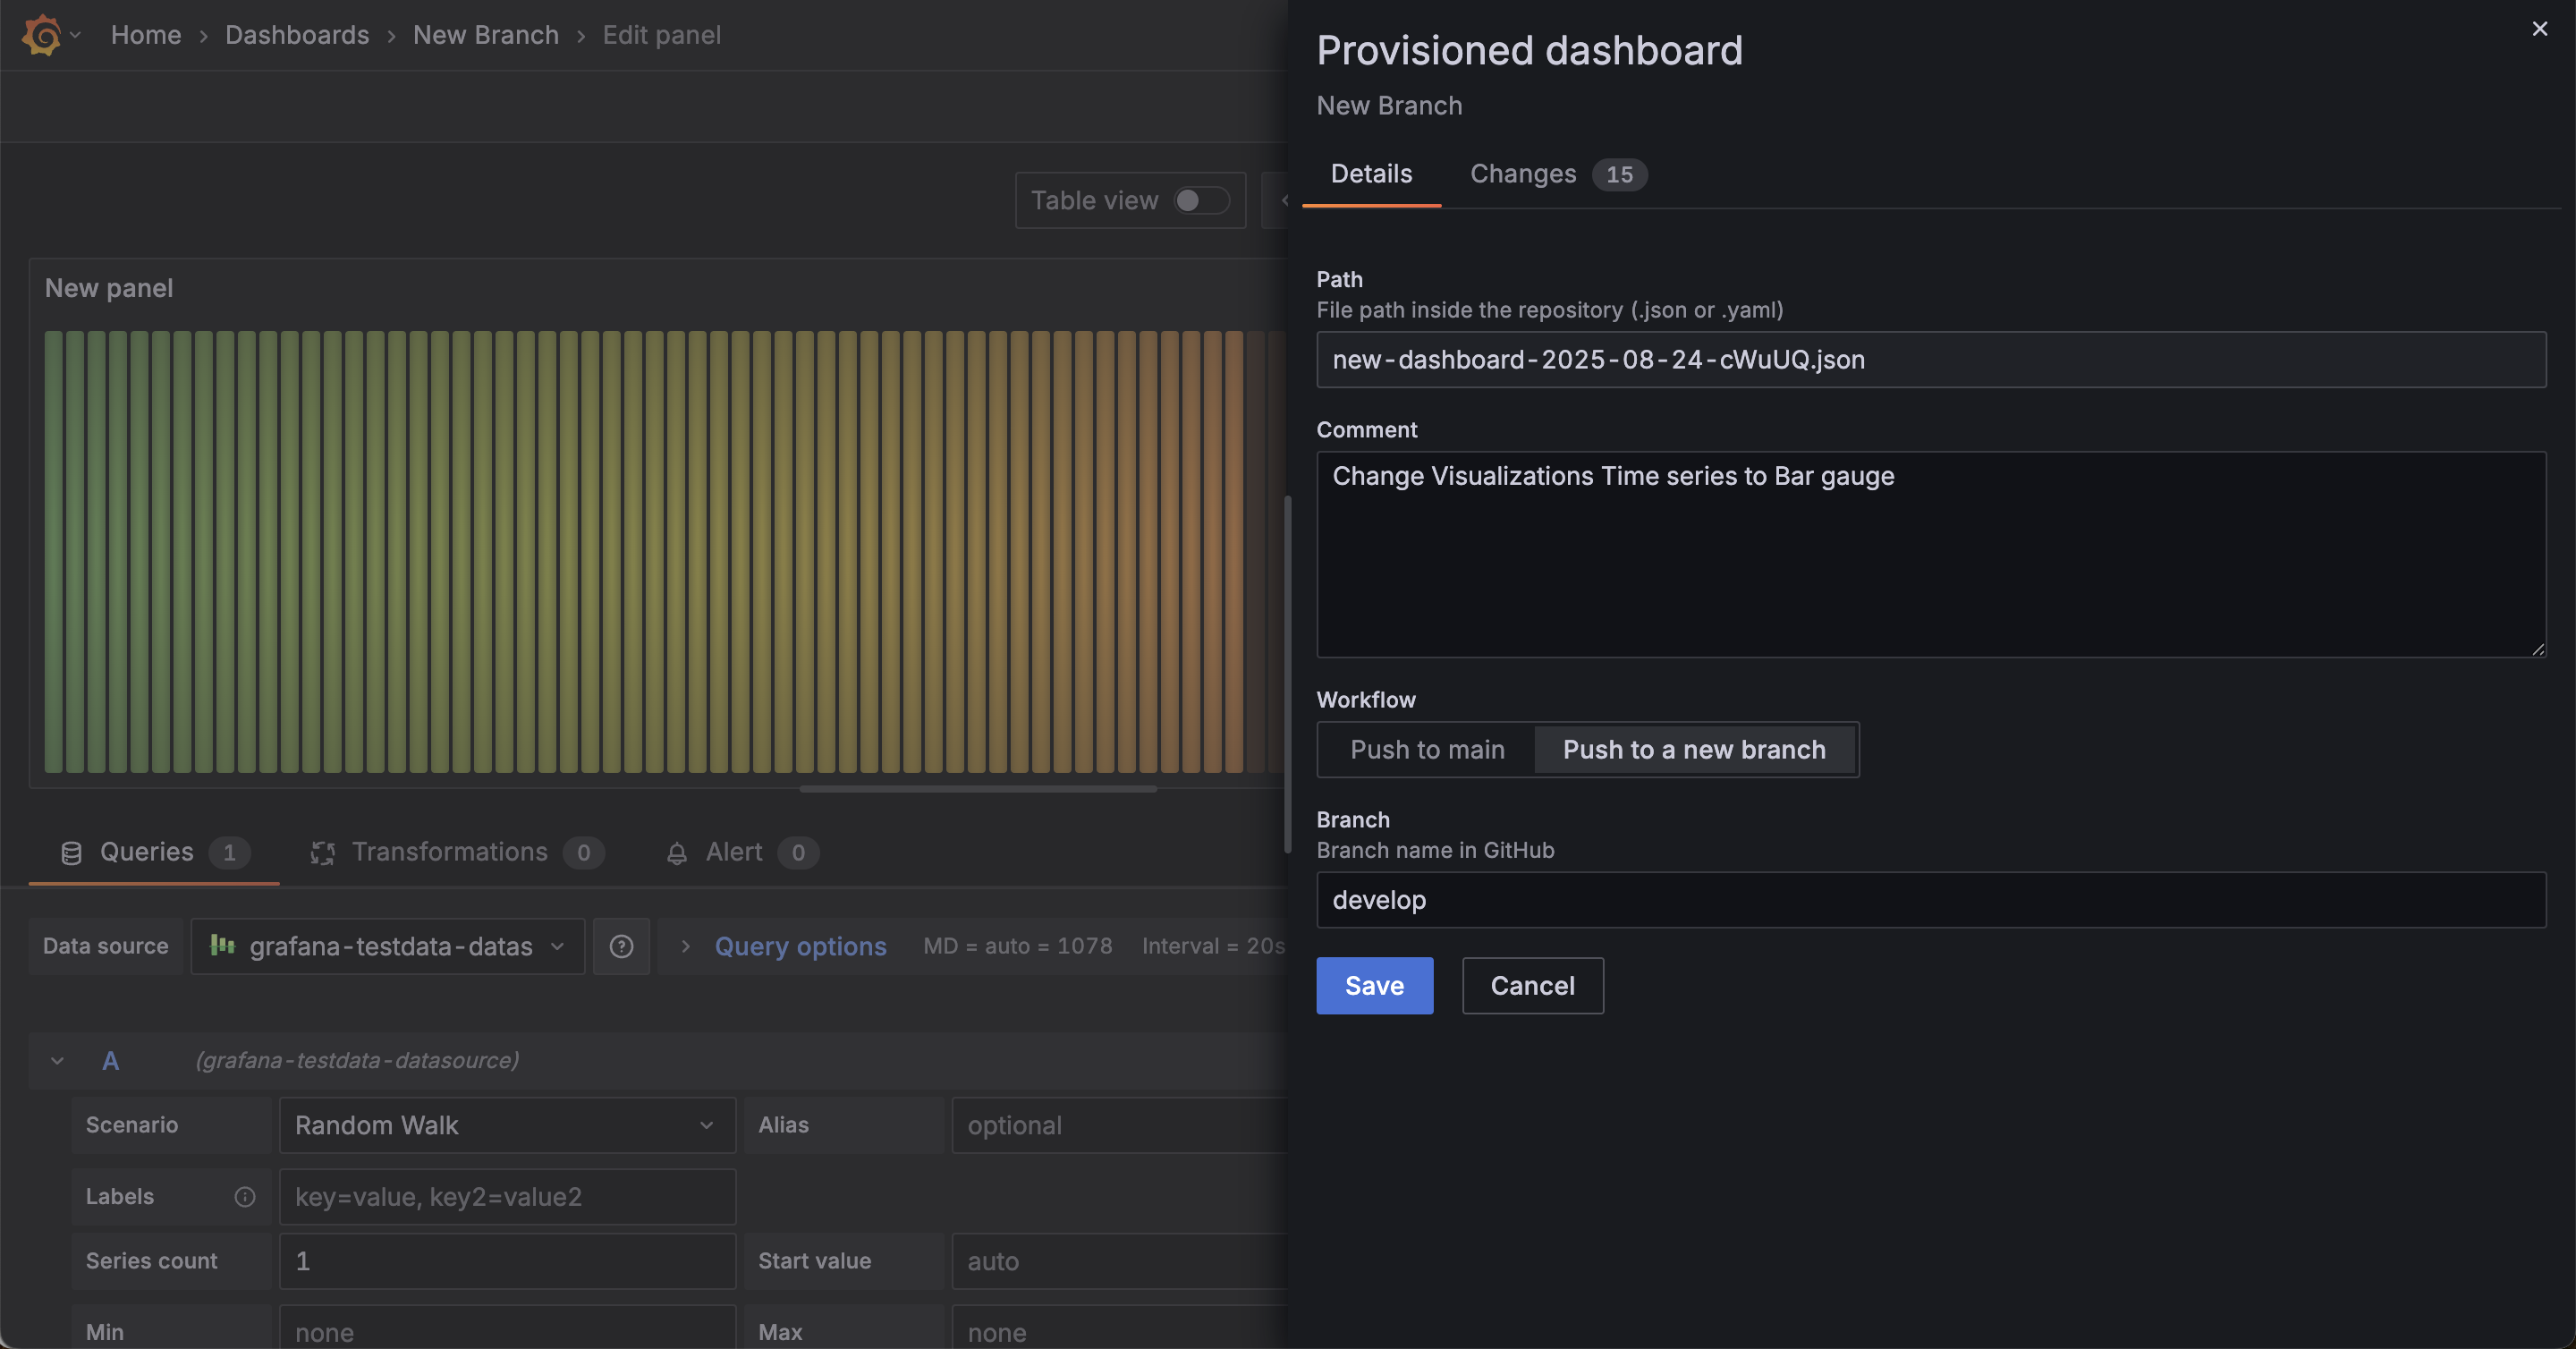
I change Time series to Bar chart and save the dashboard.
When saving, I select Push to new branch in the Workflow and save it as a development branch (develop).
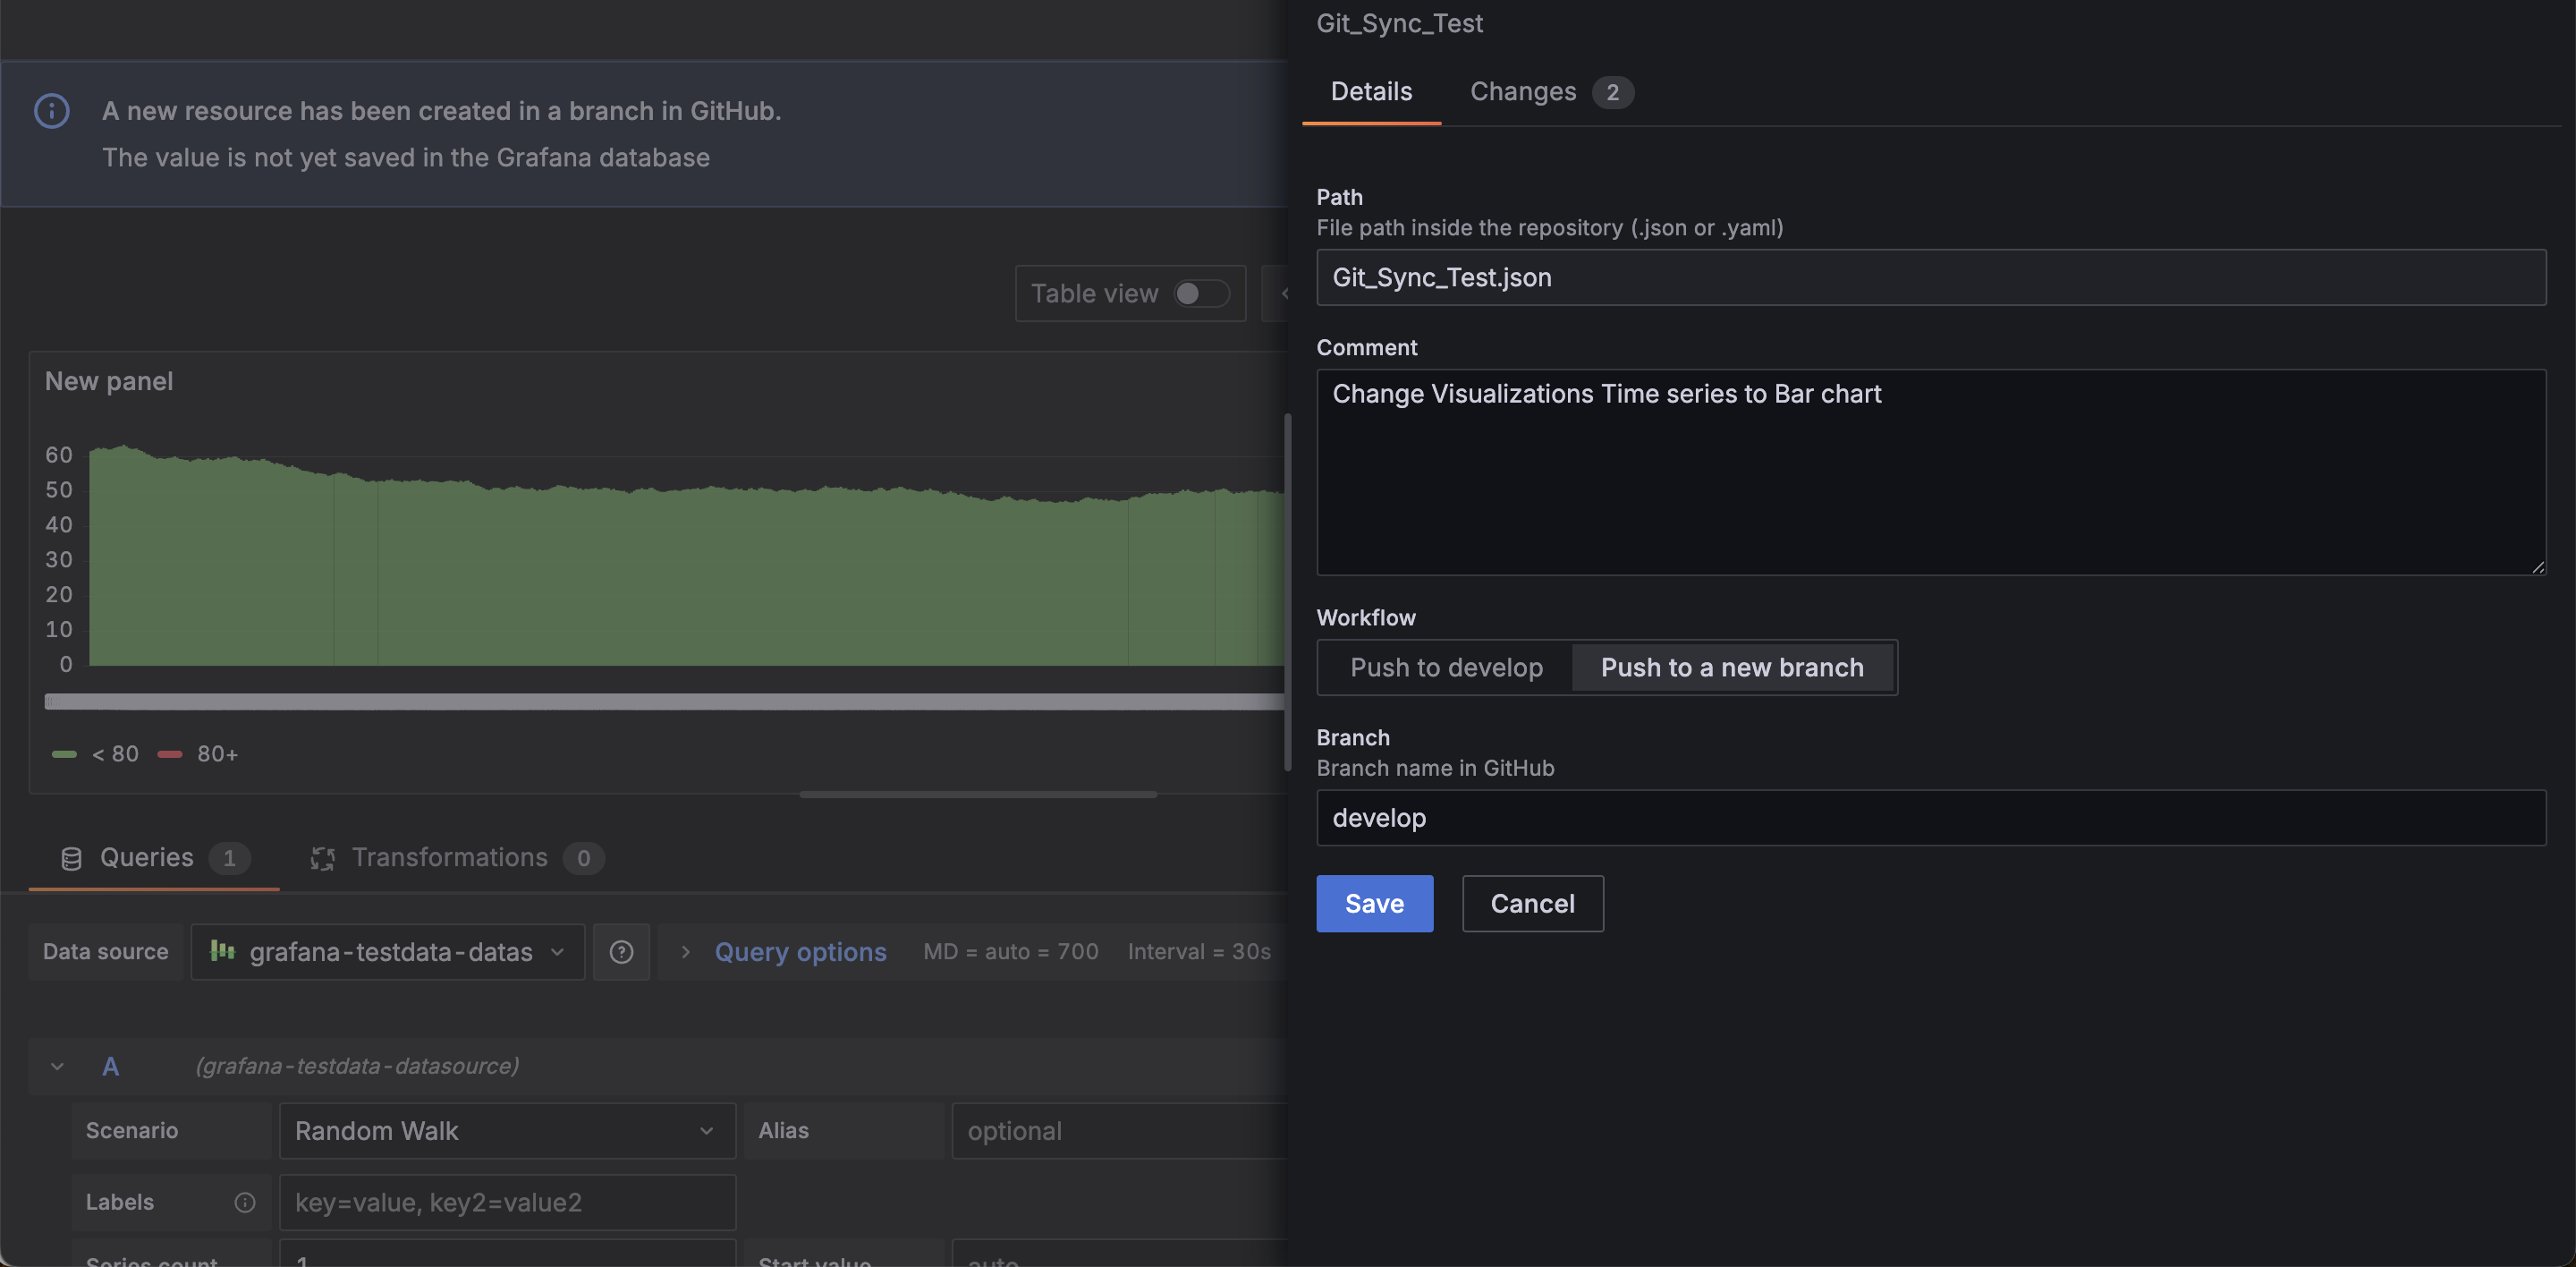
I continue making changes directly in the develop branch.
Now let's check the commit history from GitHub.
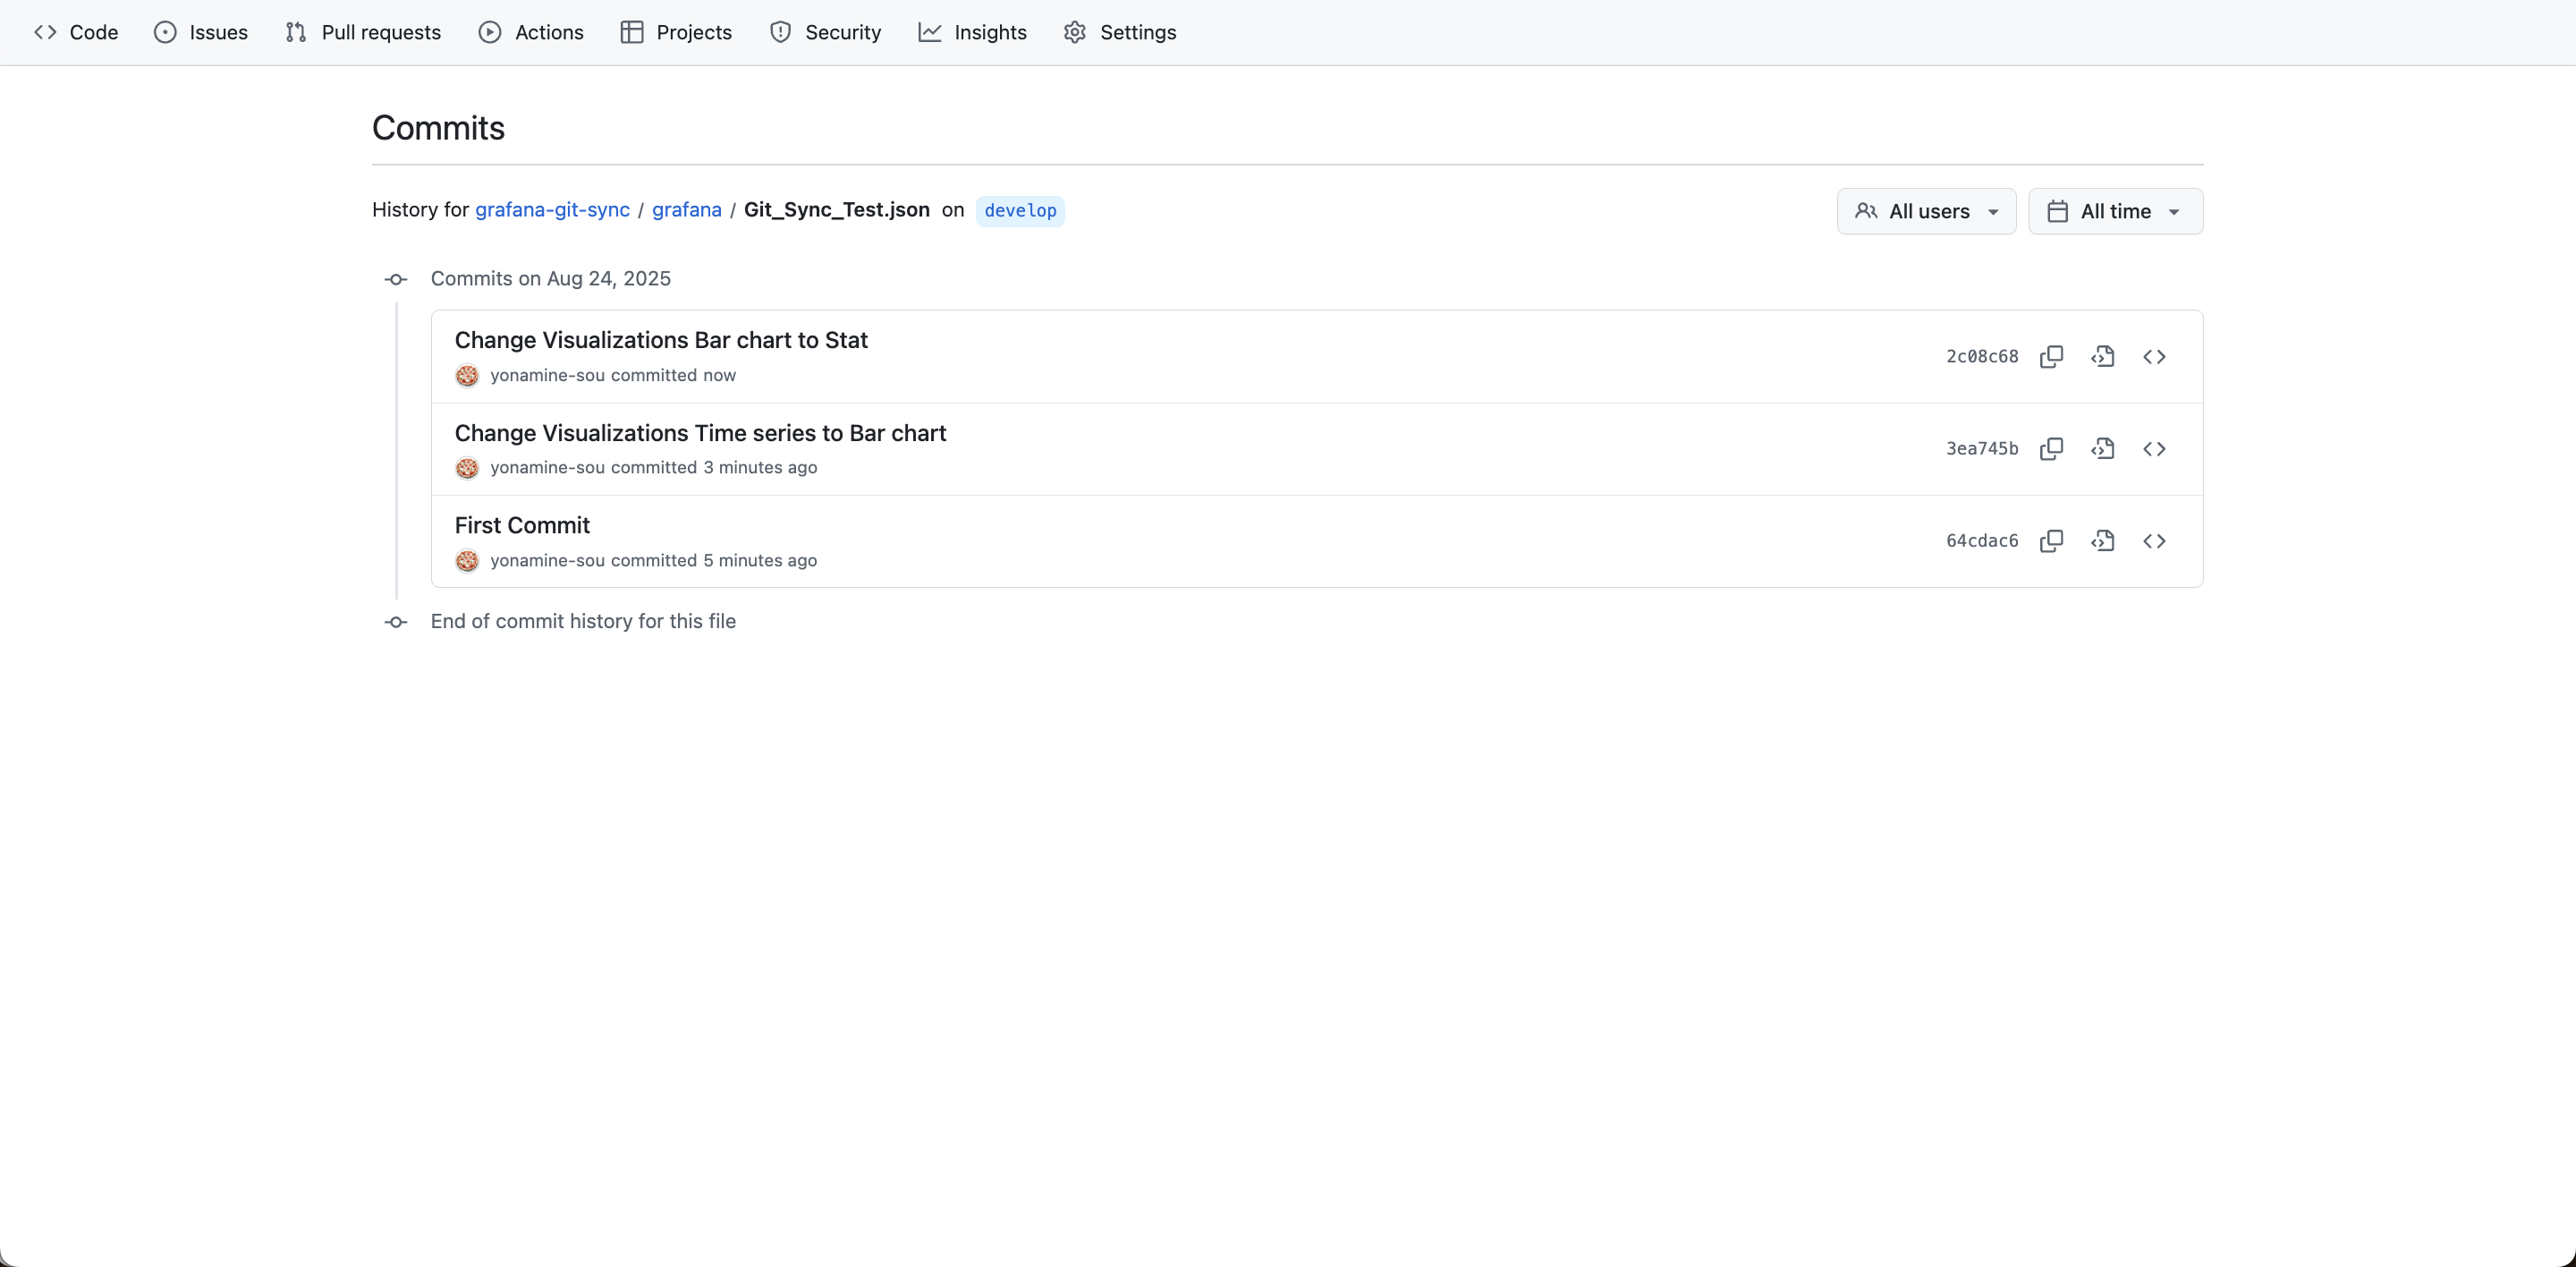
We can confirm three commit histories.
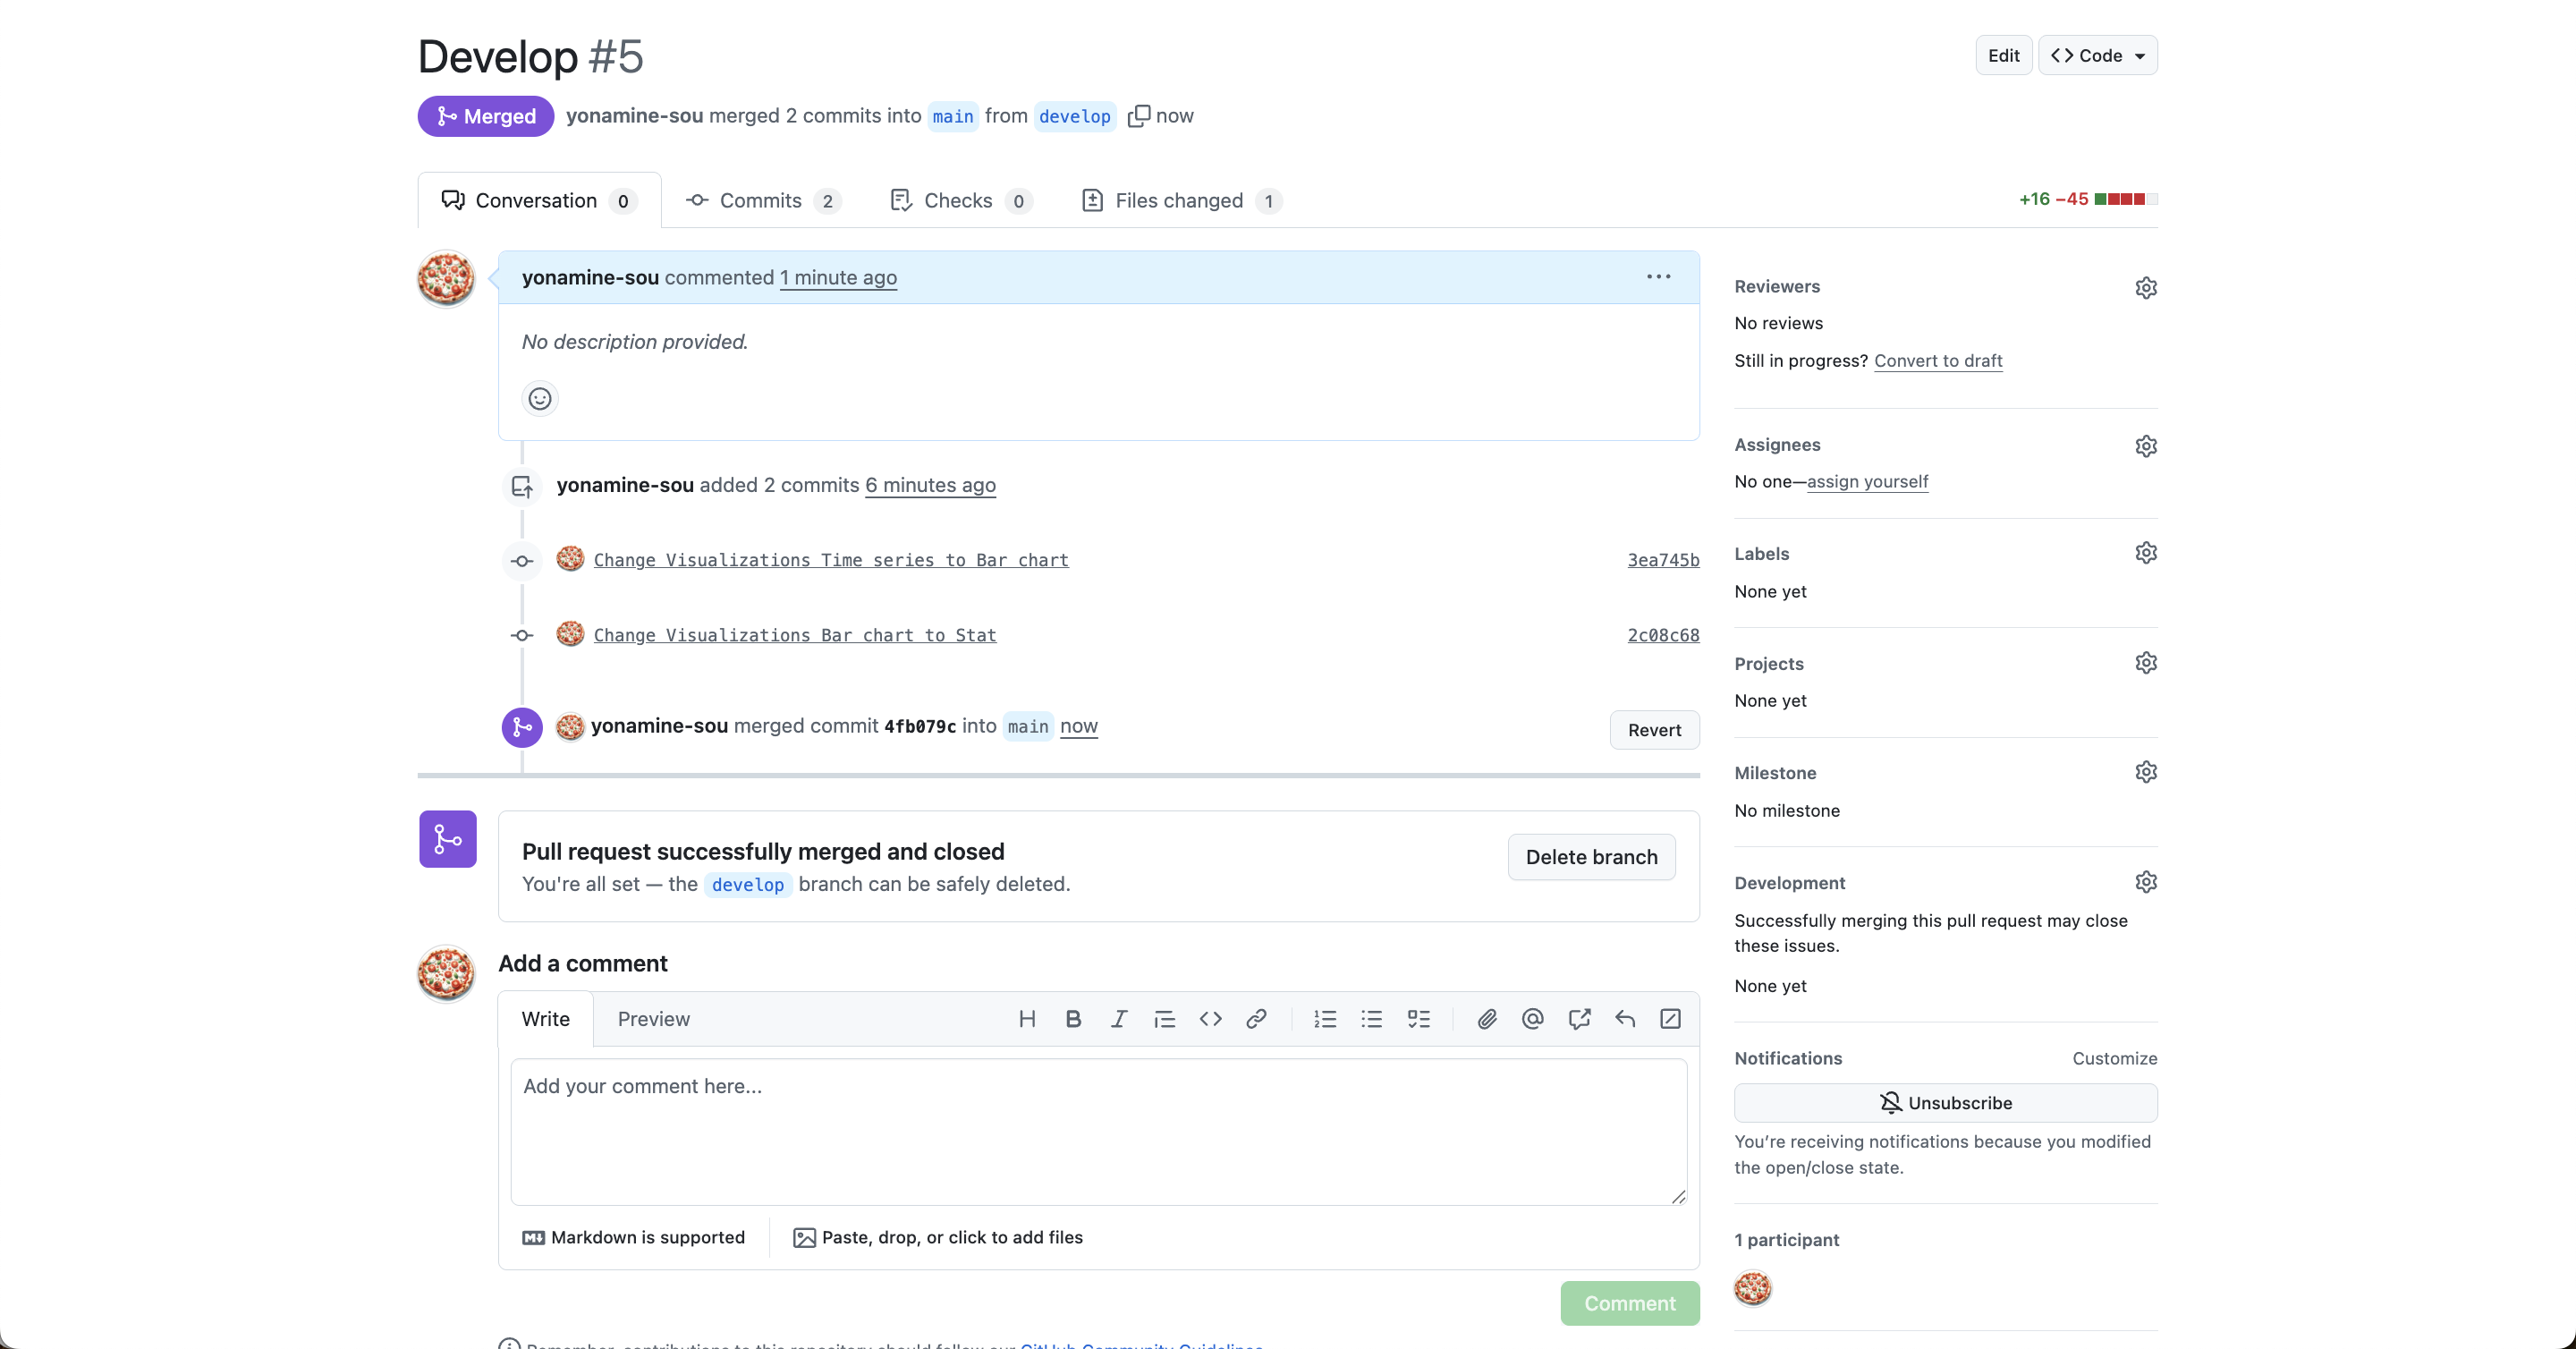
Now let's create a pull request and merge it.
A GitHub tab opens, so we create a pull request and merge it.
Up to here is an example of smoothly proceeding to a pull request.
Next, let's look at the parts I was curious about.## Concerns
I was wondering if it's possible to switch branches in Grafana when creating a new branch.
My initial impression was either:
- Dashboard is created for each branch
- You can switch between branches
I imagined that you could edit dashboards for each branch, but the actual behavior was a bit different from what I expected.
First, I created a dashboard and then created a new branch.
Currently, there are two branches: main and develop.
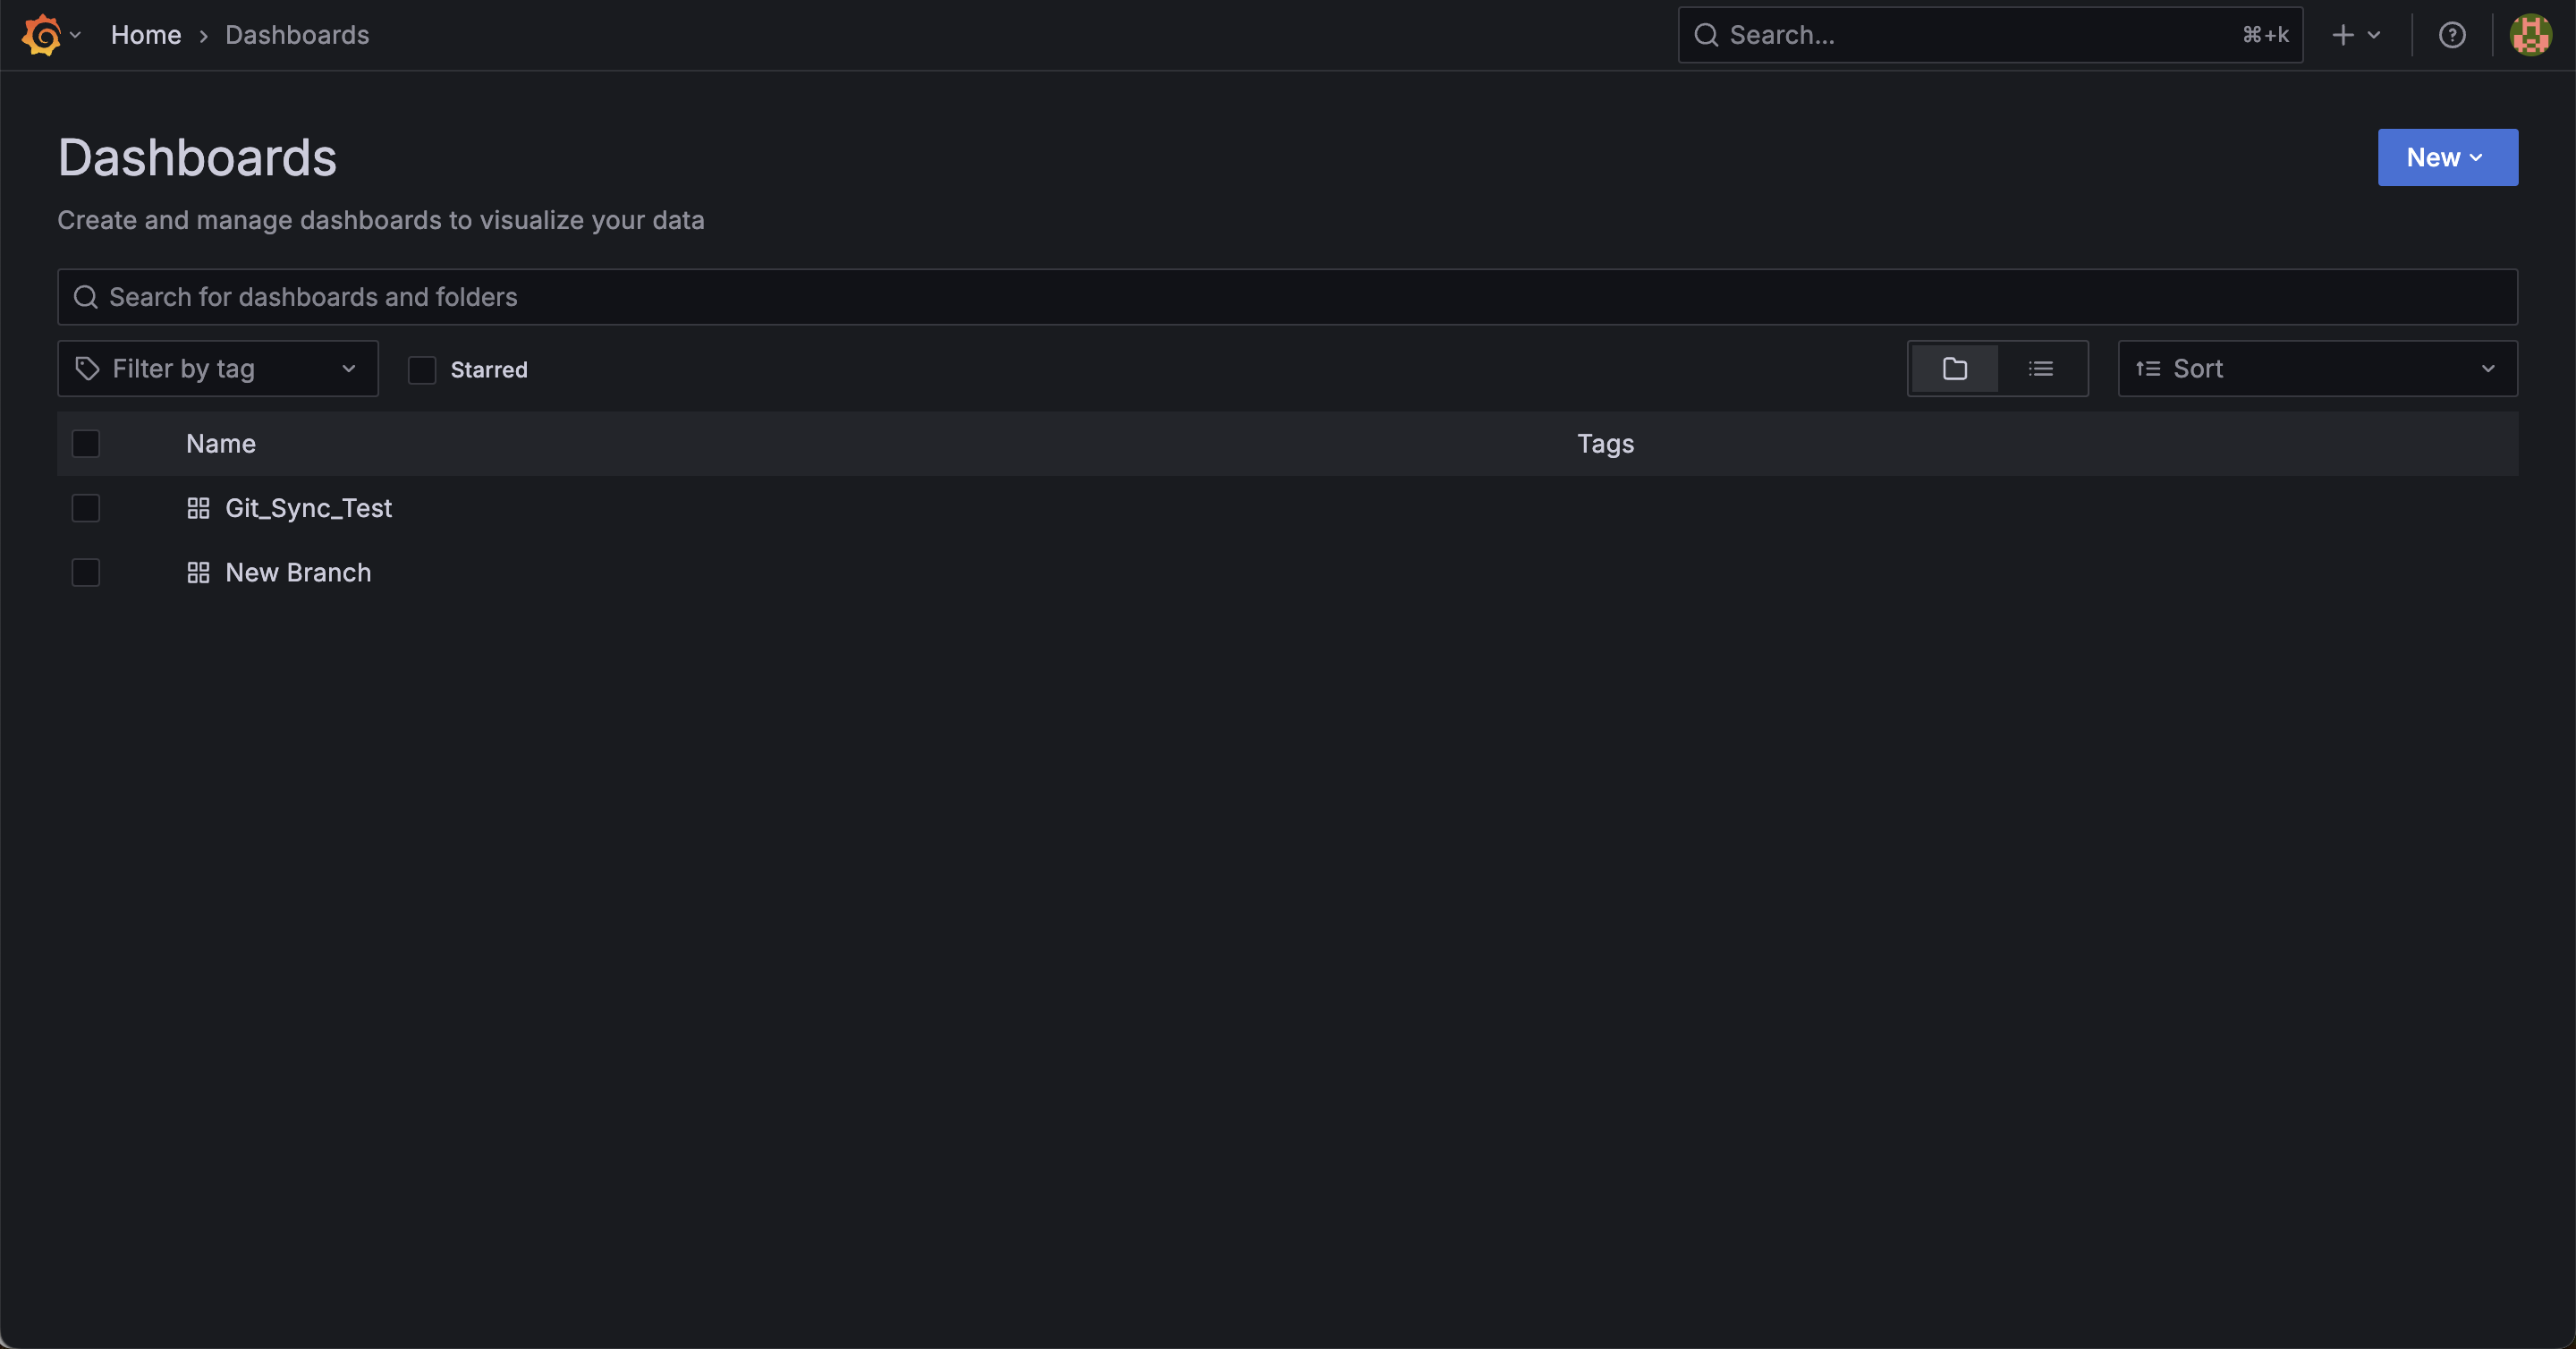
Now I'll check if dashboards have increased for each branch.
The dashboards did not increase.
Next, I'll check if I can switch between main and develop.
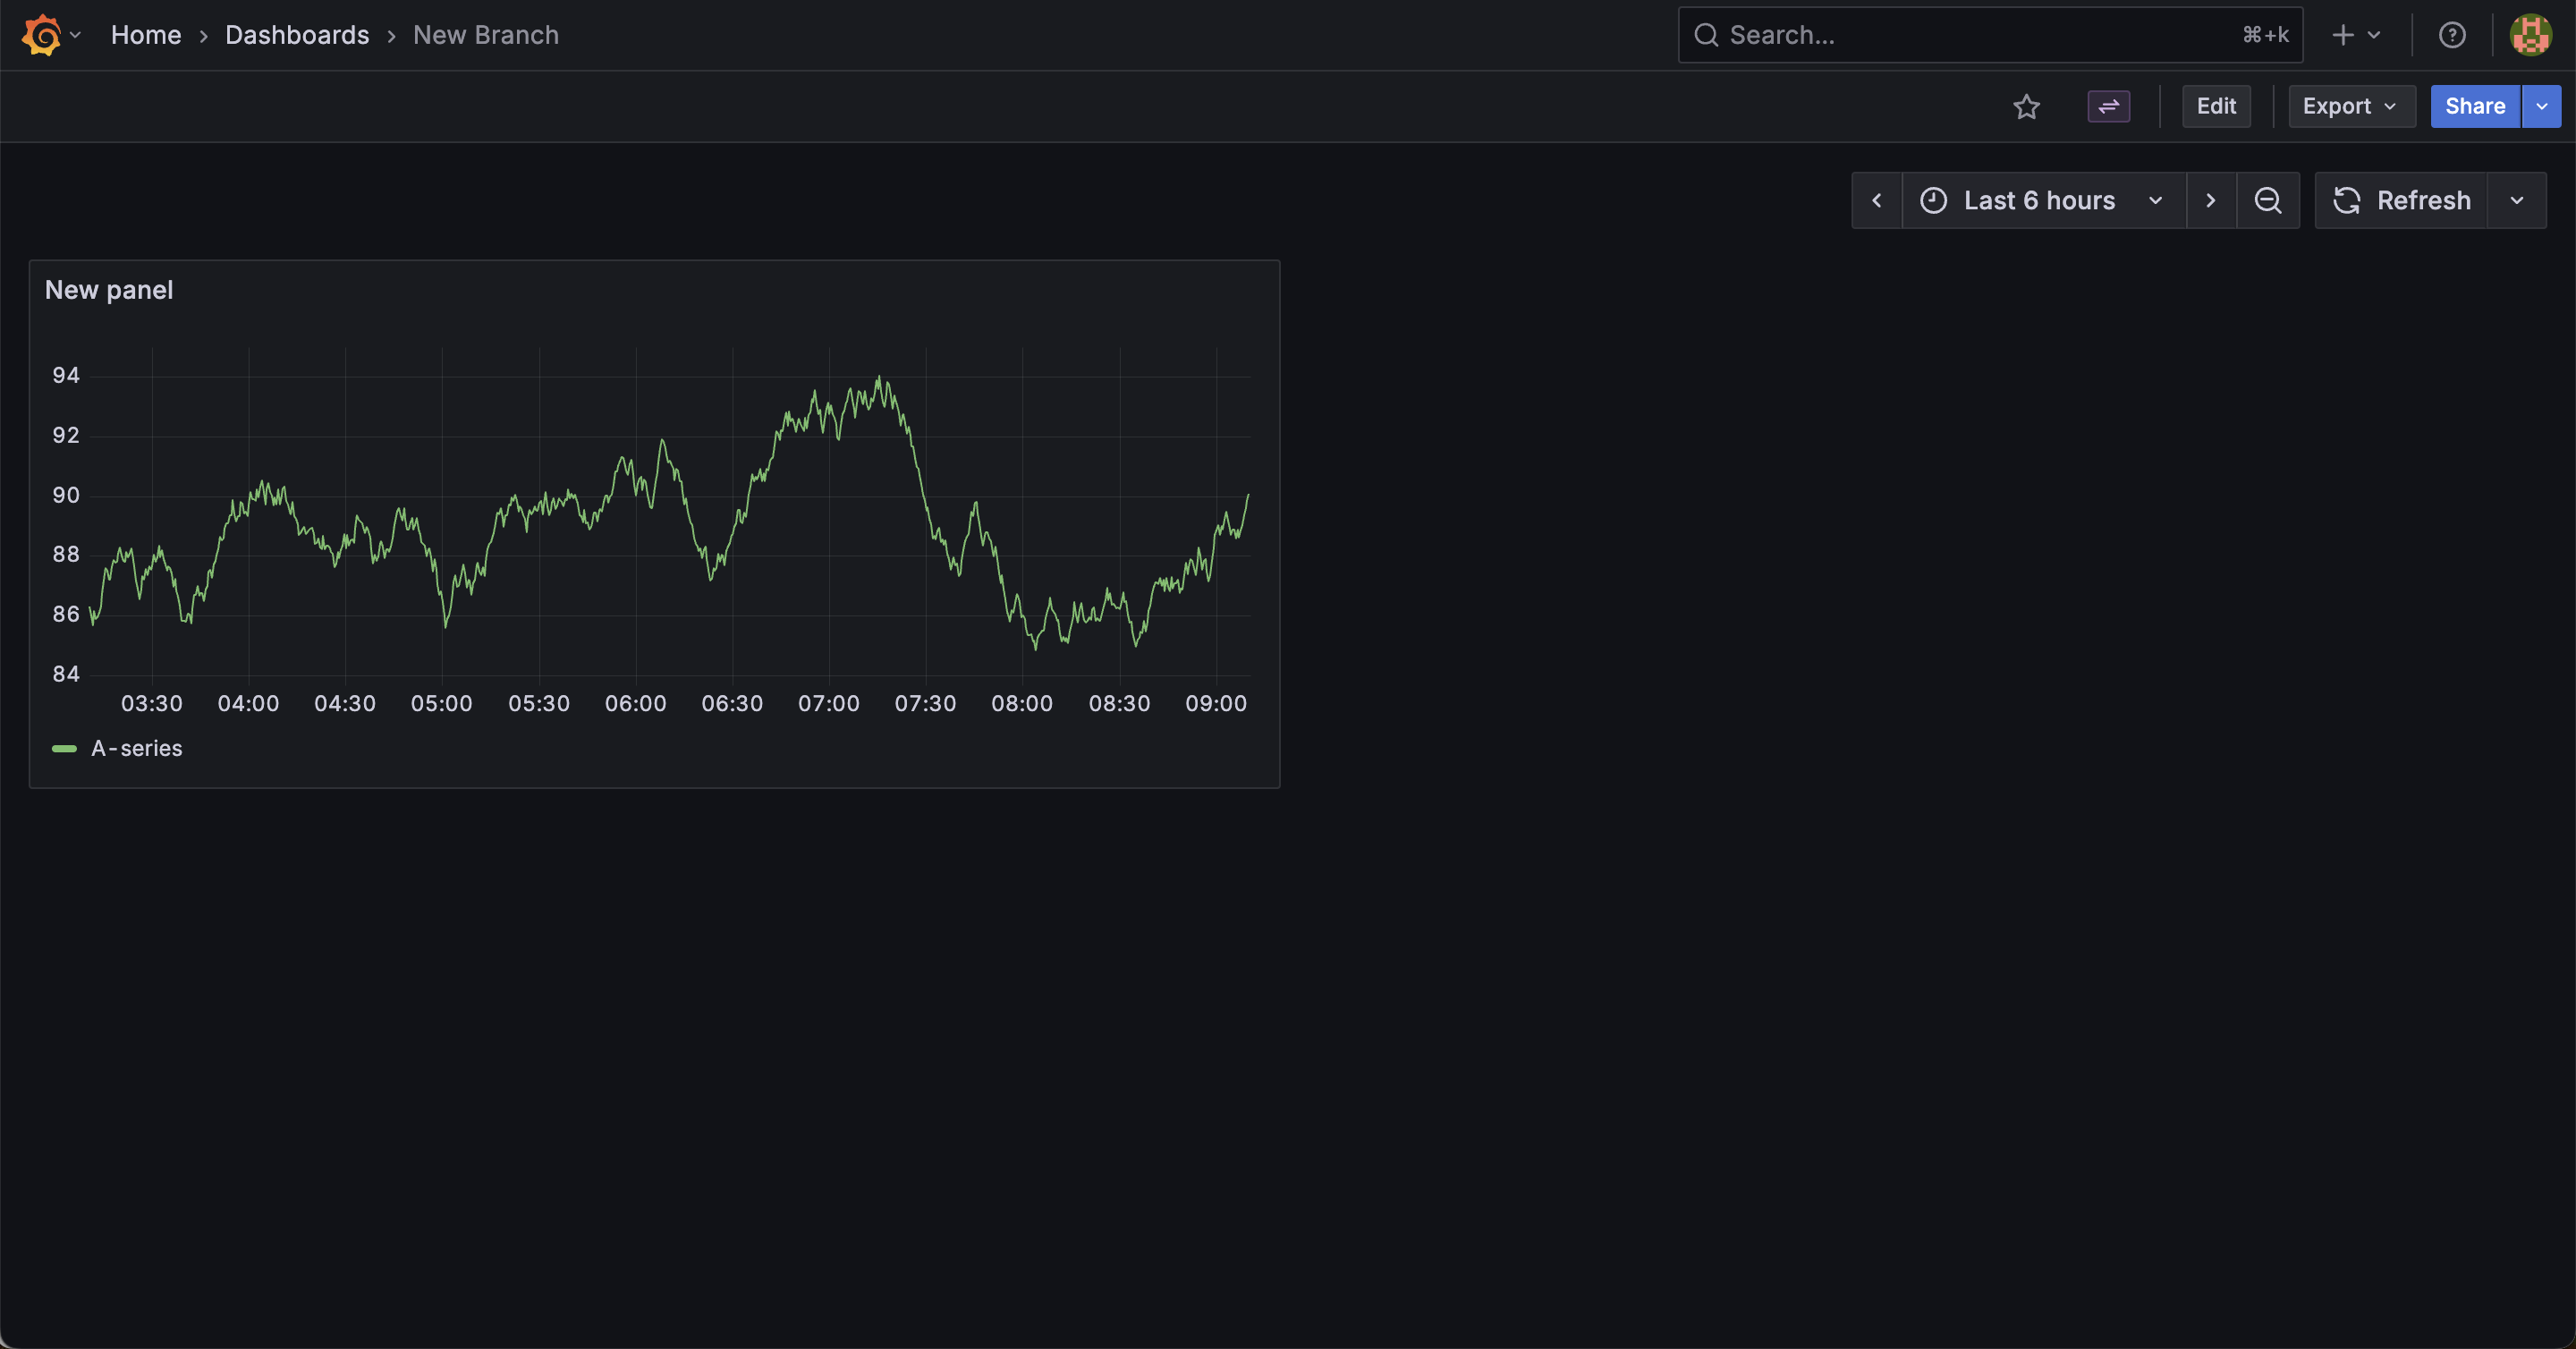
I'll open the New Branch dashboard I created earlier.
At this point, the dashboard before changes (main branch) is displayed.
I checked various settings, but couldn't find any option to switch branches.
I also checked the documentation, but couldn't find any feature to switch dashboards by branch at this time.
Let's also check the information incorporated into Grafana.
Git Sync can be configured from Administration > Provisioning, so let's take a look there.
You can check the History of each dashboard from the Resources tab.
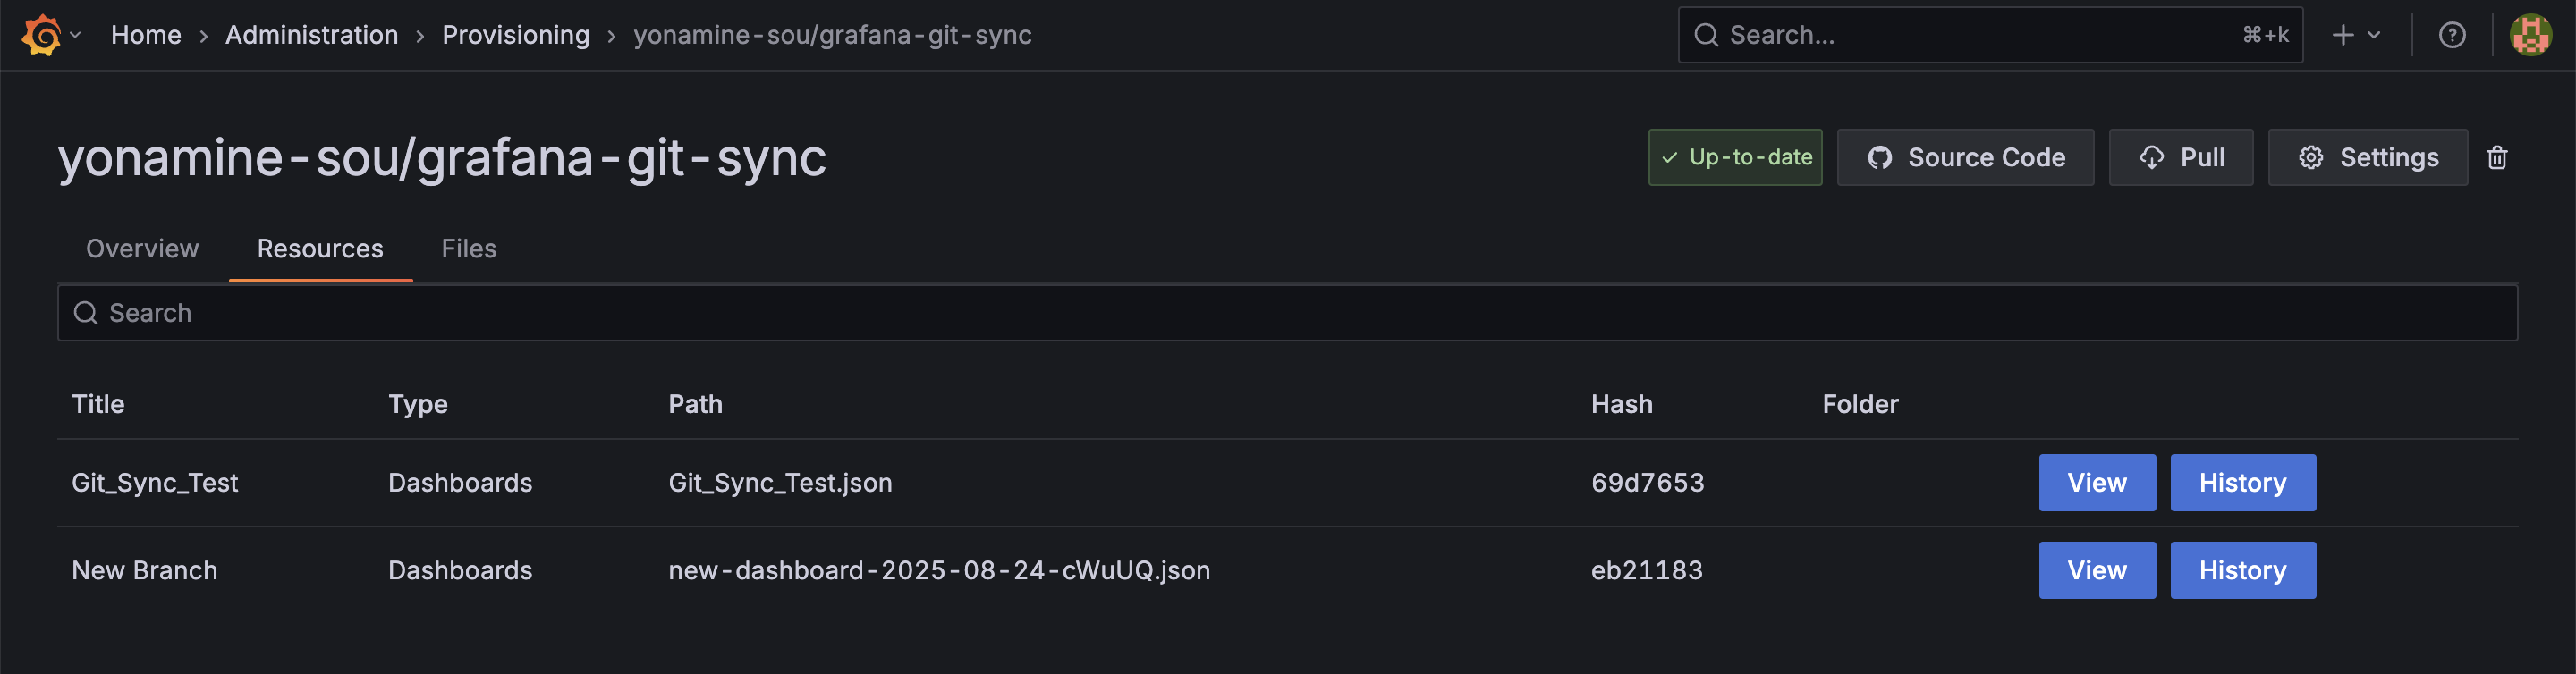
I made two commits (once in main, once in develop), but only one from the main branch when the dashboard was created is shown.
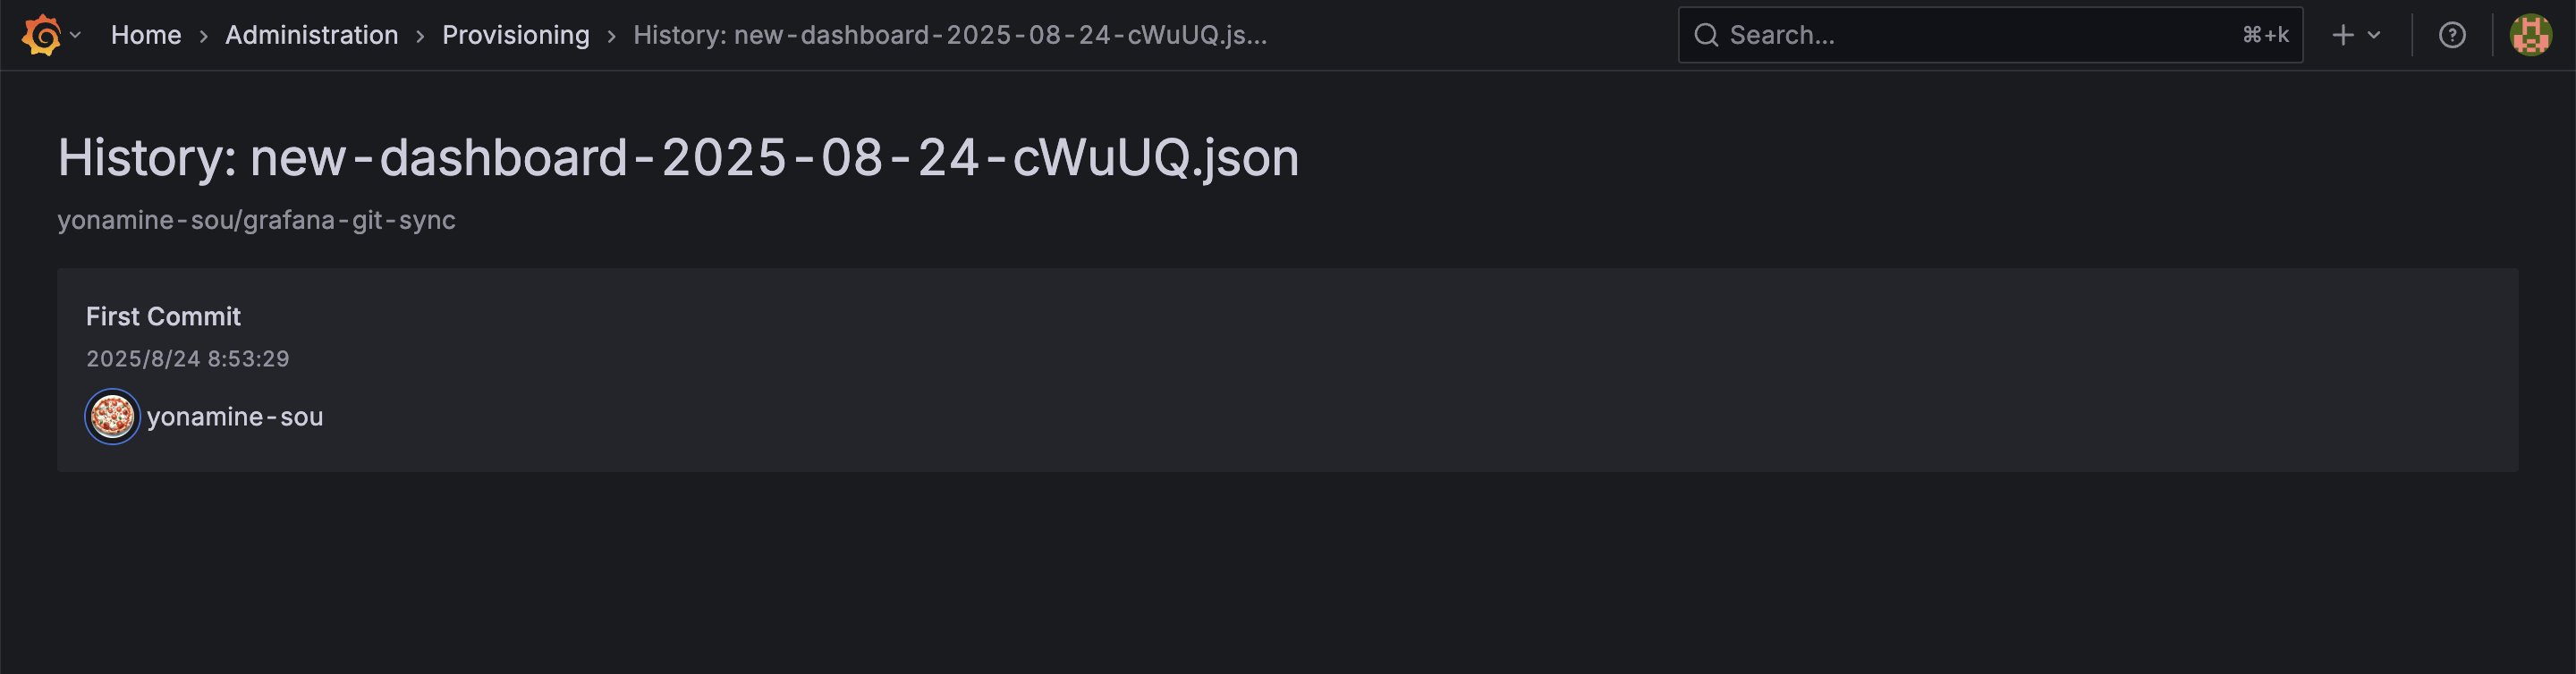
This means that Grafana only holds information from the main branch.
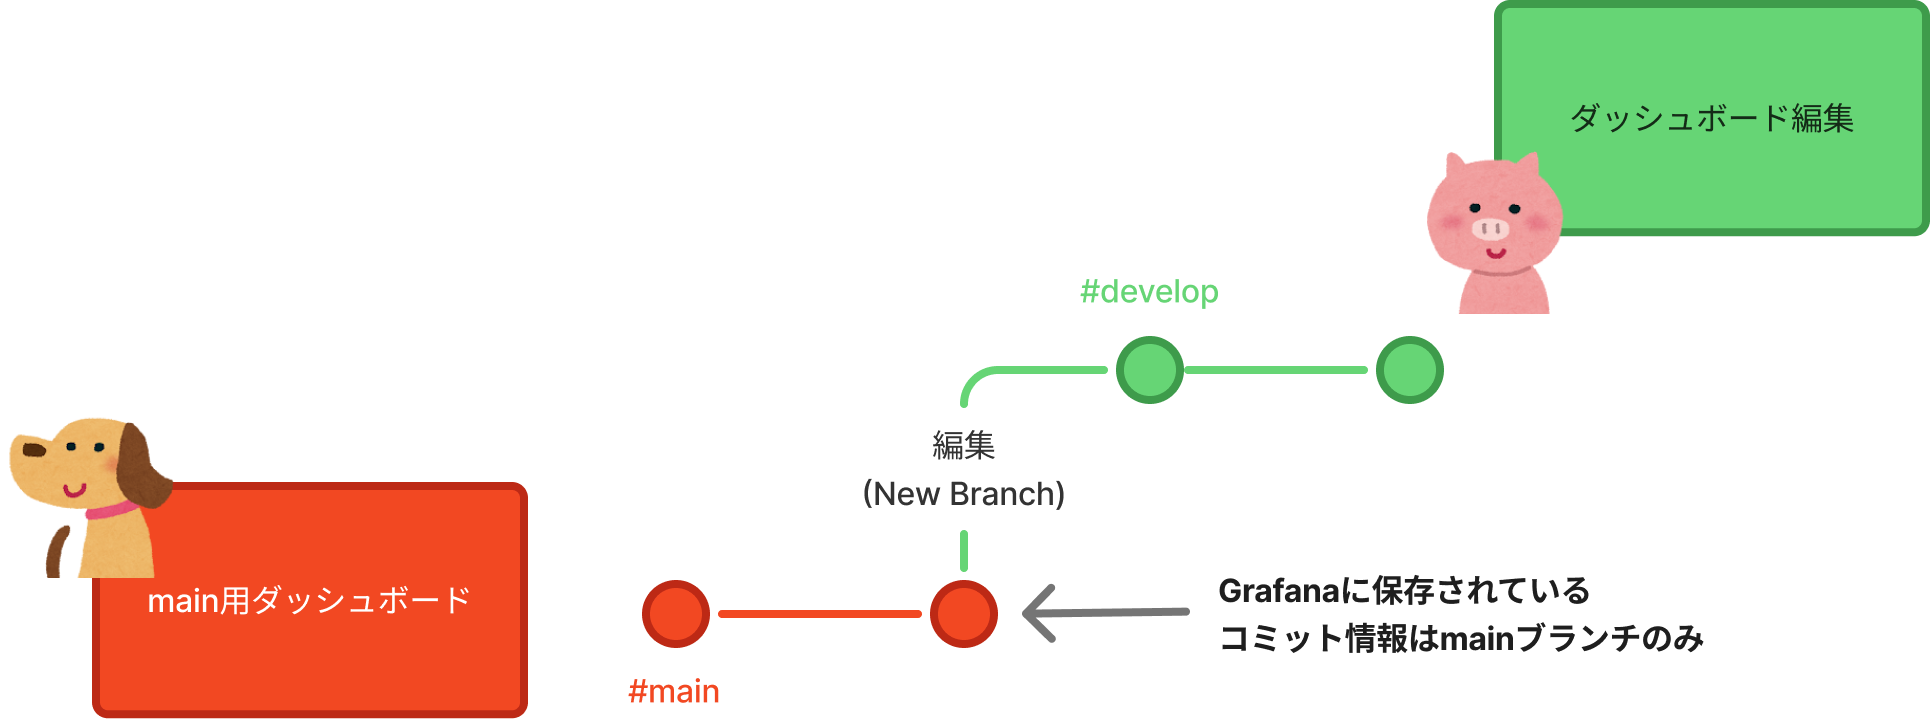
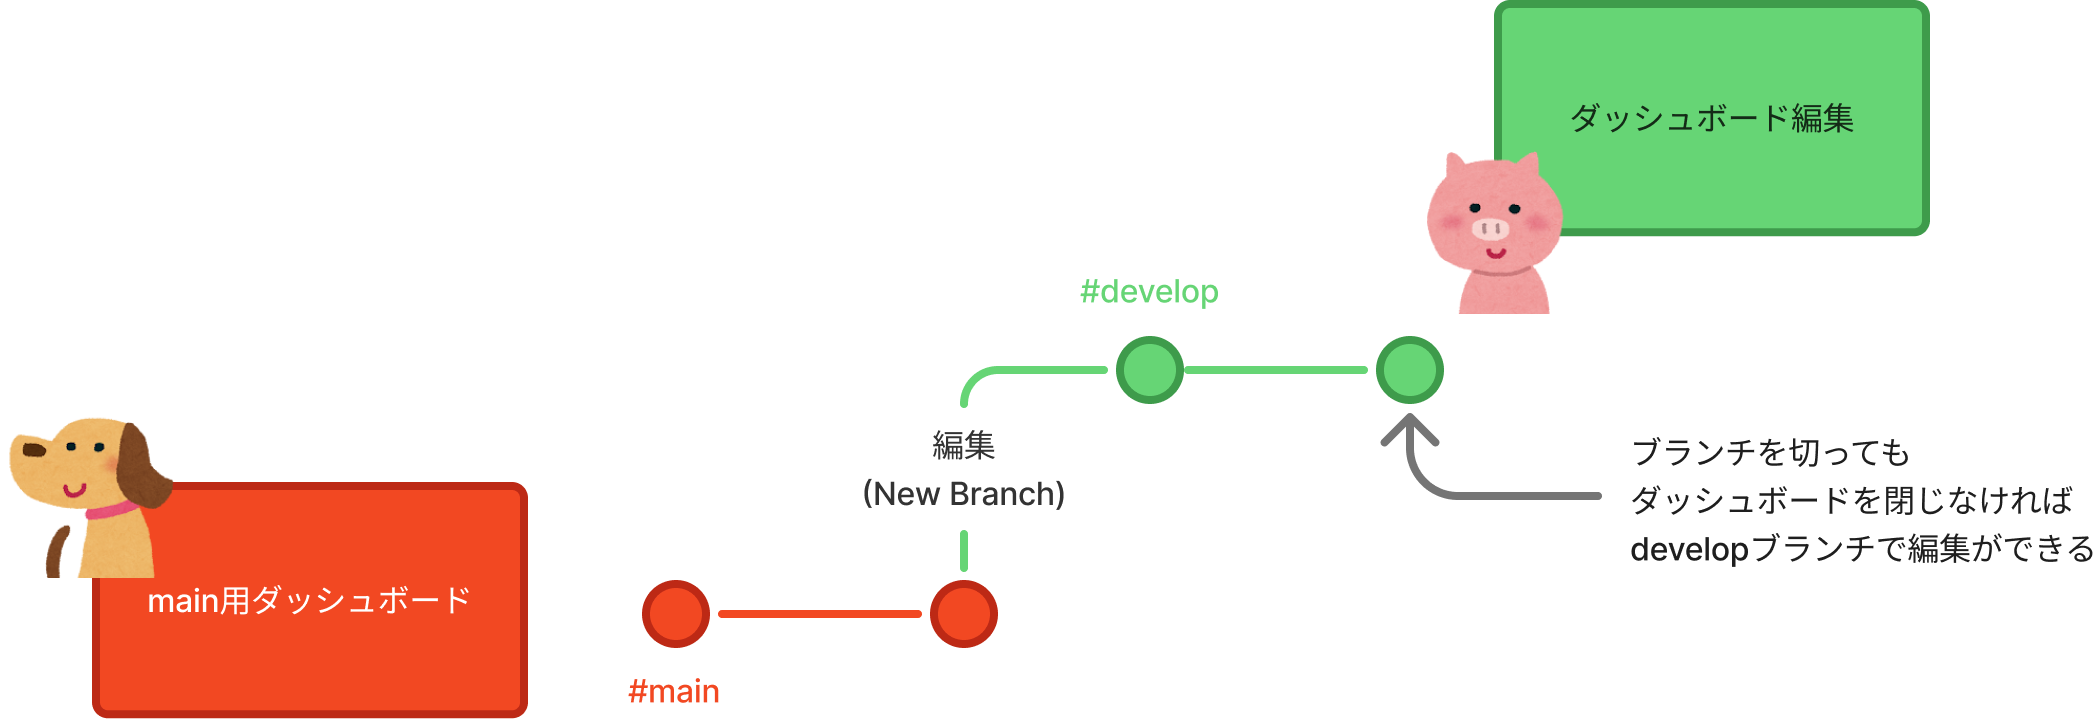
However, as demonstrated initially, you can edit the dashboard if you leave the new branch created.
Once you close the dashboard, you cannot reopen the dashboard from the new branch, so be careful.
(If you really need to reproduce the dashboard being modified, you could copy and paste the JSON from GitHub.)
 ## My Branch Management Approach
Currently, I was unable to switch dashboards per branch.
Therefore, I thought it might be difficult to develop while managing multiple branches.
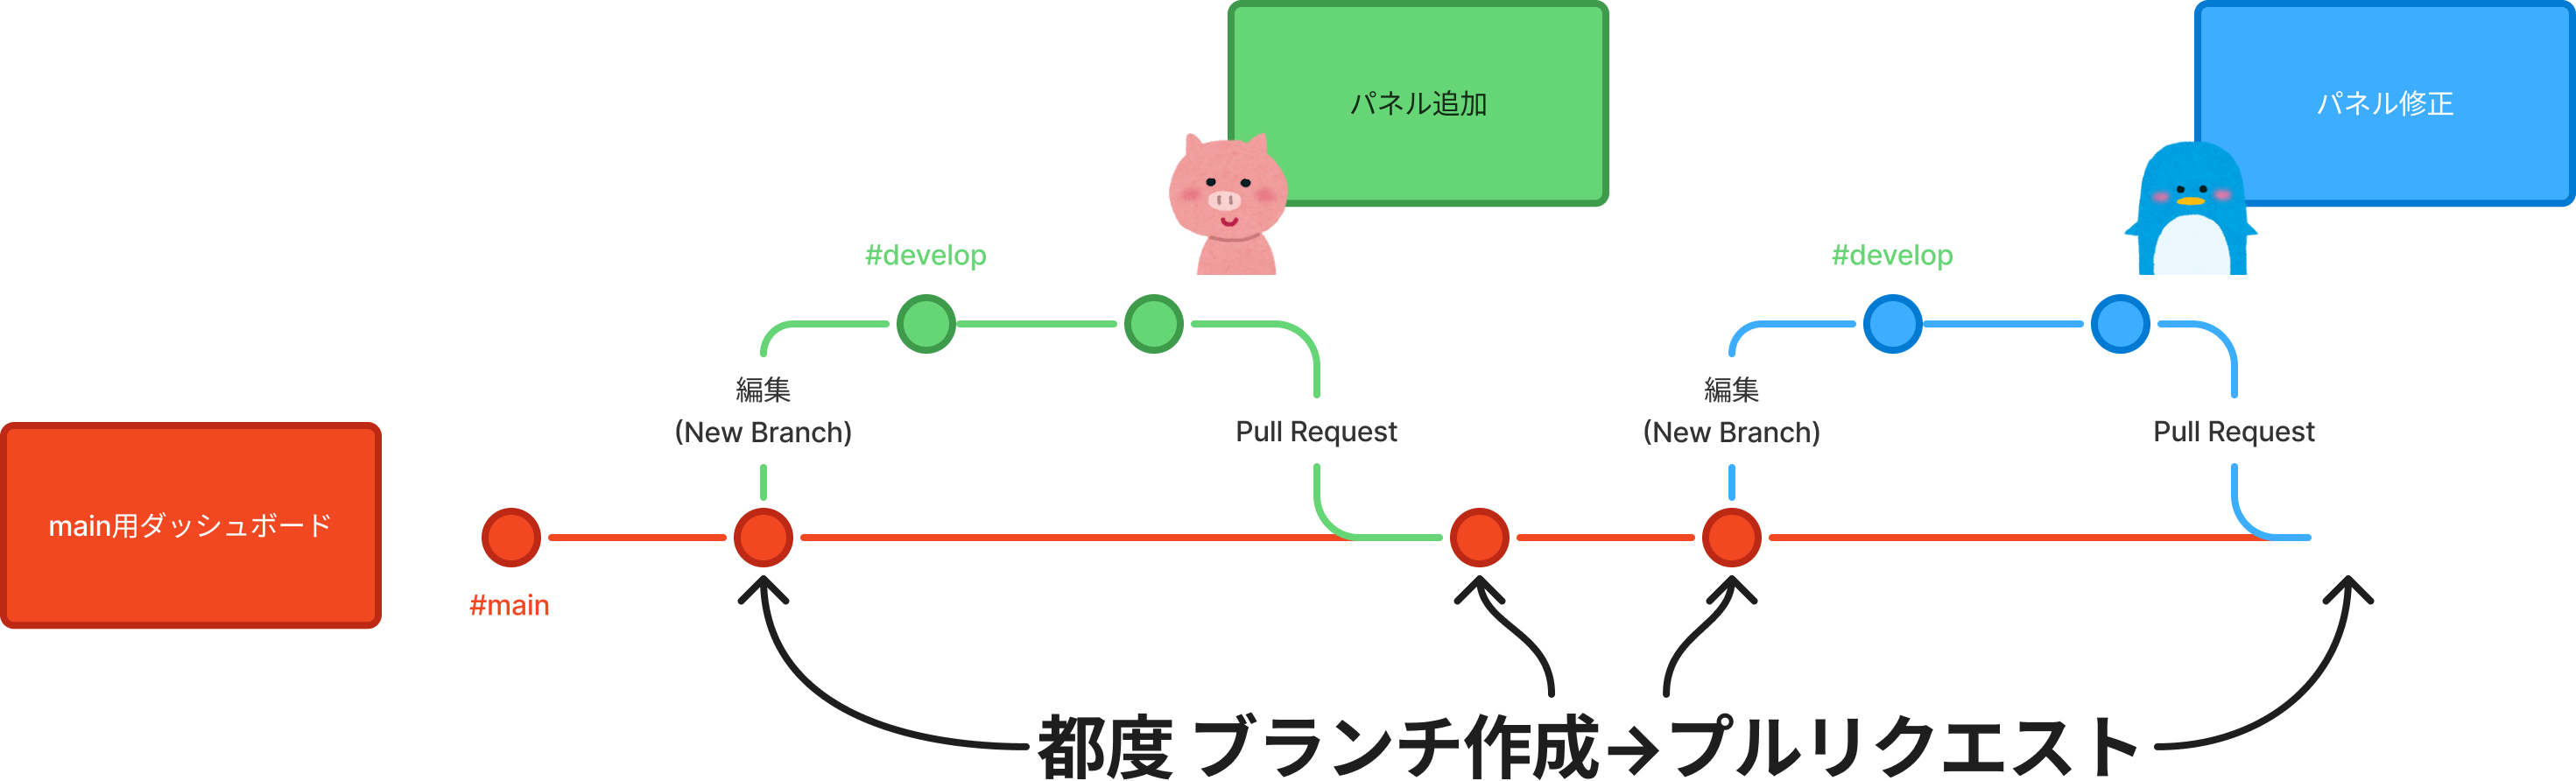
My current approach is not to create multiple branches for each feature addition or fix, but rather to create a new branch from the main branch each time, and then submit a pull request at a convenient point when the work is complete.
Summary
This time I tried using Grafana's Git Sync to create branches and modify dashboards. It seems that dashboards are not currently created for each branch, so I feel that some creativity is needed in how to use this feature.
I hope that in the future, features to switch branches will be added.
Also, although I couldn't try it this time, I think that the feature to embed dashboard preview images in pull requests using the Image Renderer plugin could make Git Sync pull requests an important element in dashboard development.
I would like to try this feature and write a blog about it as well.