
I tried using Grafana Git Sync's Dashboard previews in pull requests

Introduction
The Grafana Git Sync feature I wrote about in my blog the other day includes a function called "Dashboard previews in pull requests."
Since there doesn't seem to be an official name for this feature, I'll refer to it as the pull request preview feature in this article.
This feature automatically attaches preview images of dashboard changes to GitHub pull requests, allowing you to check the changes before applying them to the dashboard in the main branch - it's a wonderful feature!
Since I unexpectedly struggled with the setup, I'll describe the setup procedure and my actual experience using it.
Setup
Several steps are needed to use the pull request preview feature.
The overall process is as follows:
- Enable Git Sync
- Install Grafana Image Renderer
- Configure Webhook
- Set up ngrok
- Configure GitHub Webhook
Enabling Git Sync
This time we'll enable Git Sync using Docker.
I'll introduce the code details in the next section.
For information on how to enable Git Sync on a local instance, please refer to my previous blog post.
https://dev.classmethod.jp/articles/grafana-v12-git-sync/## Installing Grafana Image Renderer
Grafana Image Renderer is a plugin that automatically renders Grafana panels as PNG images.
It is used for sharing panel images or creating dashboard reports.
Although it appears in the Grafana plugins list, it cannot be enabled from there and needs to be installed separately.
For installation methods, please check the install section of the plugin.
This time, I wanted to prepare an environment together with Git Sync, so I built everything using Docker.
The directory structure is simple.
			├── config
│   └── grafana.ini
└── docker-compose.yml
In the docker-compose.yml file, we configure the settings needed for Git Sync and Image Renderer.
			services:
  renderer:
    image: grafana/grafana-image-renderer:latest
    container_name: grafana-image-renderer
    restart: unless-stopped
    ports:
      - "8081:8081"
    networks:
      - grafana

  grafana:
    image: grafana/grafana:12.1.0-ubuntu
    container_name: grafana
    restart: unless-stopped
    ports:
      - "3000:3000"
    environment:
      # Git Sync feature toggles
      - GF_FEATURE_TOGGLES_PROVISIONING=true
      - GF_FEATURE_TOGGLES_KUBERNETESDASHBOARDS=true
      # Image Renderer configuration
      - GF_RENDERING_SERVER_URL=http://renderer:8081/render
      - GF_RENDERING_CALLBACK_URL=http://grafana:3000/
    volumes:
      - grafana-storage:/var/lib/grafana
      - grafana-logs:/var/log/grafana
      - ./config/grafana.ini:/etc/grafana/grafana.ini
    depends_on:
      - renderer
    networks:
      - grafana

volumes:
  grafana-storage:
    driver: local
  grafana-logs:
    driver: local

networks:
  grafana:
    driver: bridge
The grafana.ini file will be needed later when setting up ngrock.
# ngrok URL
root_url = https://xxxxxxxxxxxx.ngrok-free.app
```## Webhook Configuration
The pull request preview feature hooks into pull requests to generate images using the Image Renderer plugin.
When generating images from GitHub's Webhook with the Image Renderer plugin, the Webhook needs to access the local Grafana instance, but it cannot access it directly.
Therefore, to access the local Grafana instance, we will create an endpoint that connects the Webhook and the local Grafana instance.
We will use [ngrok](https://ngrok.com/), which is introduced in the official documentation, as the endpoint.
By using ngrok, you can generate a URL to directly receive Webhooks on your locally hosted Grafana instance.
### ngrok Account Registration
https://ngrok.com/
Register an account from signup.### Get auth token
Select Your Authtoken and copy the displayed token.
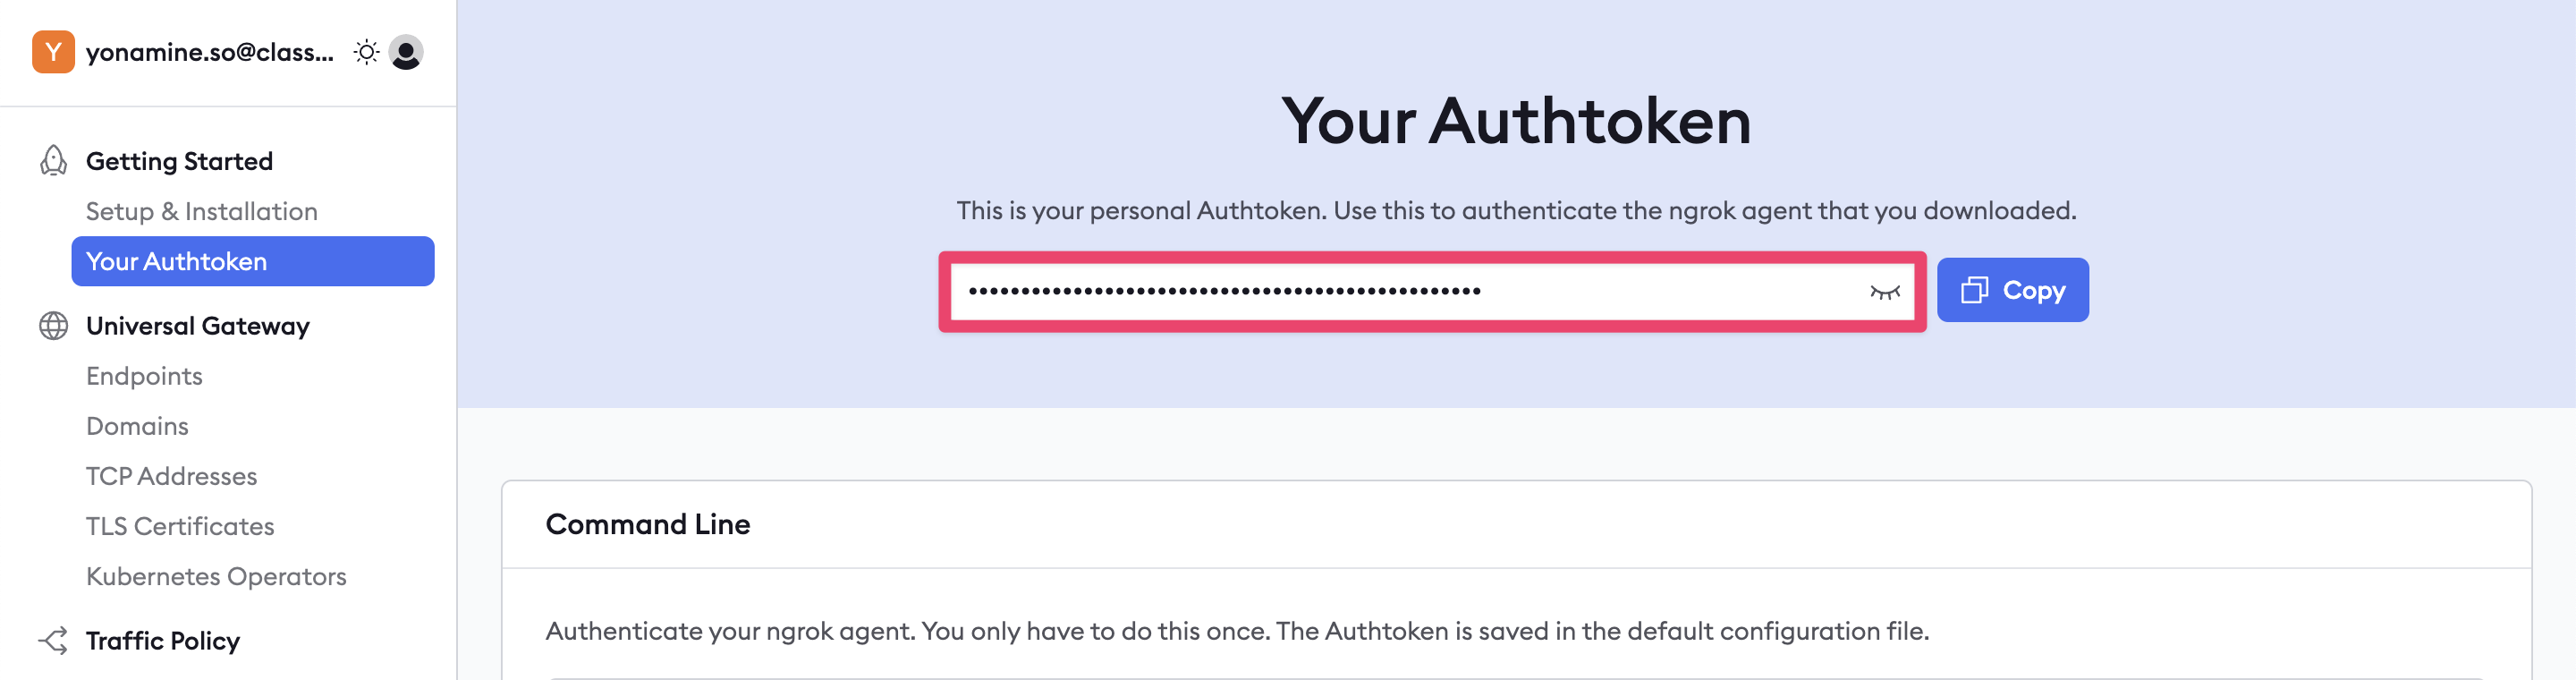
Set the authentication token with the following command.
ngrok config add-authtoken $YOUR_AUTHTOKEN
Use ngrok to make port 3000 accessible from the public.
Running the following command will issue a URL corresponding to http://localhost:3000.
Copy the issued URL as we will use it later.
$ ngrok http 3000
🤫 Decouple policy and sensitive data with vaults: https://ngrok.com/r/secrets
Session Status online
Account example@example.com (Plan: Free)
Version 3.26.0
Region Japan (jp)
Latency 66ms
Web Interface http://127.0.0.1:4040
Forwarding https://xxxxxxxxxxxxx.ngrok-free.app -> http://localhost:3000
Connections ttl opn rt1 rt5 p50 p90
0 0 0.00 0.00 0.00 0.00
Let's access the issued URL.
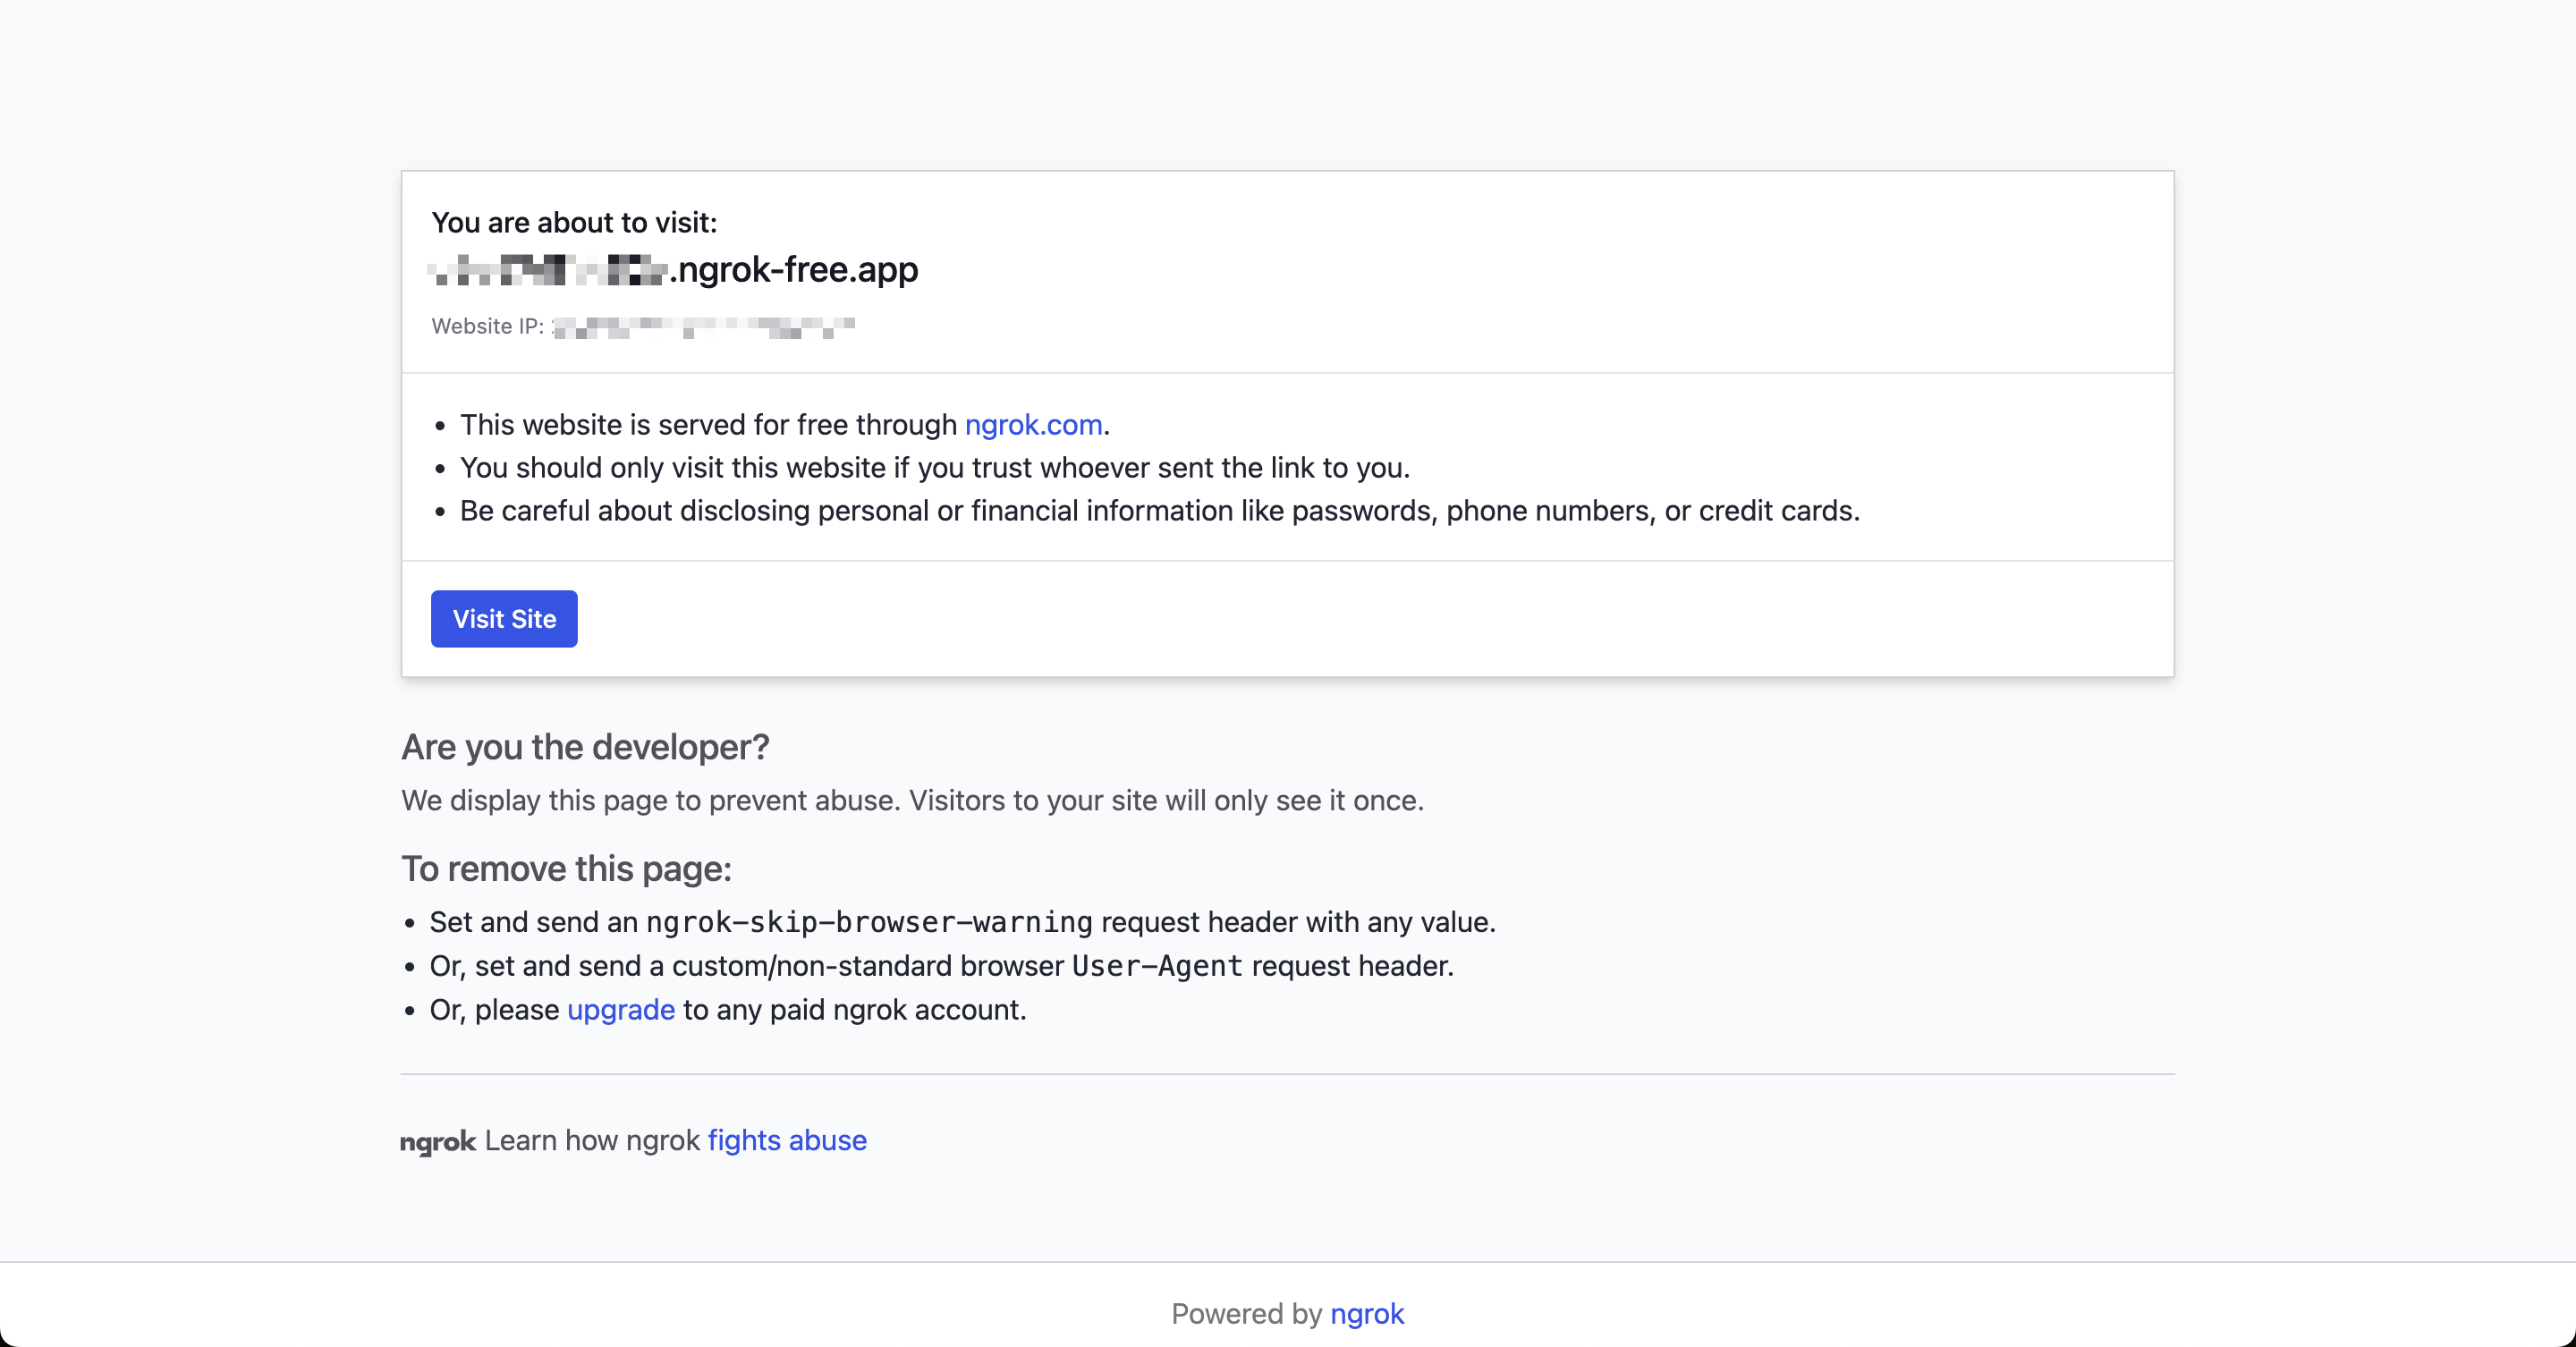
Click "Visit Site" to be forwarded to localhost:3000 and transition to Grafana.
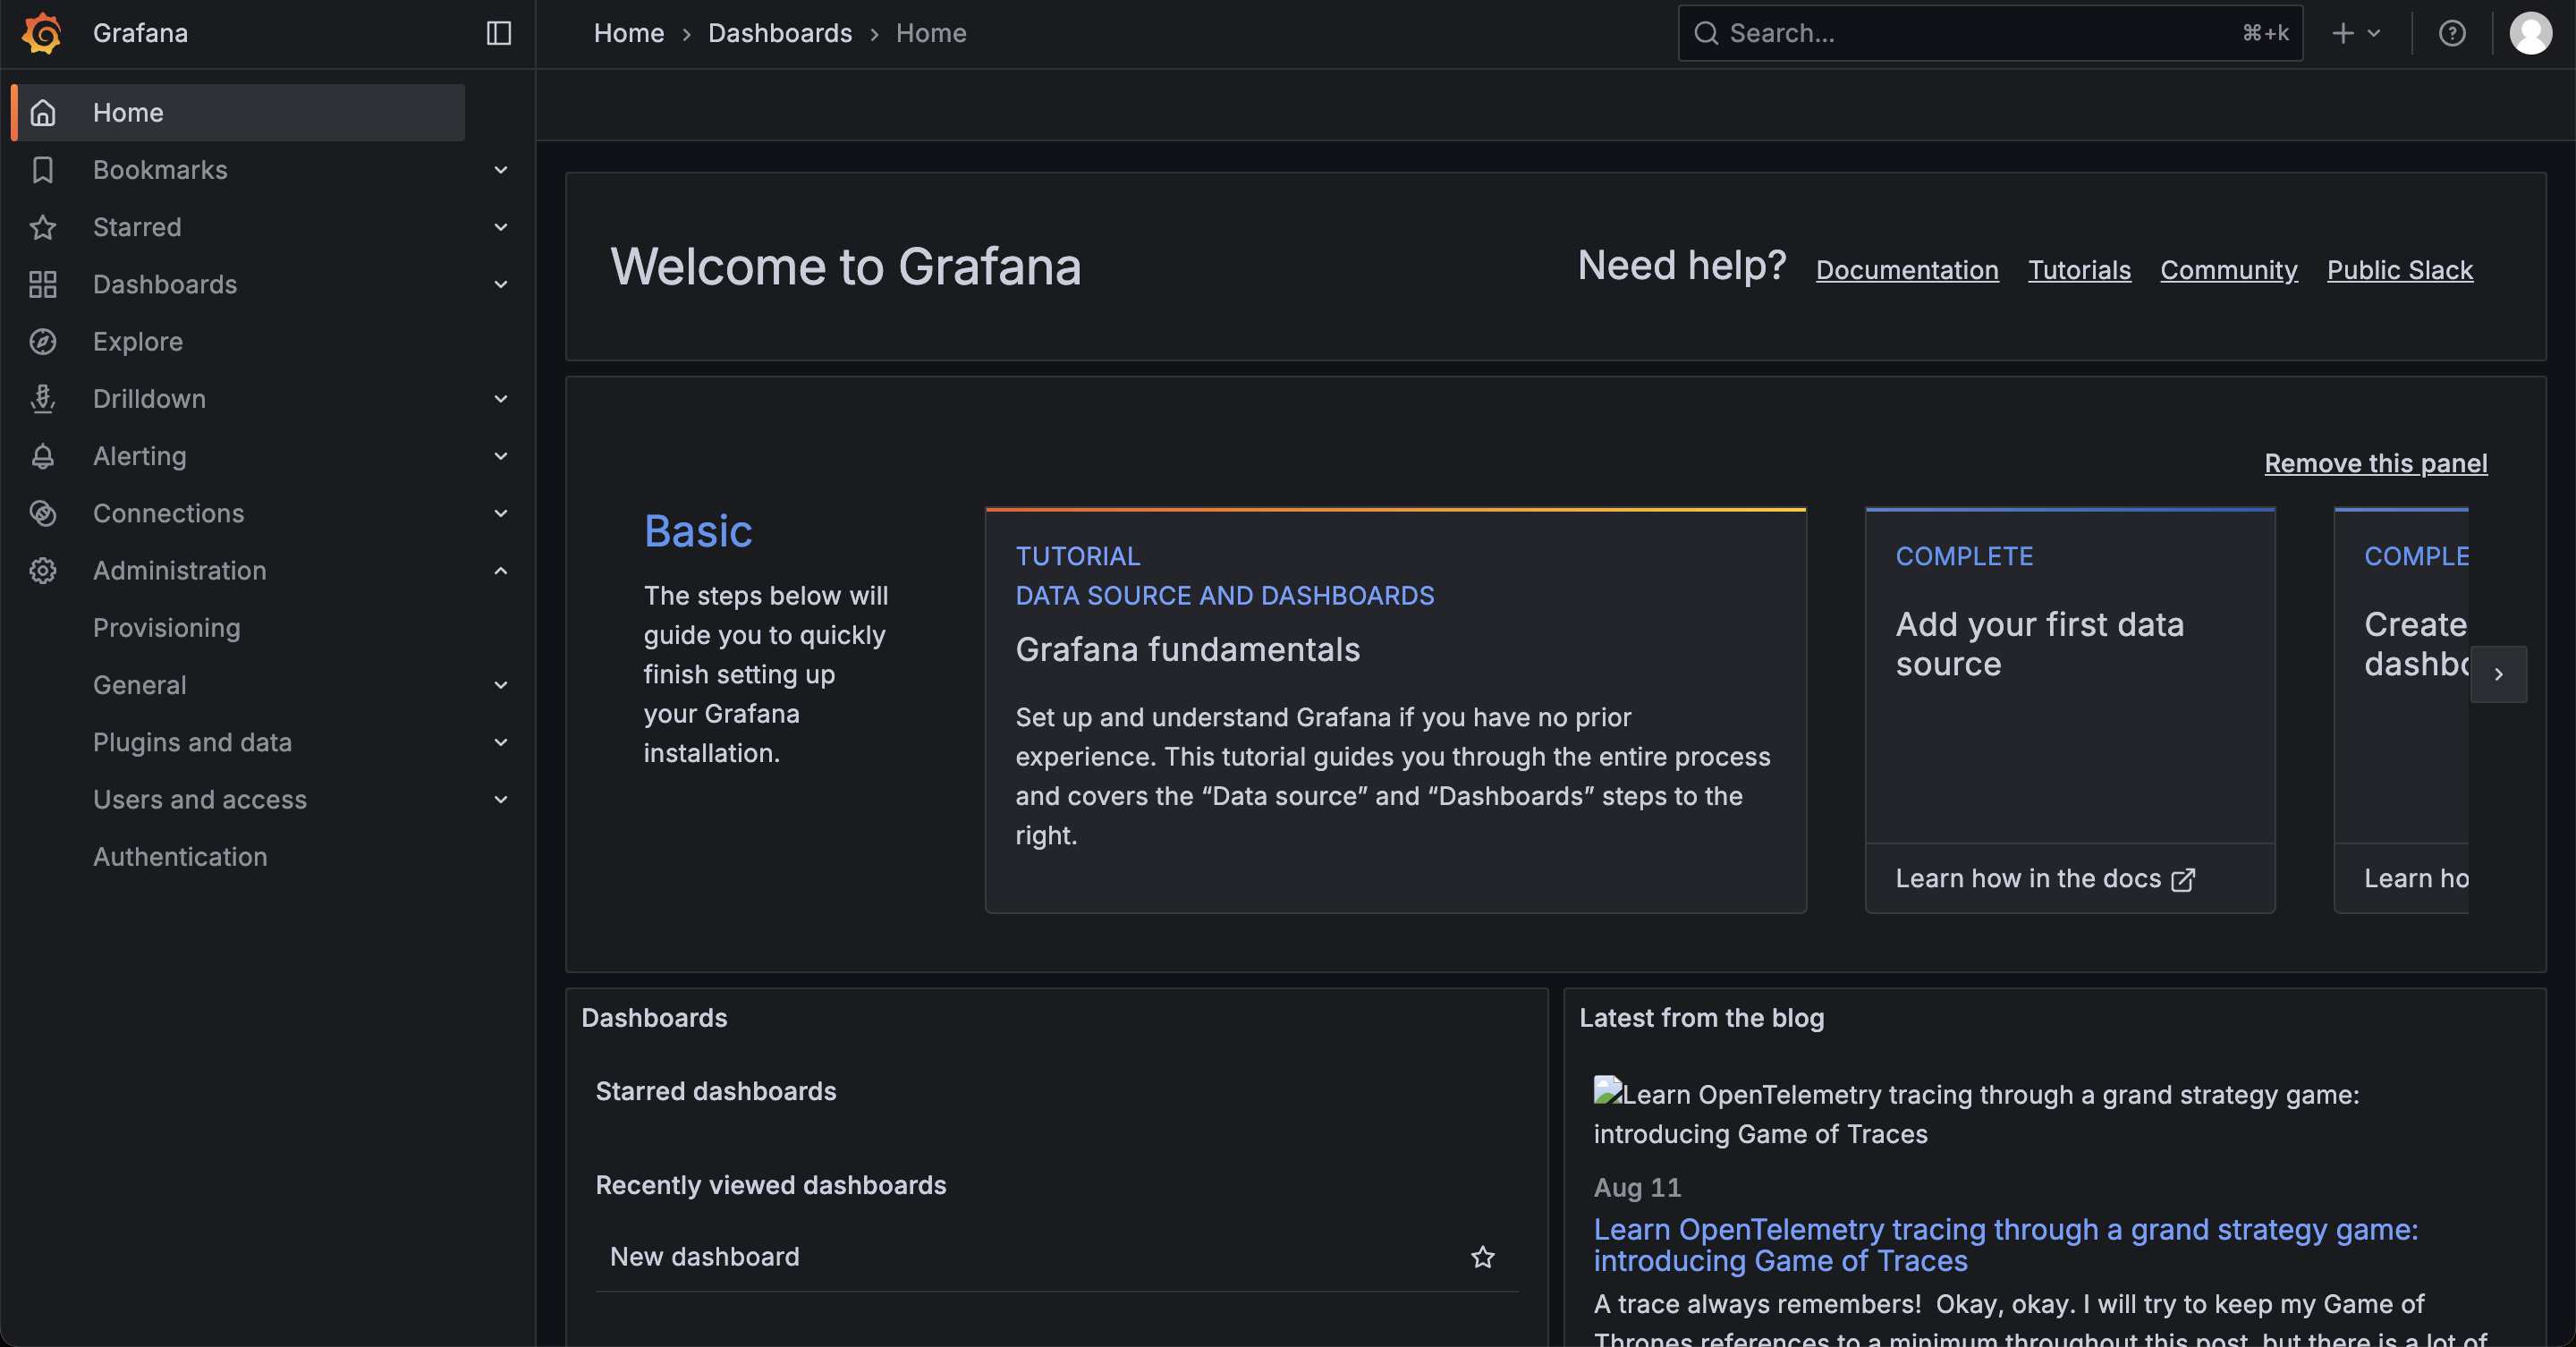
Now Grafana is accessible from the internet.
Let's add the ngrok URL we copied earlier to the root_url in grafana.ini.
ngrok URL
root_url = https://xxxxxxxxxxxx.ngrok-free.app
root_url is the URL used when accessing Grafana from a web browser.### GitHub Webhooks Configuration
Since we issued a URL with ngrok, let's set the URL in GitHub Webhooks.
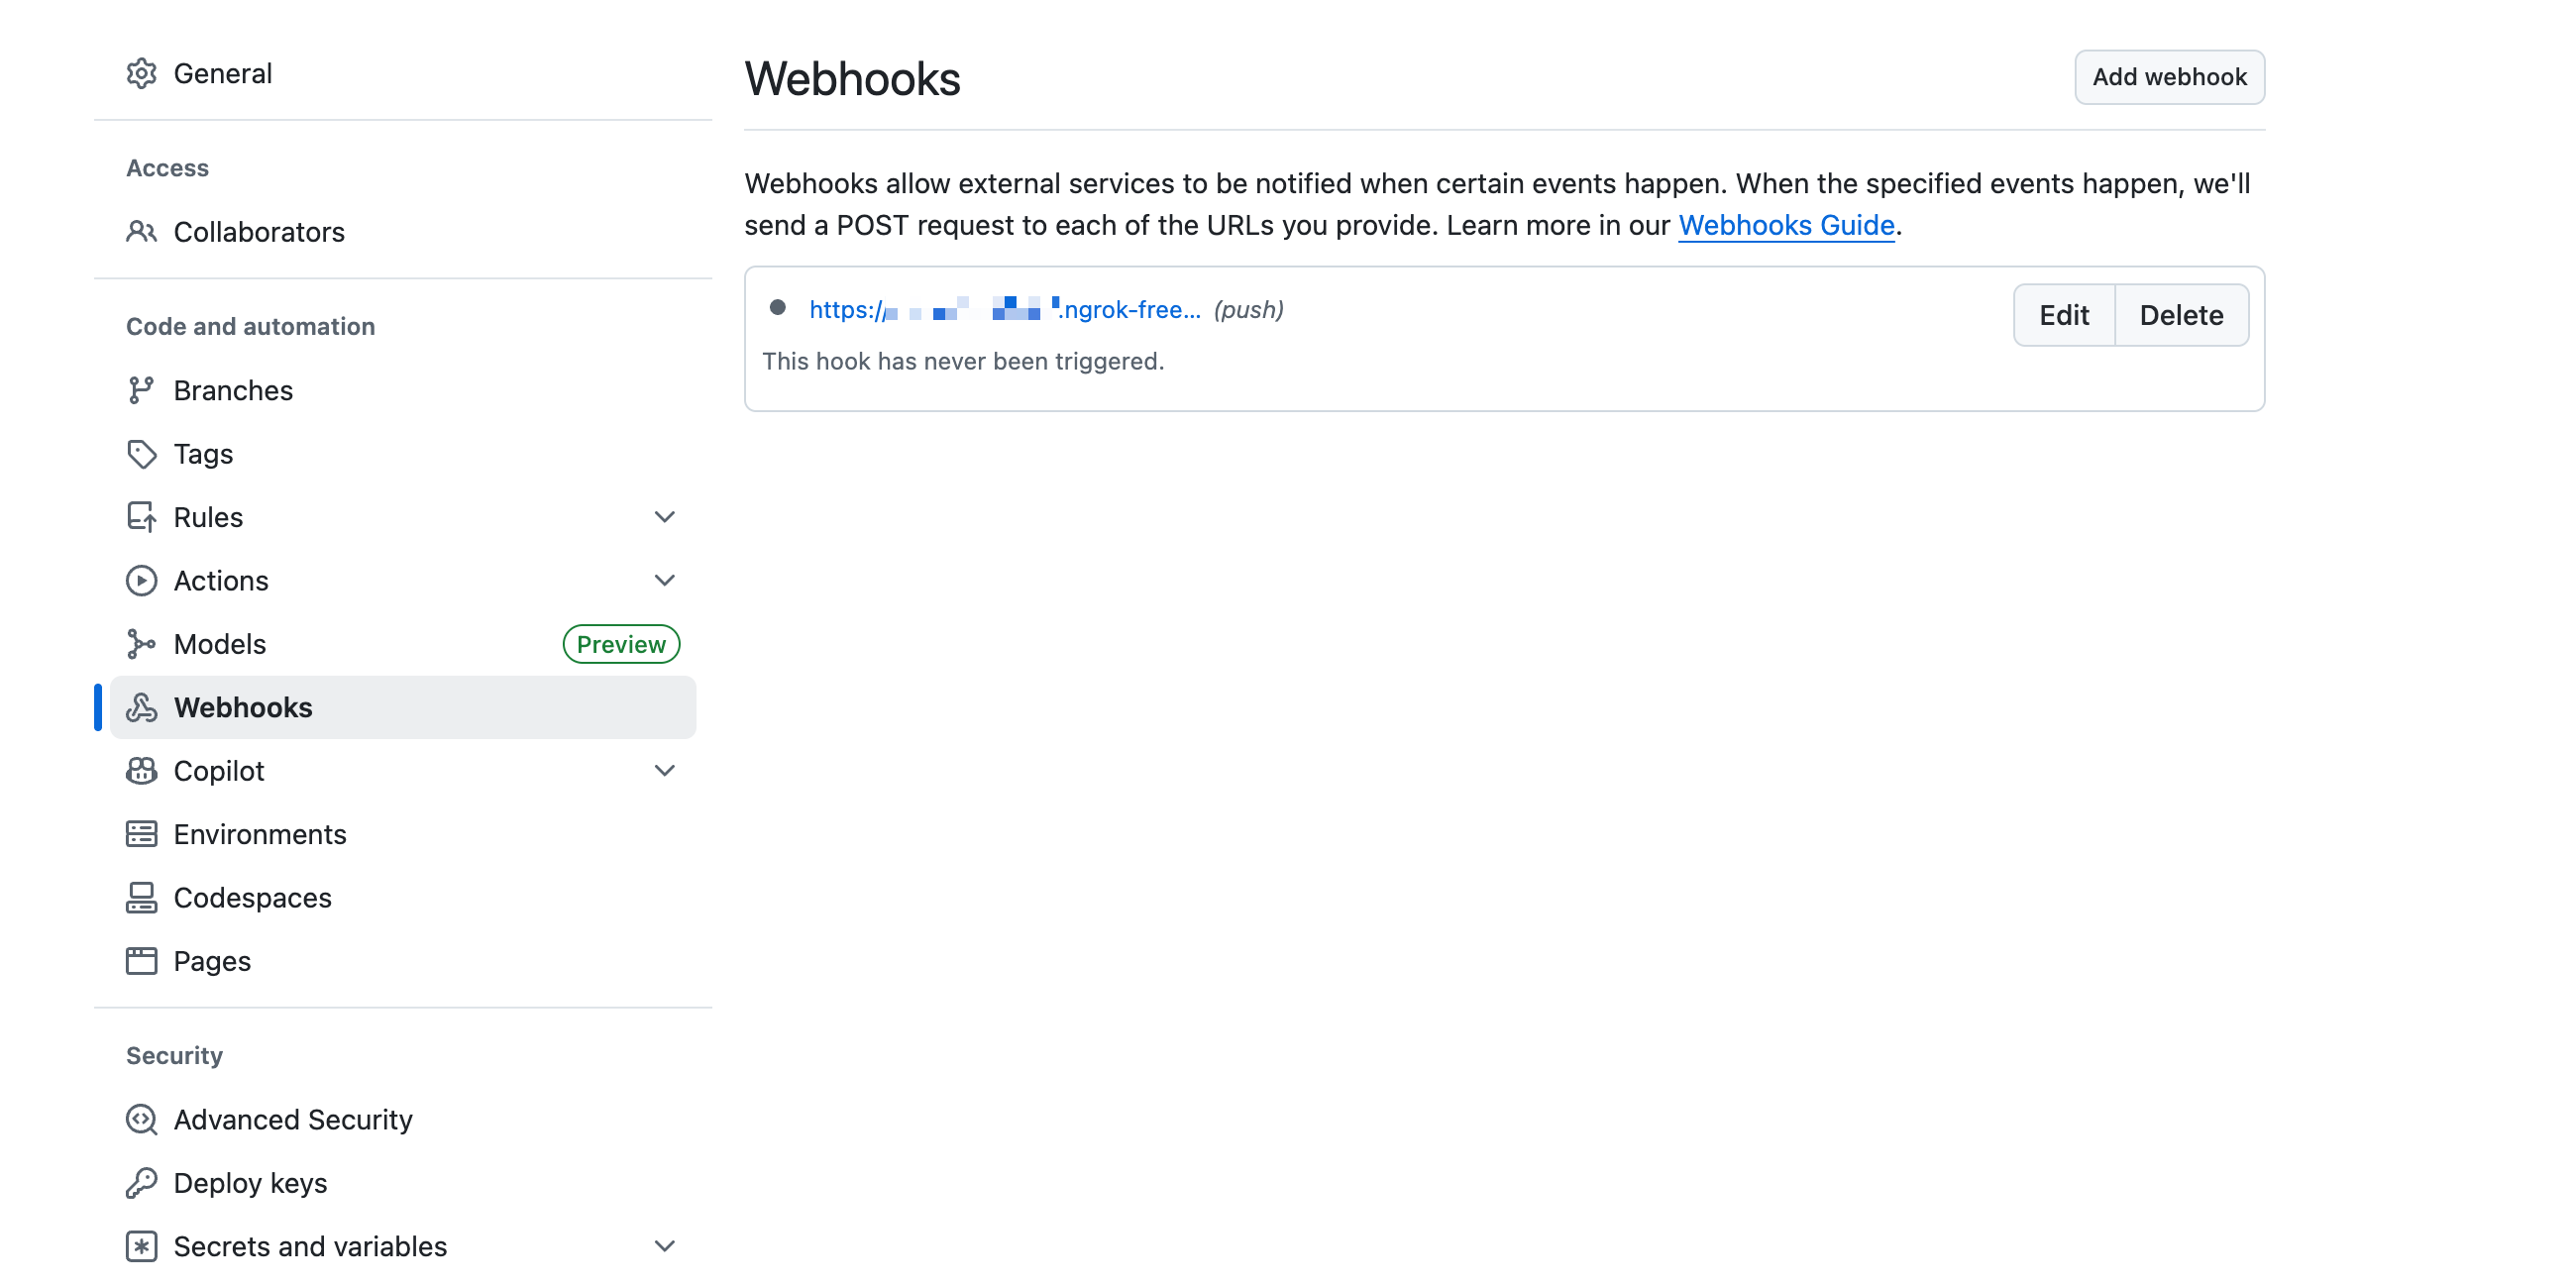
Access the GitHub repository that you will use with the GitSync feature.
Open the target repository on GitHub and select Settings > Webhooks.
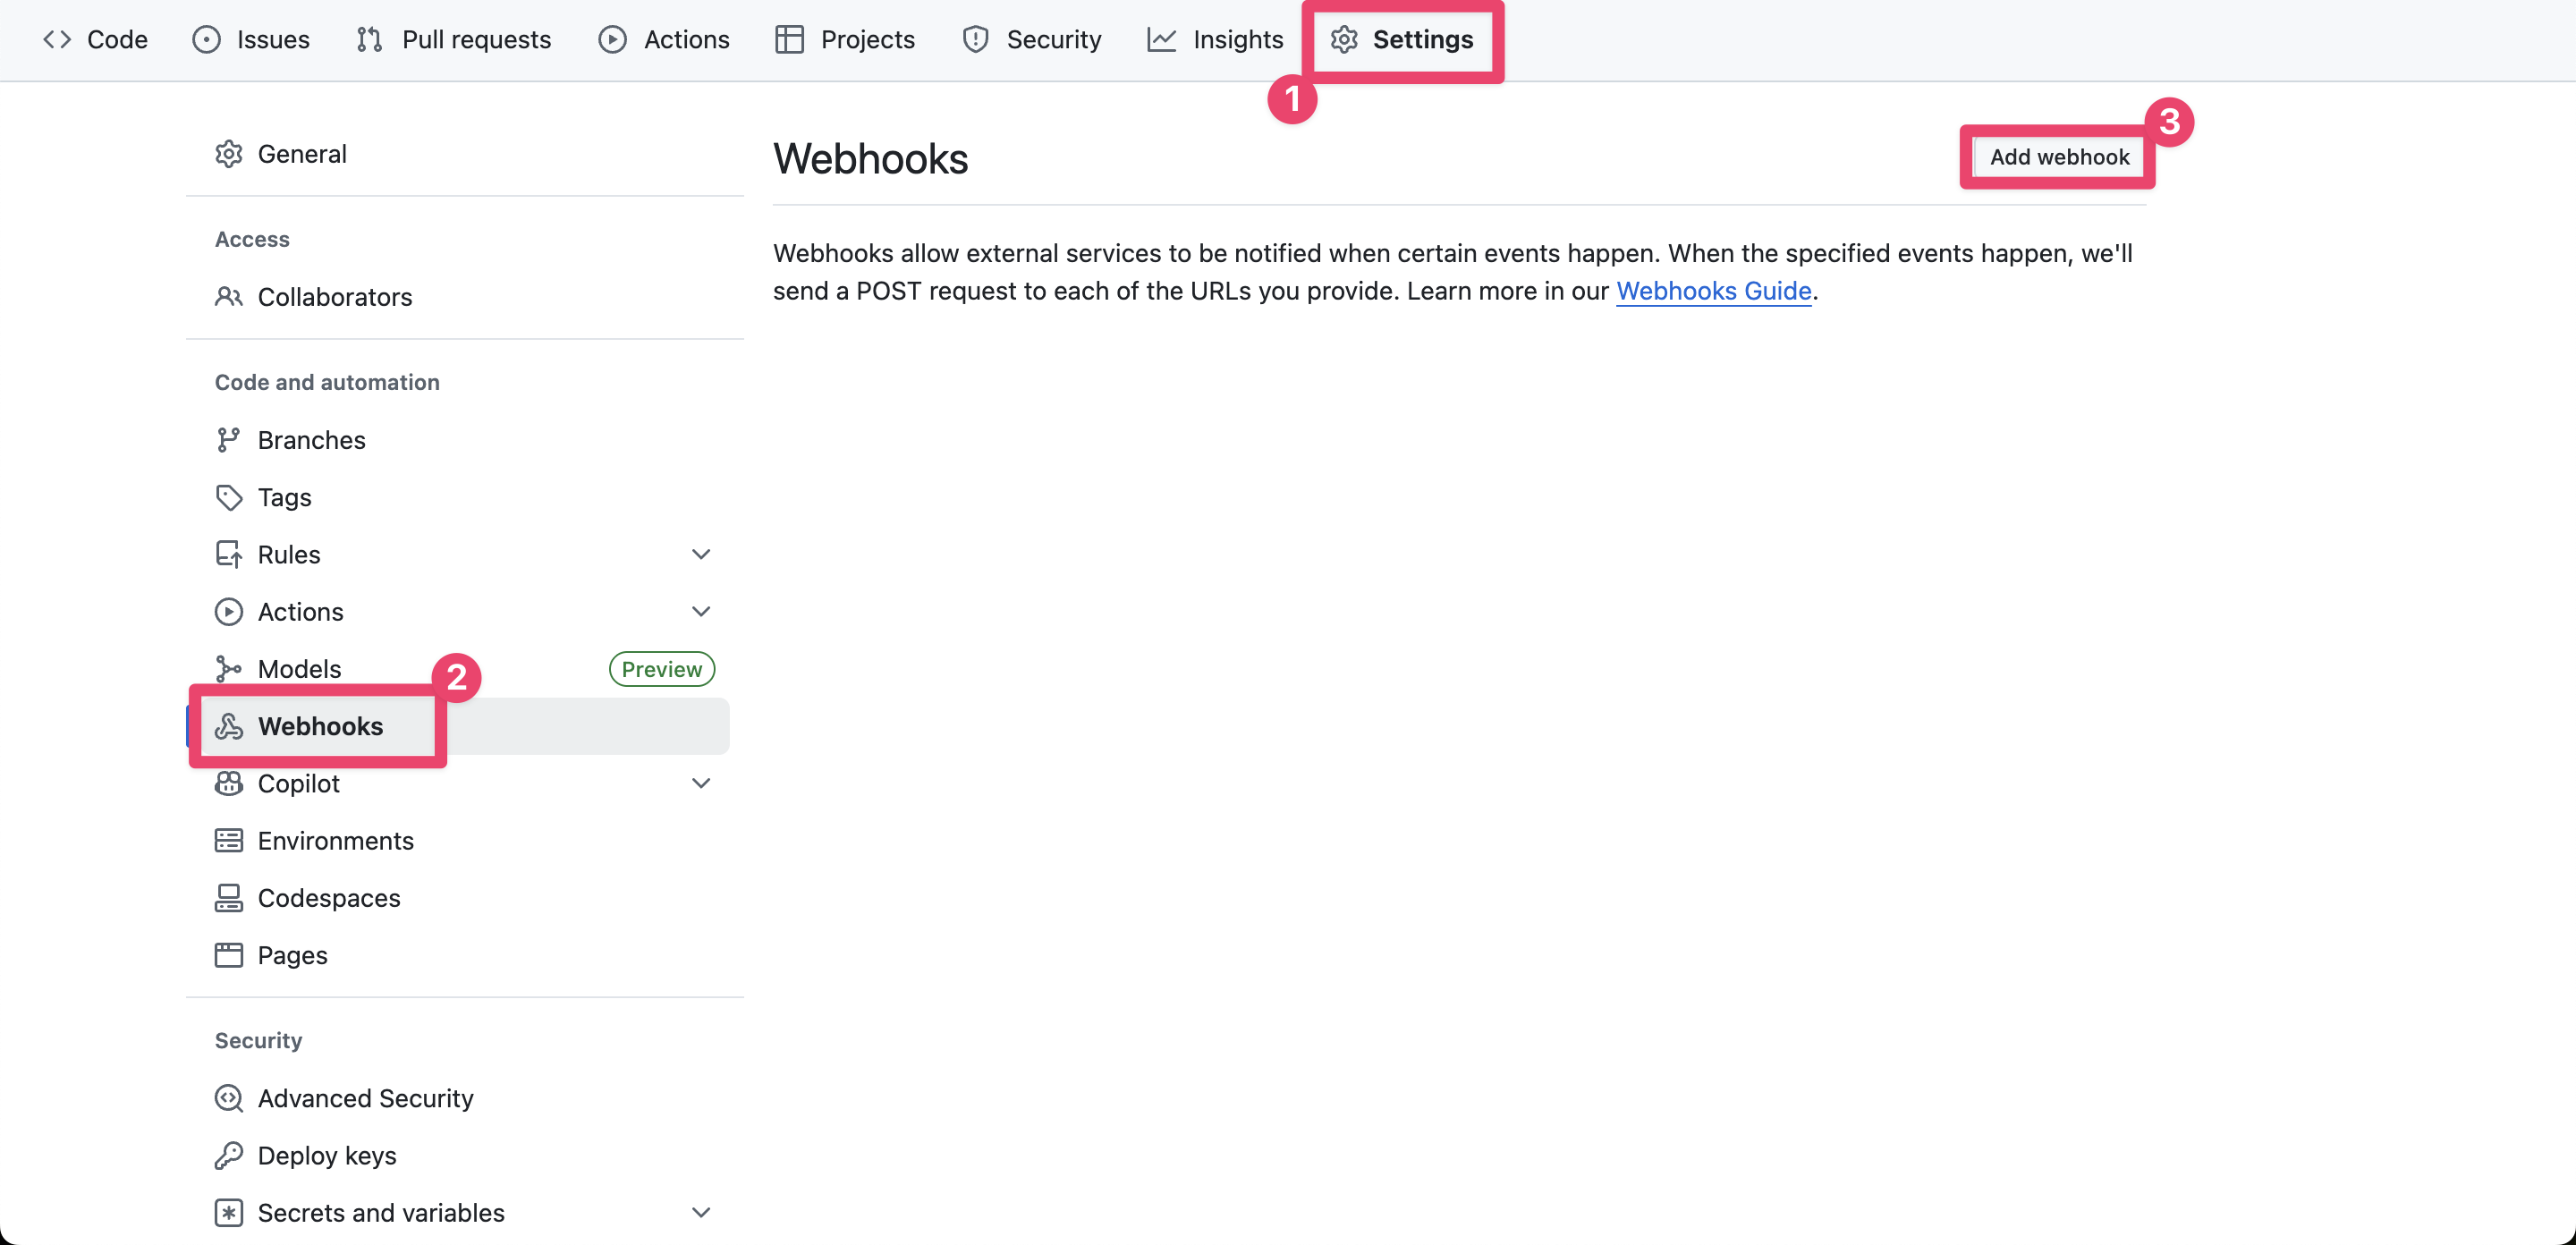
Create a Webhook with the following settings.
For Payload URL, enter `<URL obtained from ngrok>`/api/webhooks/git.
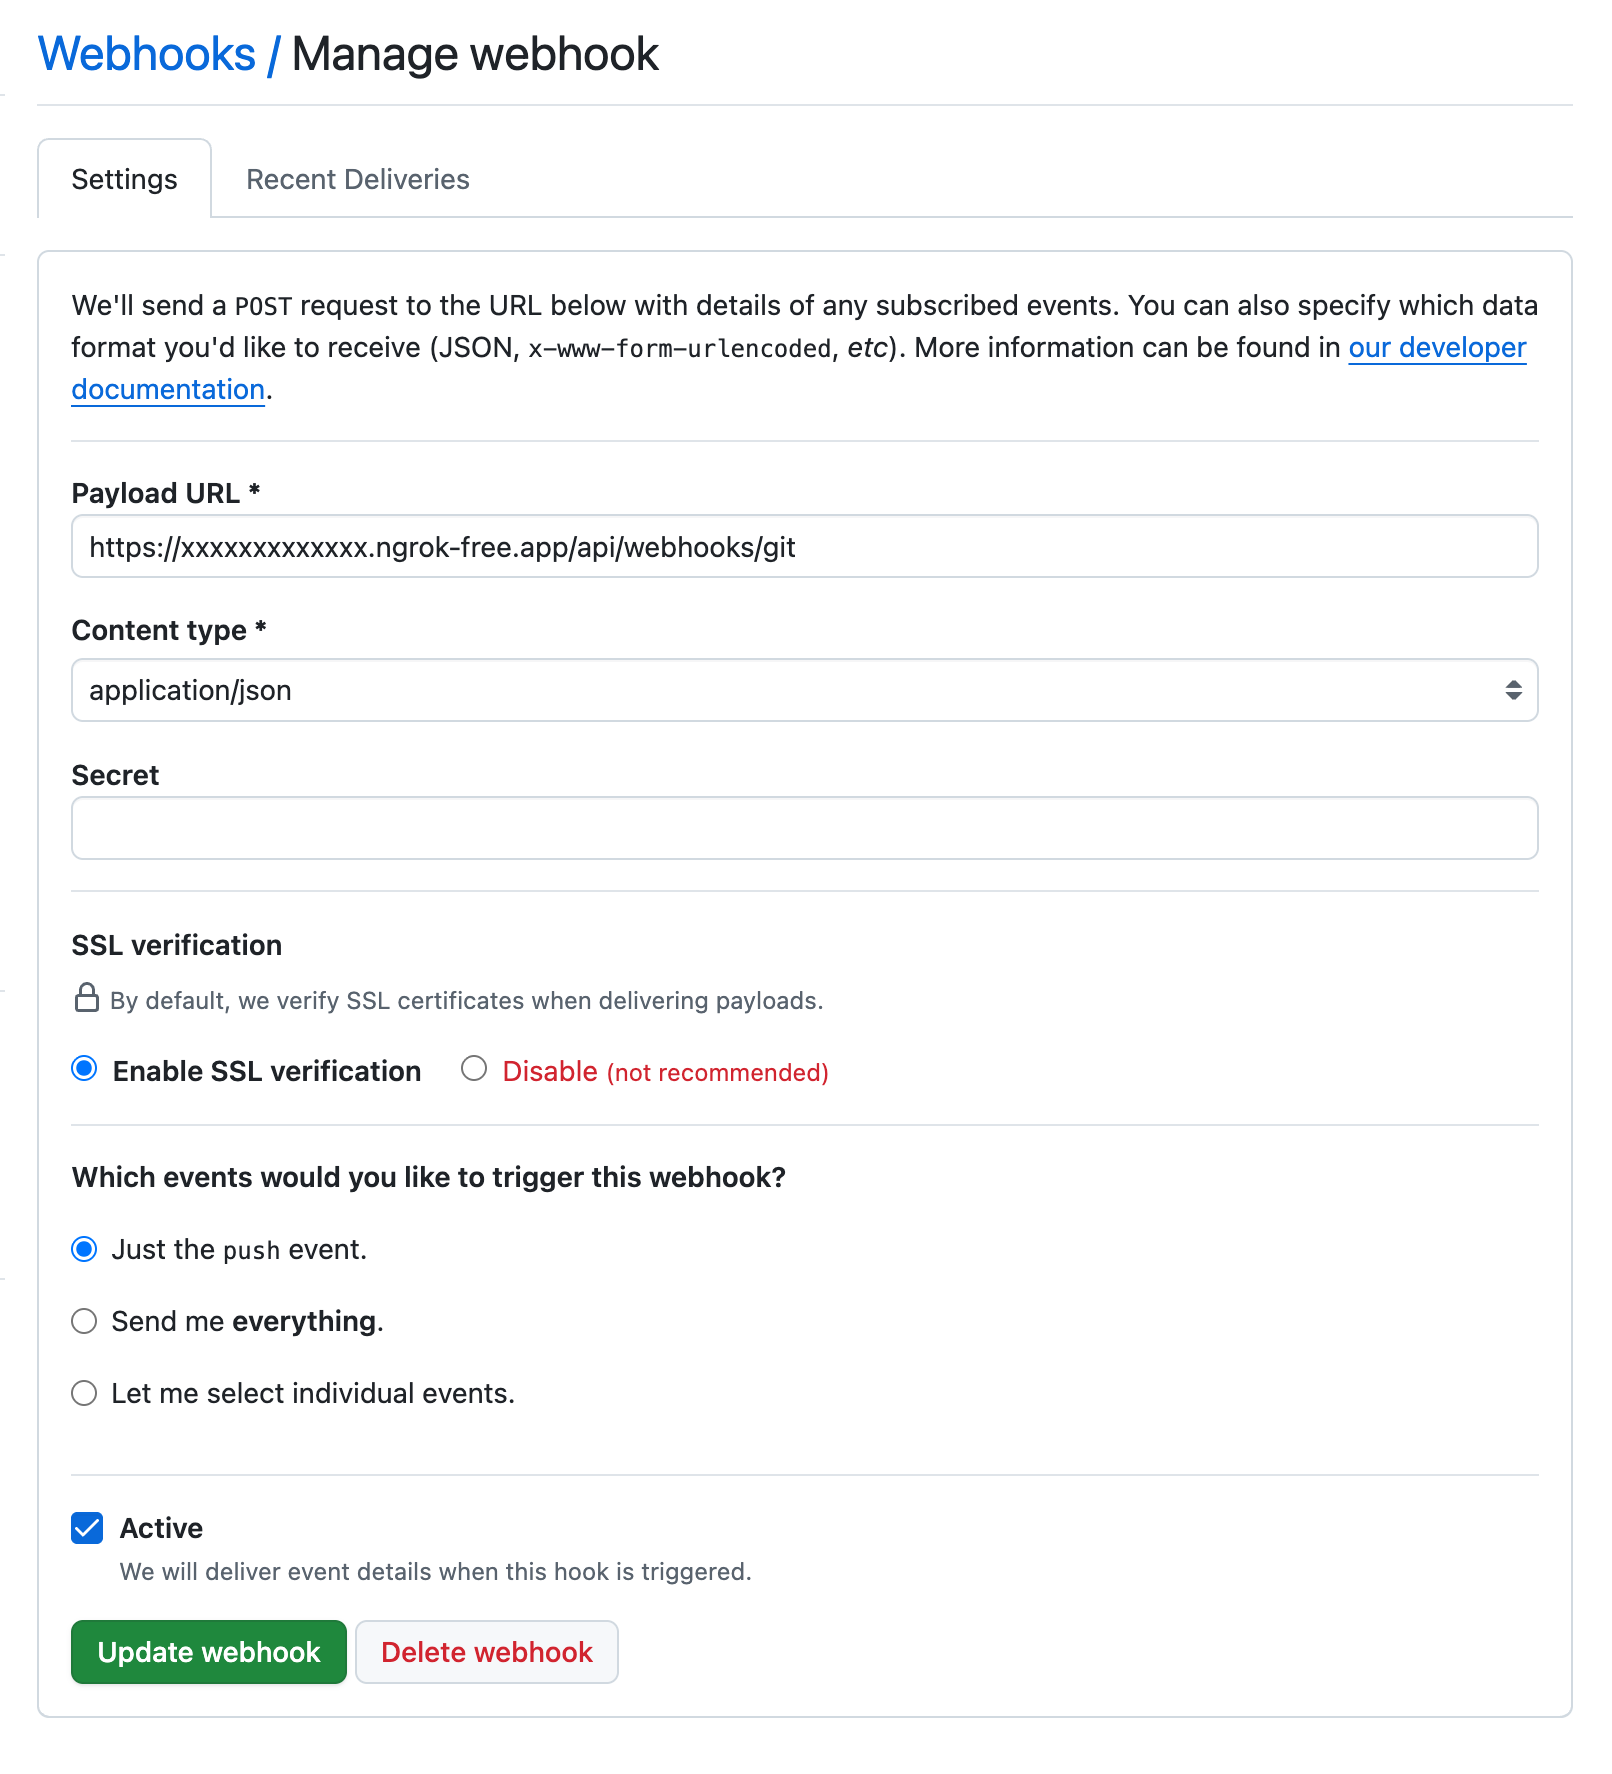
Webhook creation is complete.
## Enable Pull Request Previews
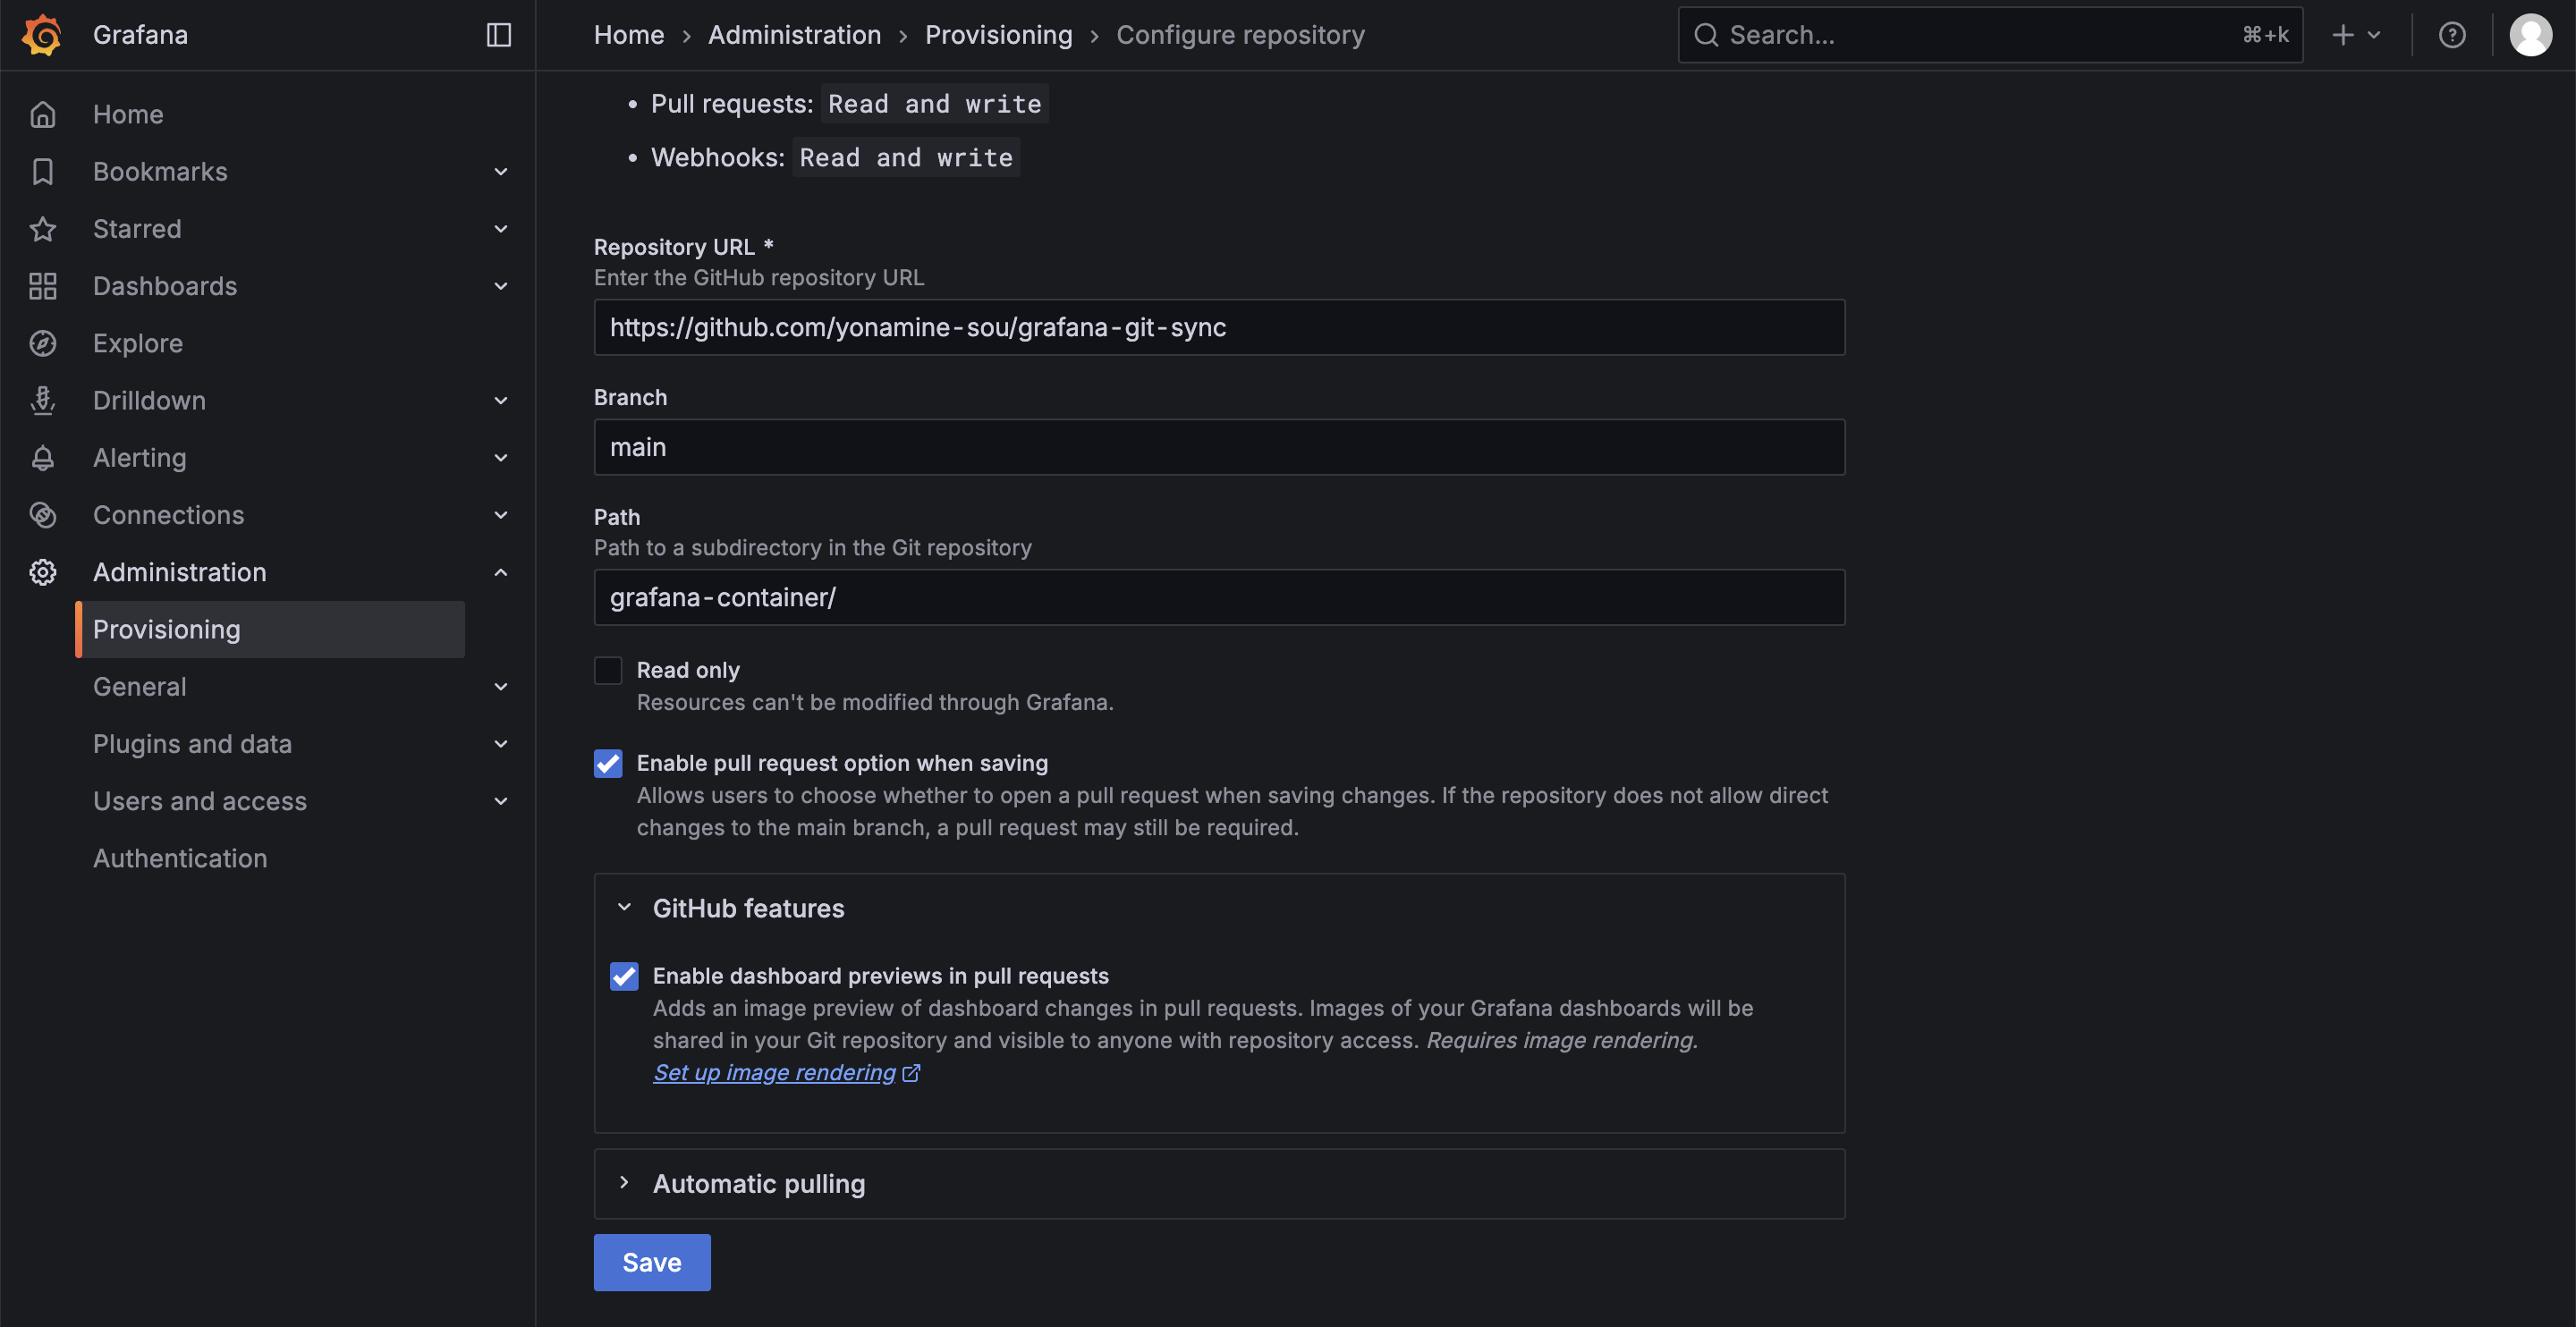
Navigate to Grafana > Administration > Provisioning
Check the `Enable dashboard previews in pull requests` option and save.
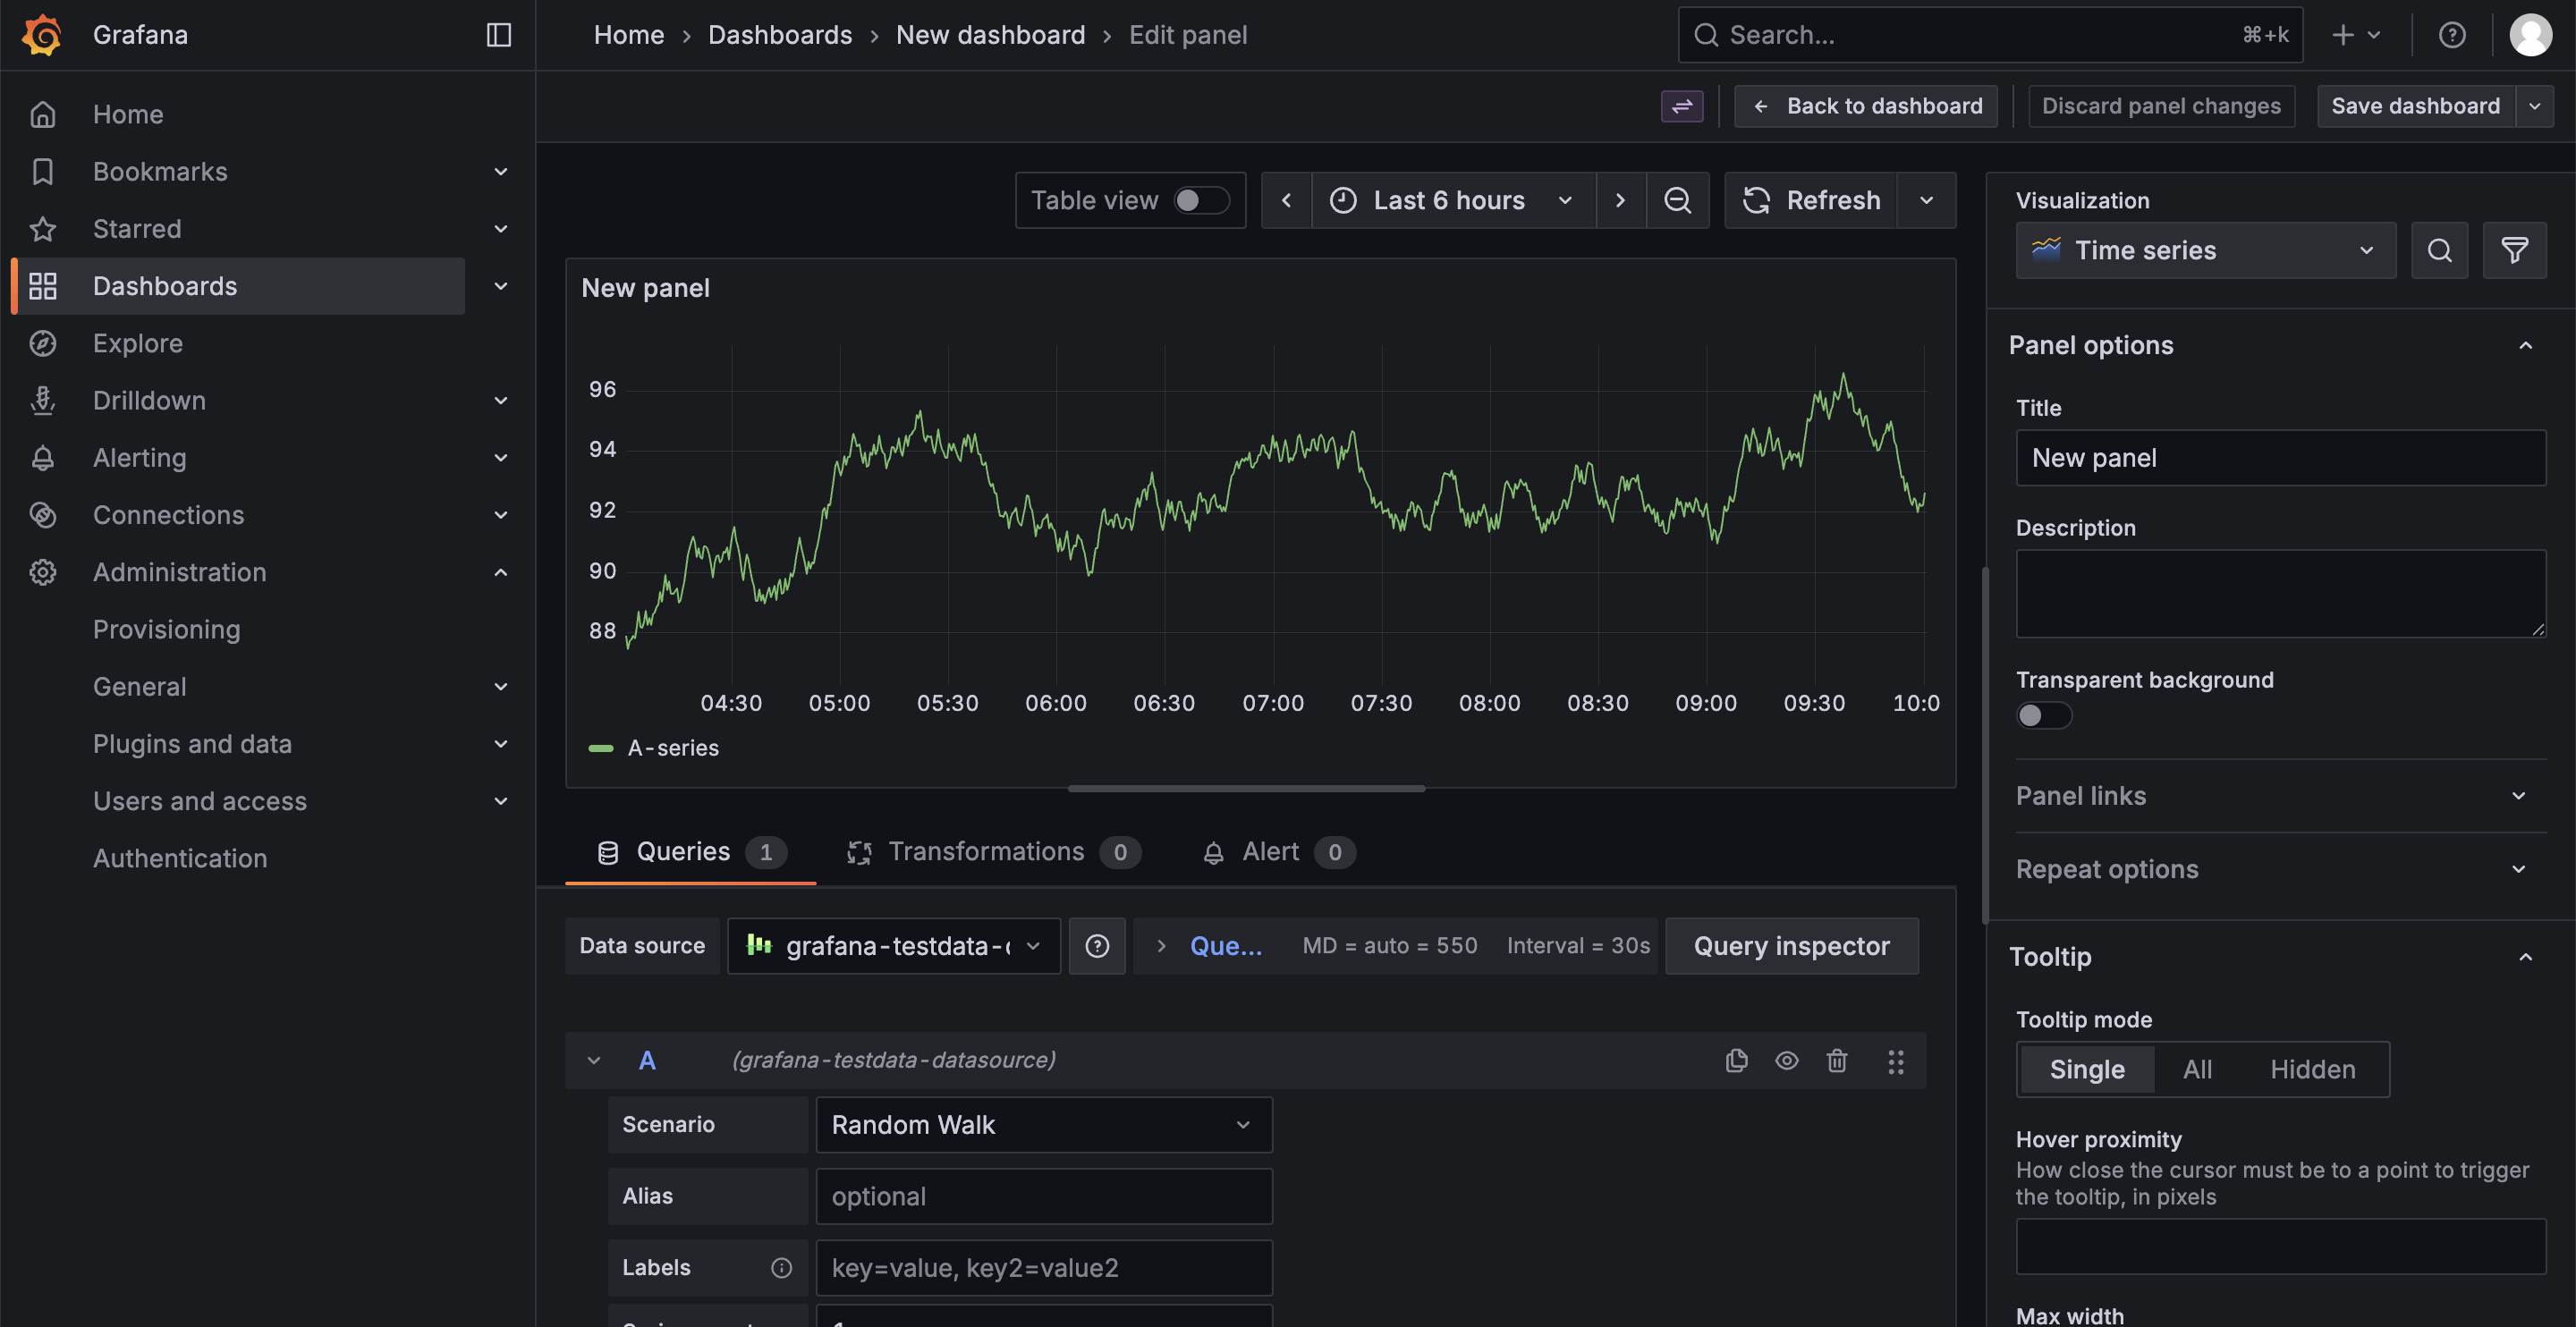
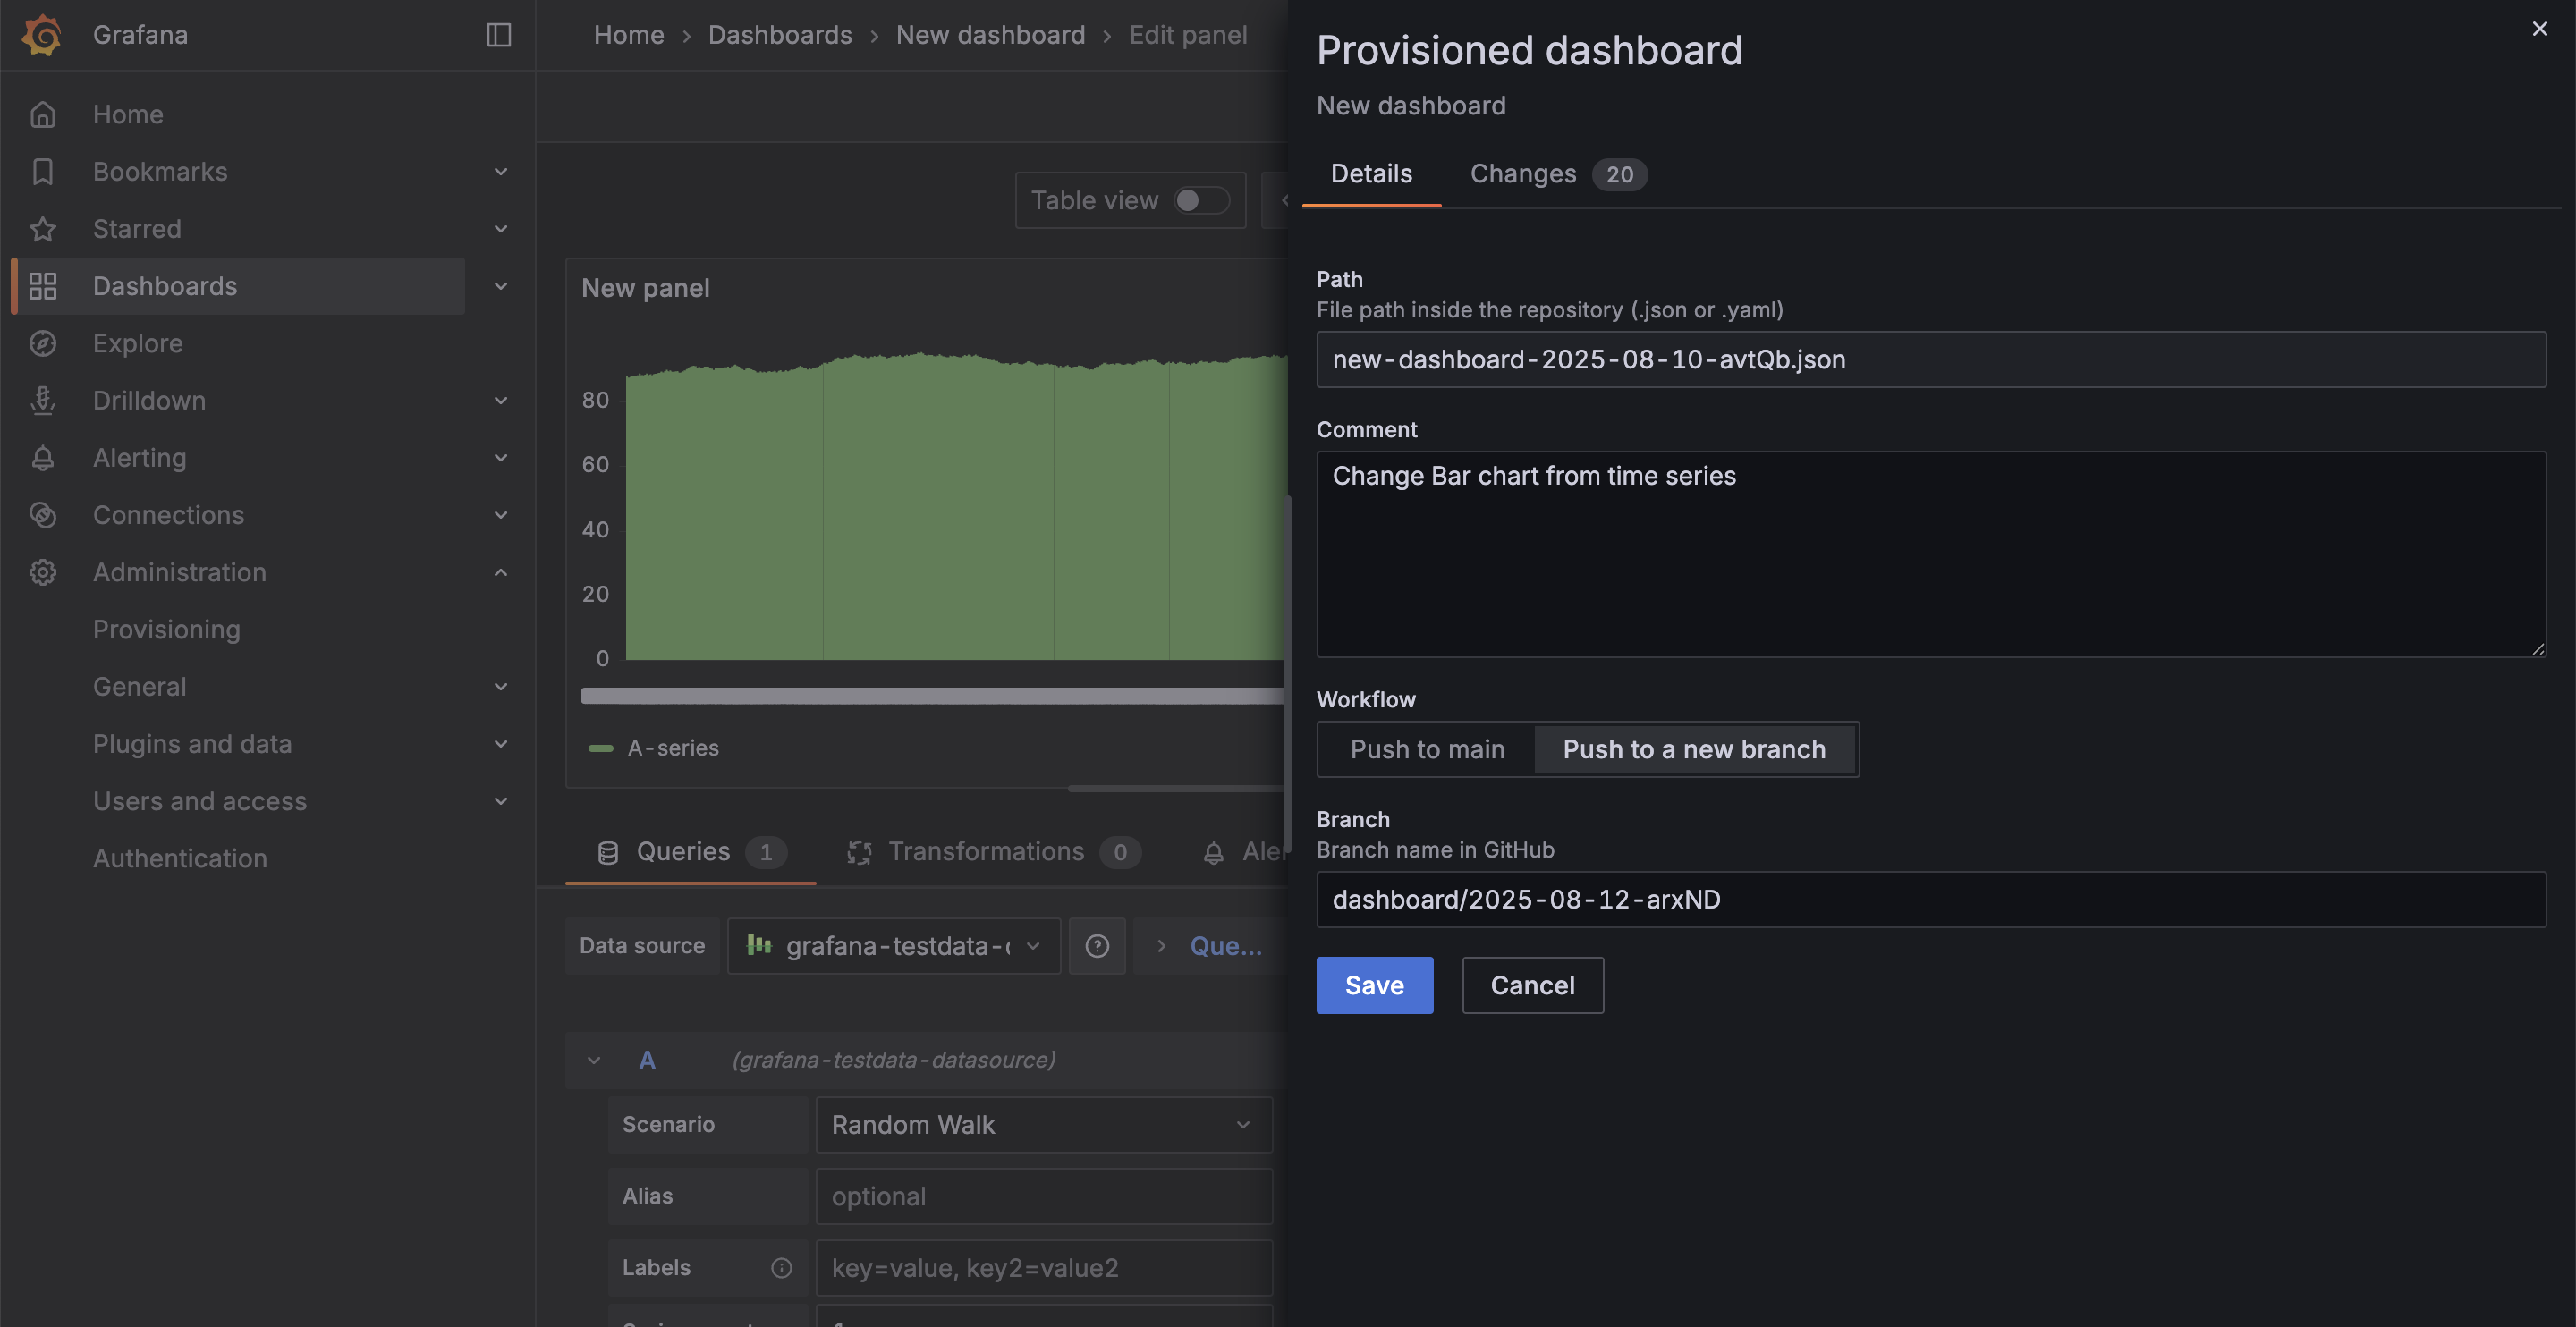
First, create a Time series panel with test data and create the main branch.
Next, change the visualization format to Bar chart and save the dashboard.
When saving, set it up so you can create a branch and submit a pull request.
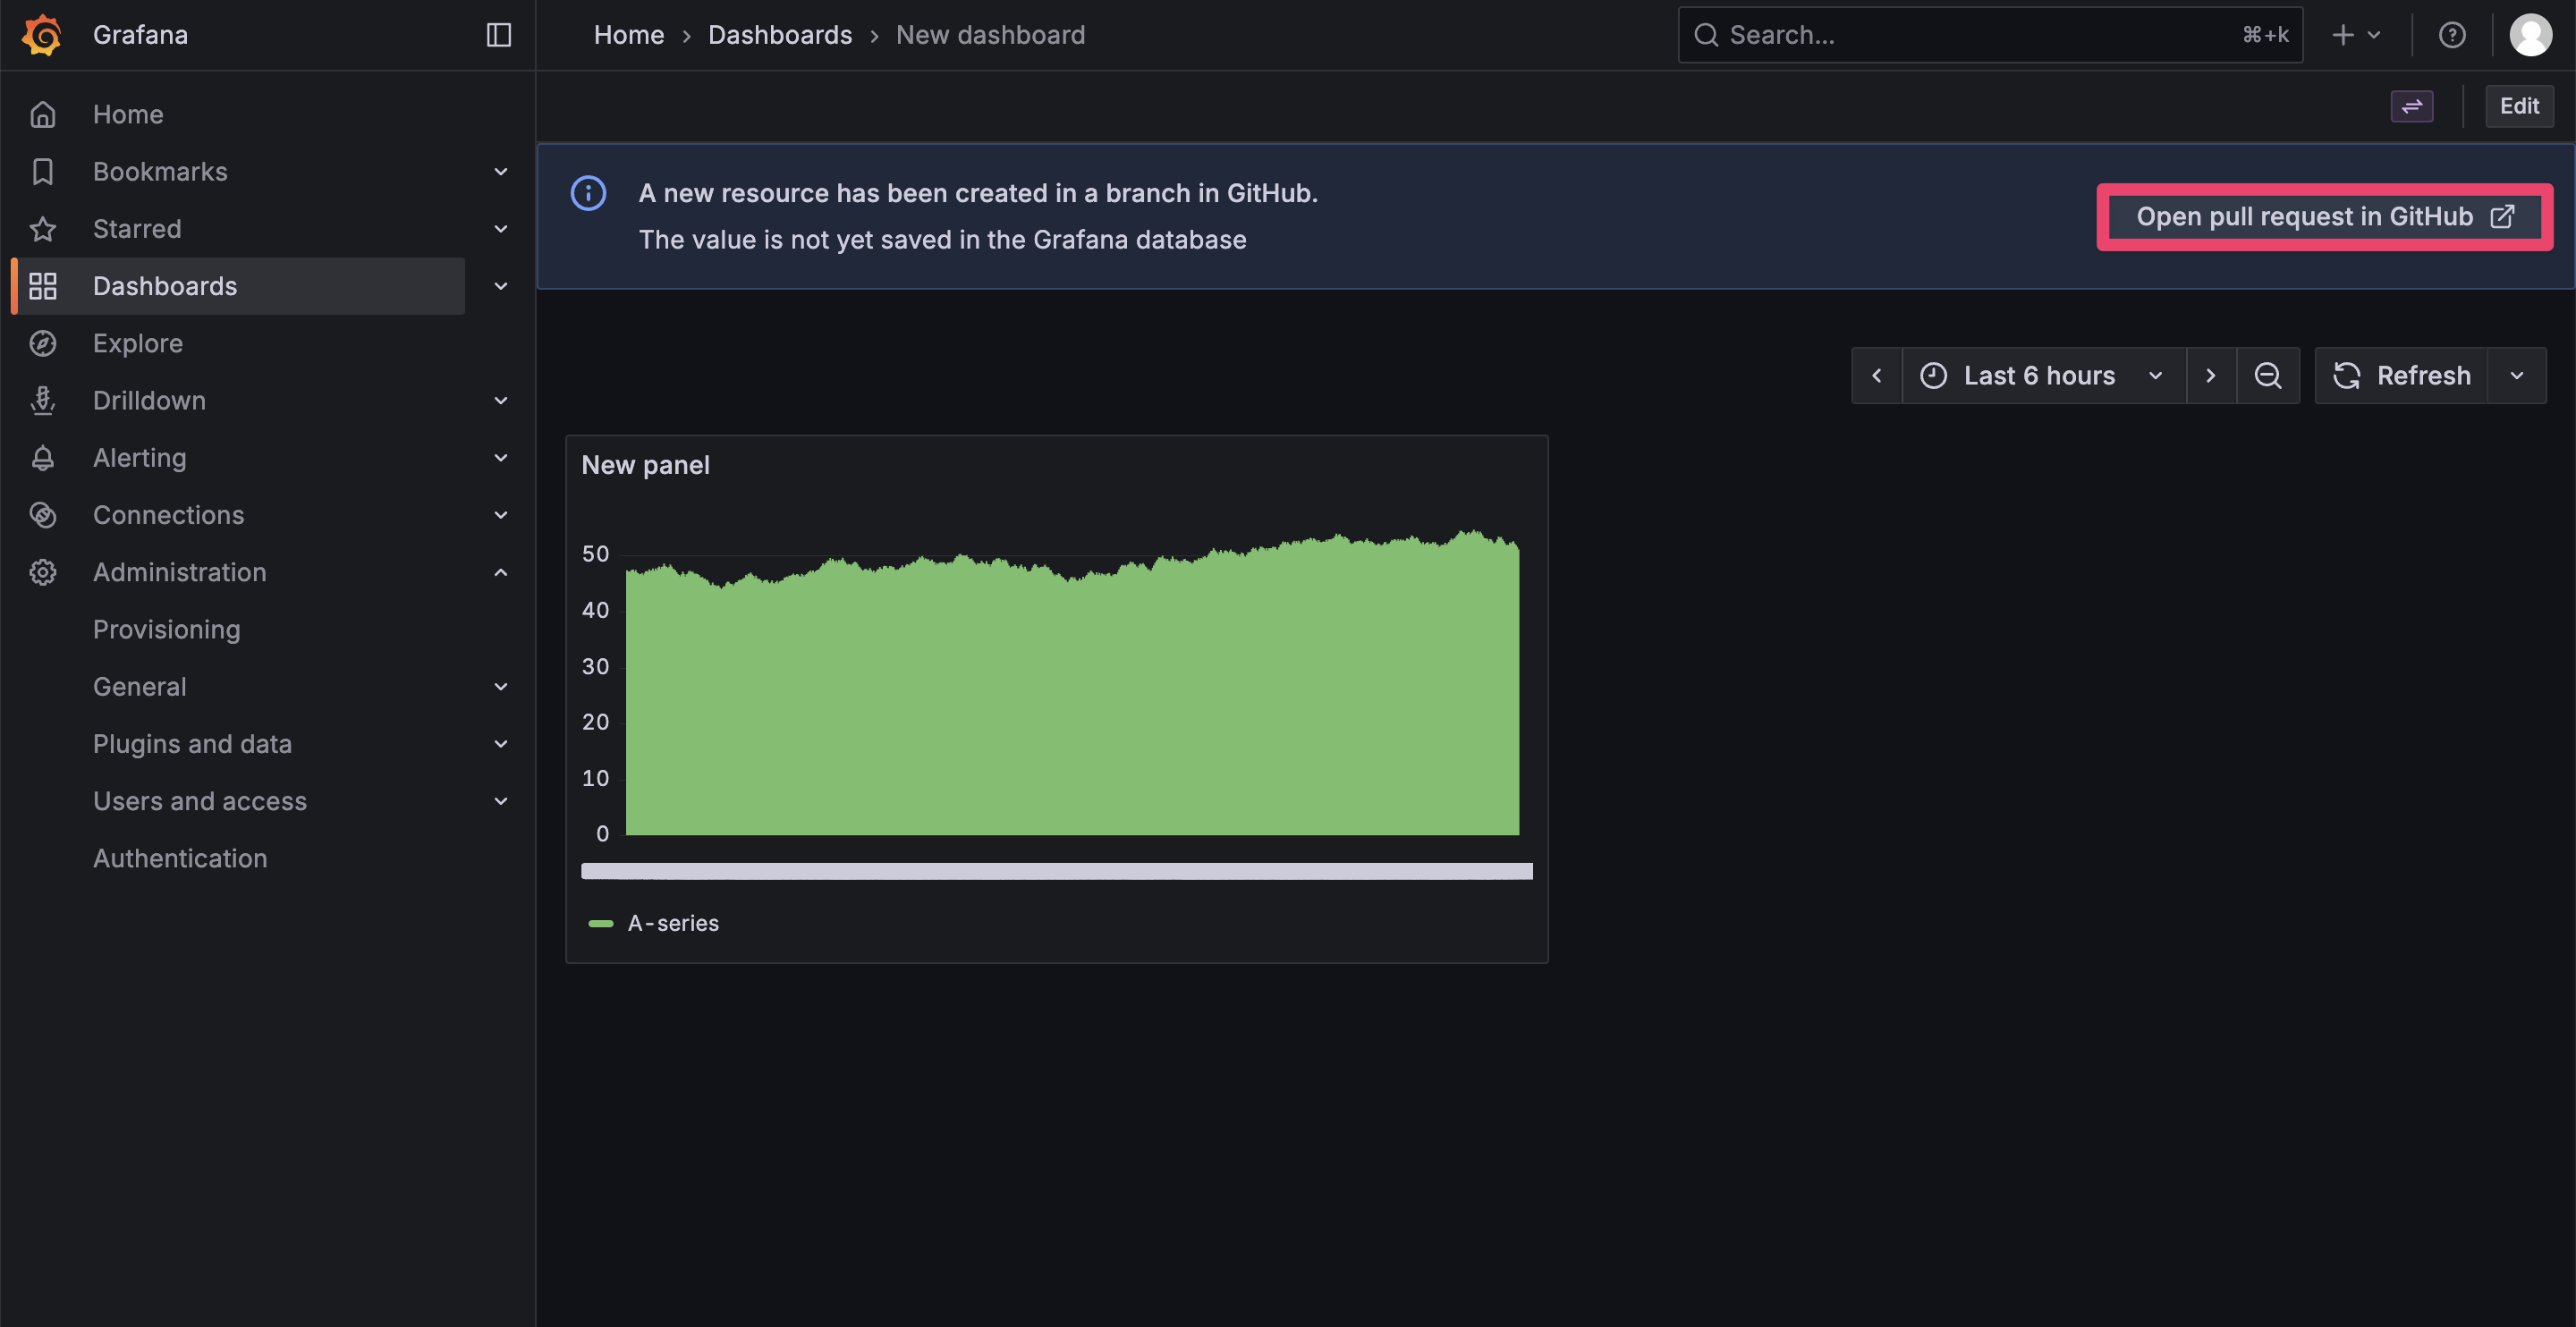
Now that saving is complete, click Open pull request in GitHub to submit a pull request.
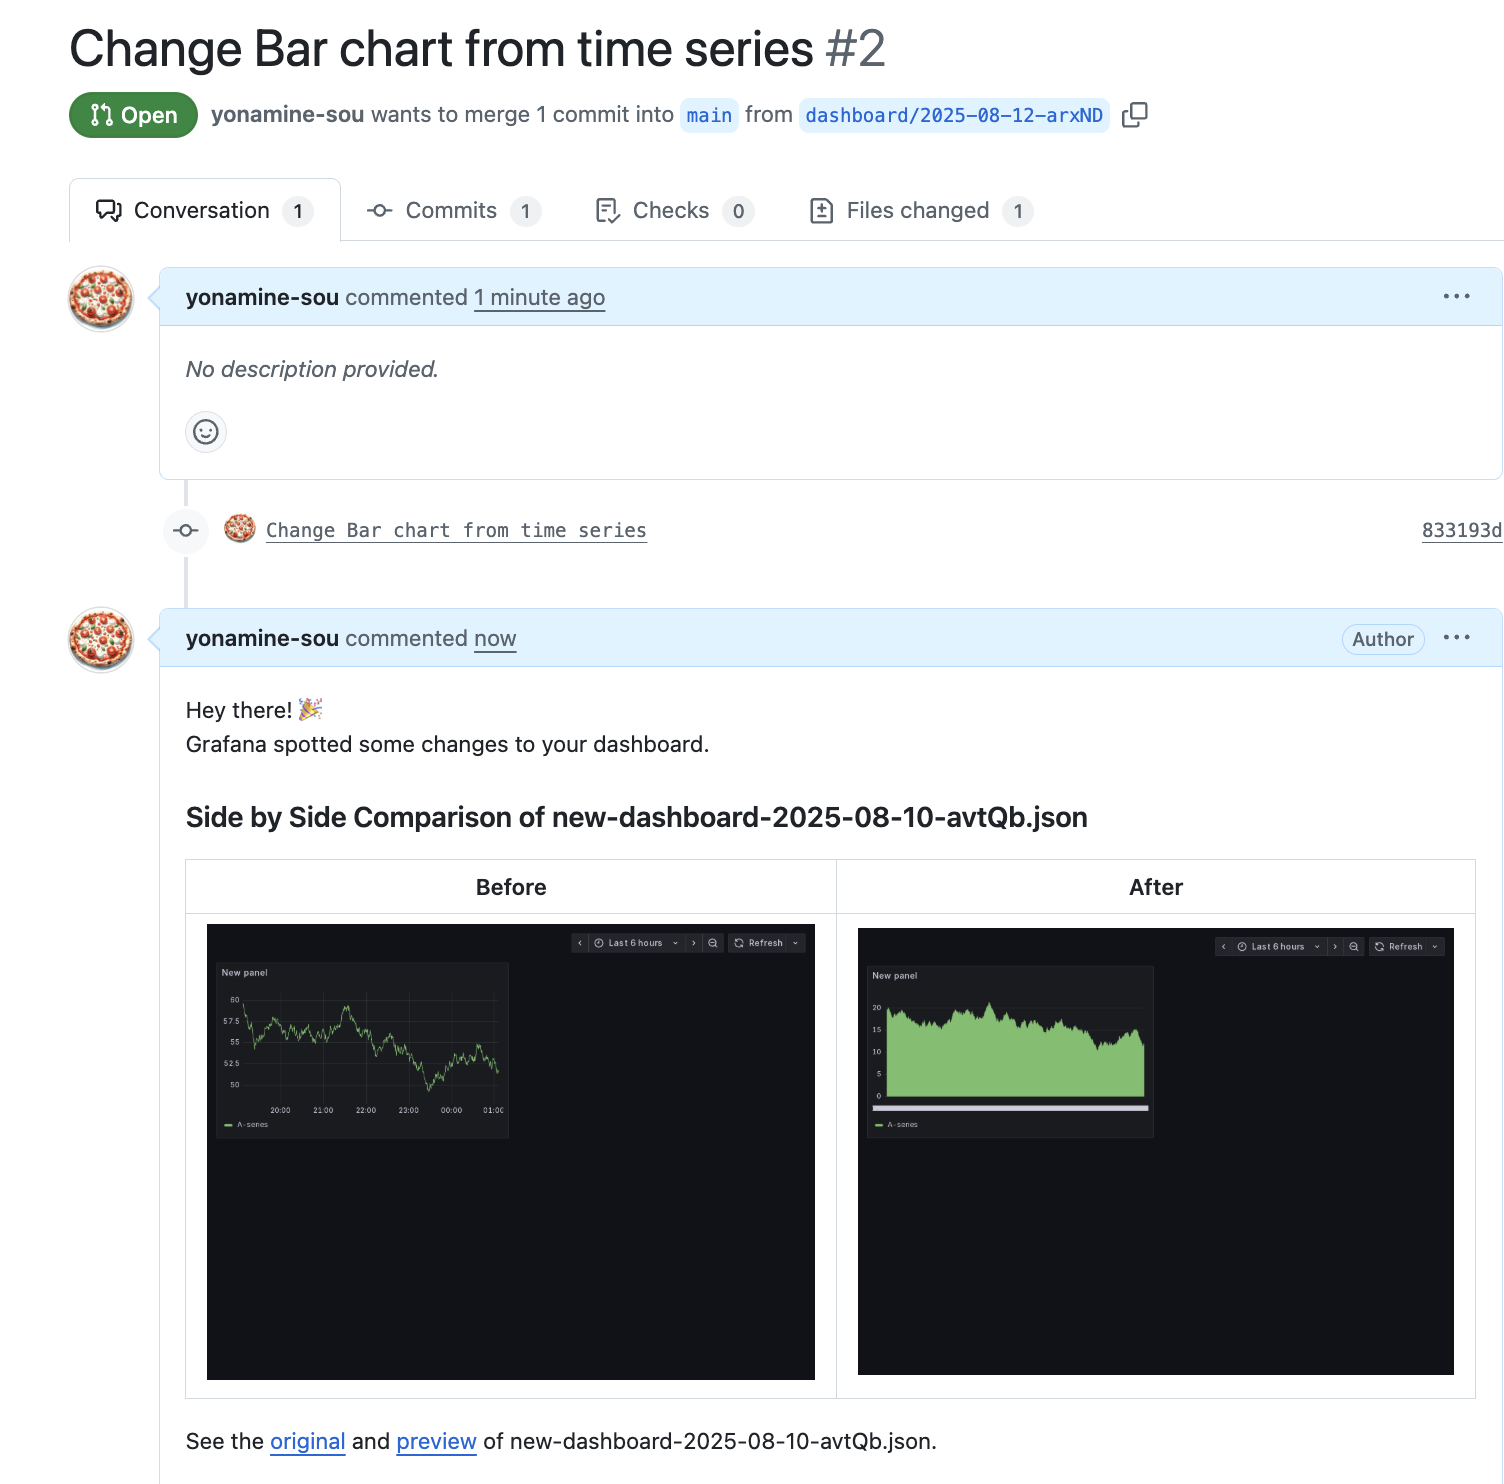
When you check the pull request content, you can see Before and After dashboards displayed!
This is very convenient!
## I Tried Various Things
I tried several things I was curious about with the pull request preview feature.### Minor modifications
I tried to see if changes can be detected when making small modifications.
This change involves adjusting the thickness of the line graph lines and making the graph background border transparent, but judging solely from this image is extremely difficult.
When managing dashboards in GitHub, determining edited sections from code is quite challenging, unlike typical code reviews.
Especially when making minor modifications, be sure to describe what was changed in the pull request comments.
Reviewers will find their work significantly streamlined by using comments along with preview images.
### Variables
I was curious about how panels requiring variables would appear, so I tried it out.
As expected, it displayed with no values entered.
It seems best to input values beforehand if you want to check the display.
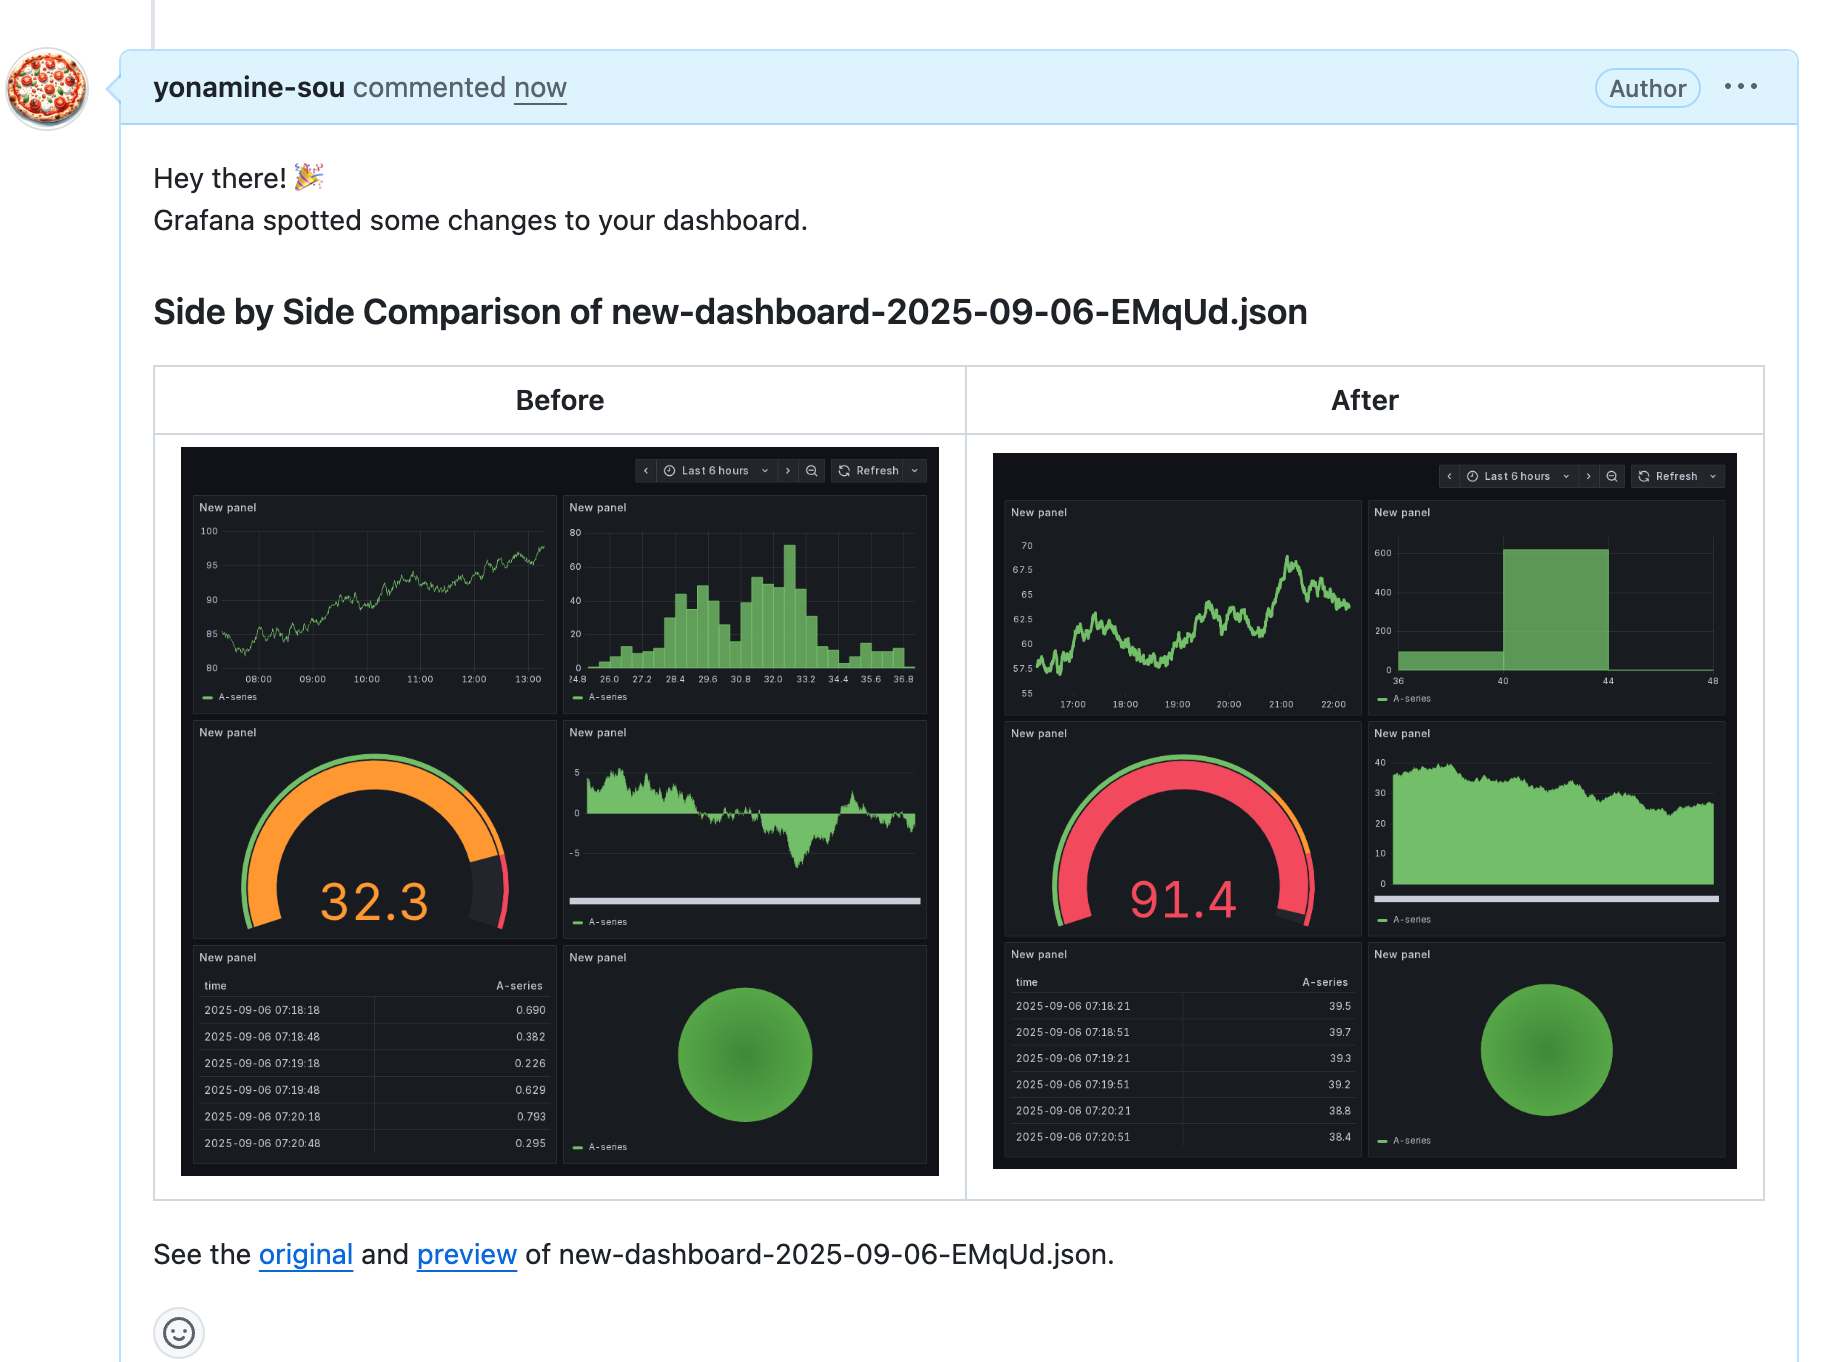
### Vertically long dashboards
I tested how images appear in pull requests when editing vertically long dashboards.
Vertically long dashboards are also fully converted to images.
## Summary
This time I tried out Git Sync's pull request preview feature.
The setup was more challenging than I expected.
I hope it becomes available in Grafana Cloud, which would eliminate the need to install the Image Renderer plugin and configure grok.
The feature itself feels very user-friendly. With GitHub integration, it becomes necessary to review dashboards before applying them when incorporating this into the development lifecycle.
Since it's difficult for humans to understand dashboard code, expressing it in image form significantly reduces the cognitive load during reviews.