I tried separating data by tenant in Grafana OSS with Loki / Tempo / AMP so that visible data is isolated per tenant

This page has been translated by machine translation. View original
Hello, I'm sora from the Game Solutions Department.
This time, I tried separating the storage destinations for Loki / Tempo / AMP by tenant, linking them to Organizations in the Grafana OSS version, and seeing whether the visible data could be isolated.
Conclusion First
- Even if Grafana, Loki / Tempo, and S3 remain shared across tenants, by separating tenants on the storage side and linking them to per-Organization data sources, other tenants' data did not appear on the screen or through the API
- As long as tenant-side users are kept at Editor or below, they cannot modify data sources, so isolation is maintained
- By creating an Organization for operators, it was possible to view data across both tenants
Architecture
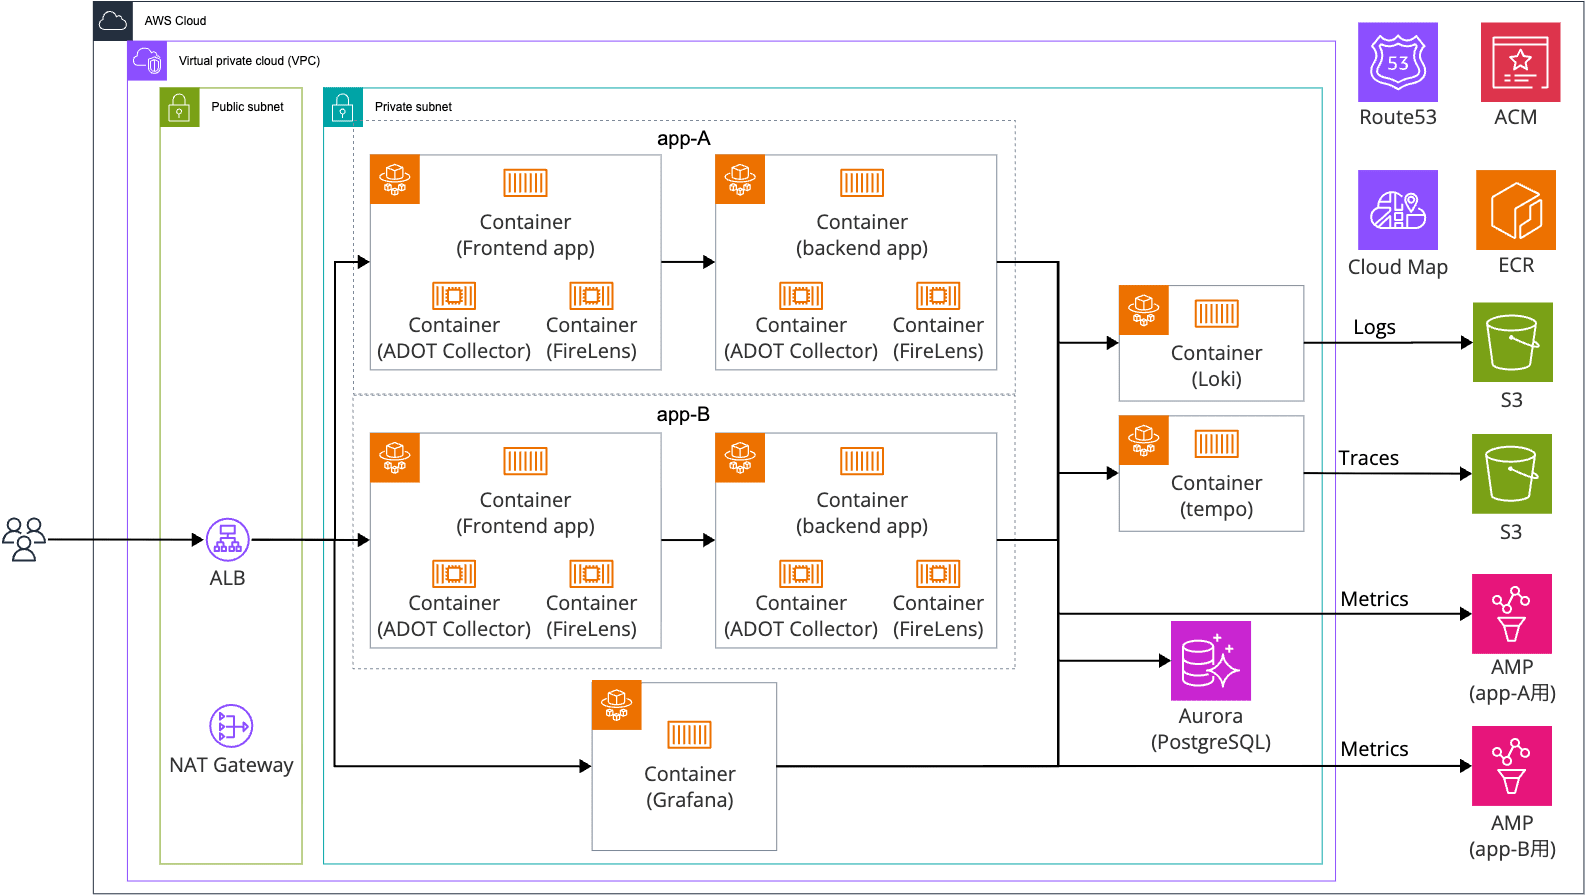
The following is the configuration I built this time.
In the following article, I confirmed that even when separated by Grafana Organizations, a configuration that reads directly from CloudWatch / X-Ray cannot separate metrics and traces from the same AWS account.
This time, I use Loki / Tempo / AMP as the storage destinations and separate tenants on the storage side.
I set up two sets of sample apps — one for Tenant A (app-A) and one for Tenant B (app-B) — with logs, traces, and metrics being sent from sidecars.
Grafana, Loki / Tempo, and S3 are shared between both tenants, and only AMP has a separate workspace per tenant.
The versions used are as follows.
- Grafana: 13.2.1
- Loki: 3.7.7
- Tempo: 3.0.3
- ADOT Collector: v0.50.0
Setup
I built this with Terraform again.
Since there are many basic resources, I'll omit the code, but I'll explain only the parts where tenants are separated.
Tenant Configuration for Loki / Tempo
Setting auth_enabled: true in Loki requires the X-Scope-OrgID header on all requests, and its value becomes the tenant ID.
auth_enabled: true

querier:
  # Enables searching across multiple tenants at once, like X-Scope-OrgID: tenant-a|tenant-b
  multi_tenant_queries_enabled: true
Setting multitenancy_enabled: true in Tempo gives the same behavior.
multitenancy_enabled: true

query_frontend:
  multi_tenant_queries_enabled: true
multi_tenant_queries_enabled is the setting for viewing data across both tenants in the operator Organization described later.
The default is false for Loki and true for Tempo, but I'm making it explicit.
When I try hitting Loki / Tempo directly from the Grafana task, requests without the header are rejected with 401.
$ wget -S -qO- http://loki.o11y.local:3100/loki/api/v1/labels
  HTTP/1.1 401 Unauthorized

$ wget -S -qO- --header "X-Scope-OrgID: tenant-a" http://loki.o11y.local:3100/loki/api/v1/labels
  HTTP/1.1 200 OK
{"status":"success","data":["container_name","job","service_name"]}

$ wget -S -qO- http://tempo.o11y.local:3200/api/search
  HTTP/1.1 401 Unauthorized

$ wget -S -qO- --header "X-Scope-OrgID: tenant-a" http://tempo.o11y.local:3200/api/search
  HTTP/1.1 200 OK
Tenant Configuration for Sidecars
For logs, I add tenant_id to the Loki output of FireLens.
This becomes the X-Scope-OrgID header (this is an excerpt from the task definition).
logConfiguration = {
  logDriver = "awsfirelens"
  options = {
    Name      = "loki"
    host      = "loki.o11y.local"
    port      = "3100"
    tenant_id = "tenant-a"   # tenant-b in the Tenant B task
    labels    = "job=app"
  }
}
For traces and metrics, the ADOT Collector configuration is separated per tenant.
The only differences are the header attached to Tempo and the AMP workspace write destination.
exporters:
  otlp_grpc/tempo:
    endpoint: tempo.o11y.local:4317
    tls:
      insecure: true
    headers:
      X-Scope-OrgID: tenant-a   # tenant-b for Tenant B

  prometheusremotewrite:
    # Writes to Tenant A's workspace
    endpoint: https://aps-workspaces.ap-northeast-1.amazonaws.com/workspaces/<Workspace A ID>/api/v1/remote_write
    auth:
      authenticator: sigv4auth
    resource_to_telemetry_conversion:
      enabled: true
Task roles are also separated per tenant, and app-A's task role has aps:RemoteWrite permission only for Tenant A's workspace (app-B has only Tenant B's).
resource_to_telemetry_conversion is the setting that converts attributes like service.name into metric labels.
Without this, you cannot filter by service_name.
S3 Prefixes
After accessing the app for a while and checking S3, both the Loki and Tempo buckets were organized into per-tenant prefixes.
$ aws s3 ls s3://grafana-o11y-loki-<account-ID>/
                           PRE tenant-a/
                           PRE tenant-b/

$ aws s3 ls s3://grafana-o11y-tempo-<account-ID>/
                           PRE tenant-a/
                           PRE tenant-b/
2026-09-24 09:57:02       3084 work.json
The Loki index was uploaded after about ten-plus minutes, and it was also separated by tenant.
$ aws s3 ls s3://grafana-o11y-loki-<account-ID>/ --recursive | grep index/
2026-09-24 10:06:12 index/index_20720/tenant-a/...tsdb.gz
2026-09-24 10:06:12 index/index_20720/tenant-b/...tsdb.gz
IAM Roles for Reading AMP
The IAM roles for Grafana to read AMP are three in total: one per tenant and one for operators.
| Role | Readable Workspaces |
|---|---|
grafana-tenant-a |
Tenant A |
grafana-tenant-b |
Tenant B |
grafana-ops |
Tenant A / Tenant B |
data "aws_iam_policy_document" "grafana" {
  for_each = local.grafana_roles

  statement {
    actions = [
      "aps:QueryMetrics",
      "aps:GetLabels",
      "aps:GetSeries",
      "aps:GetMetricMetadata",
    ]
    resources = each.value.workspaces
  }
}
The Grafana task role has no AMP read permissions, only sts:AssumeRole for these three roles.
This is because attaching read permissions to the task role would allow all workspaces to be read without specifying an Assume Role.
Organization and Data Source Configuration
Creating Organizations and Users
I created three Organizations: one for Tenant A, one for Tenant B, and one for operators.
| Organization | User | Role |
|---|---|---|
| OrgA | usera3 |
Editor |
| OrgB | userb3 |
Editor |
| Org-ops | ops3 |
Admin |
Each user belongs to only one Organization and is not added to the Main Org.
The method for creating Organizations and users is the same as in the following article.
Loki Data Source Configuration
Switch to OrgA and create a Loki data source from Connections → Data sources.
The URL is the Loki Cloud Map name, which is the same for all Organizations.
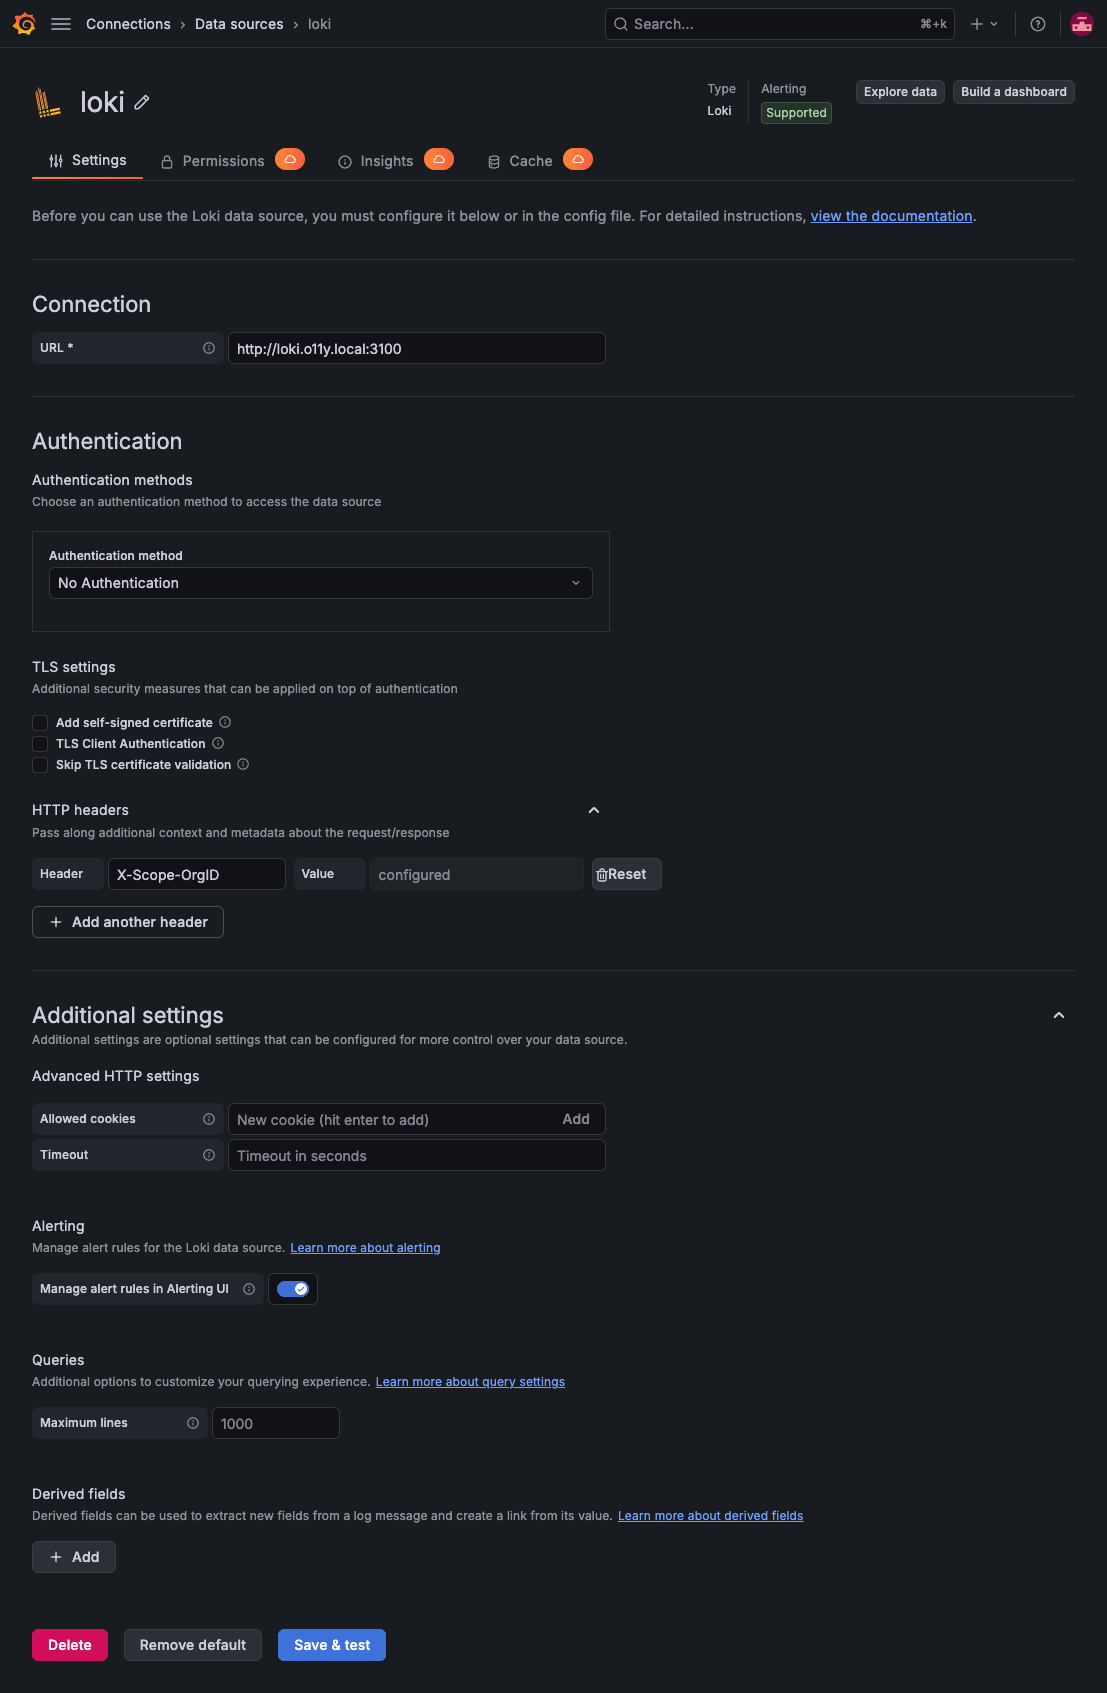
What determines the tenant is X-Scope-OrgID in HTTP headers.
For OrgA the value is tenant-a, and for OrgB it is tenant-b.
Once saved, the value is masked as configured and cannot be read from the screen or through the API.
Tempo Data Source Configuration
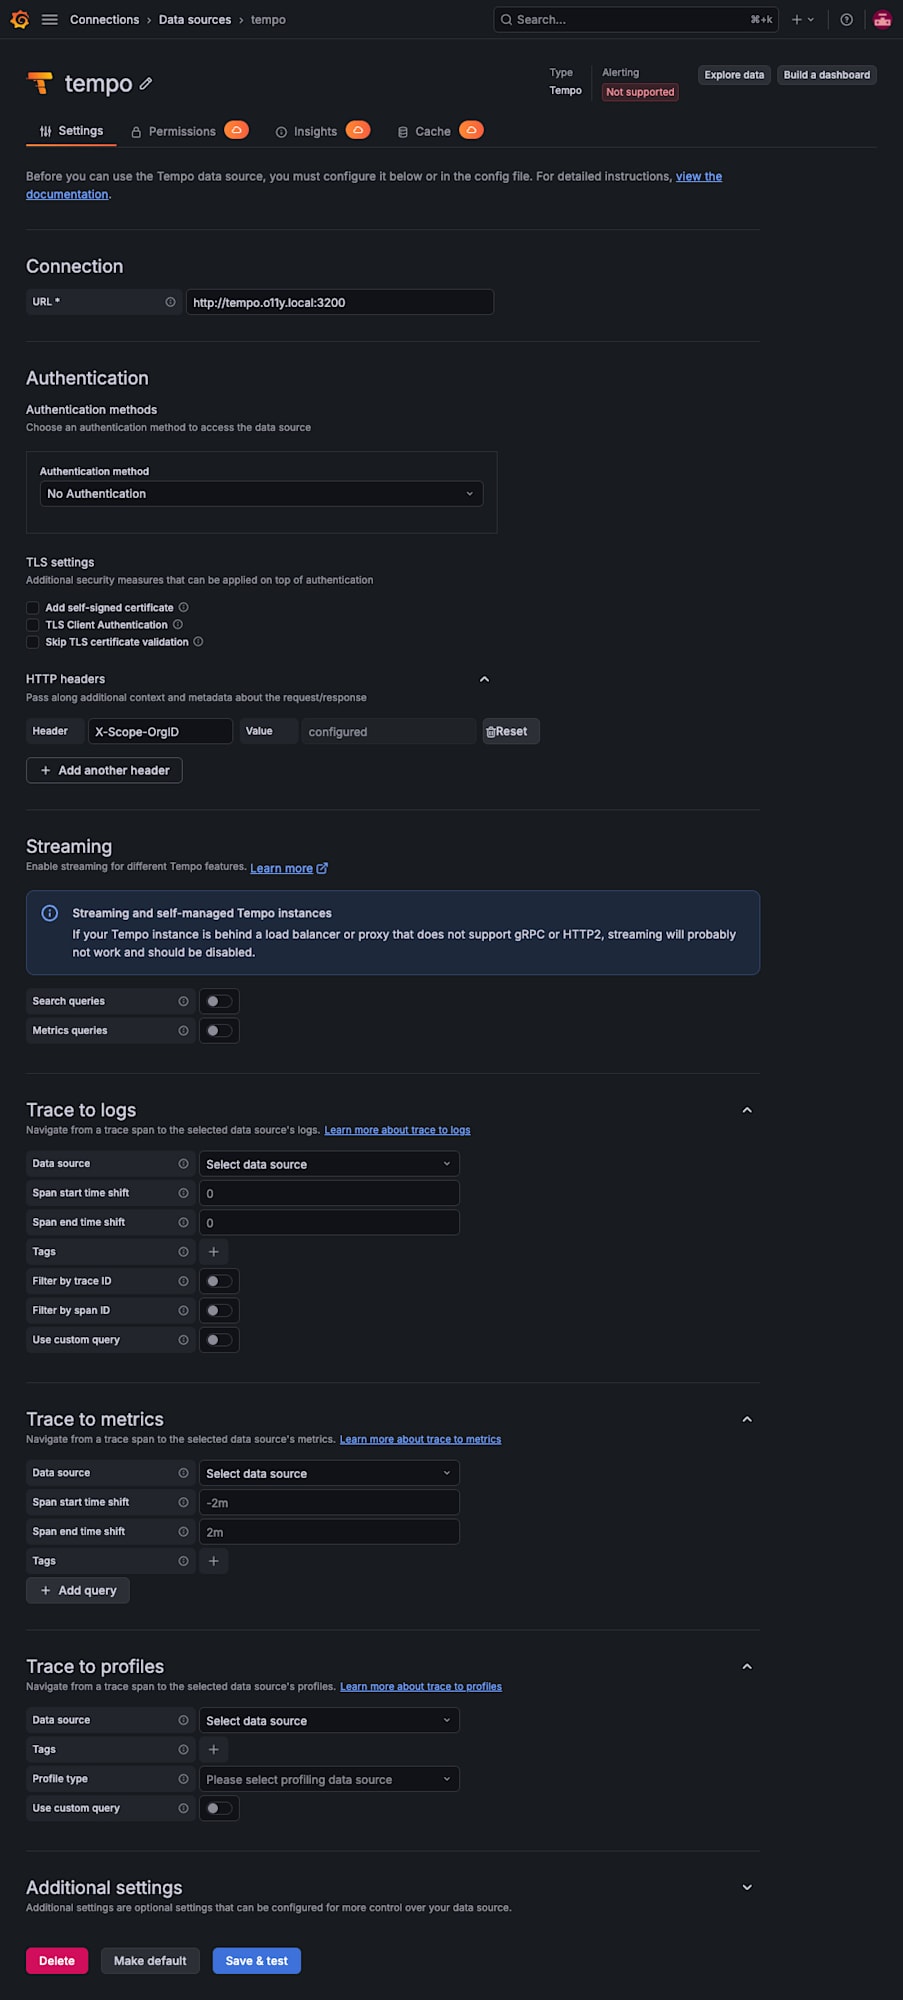
For Tempo, just like Loki, enter X-Scope-OrgID in HTTP headers.
AMP Data Source Configuration
For AMP, enter the tenant's workspace URL (https://aps-workspaces.ap-northeast-1.amazonaws.com/workspaces/<Workspace ID>/) in the Prometheus server URL.
For OrgA, use Workspace A's URL; for OrgB, use Workspace B's URL.
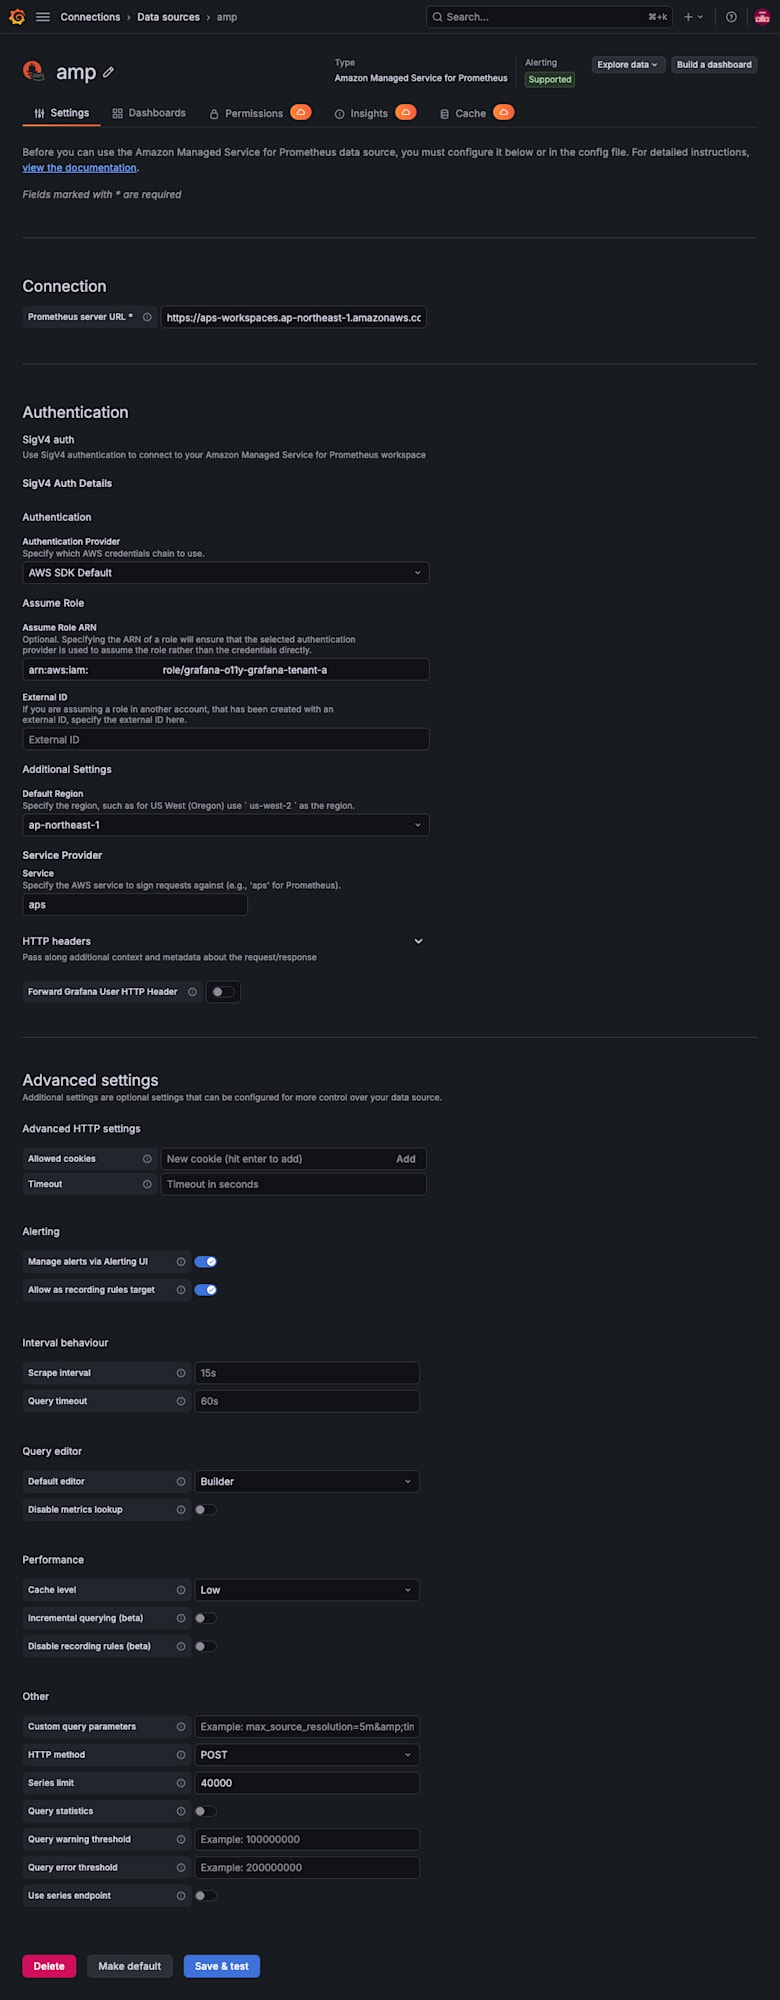
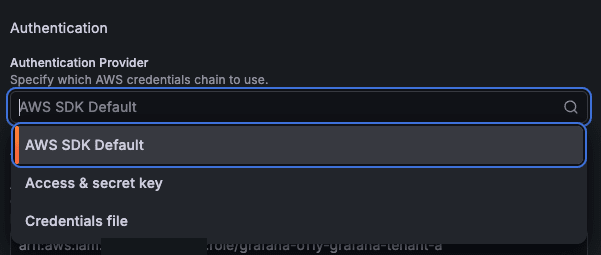
Set Authentication Provider to AWS SDK Default and enter the tenant's role (for OrgA, grafana-tenant-a) in Assume Role ARN.
Other options for Authentication Provider are Access & secret key and Credentials file.
When I left the Assume Role ARN blank and clicked Save & test, it returned 403 Forbidden.
With only the Grafana task role, no workspace can be read.
Note that when entering data sources via API or provisioning, the Assume Role ARN goes into sigV4AssumeRoleArn in jsonData.
The official documentation's provisioning description mentions assumeRoleArn, but when I entered it there, AssumeRole was not performed and the result was the same 403 Forbidden as when no ARN was entered.
Verification
I set up app-A (Tenant A) with only normal requests, and app-B (Tenant B) with both normal requests and requests to an endpoint that returns errors.
This was to make it visually distinguishable which tenant's data is displayed based on the presence or absence of errors.
Verification with usera3
Log in as usera3 and run the following query against Loki in Explore.
sum by (ecs_task_definition) (count_over_time({job="app"} | json [1m]))
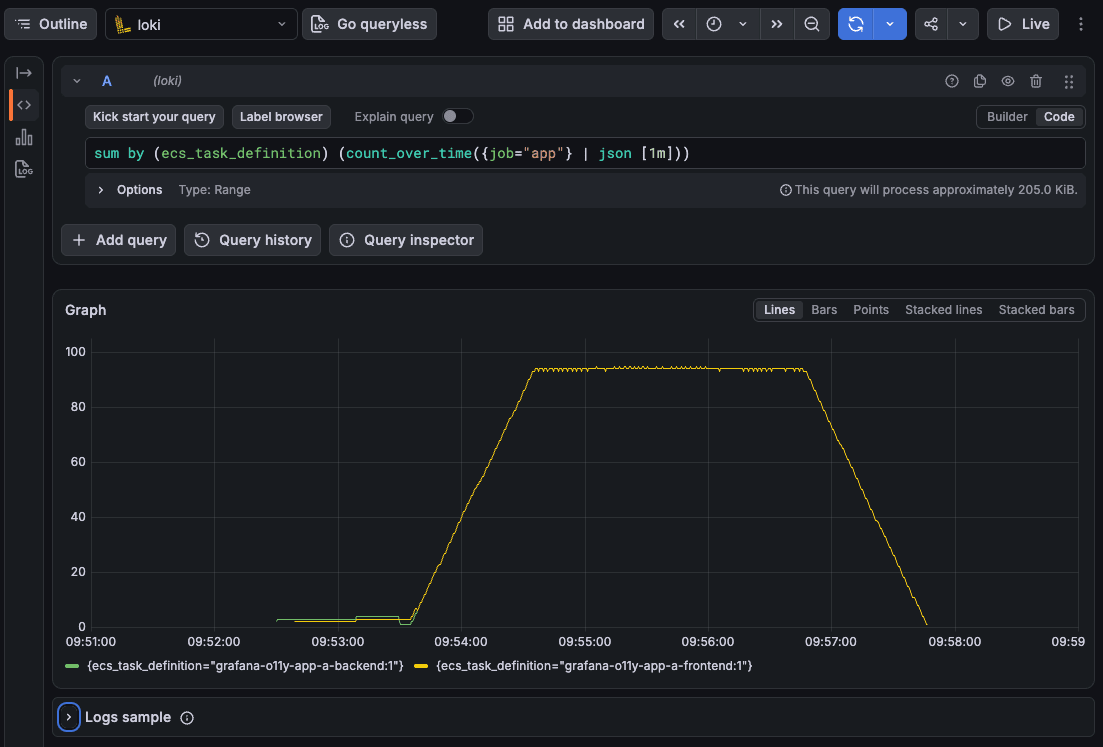
Only the two series grafana-o11y-app-a-frontend and grafana-o11y-app-a-backend appear, and app-B's logs do not show up.
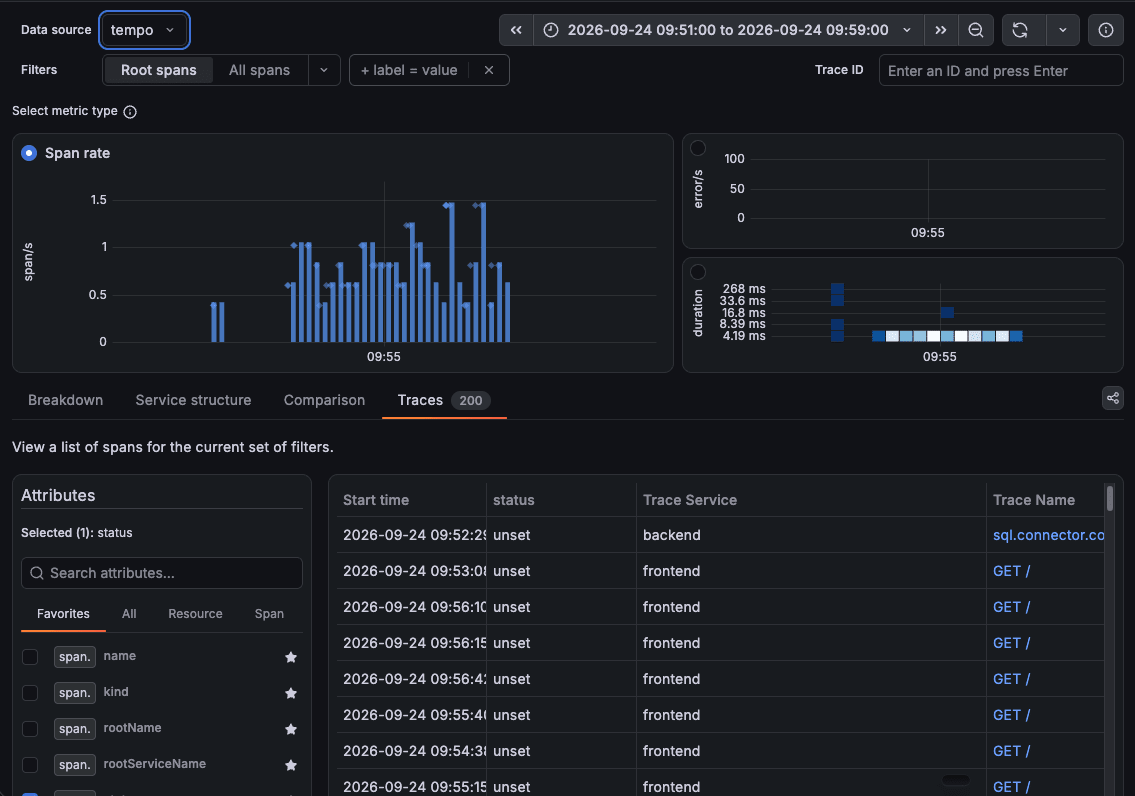
Opening Drilldown → Traces, the error/s in the upper right remains at 0.
Let's also check AMP.
sum by (http_response_status_code) (rate(app_requests_total[1m]))
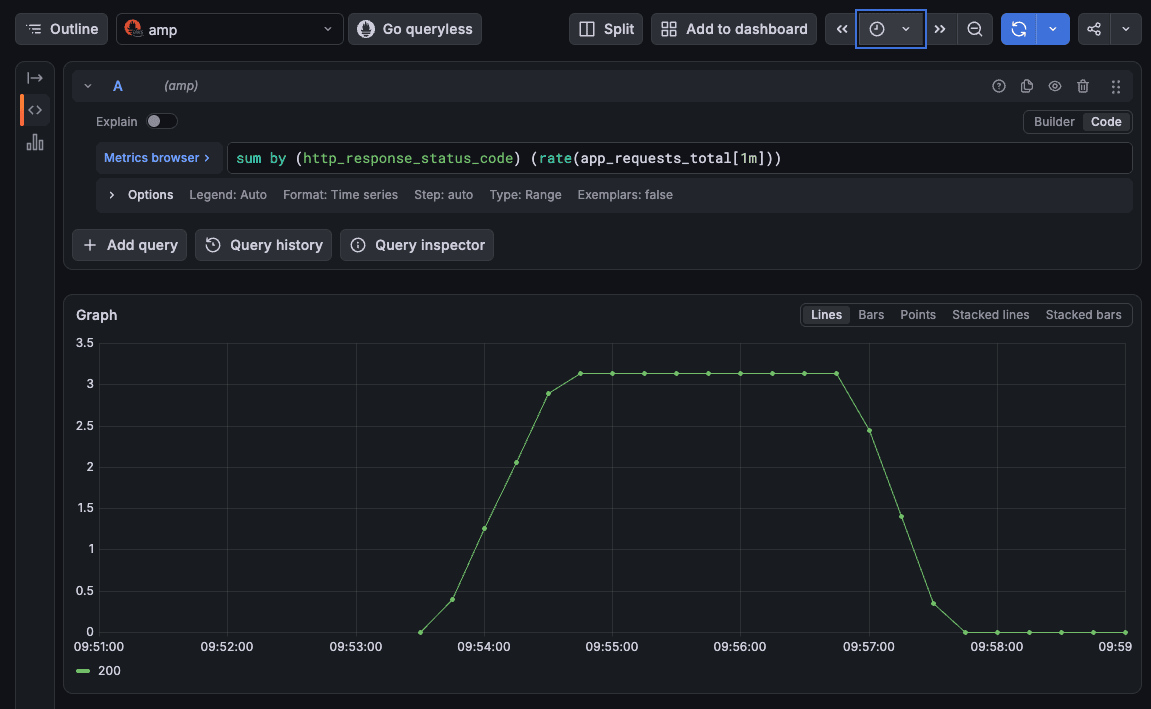
The only status code is 200, and only values from Tenant A's workspace are returned.
Verification with userb3
Let's do the same thing with userb3.
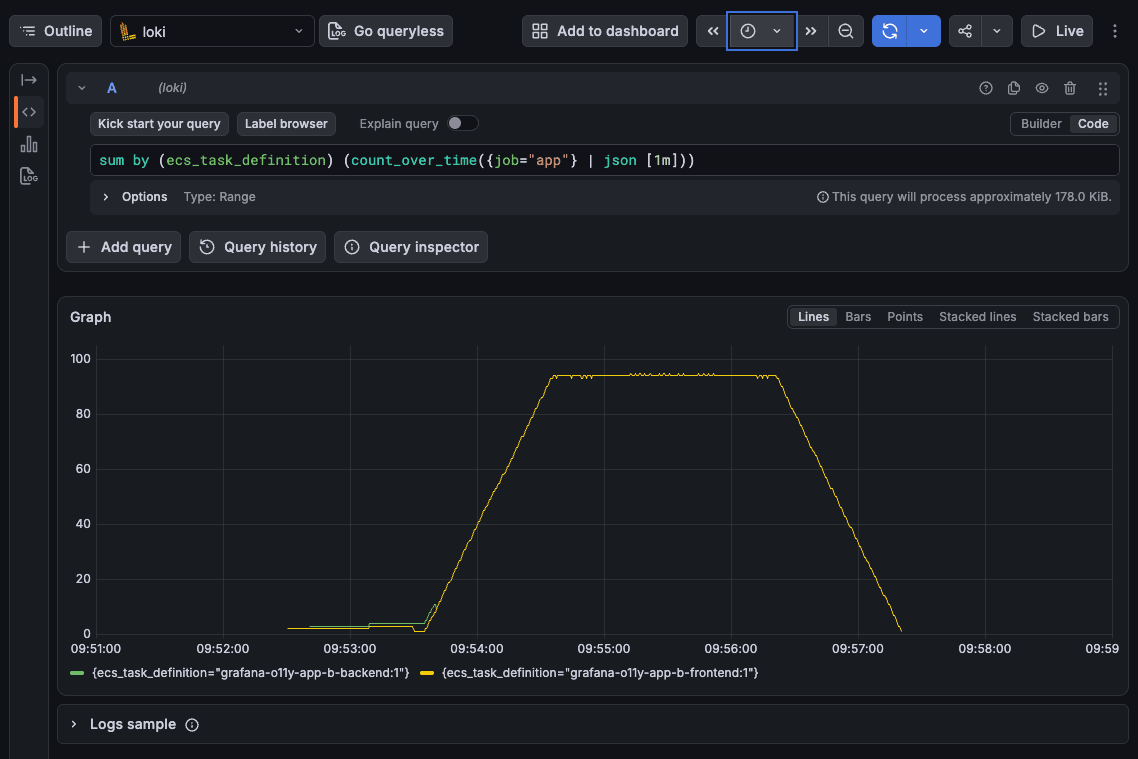
Only grafana-o11y-app-b-frontend and grafana-o11y-app-b-backend appear in Loki.
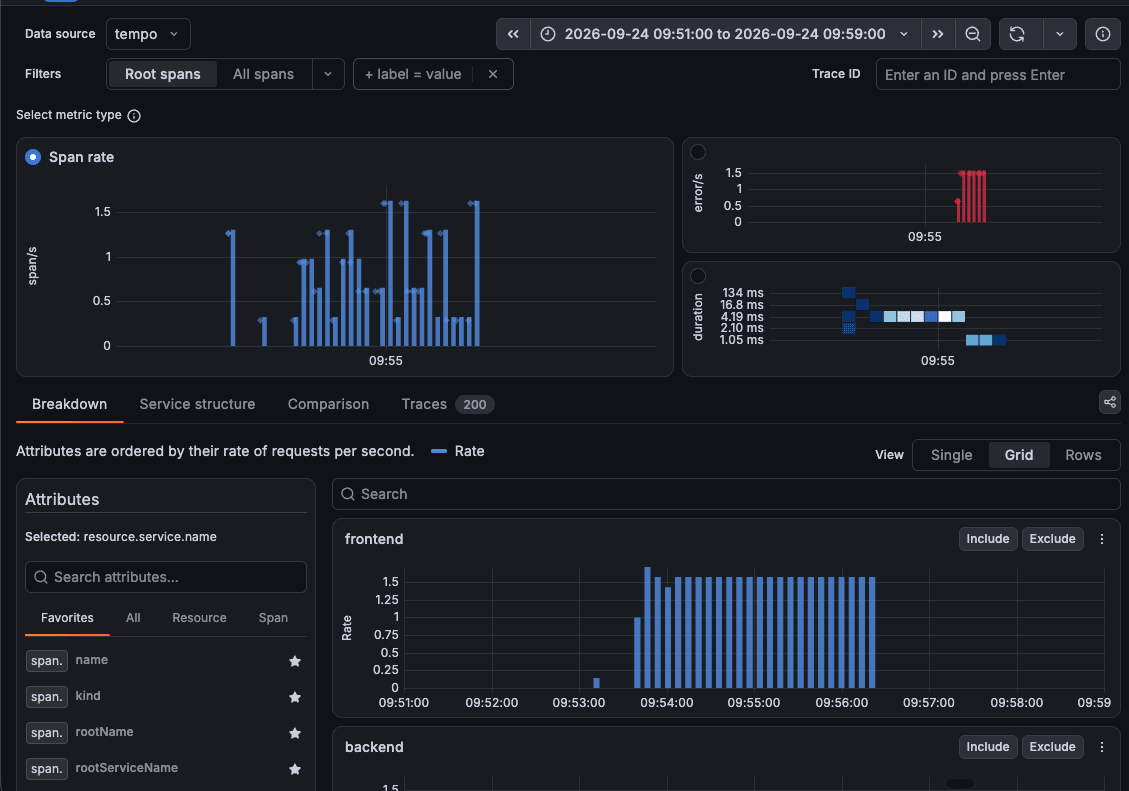
Since errors are being sent to Tenant B, spikes appear in error/s.
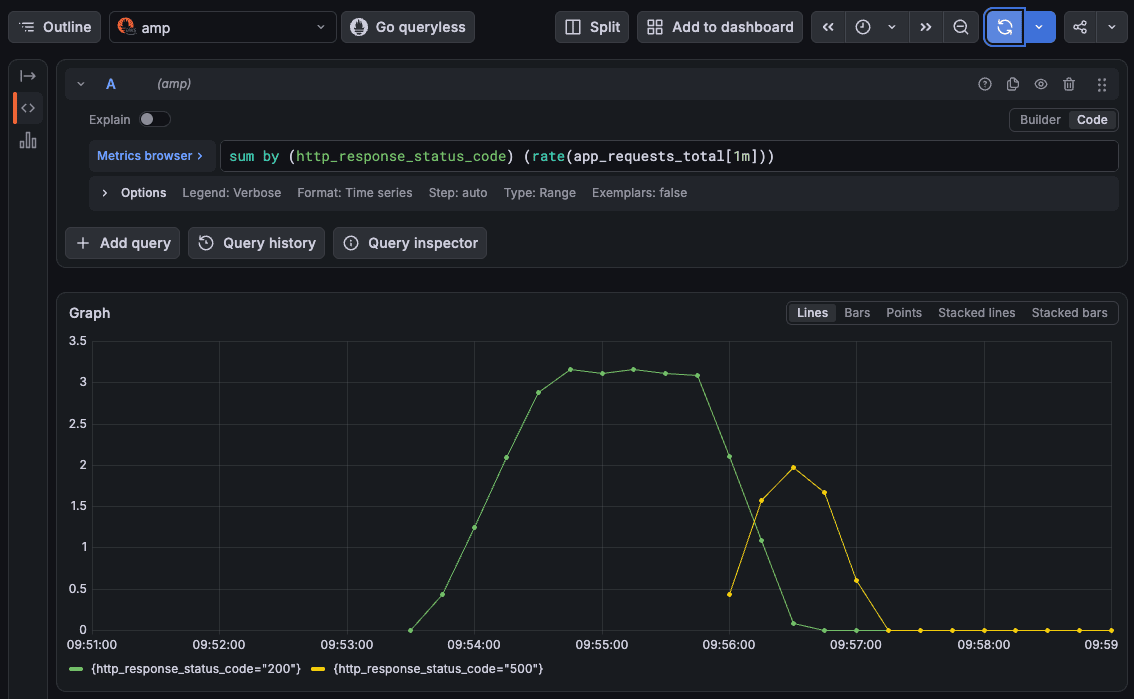
The 500 series also appears in AMP.
Even though the same Grafana and the same Loki / Tempo are used, it was confirmed that the visible data is separated per Organization.
Verification of Data Source Modification by Editor
Since the tenant separation depends on the data source configuration, if that can be rewritten, the isolation breaks.
Since usera3 is an Editor, I'll verify whether they can modify data sources at all.
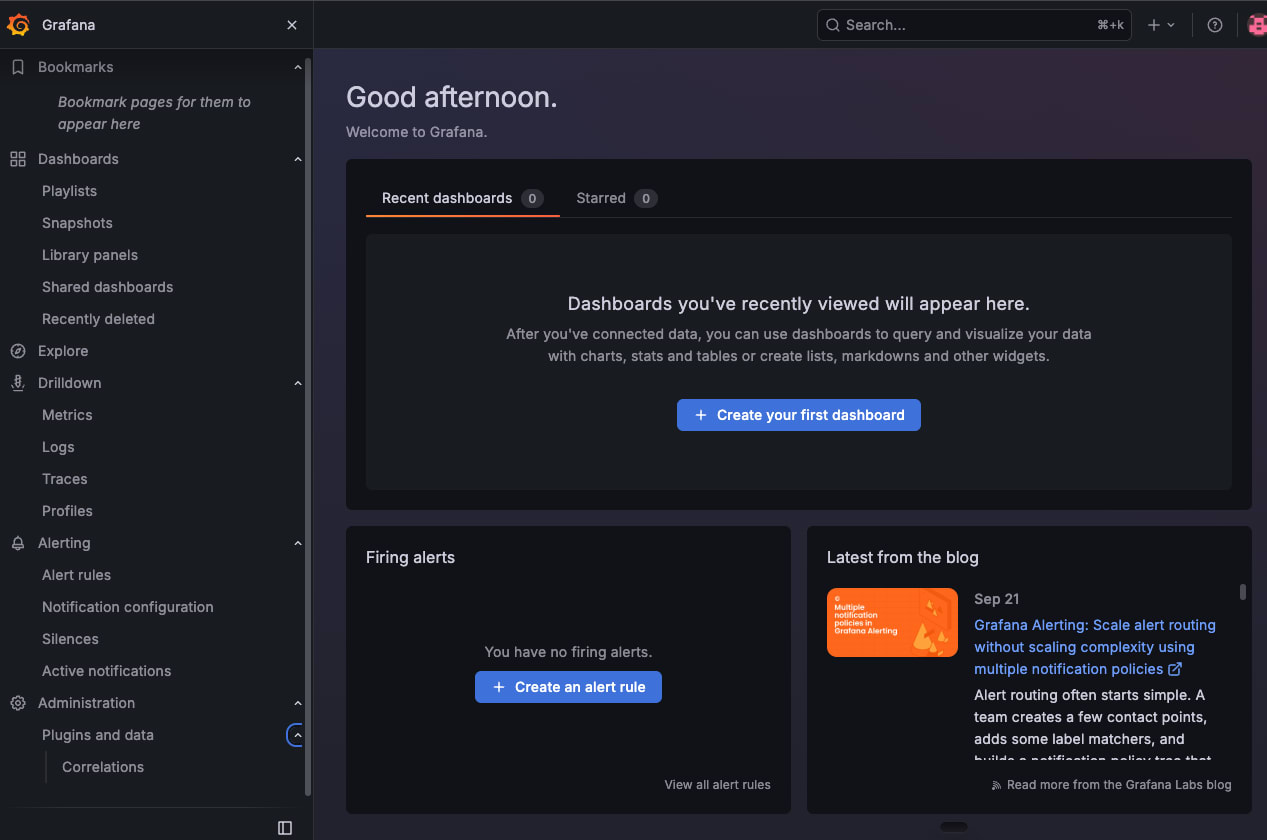
There is no Connections in the left menu, and within Administration → Plugins and data there is only Correlations — there is no entry point to the data source settings screen.
Even accessing the data source edit screen URL directly redirected back to the home page.
Attempting to rewrite the header value to tenant-b via the API also results in a 403.
$ curl -s -u usera3:<password> -H 'Content-Type: application/json' \
  -X PUT https://<GrafanaのURL>/api/datasources/uid/loki-a \
  -d '{"name":"loki","type":"loki","access":"proxy","url":"http://loki.o11y.local:3100","jsonData":{"httpHeaderName1":"X-Scope-OrgID"},"secureJsonData":{"httpHeaderValue1":"tenant-b"}}'
{"message":"You'll need additional permissions to perform this action. Permissions needed: datasources:write","title":"Access denied"}
Attempting to create a new data source also returns 403, as datasources:create is likewise absent.
On the other hand, since an Organization Admin can modify data sources, rewriting the header value or Assume Role ARN would expose other tenants' data.
The premise of this isolation is that tenant-side users are not given Organization Admin, and data sources are created by the operations team.
Cross-Tenant View in the Operator Organization
When separated by Organization, only your own tenant's data is visible from within a single Organization.
For operators who want to view all tenants, Org-ops has the following data sources.
| Data Source | Configuration |
|---|---|
loki |
HTTP headers: X-Scope-OrgID = tenant-a|tenant-b |
tempo |
HTTP headers: X-Scope-OrgID = tenant-a|tenant-b |
amp-tenant-a |
Workspace A URL + Assume Role ARN: grafana-ops |
amp-tenant-b |
Workspace B URL + Assume Role ARN: grafana-ops |
For Loki / Tempo, listing tenant IDs separated by | in the header value enables searching across multiple tenants at once.
The multi_tenant_queries_enabled setting added in the setup section is for this purpose.
Since AMP can only specify one workspace per data source, you create as many data sources as there are workspaces.
Log in as ops3 and run the following query against Loki in Explore.
sum by (__tenant_id__) (count_over_time({job="app"}[1m]))
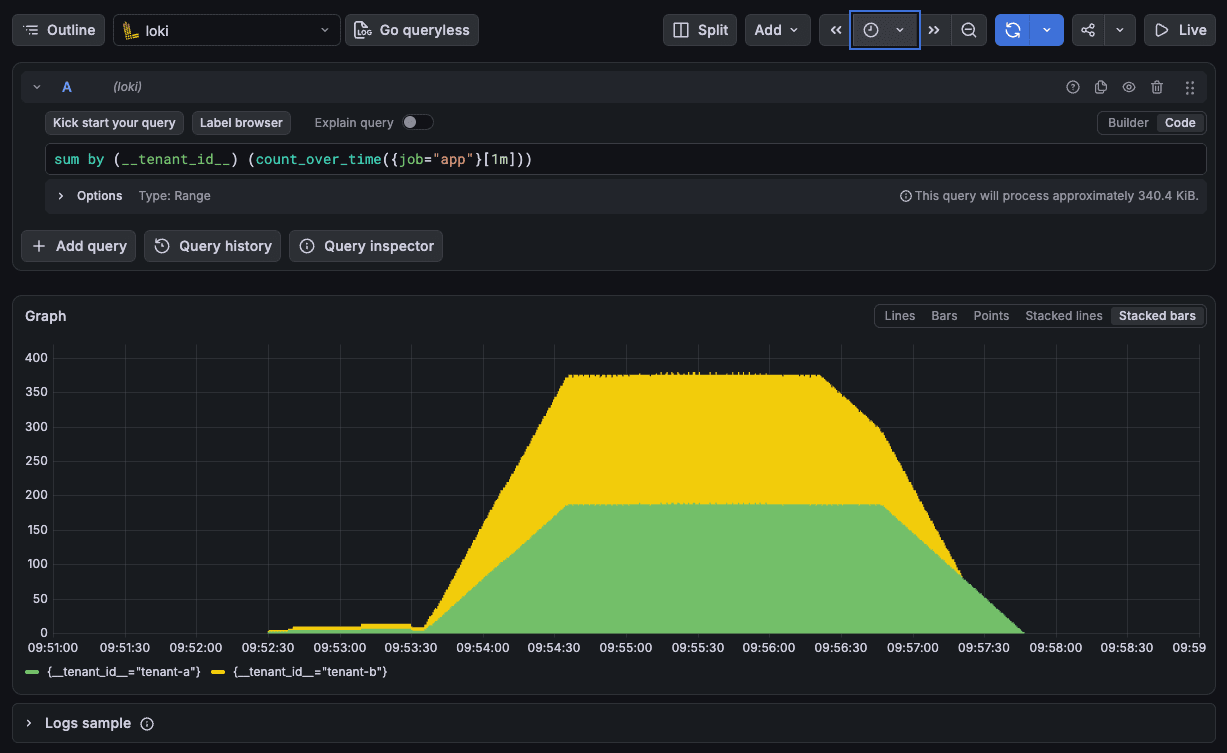
Two series, tenant-a and tenant-b, appeared.
__tenant_id__ is a label that Loki attaches when searching across multiple tenants, allowing you to identify which tenant the logs belong to.
Let's also check Drilldown → Traces.
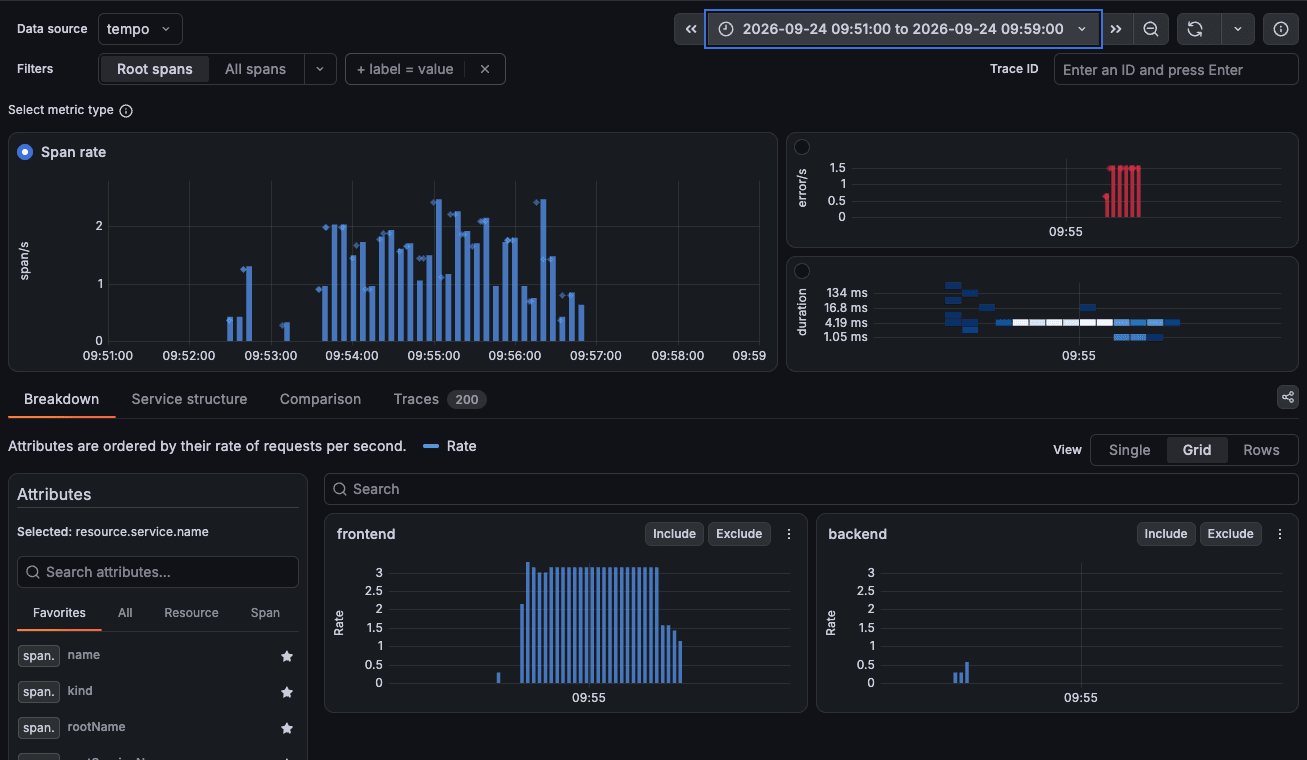
Tenant B's errors appear in error/s, and the frontend Rate is about 3.1, which is nearly double what was seen when viewing as userb3 (about 1.6).
Traces from both tenants are visible together.
Incidentally, with Loki cross-tenant search, depending on the search period, only one tenant's logs may be returned.
This has been reported as a known bug in Loki: when the search range spans both data in Loki's memory and data on S3, the results for the second tenant are missing (unfixed as of September 2026).
Since no error is thrown and only some tenants' results are missing, caution is needed when using cross-tenant search results for aggregation or similar purposes.
Supplementary: Basic Authentication and Forward OAuth Identity for Loki / Tempo
Under Authentication in the Loki / Tempo data source, Basic authentication and Forward OAuth identity are also available.
| Option | What Is Sent |
|---|---|
| Basic authentication | The username and password entered in the data source |
| Forward OAuth identity | The OAuth access token (OIDC ID token) of the user logged into Grafana |
However, since Loki / Tempo have no built-in authentication mechanism, the credentials sent cannot be verified, and the tenant is determined solely by X-Scope-OrgID.
The Loki documentation recommends placing an authenticating reverse proxy in front and having that proxy attach X-Scope-OrgID.
Grafana Loki does not come with any included authentication layer. You must run an authenticating reverse proxy in front of your services.
With a configuration where X-Scope-OrgID is attached by the reverse proxy after authentication, the tenant is determined by the authenticated user or token rather than the header entered in the Grafana data source.
Proxies that map Basic auth users to tenants are also available as OSS.
How to Separate for Use Across Multiple Projects
In this configuration, tenant separation is determined by the data source settings.
Based on the verification results, I organized the combination of how Organizations are divided and which roles are granted into the following three patterns.
- Pattern 1: Organization separation + Editor for tenant side (this configuration)
- Organization: Create one per tenant
- Tenant-side users: Editor
- Data sources: Configured by the operations team's Organization Admin
- Operators: View across tenants from the operator Organization using data sources with multiple tenant IDs in
X-Scope-OrgID - Since tenant-side users cannot modify data sources, other tenants' data is not visible
- Adding data sources and users is handled by the operations team
- Pattern 2: Organization separation + Organization Admin for tenant side
- Organization: Create one per tenant
- Tenant-side users: Organization Admin
- Data sources: Configured by the tenant side
- Operators: Same as Pattern 1
- Tenant-side users can add data sources and users, but rewriting the header value or Assume Role ARN would expose other tenants' data
- To prevent this, additional configuration such as placing a reverse proxy in front of Loki / Tempo to overwrite
X-Scope-OrgIDis required
- To prevent this, additional configuration such as placing a reverse proxy in front of Loki / Tempo to overwrite
- Pattern 3: Separate Grafana per tenant
- Grafana: Set up one per tenant
- Tenant-side users: Organization Admin (Grafana Server Admin is also acceptable)
- Data sources: Configured by the tenant side
- Grafana task role: Attach permissions directly to read only that tenant's workspace
- Operators: Set up a separate Grafana for operators with data sources for all tenants
- Since there are no other tenants' data sources inside Grafana and the task role cannot read other tenants' workspaces, even granting admin privileges does not expose other tenants
- This incurs the cost and operations for as many Grafana instances as there are tenants
Closing
This time, I tried separating the storage destinations for Loki / Tempo / AMP by tenant, linking them to Organizations in the Grafana OSS version, and seeing whether the visible data could be isolated.
I hope this article is helpful to someone.