I tried using Git Sync announced in Grafana v12

Introduction
Grafana v12 was announced in May this year.
Among its features, Git Sync was released as a preview, allowing you to connect your Grafana instance to a GitHub repository and manage dashboards as code directly from the Grafana UI.
Although it's still in preview, being able to manage dashboards in GitHub is exciting!
As written in the official documentation, please note that this is an experimental feature and is not recommended for use in production environments.
What's good about it?
I think the biggest benefit is being able to manage dashboards collaboratively with multiple people while maintaining version control through GitHub.
Previously, I wrote an article about manipulating dashboard JSON files via API.
With Git Sync, you no longer need to go through the API.
While using the API doesn't cause major issues when managing dashboards at an individual level, various problems arise when multiple people are involved in management.
The Git Sync feature promises a better development experience for team collaboration.
Setup
We'll follow the setup guide for installation.
The overall process is as follows:
- Enable the feature toggle in Grafana
- Issue a GitHub personal access token
- Configure the GitHub connection
Environment
Grafana
As a prerequisite, Git Sync is currently only supported in OSS or Enterprise versions.
It is not generally available in Grafana Cloud.
For this article, I have installed the Enterprise version of Grafana on my Mac.
The version is 12.1.0-pre.
			$ grafana -v
grafana version 12.1.0-pre
I also tried with 12.0.x which has Git Sync implemented, but there was a bug that made it unusable in my environment.
GitHub
On the GitHub side, create an appropriate repository to sync your Grafana dashboards. An existing repository is also fine.
Enable feature toggles
To enable Git Sync, you need to enable the provisioning and kubernetesDashboards feature toggles.
To enable feature toggles, add the following settings to your grafana.ini or custom.ini configuration file:
			[feature_toggles]
provisioning = true
kubernetesDashboards = true ; use k8s from browser
If Grafana is running, restart it after making the above changes.### Issue a GitHub Personal Access Token
Login to GitHub and
select your icon in the top right > Settings > Developer Settings.
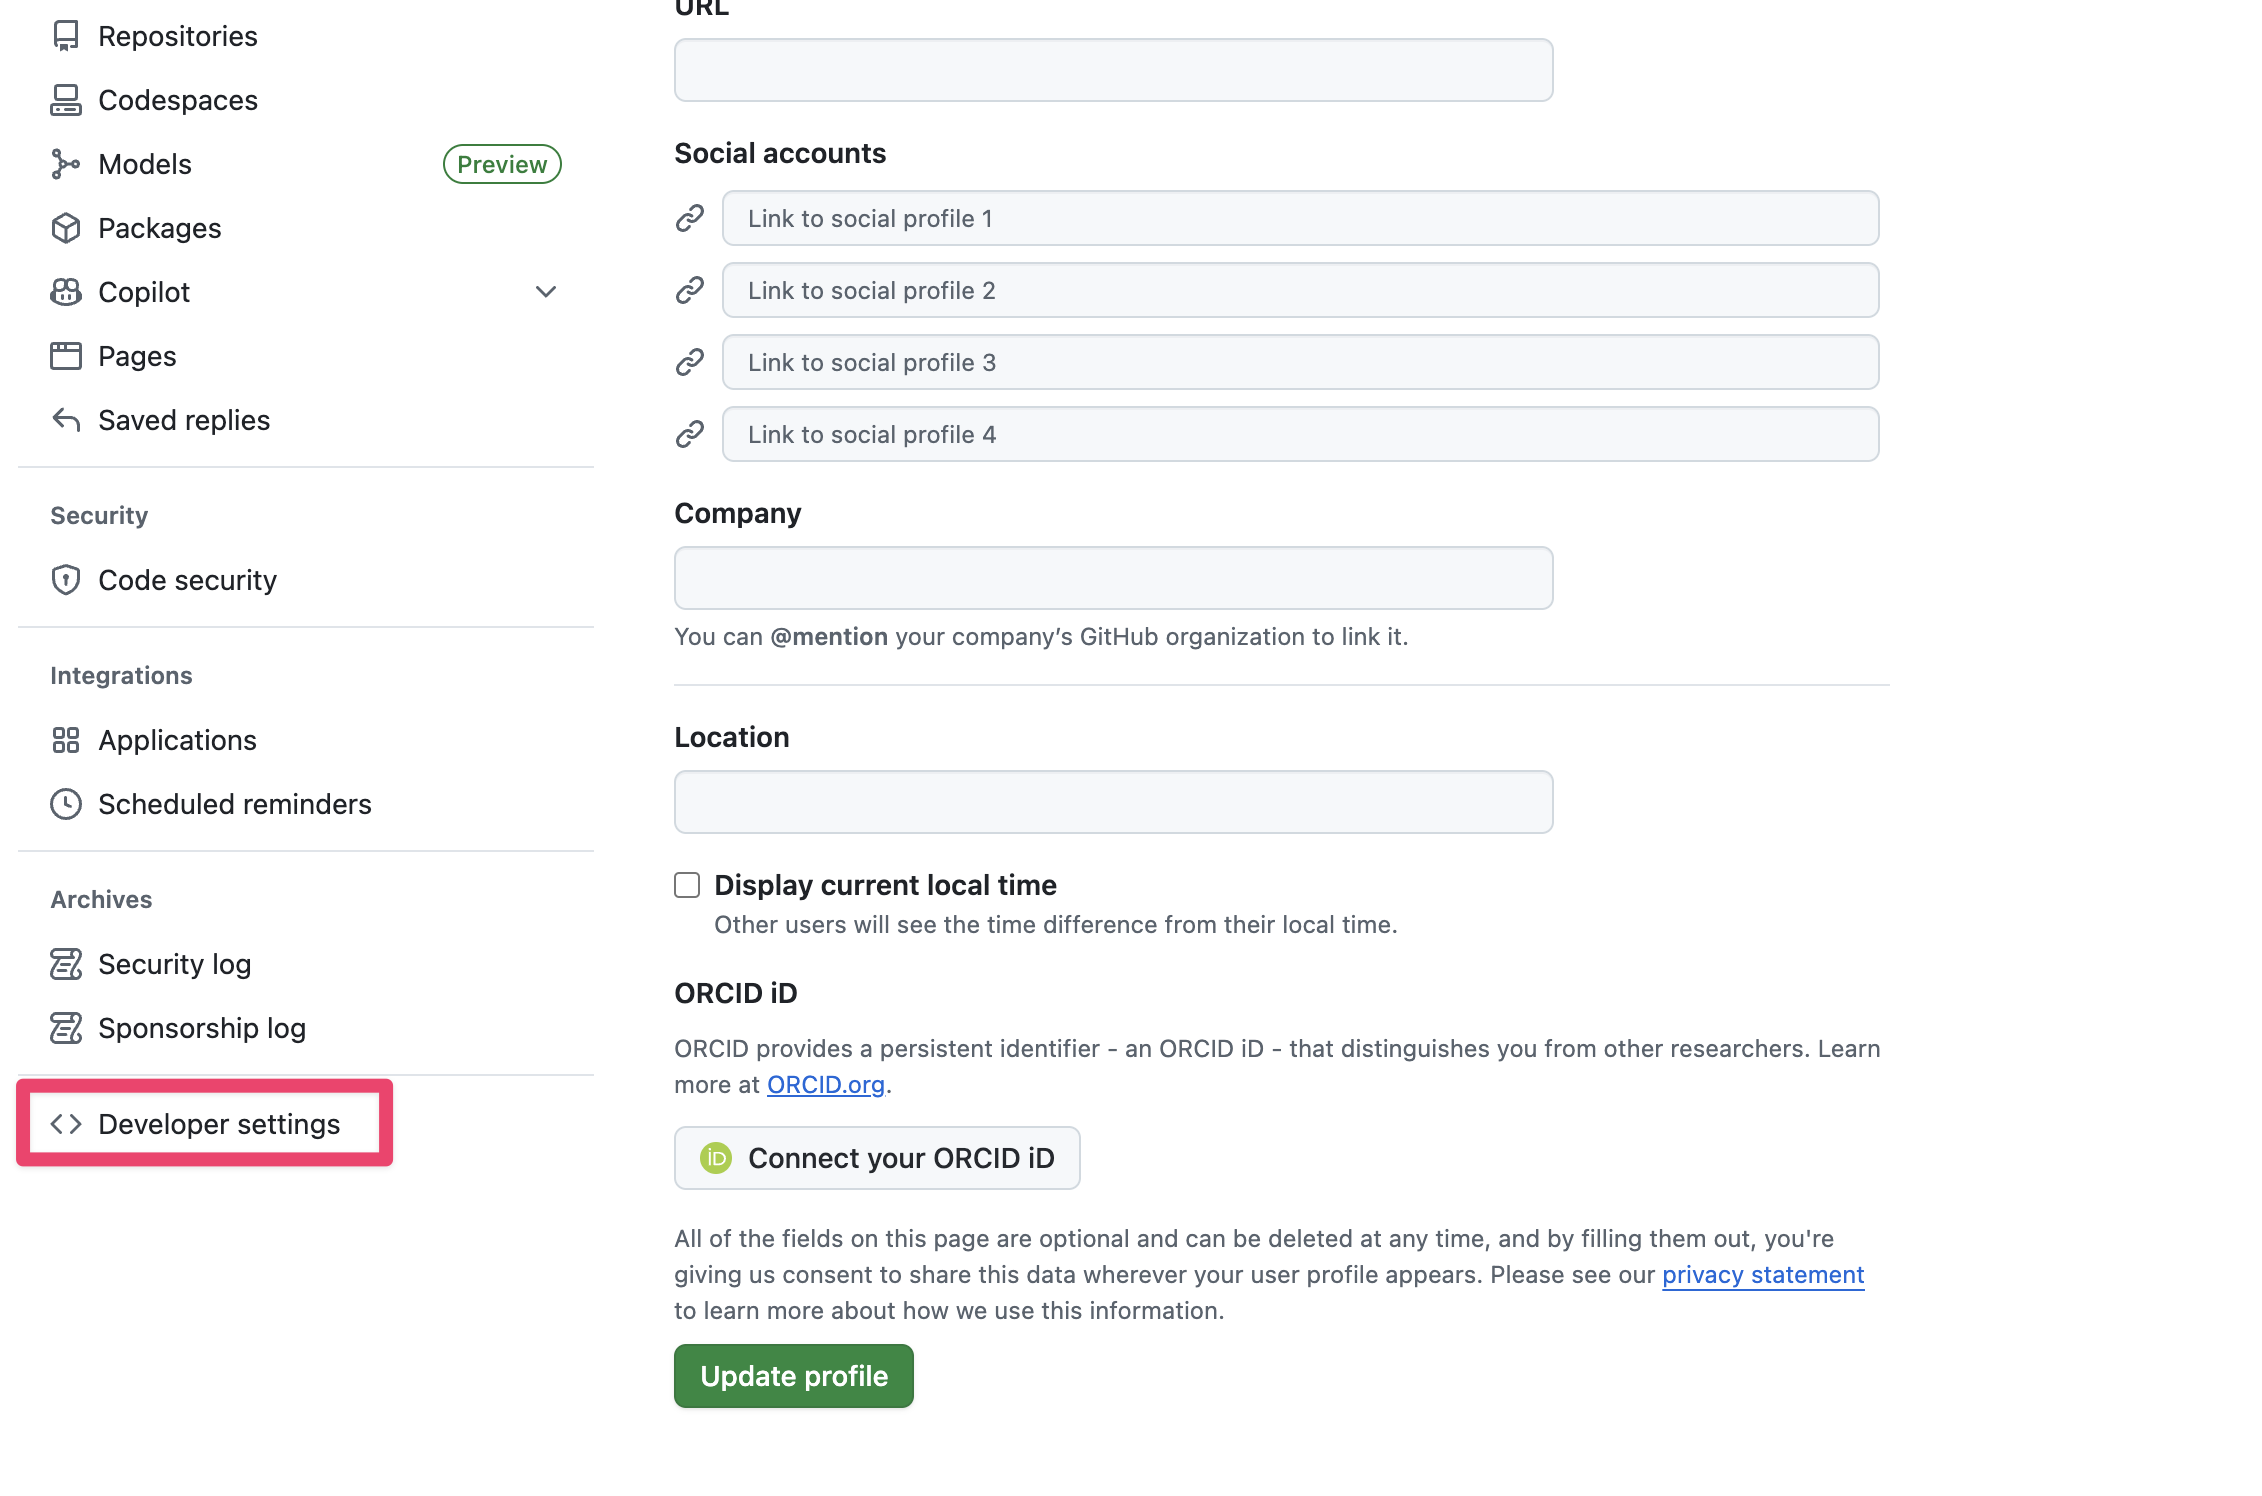
Next, open Fine-grained tokens.
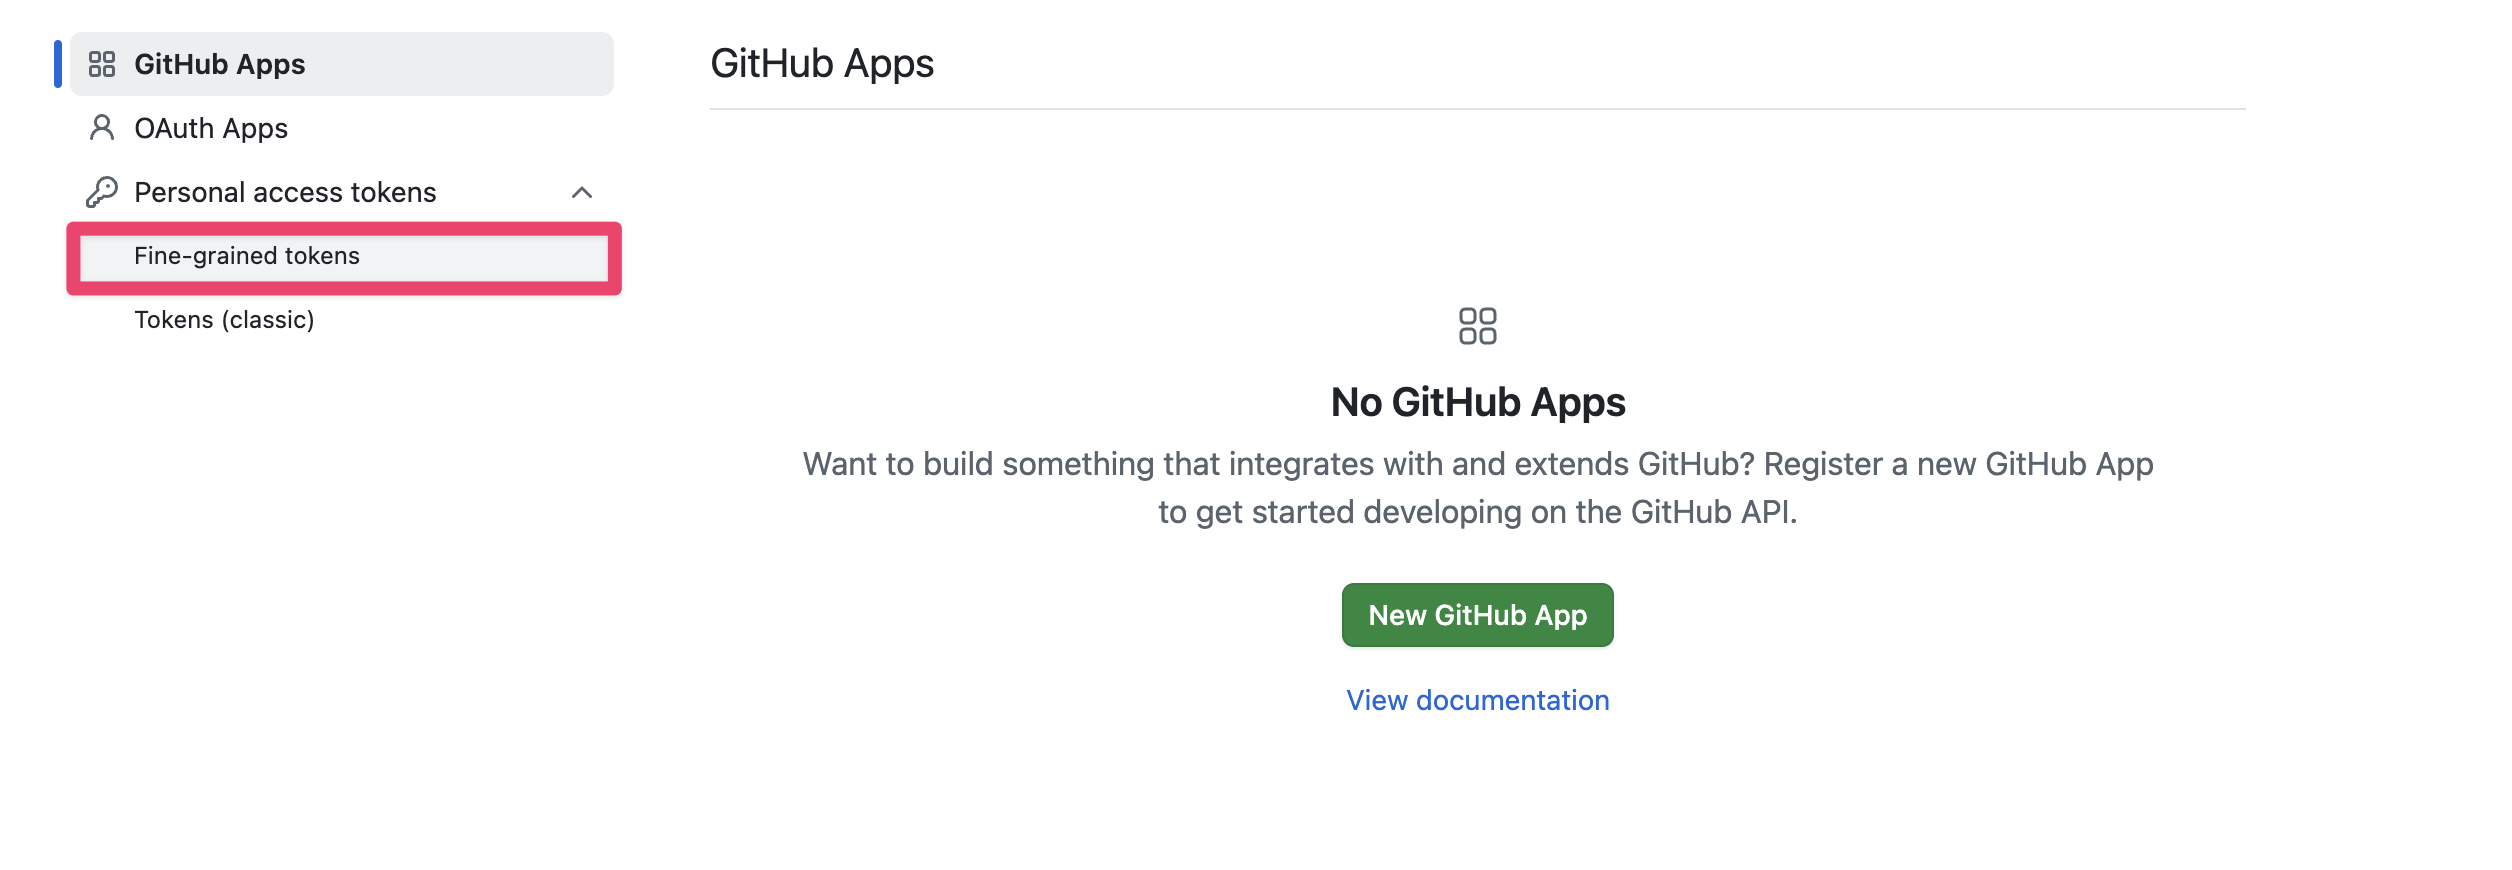
Click Generate new token to create a new token.
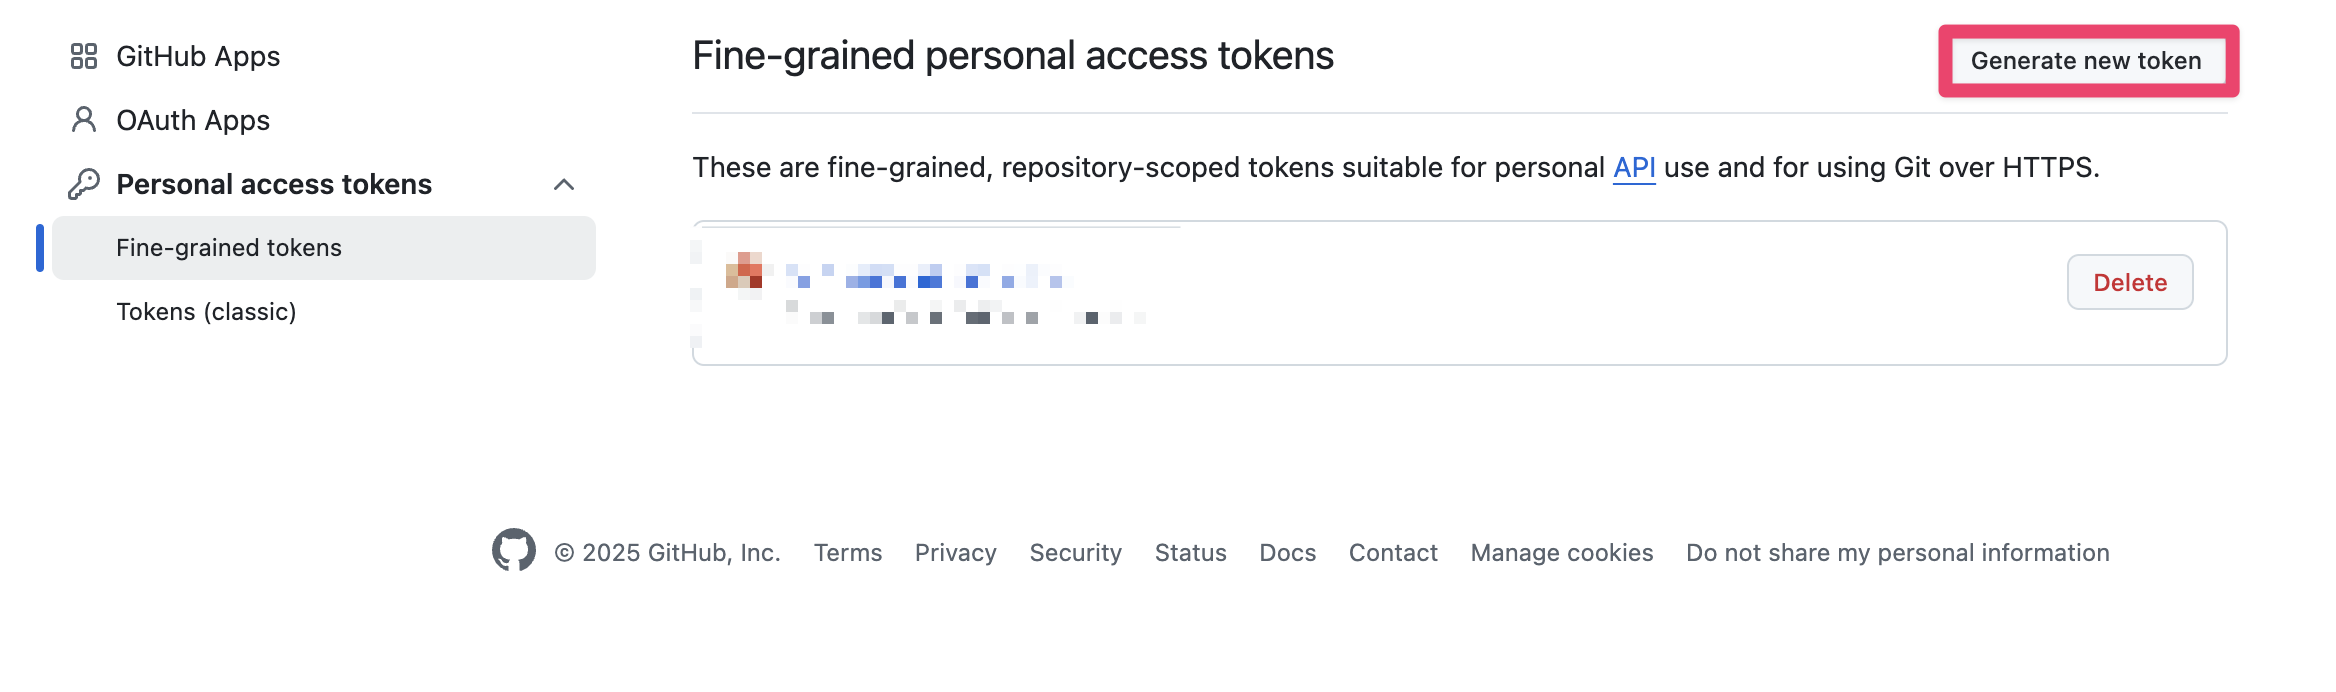
Select an appropriate token name, expiration date, and target repository.
Set the following permissions necessary for Git Sync in the Permissions section.
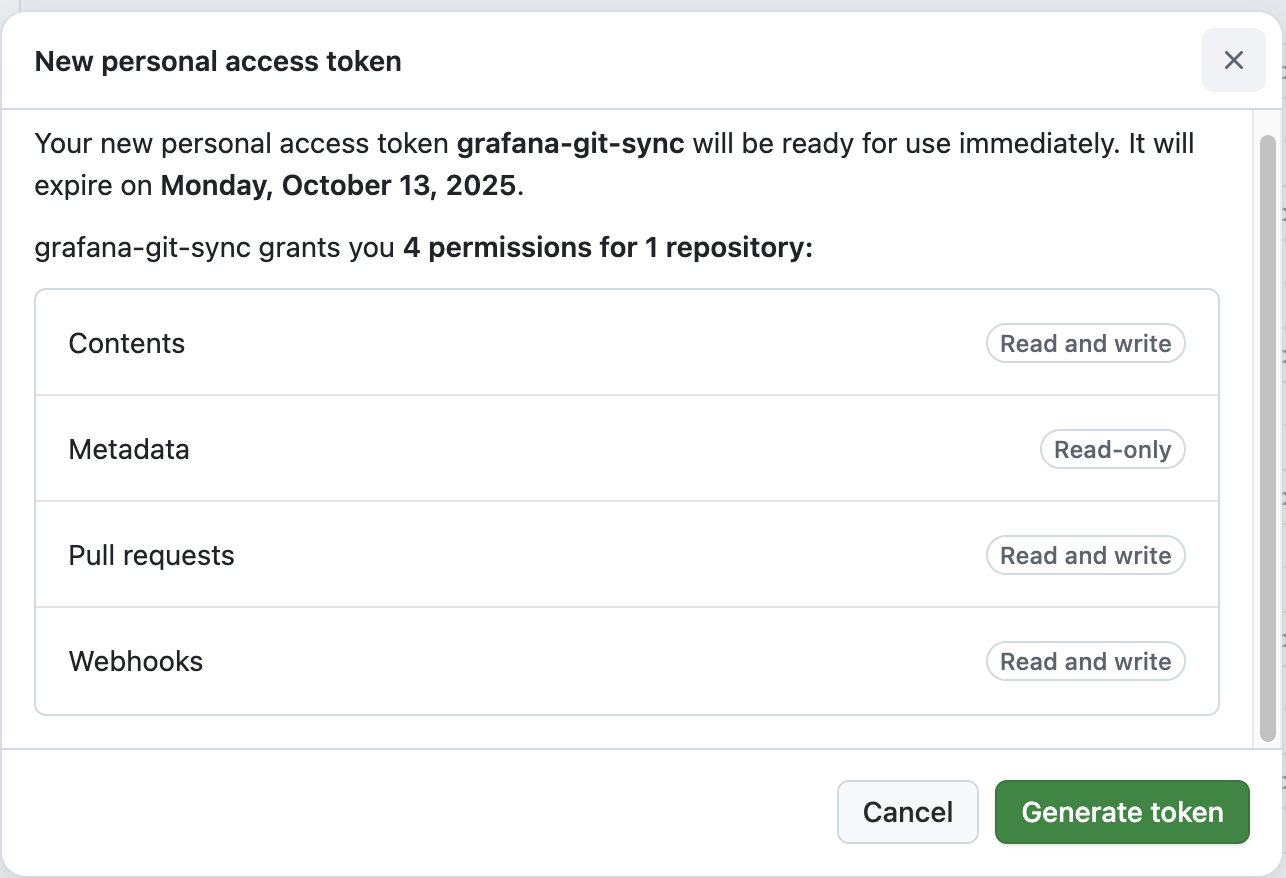
Click Generate token and copy the issued token.### Connecting with GitHub
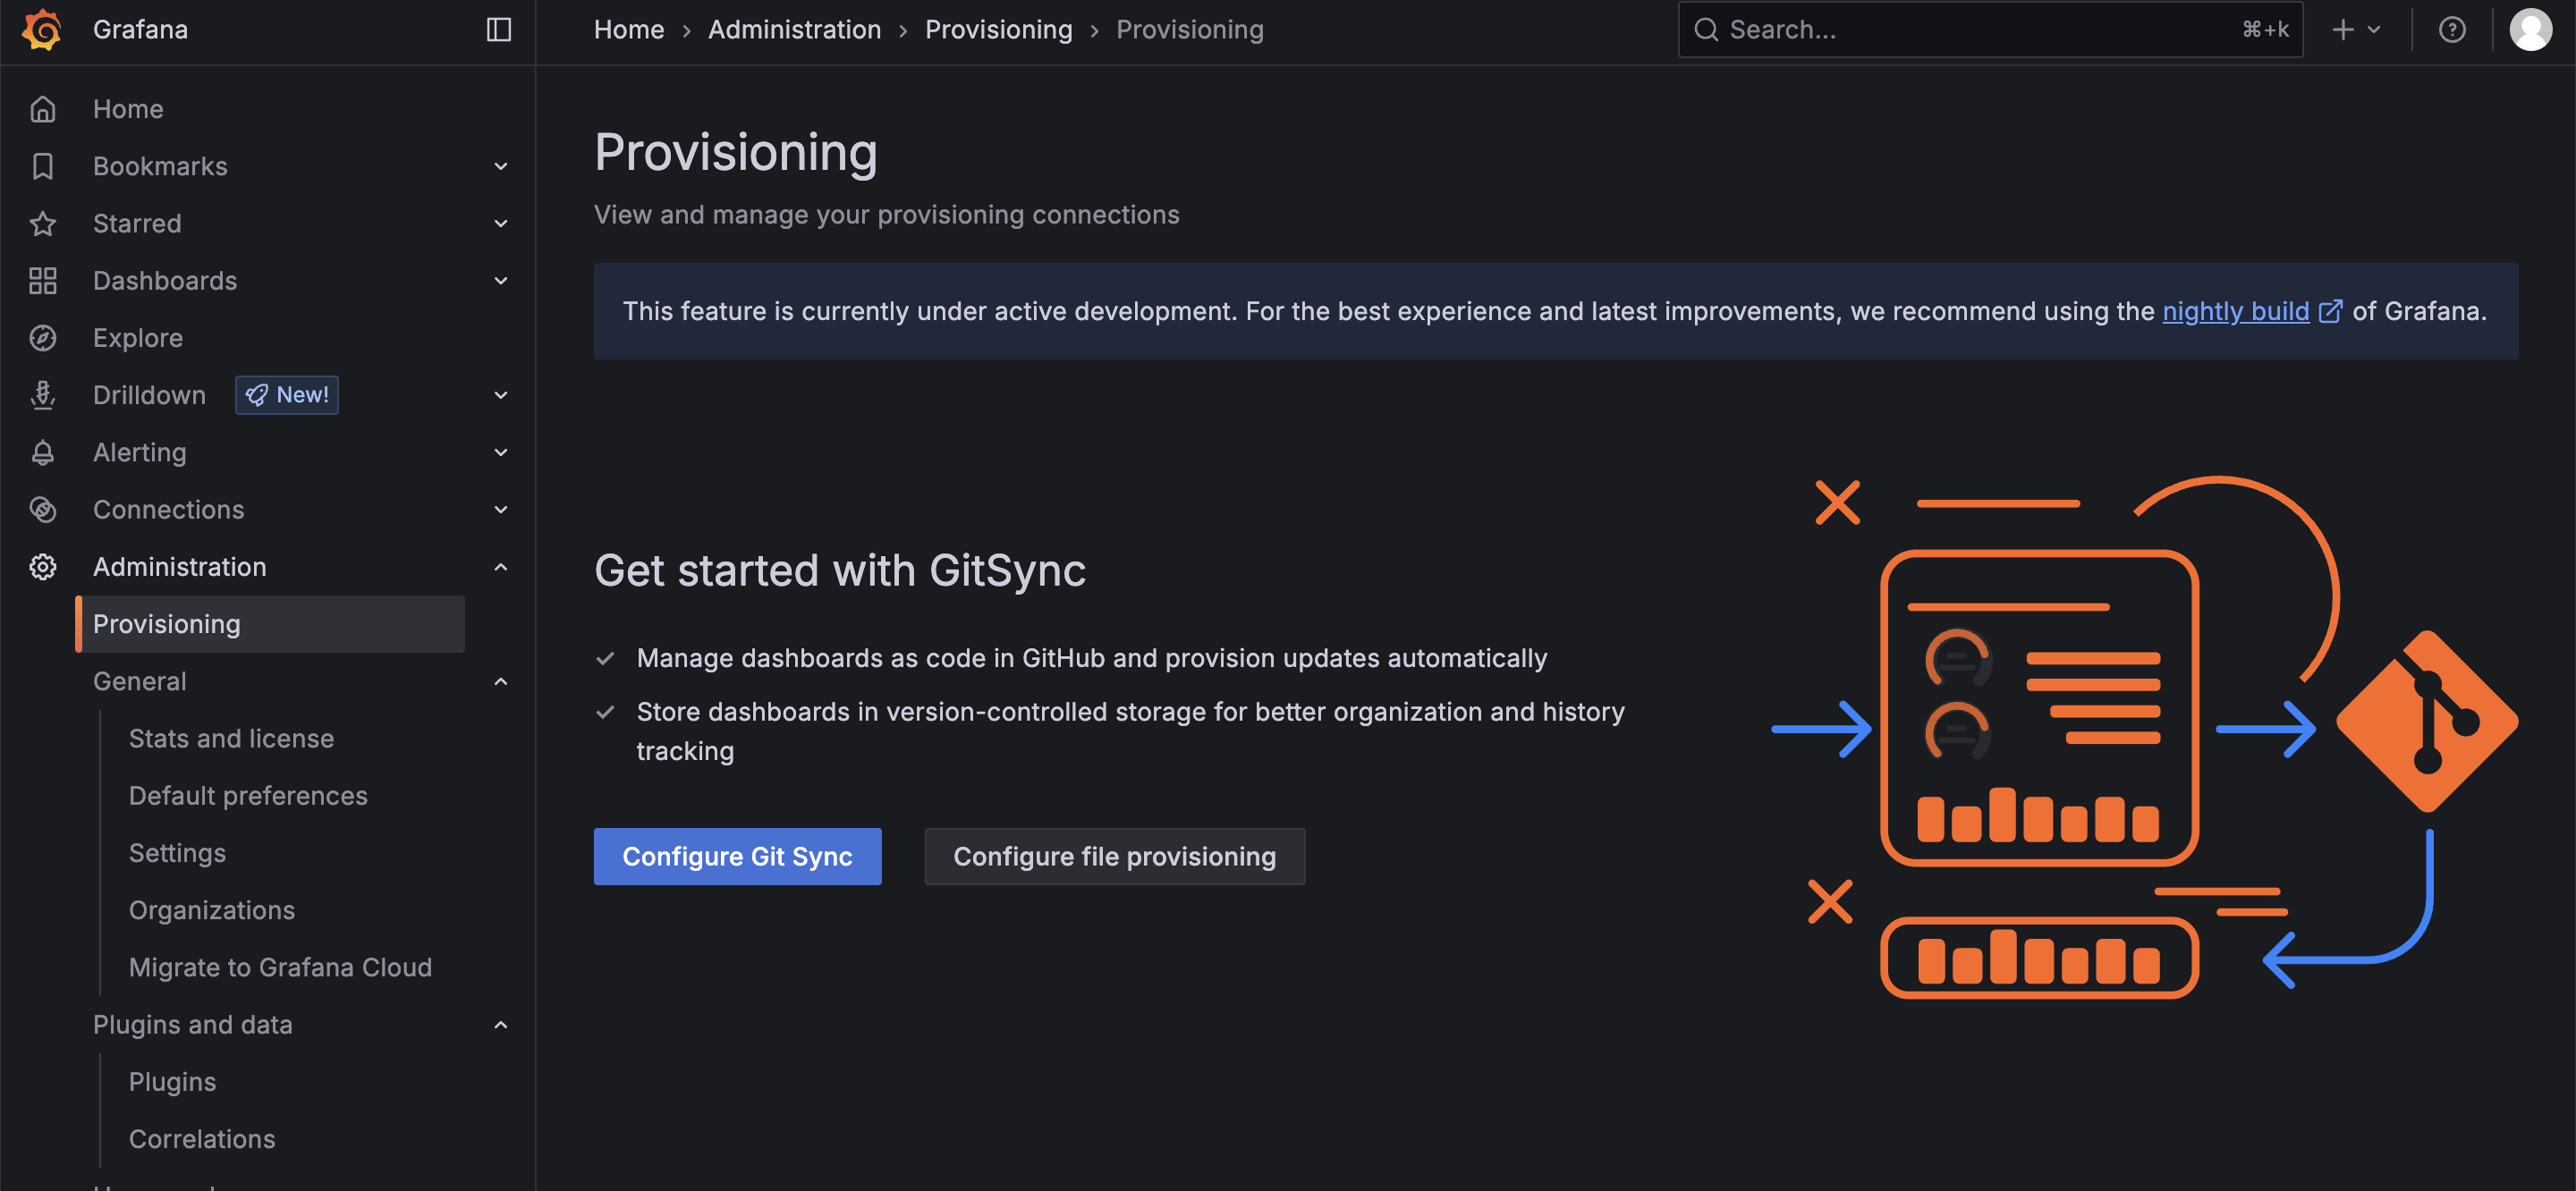
Log in to Grafana, then click on Administration > Provisioning > Configure Git Sync from the left menu.
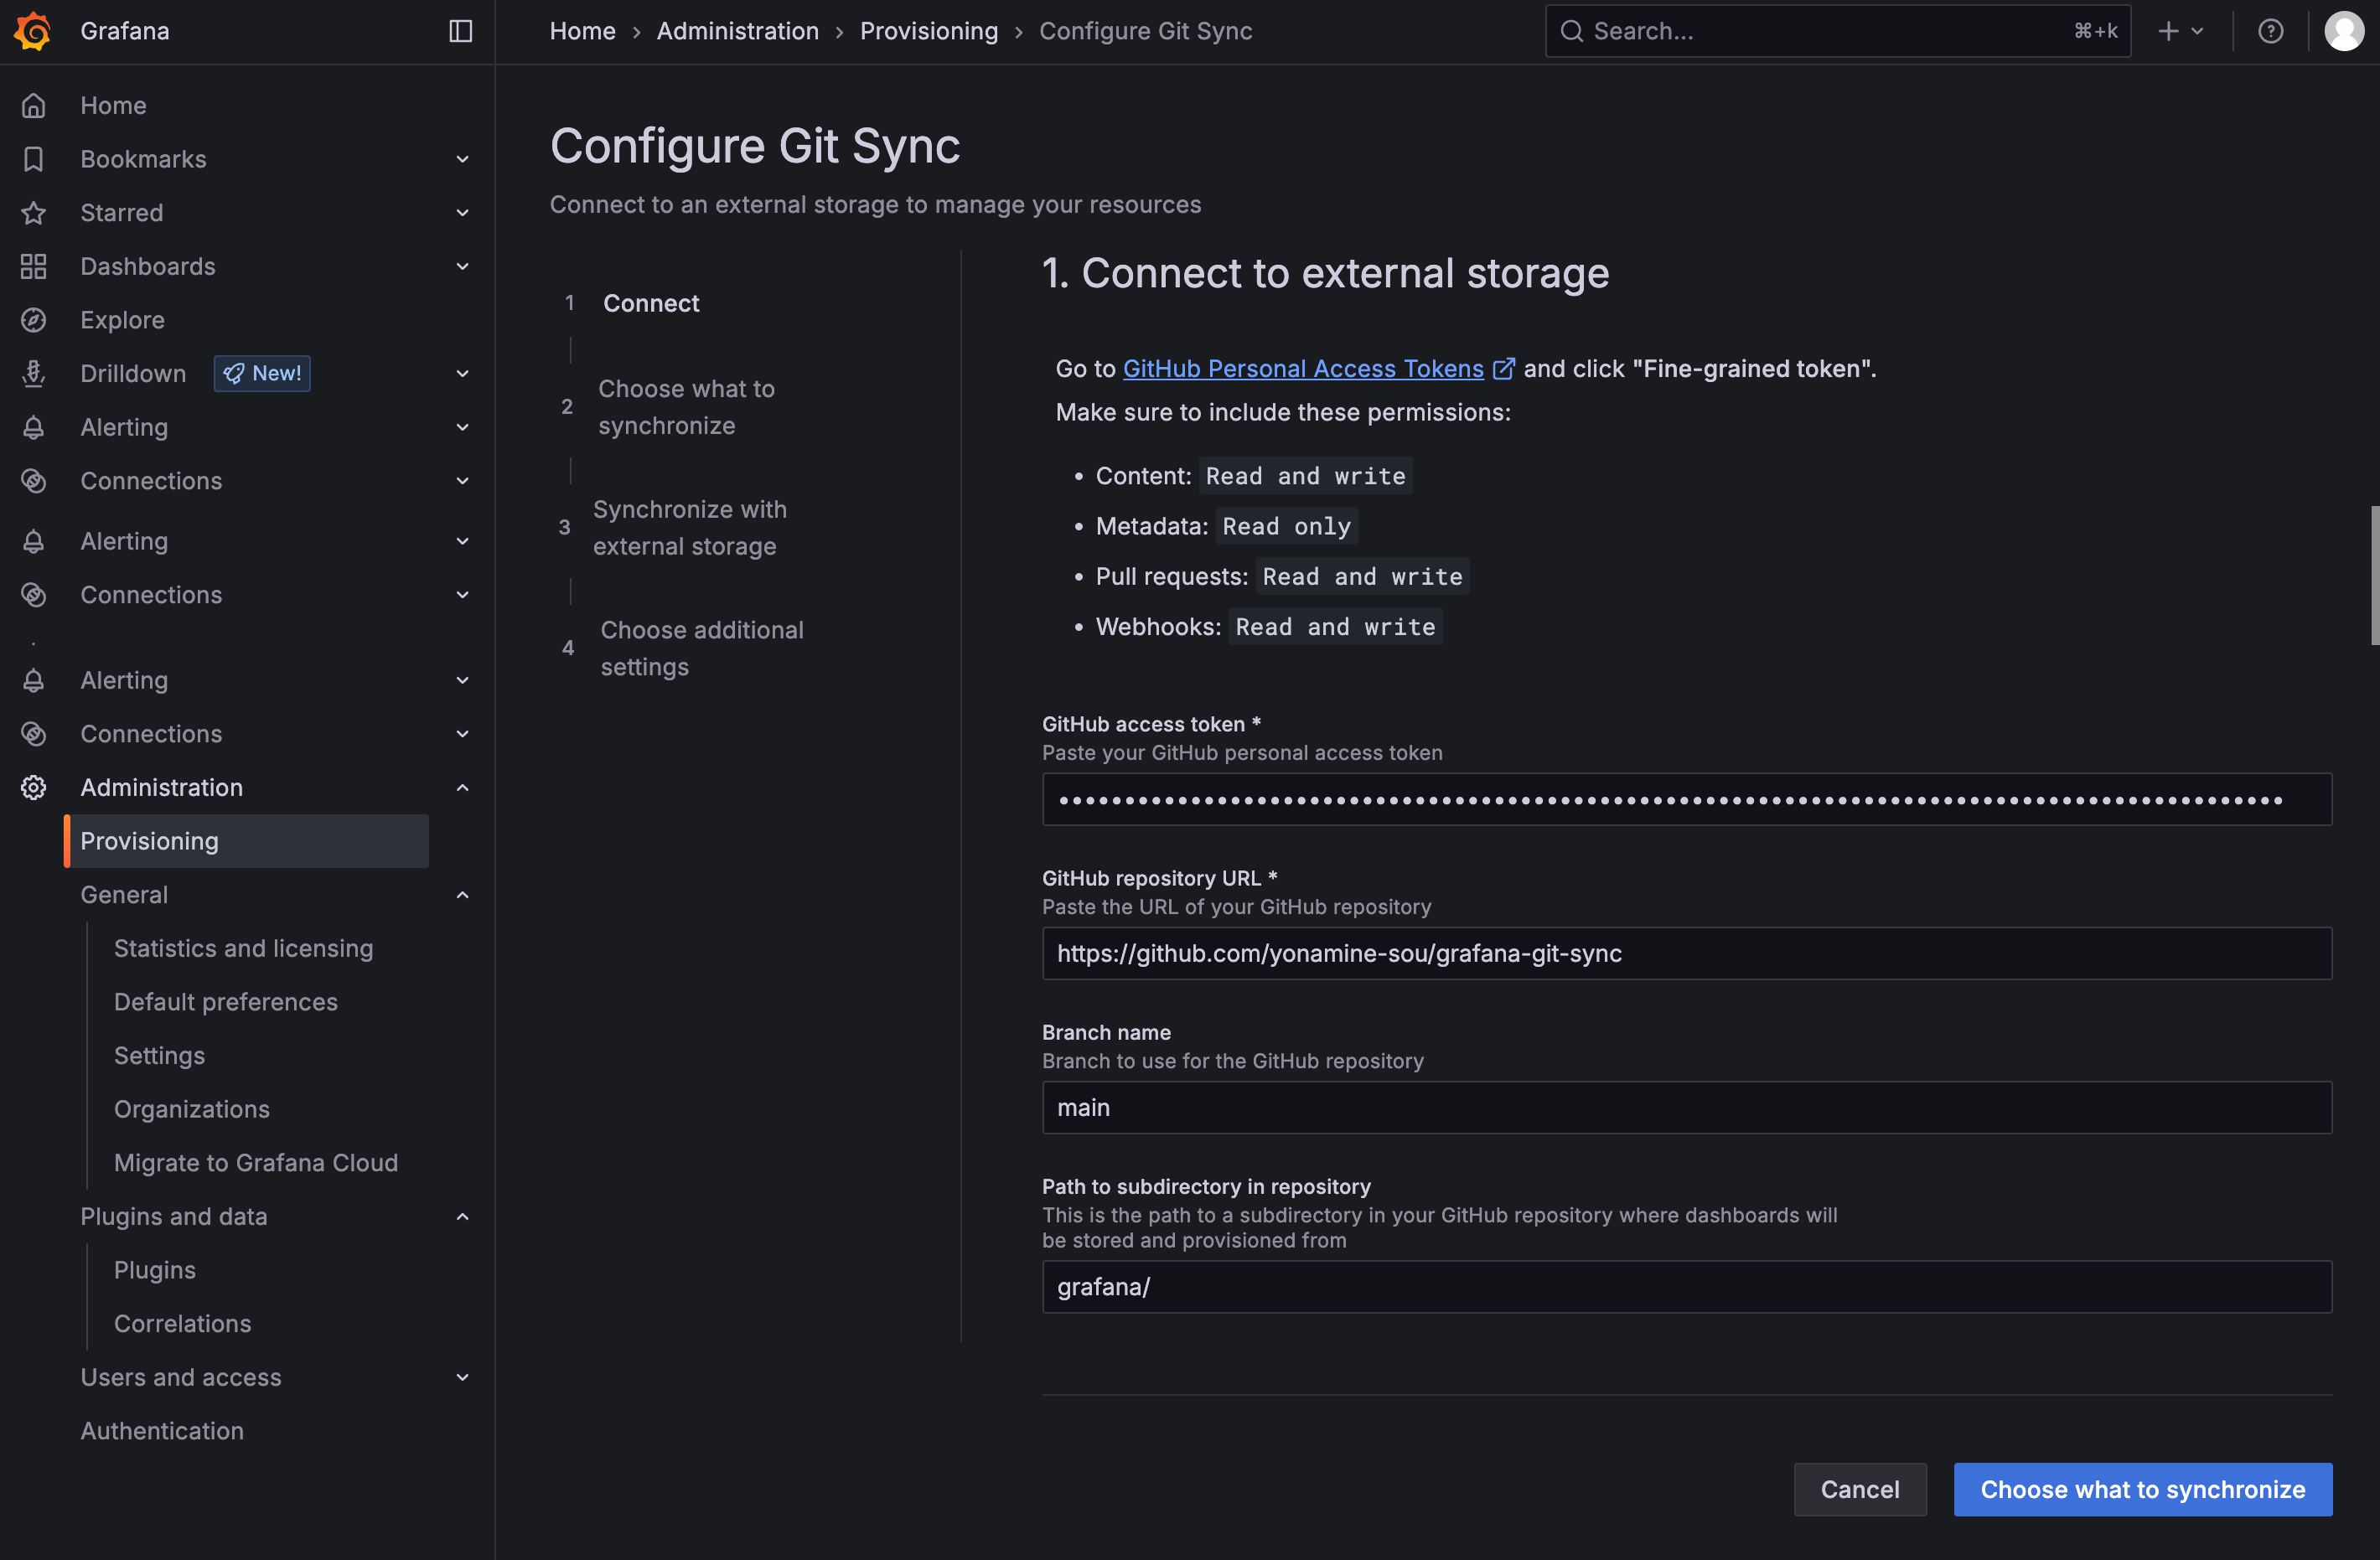
Enter the GitHub access token and repository URL that you obtained earlier.
Next, enter the default branch and repository path.
As shown in the figure below, if you specify grafana/ as the repository path, a directory called grafana will be automatically created when saving the dashboard JSON.
Next, you will be asked about synchronization targets. In this case, select "Sync all resources with external storage" to ensure that all dashboards are synchronized.
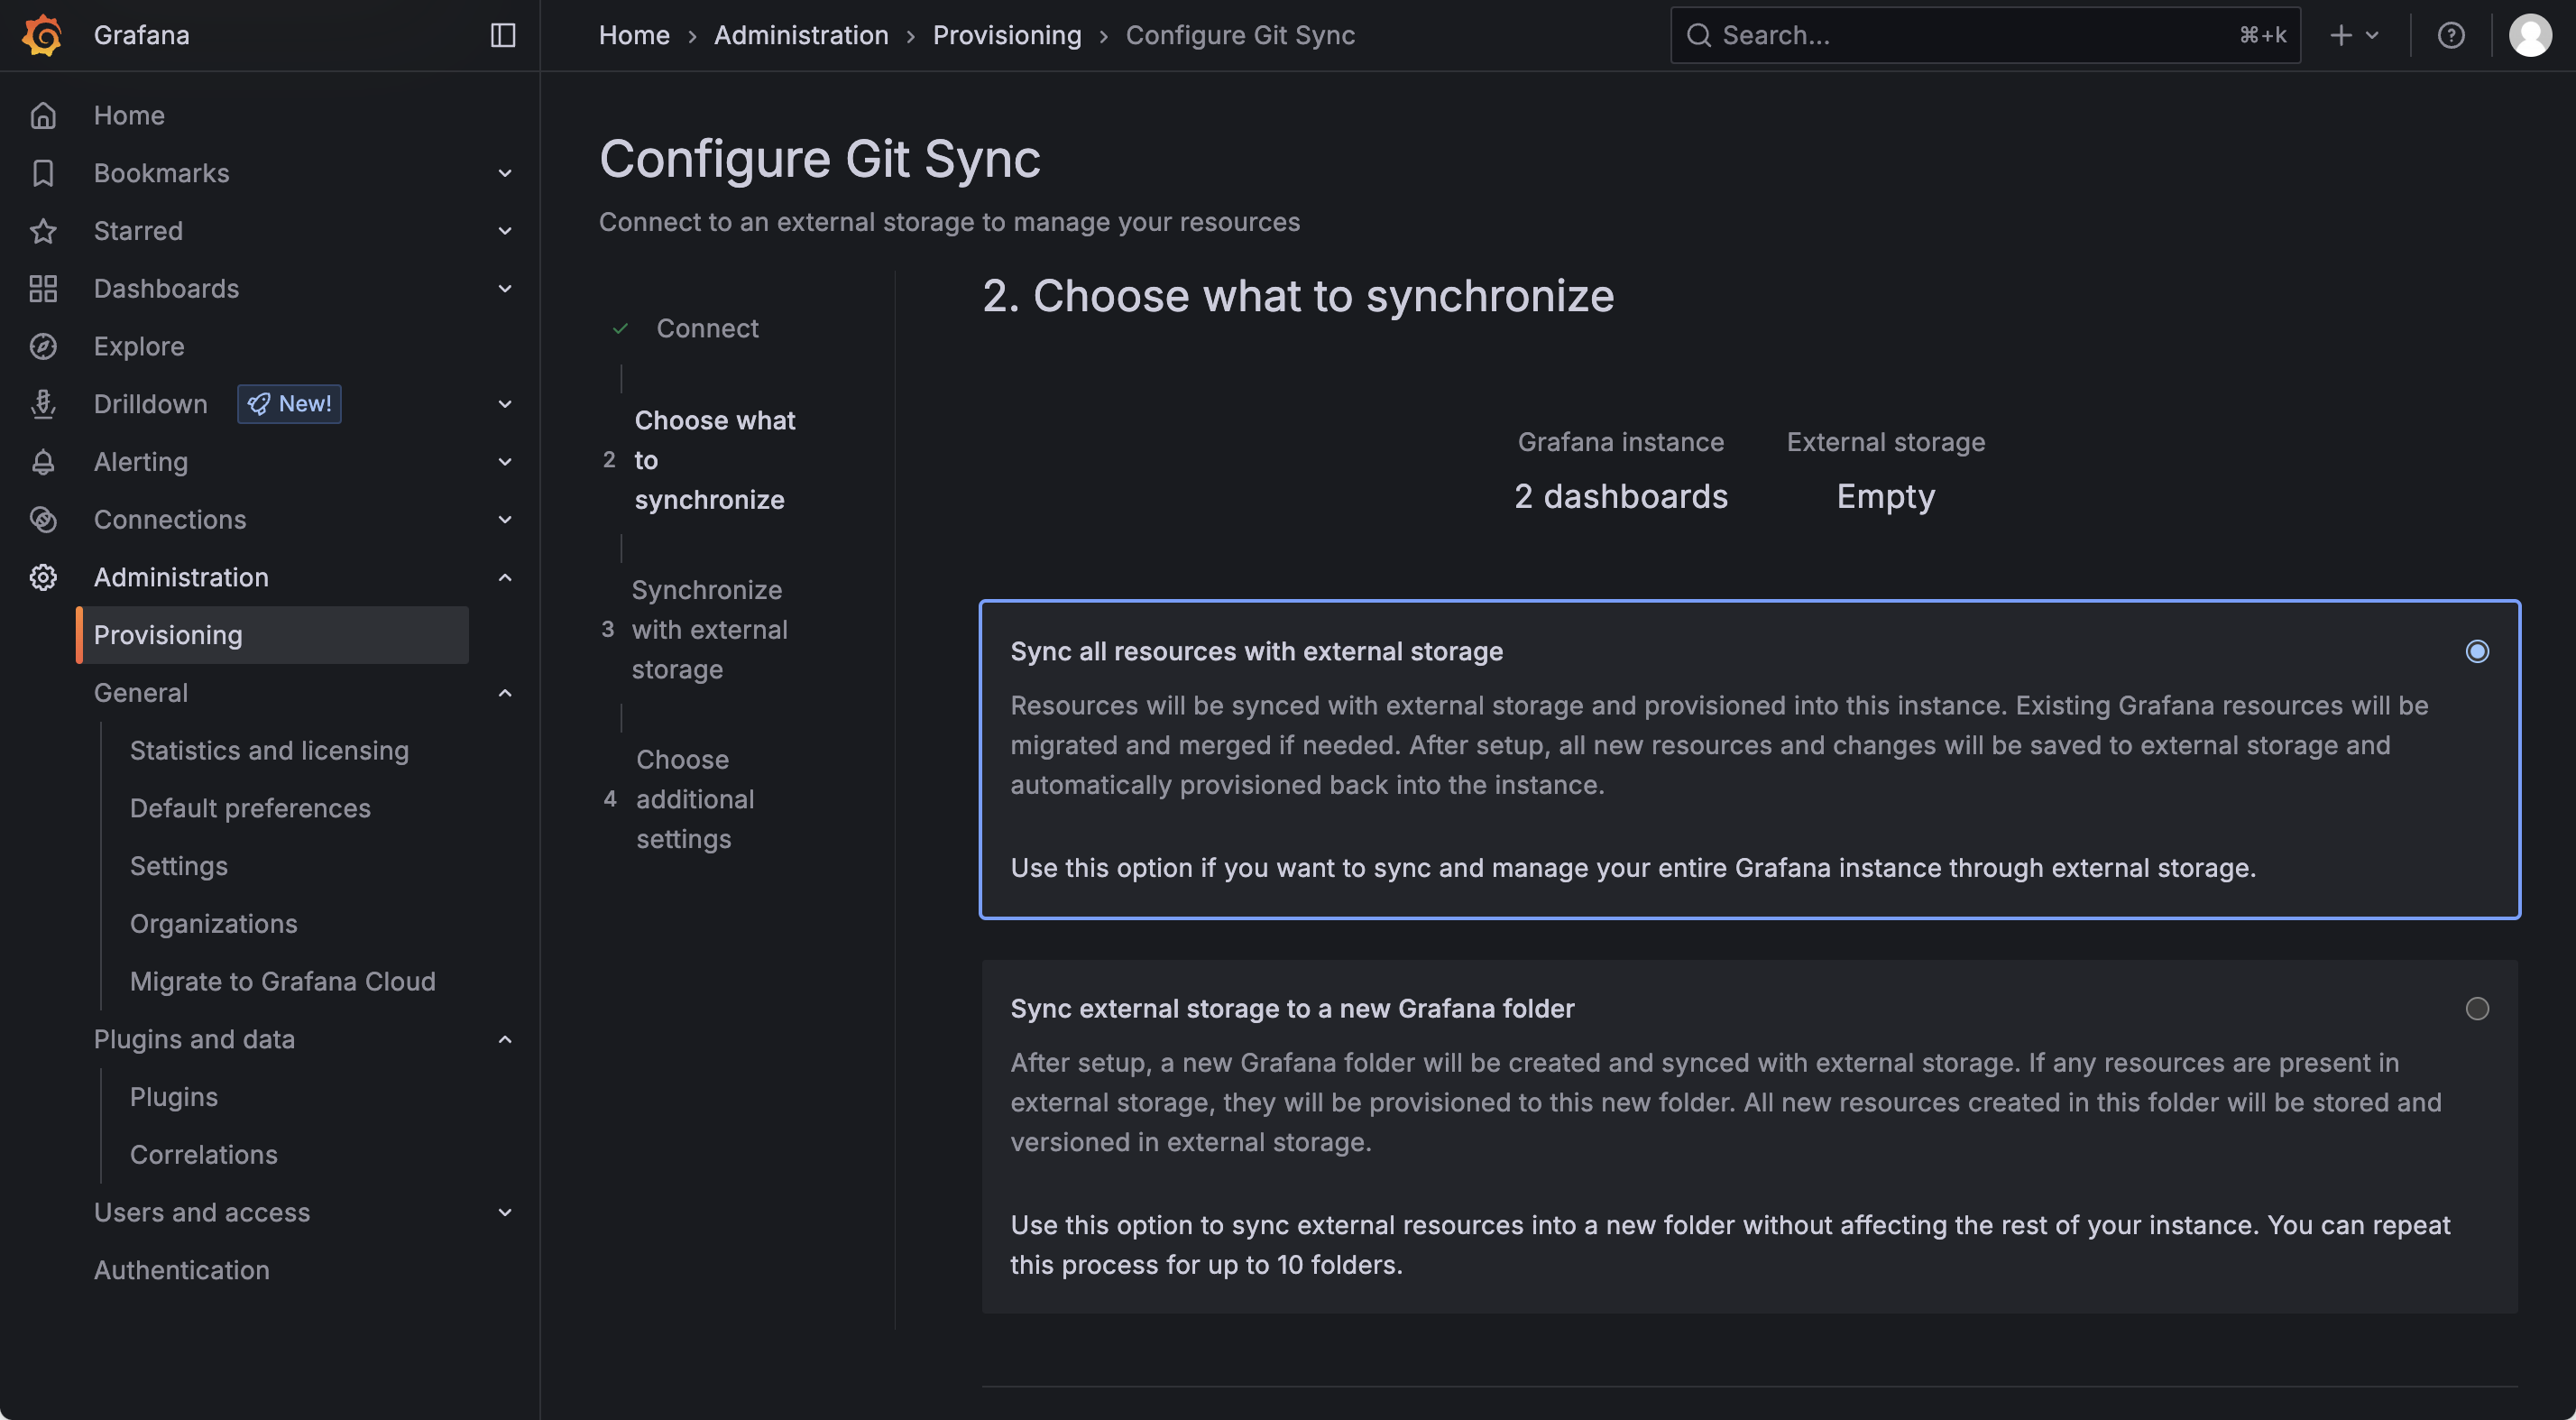
If you select "Sync external storage to a new Grafana folder," a new dashboard folder will be created, and dashboards under that folder will be synchronized with GitHub.
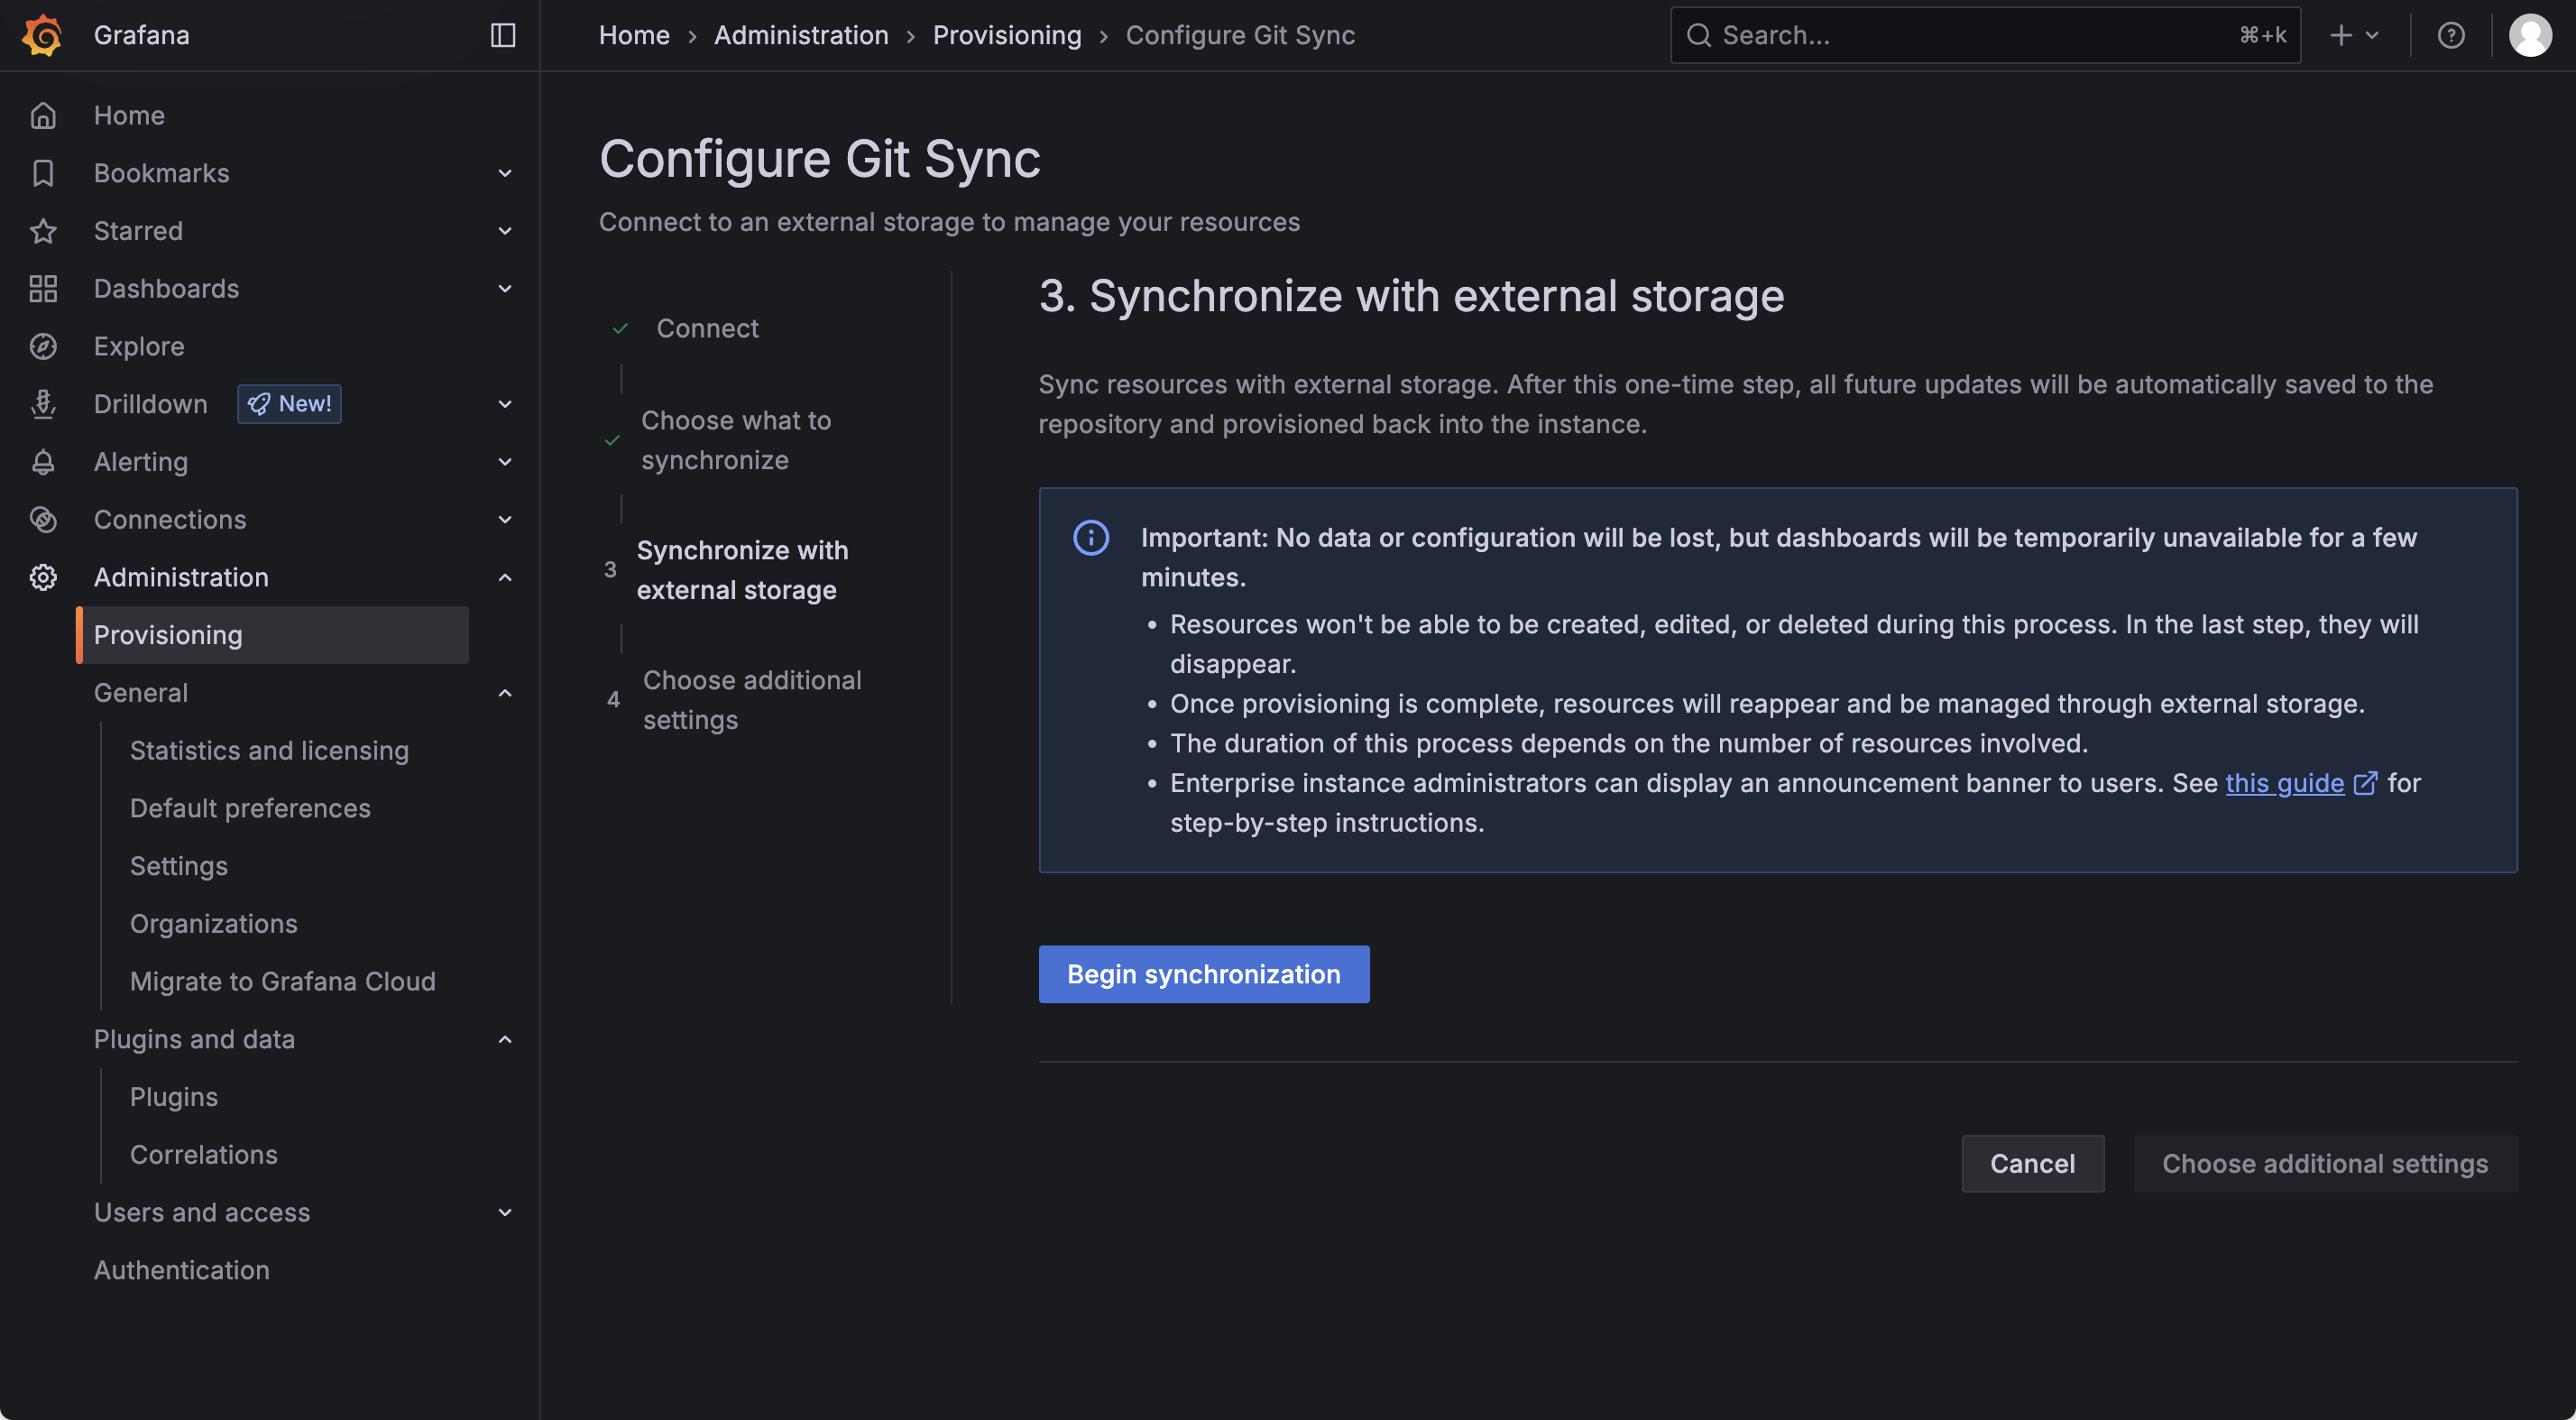
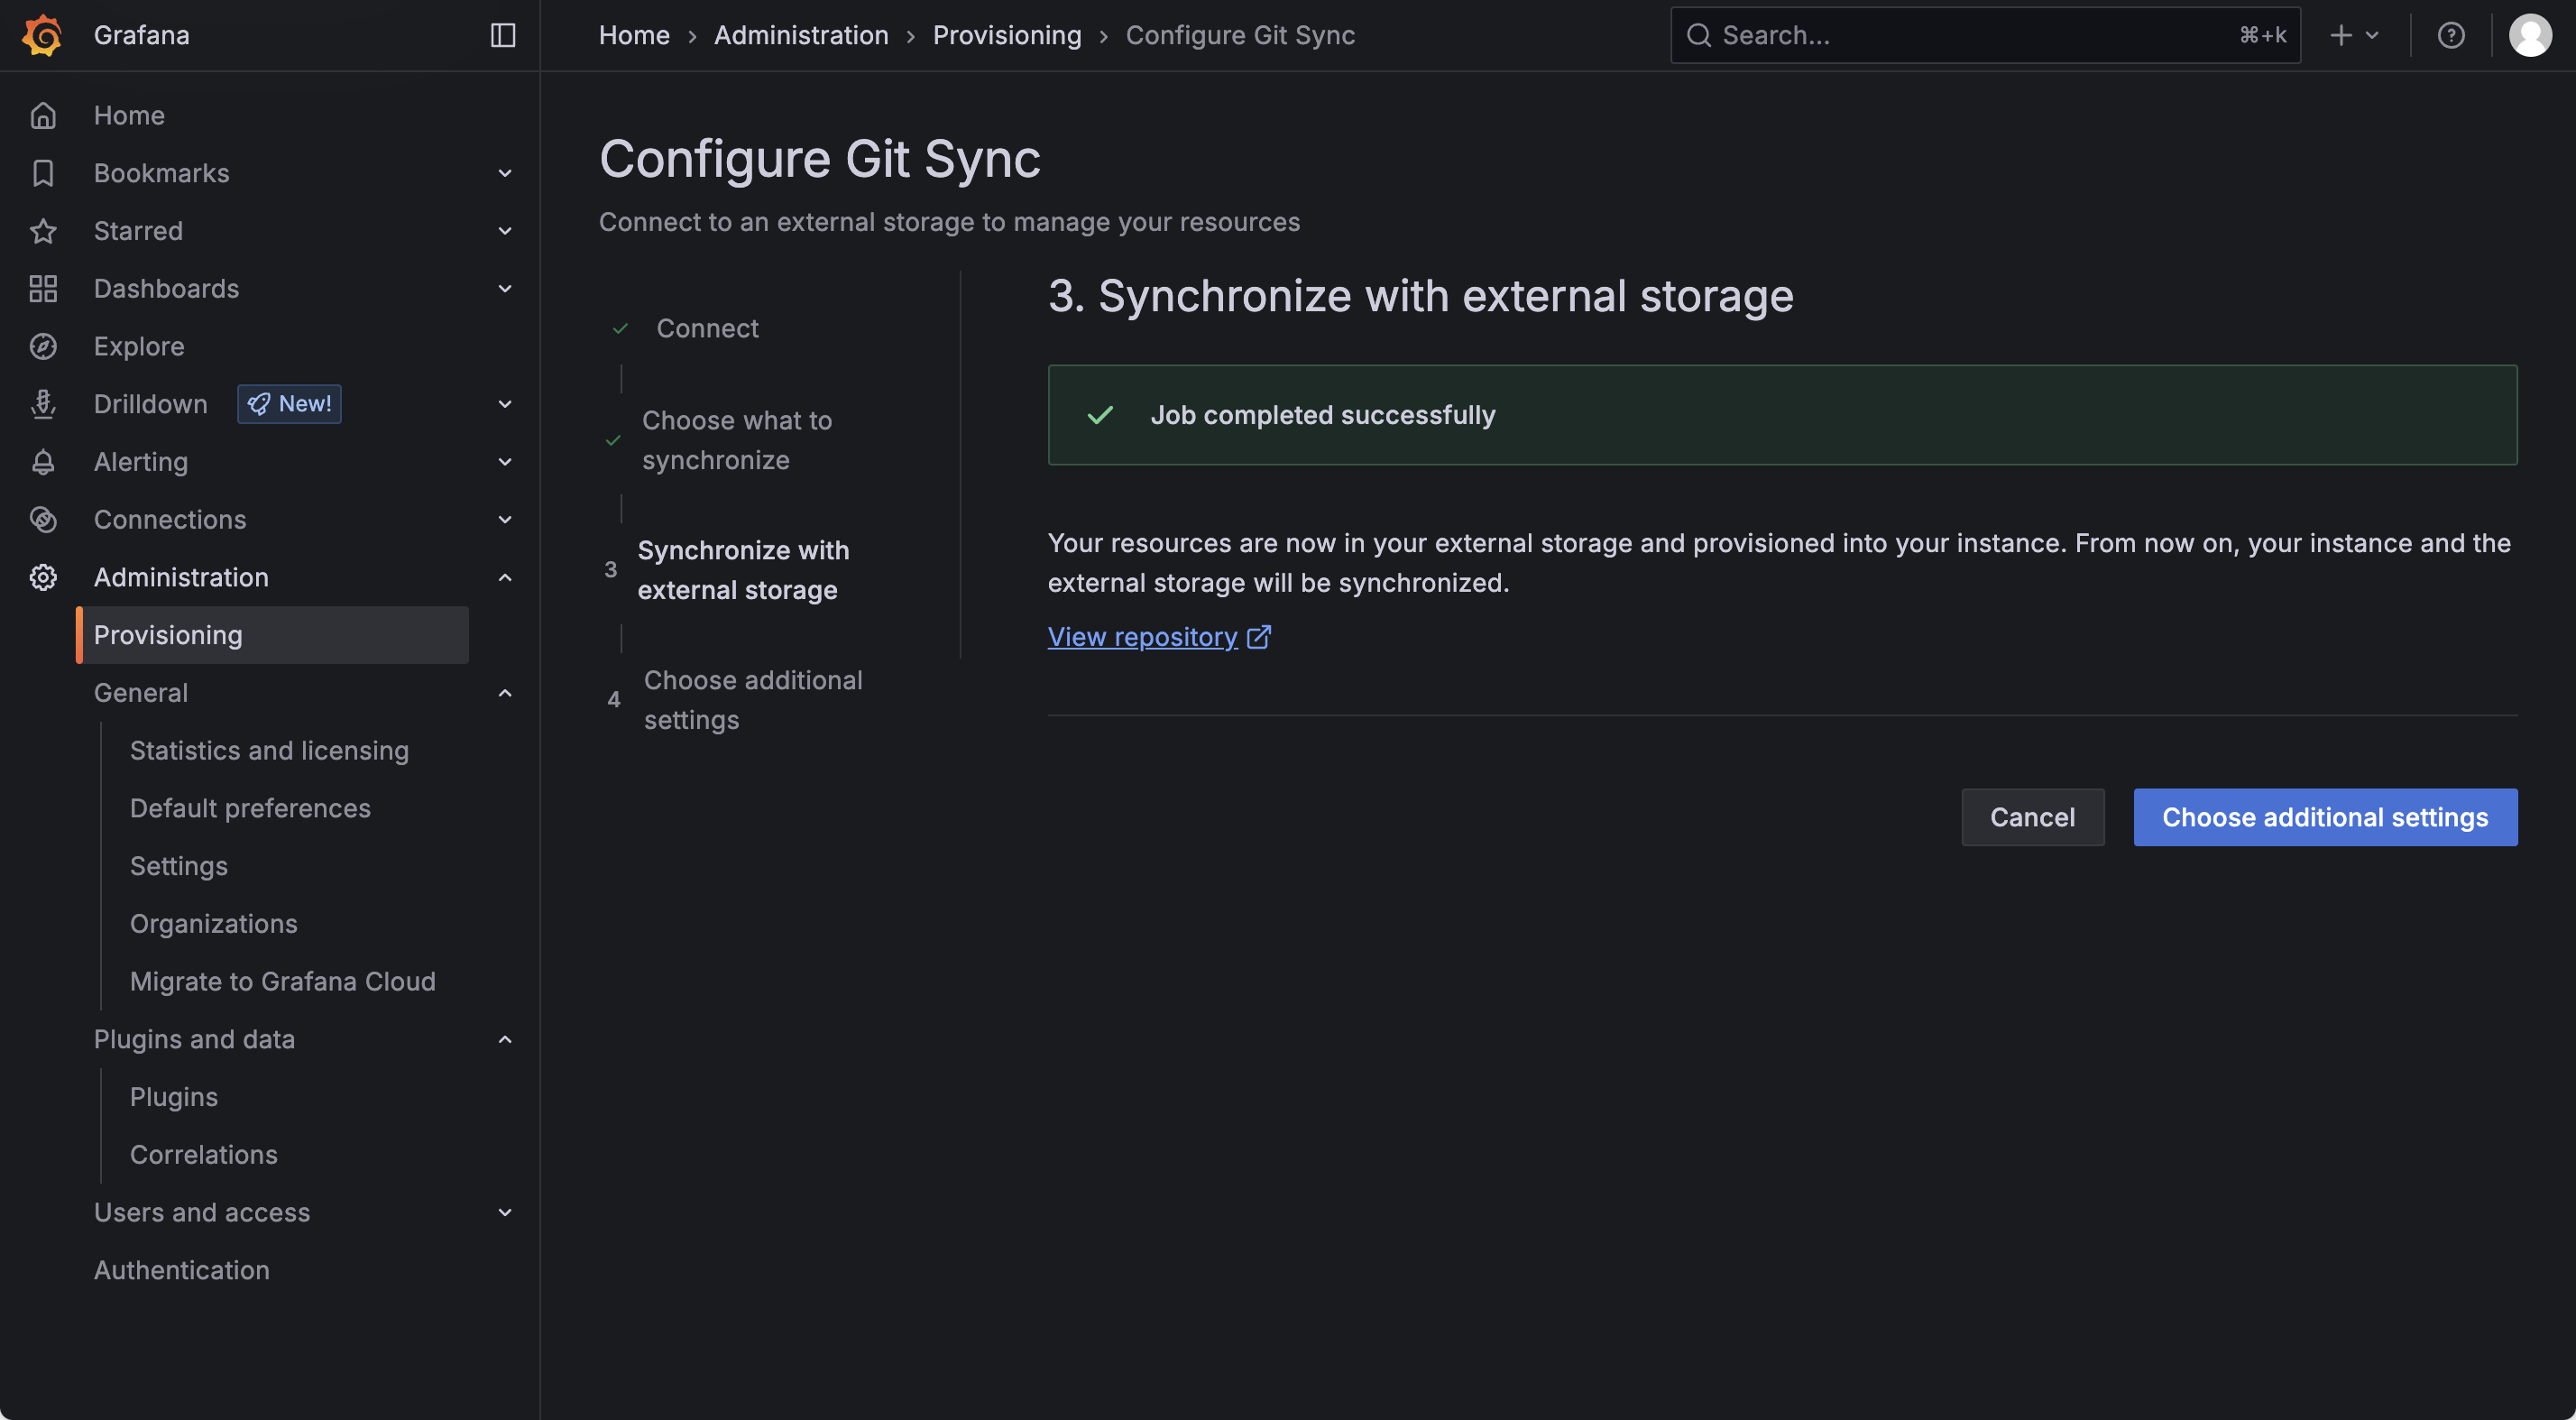
Next, synchronize Grafana and GitHub.
As noted in the caution section, when you click "Begin synchronization" to start syncing, dashboards will be temporarily unavailable, so be careful if multiple people are using them.
If the connection is successful, Job completed successfully will be displayed.
Finally, there are optional settings.
For now, we will complete the setup without configuring anything.
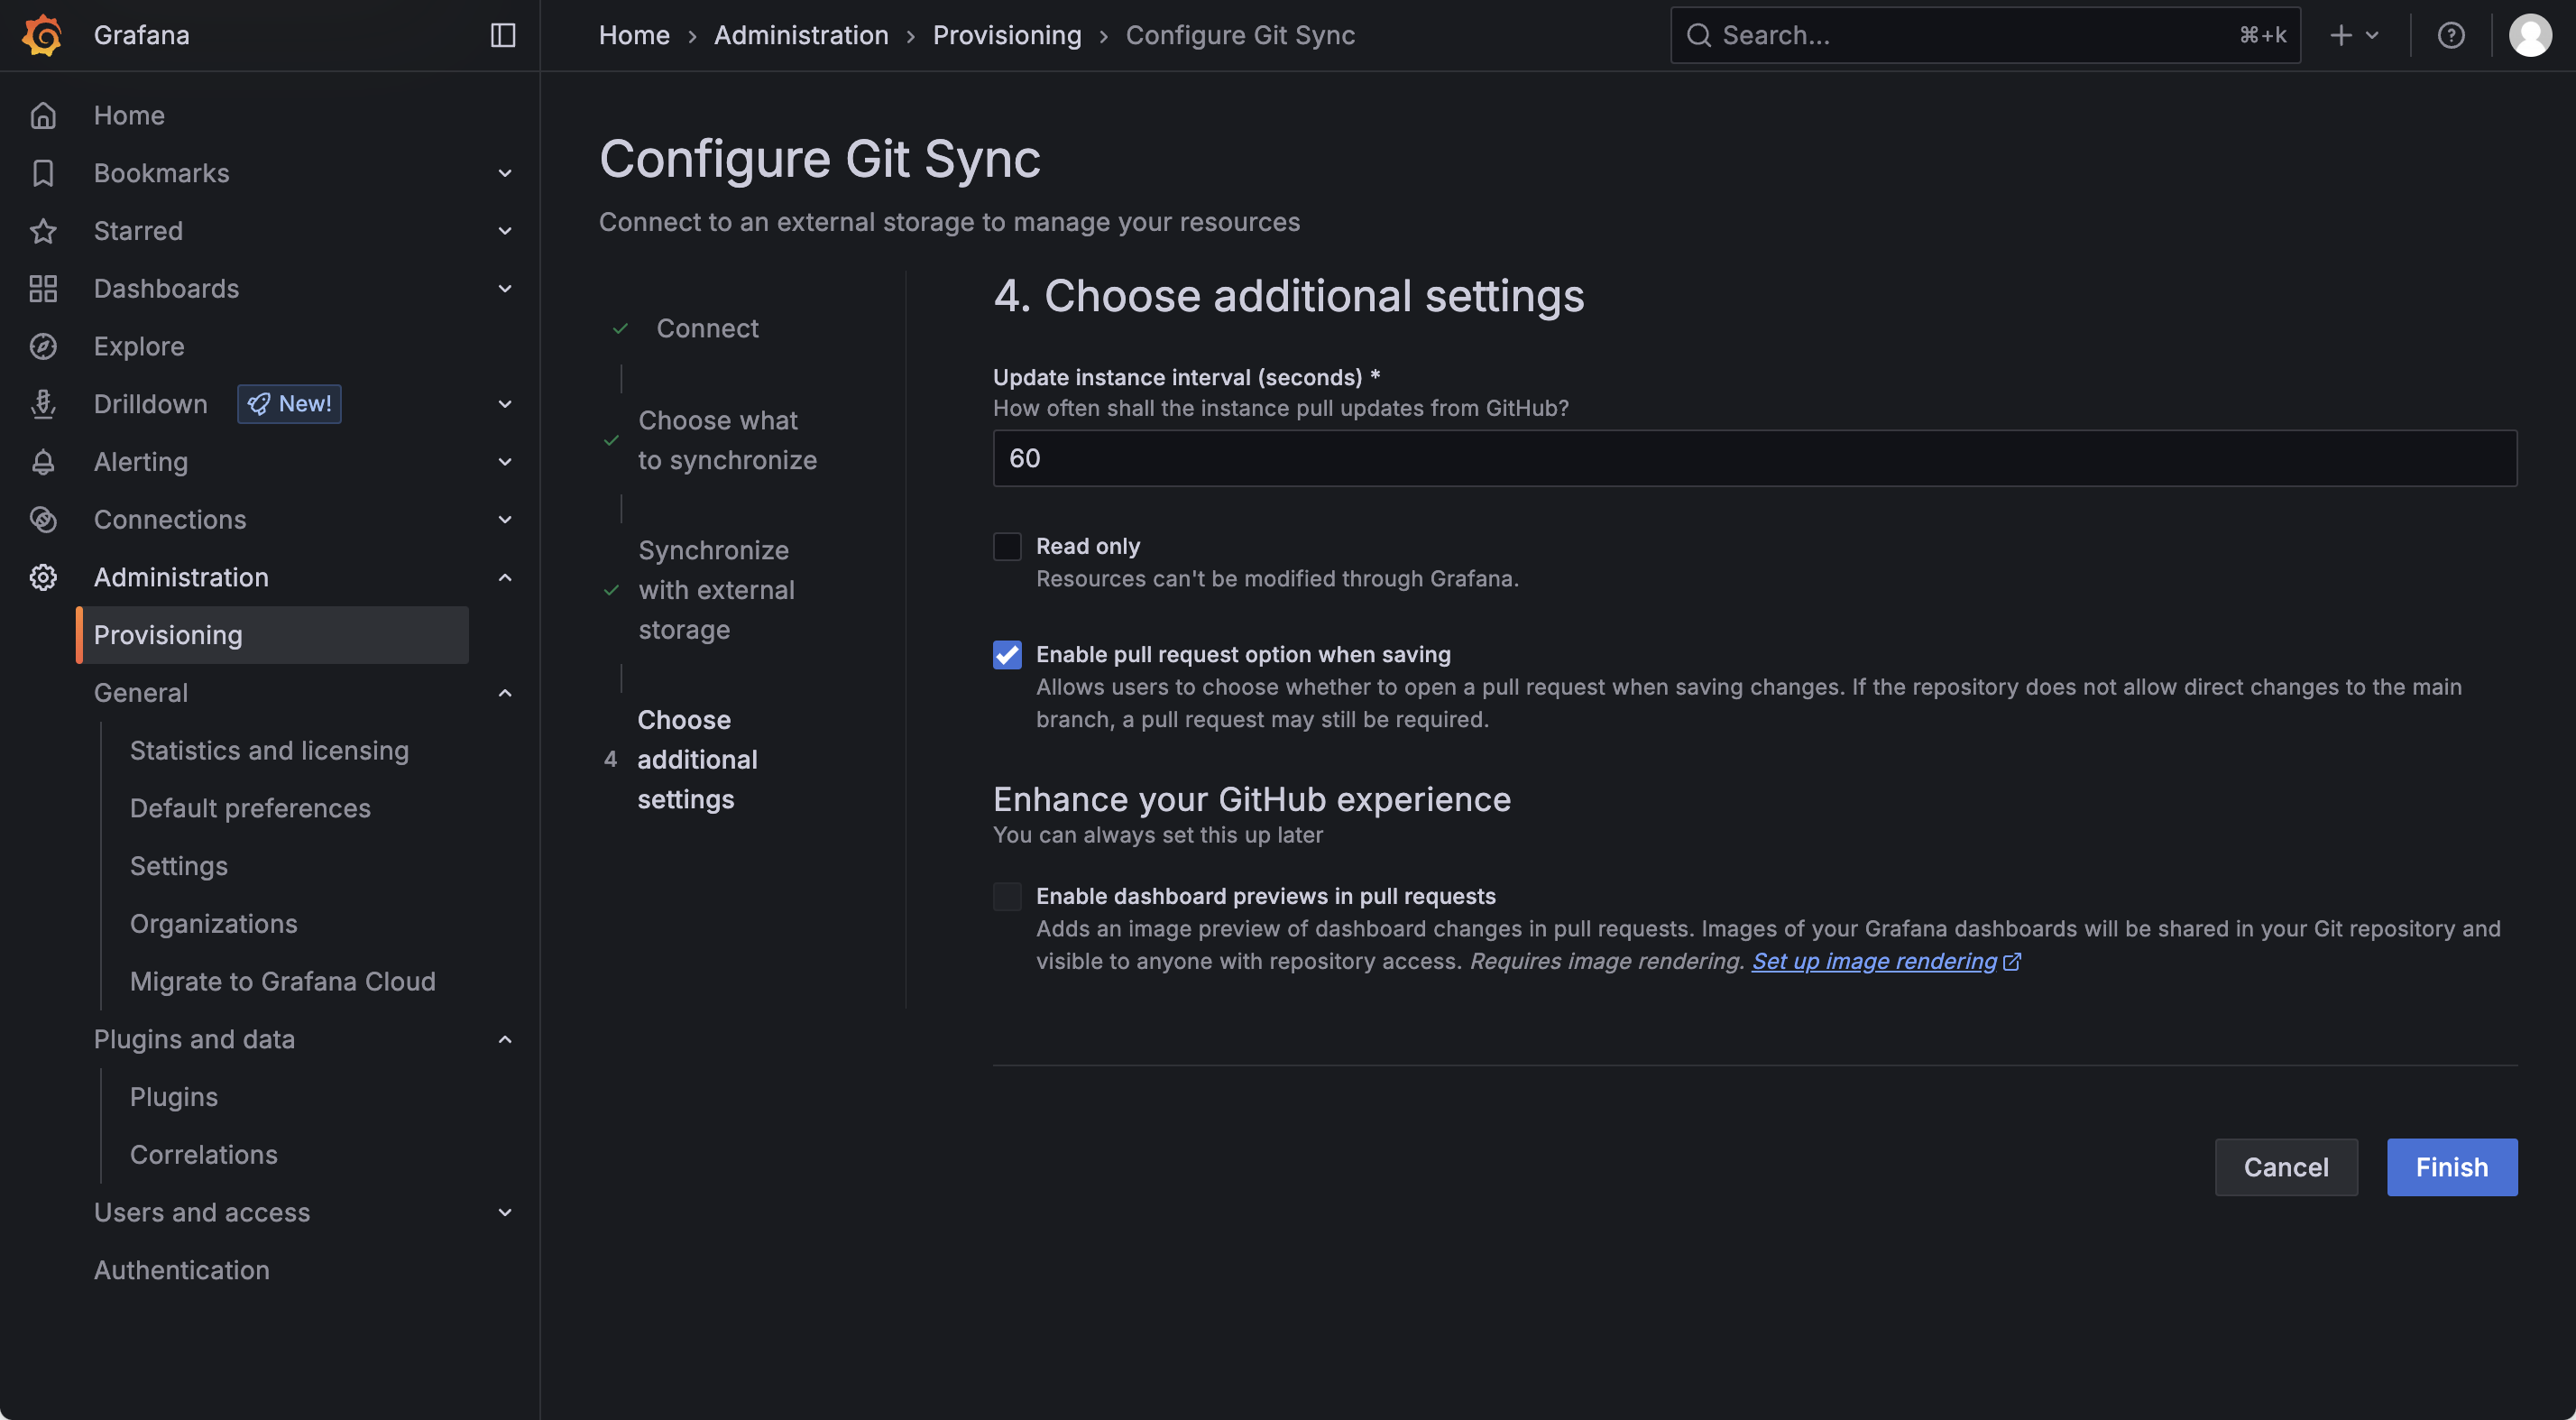
You can set the synchronization interval between Grafana and GitHub, or make Grafana read-only to manage it solely through code.
"Enhance your GitHub experience" allows you to preview which parts of the dashboard will change when making a pull request, showing them as image previews.
This is exciting!
It requires the Grafana Image Renderer plugin, which we won't configure now, but I'd like to try it soon.
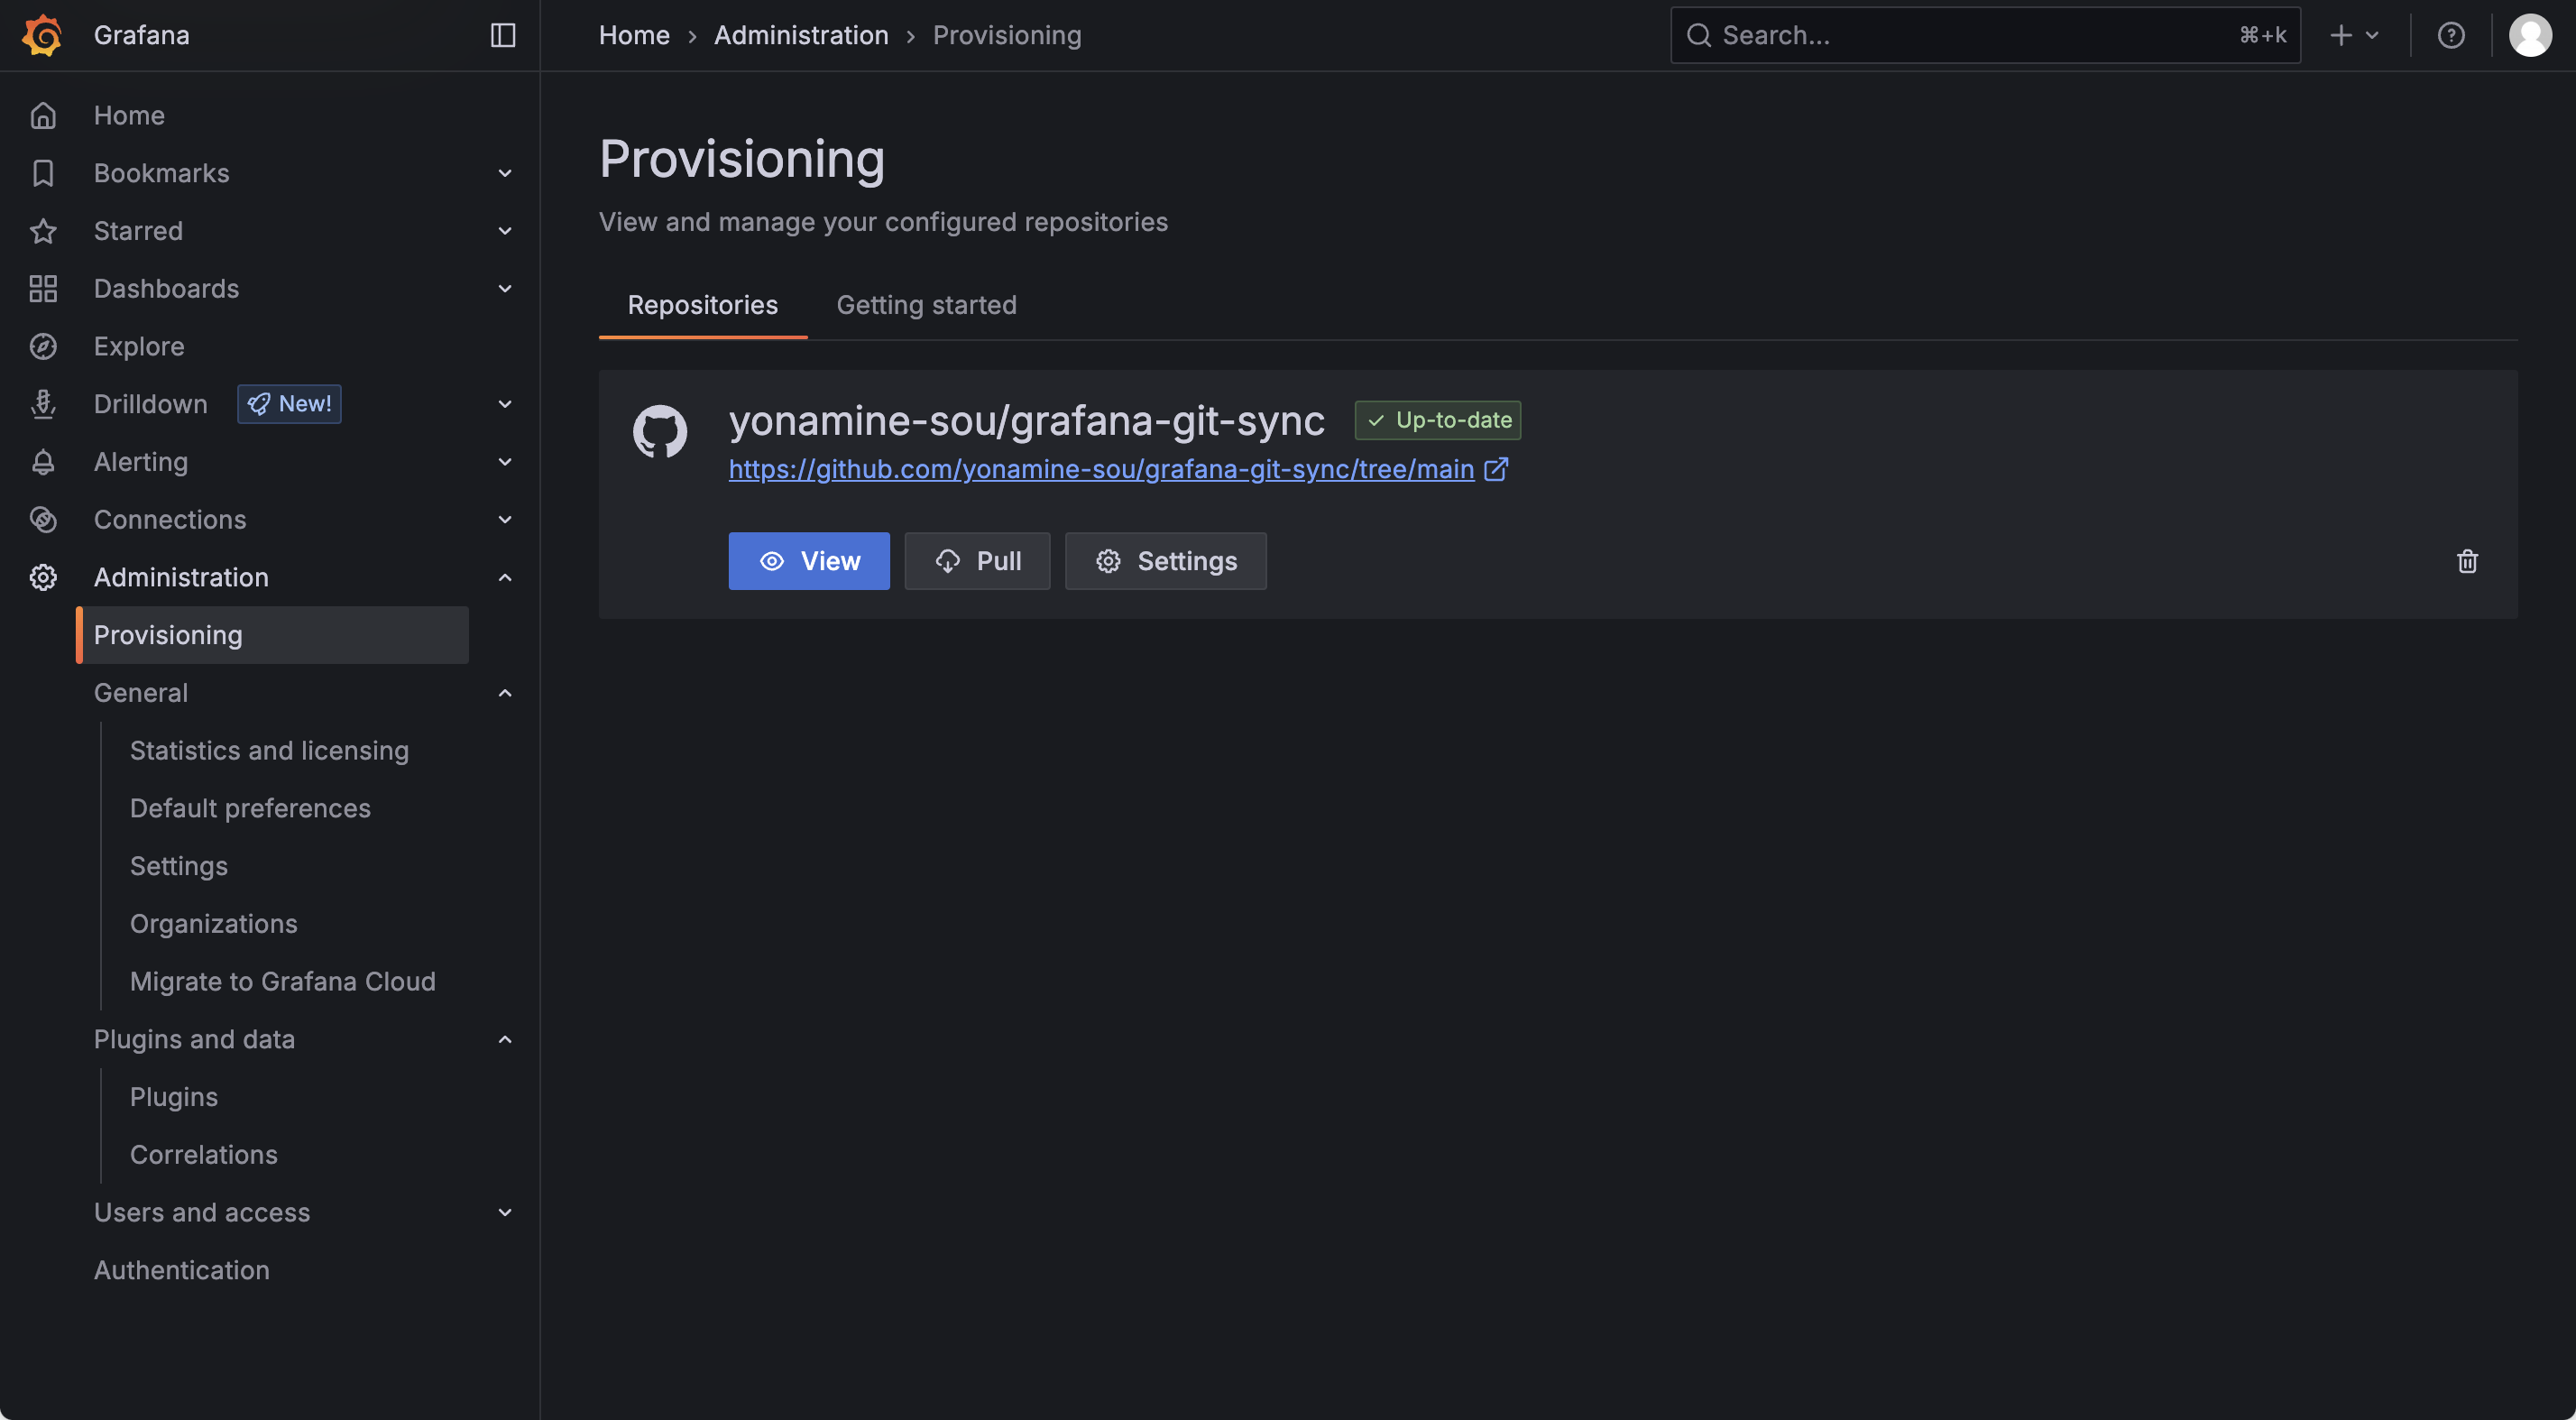
Once the connection is complete, the synchronization settings will be added to the Provisioning screen, and if Up-to-date is displayed to the right of the repository name, the setup is complete.
 ## Dashboard Creation
Let's create a dashboard and test if it's linked with GitHub.

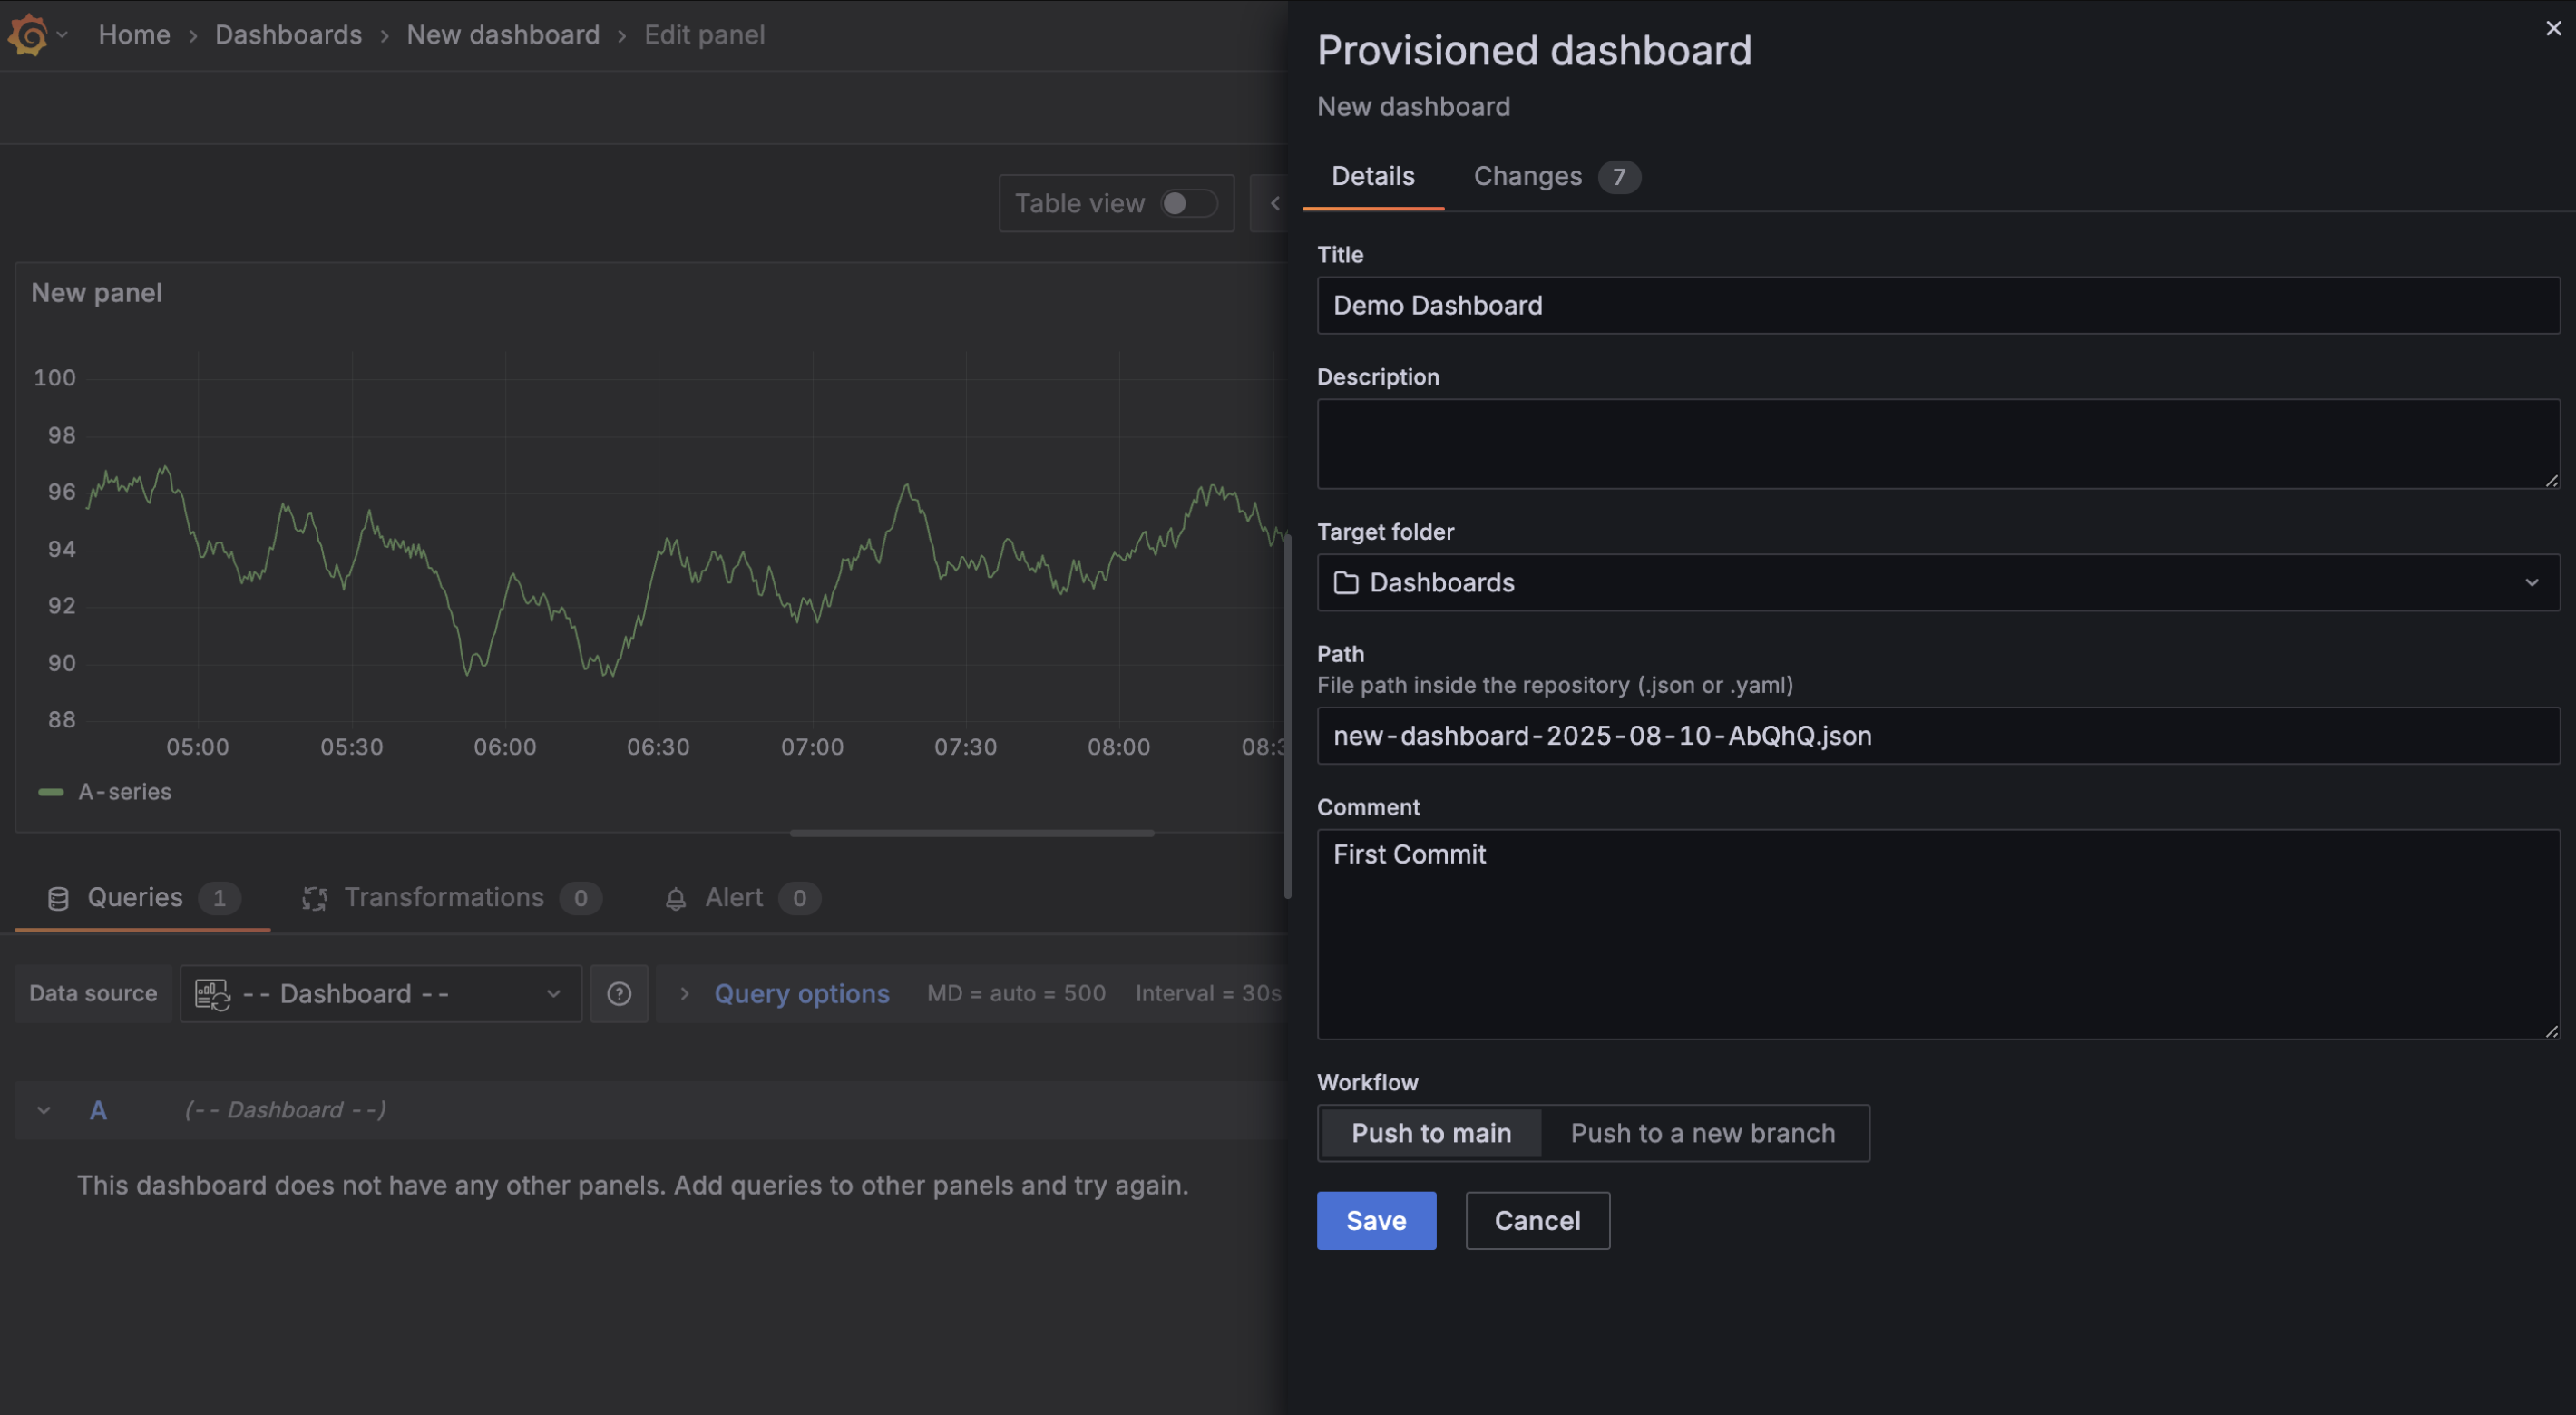
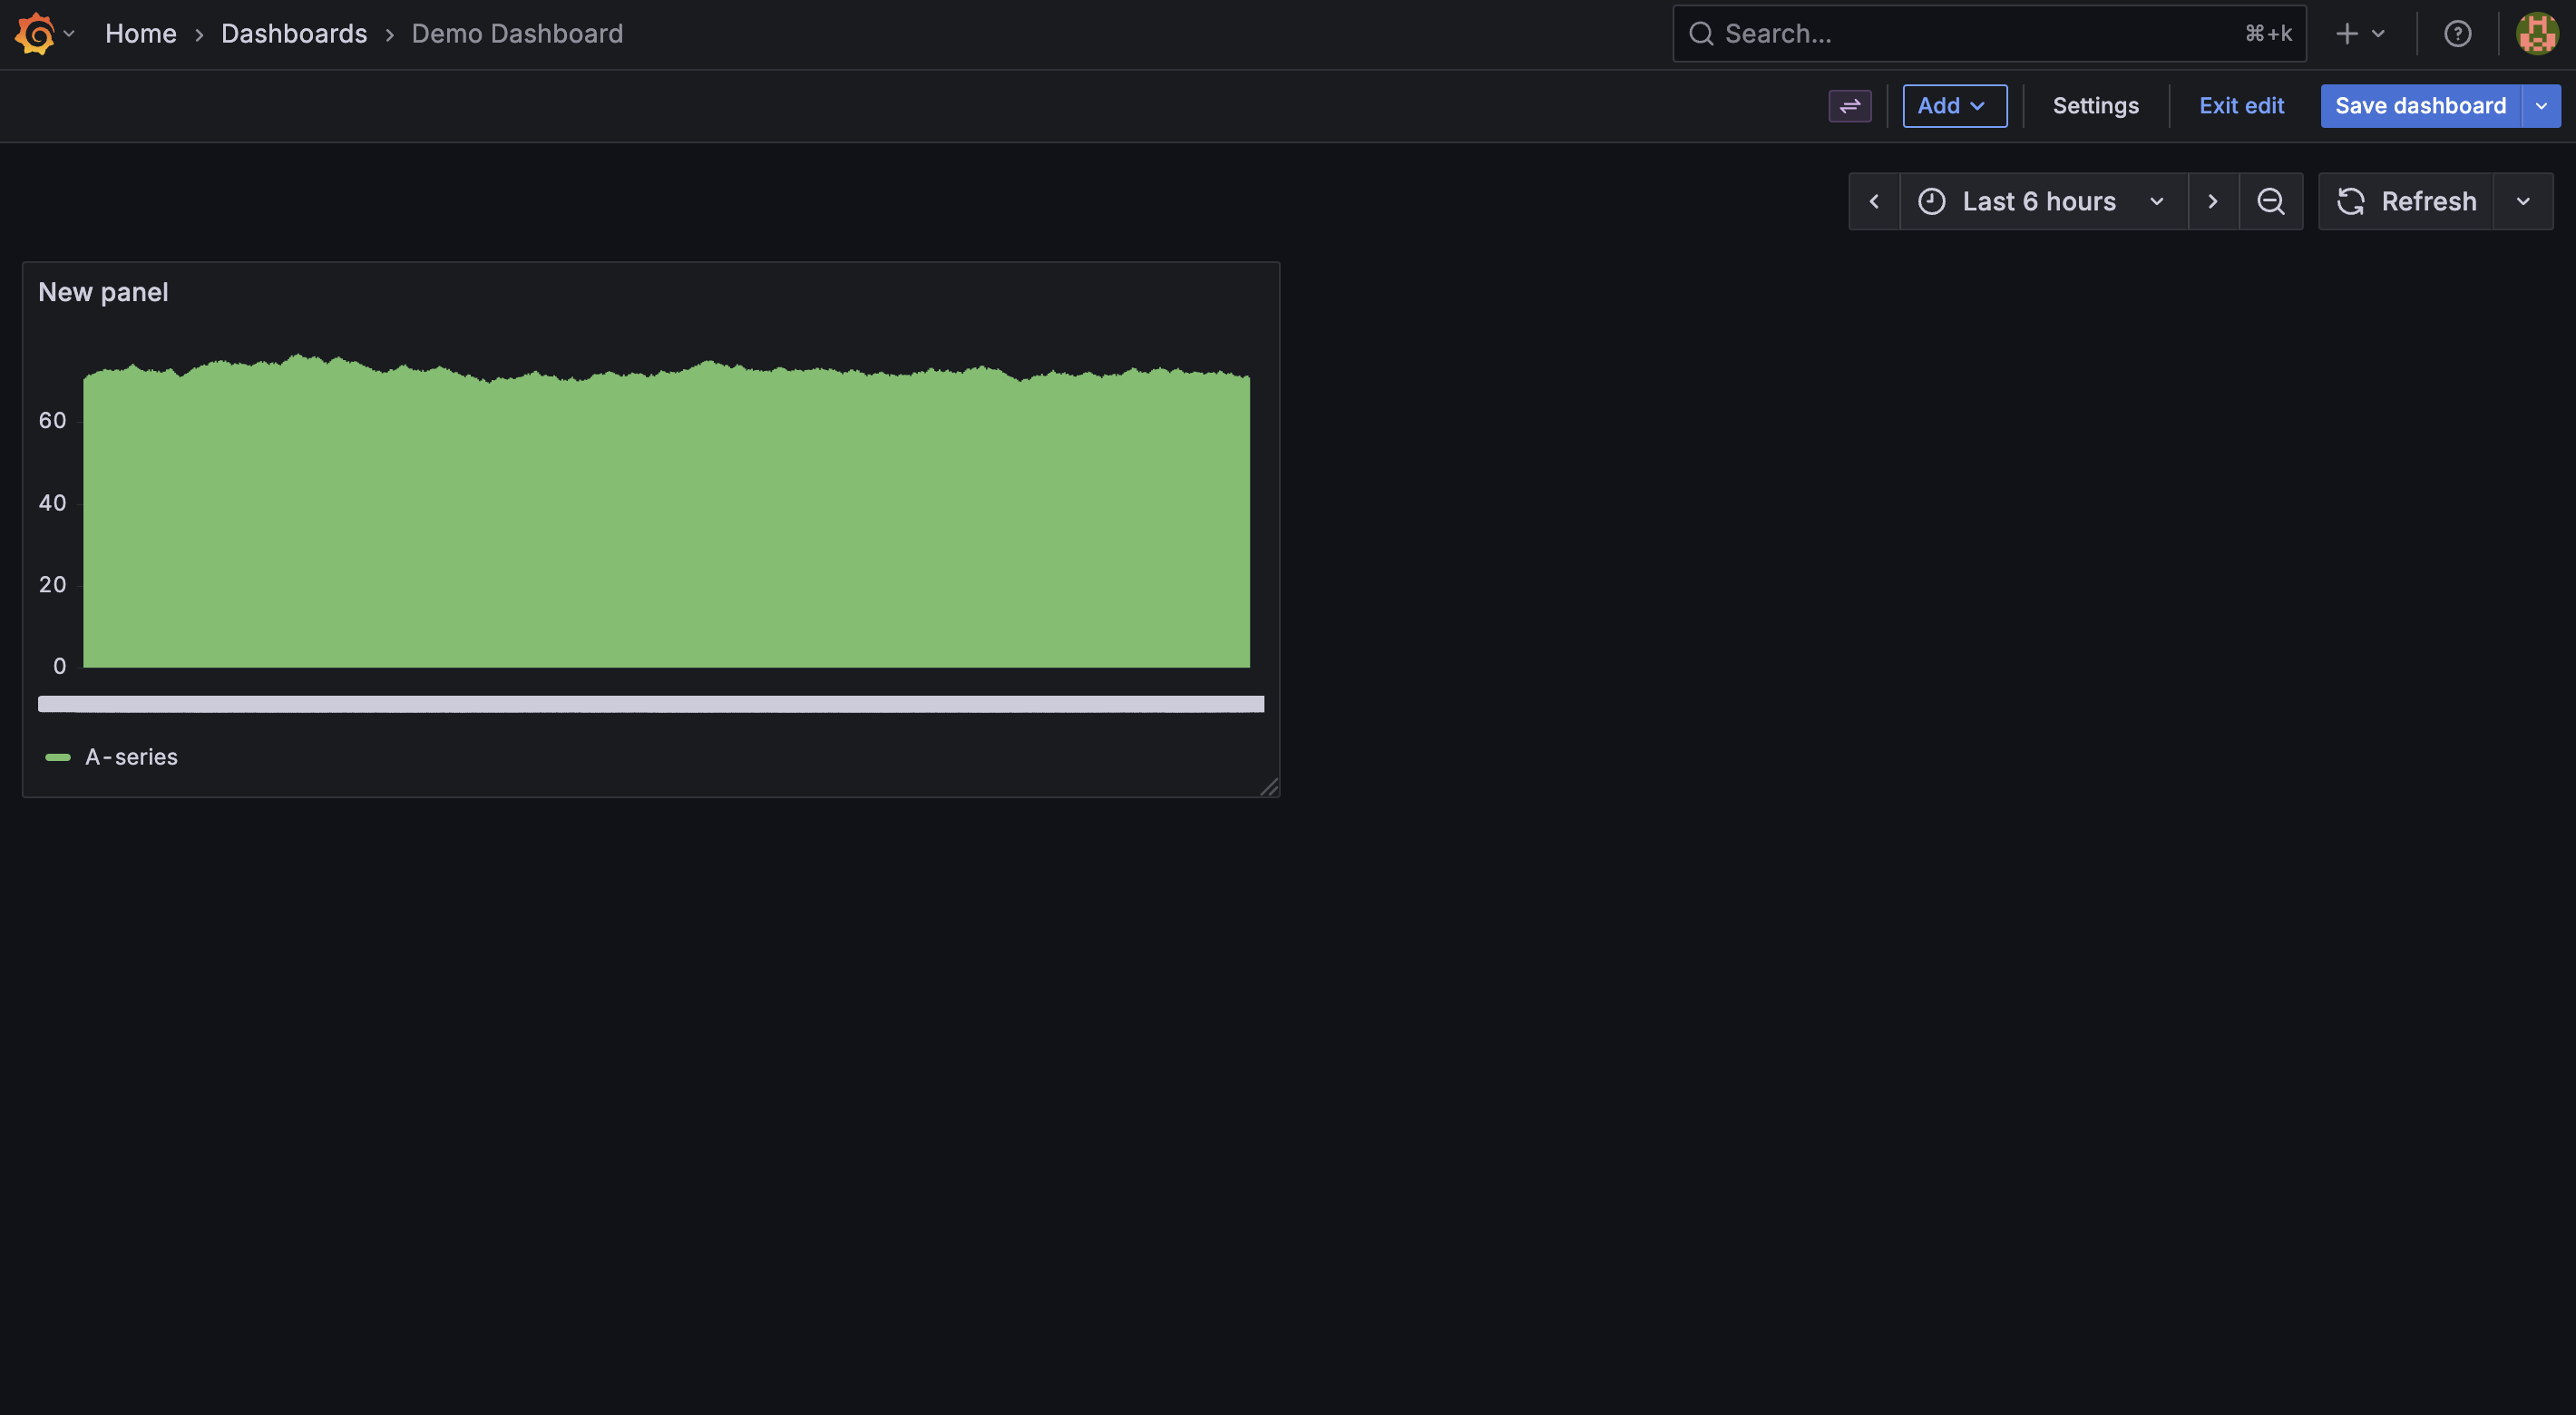
Creating a dashboard named "Demo Dashboard".
The data source displays time series test data as a Time series (line graph).
The Comment section corresponds to the Commit message, so I'll enter First Commit.
Since we want to push to the main branch this time, I'll select Push to main in the Workflow section and save it.
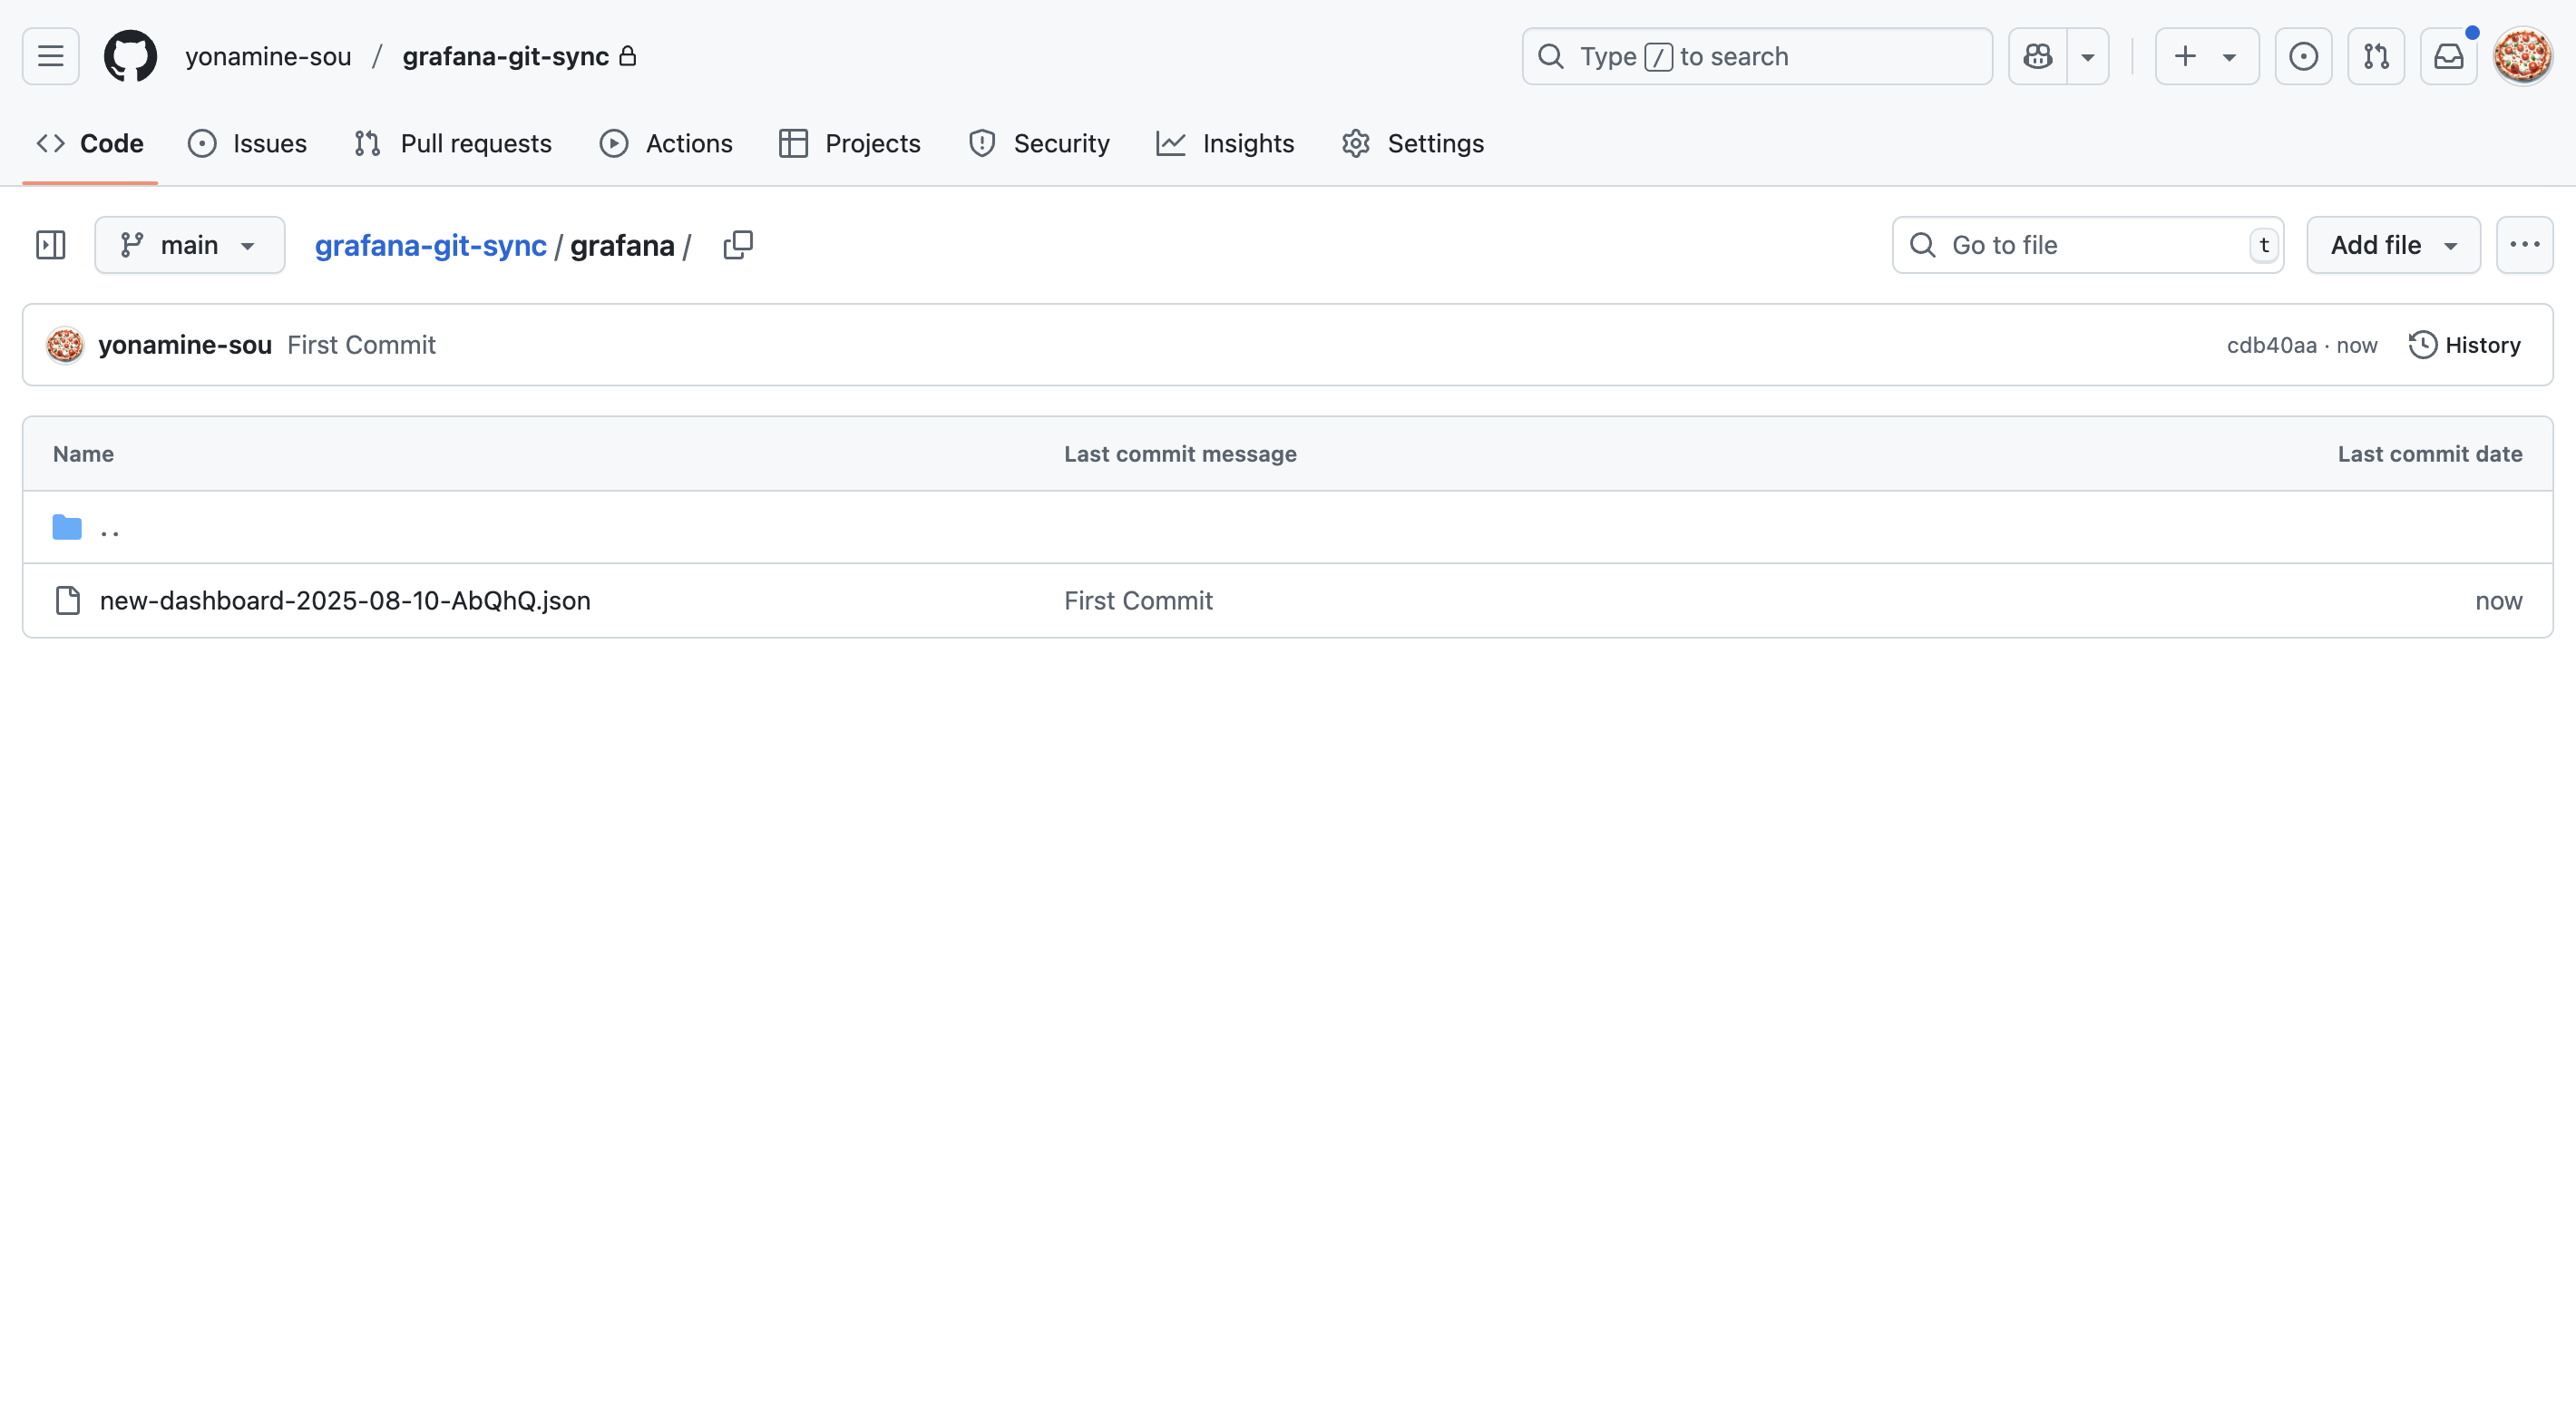
Let's check if it's synchronized on the GitHub side.
A new JSON file has been created!!
Changing Code on GitHub Side
Now let's verify that when the JSON file stored in the repository is modified, the changes are automatically reflected in the Grafana dashboard.
I'm changing the JSON content from my local environment to simulate a more typical development workflow.

The change is from displaying test data as a Time series (line graph) to a Bar chart.
			-        "type": "timeseries"
+        "type": "barchart"
Now let's check the dashboard.
We can confirm that it has changed from Time series to Bar chart.
With this, we've tested the most basic functionality of Git Sync.
Summary
I tried out the Git Sync feature announced in Grafana v12.
Being able to manage dashboard JSONs as code in GitHub seems to be a good fit with dashboard development using Claude Code, which I wrote about previously.
Since it's still a preview feature, there were a few functionalities that didn't work well.
I hope it will be officially released as an improved feature, and I plan to submit issues for the features I'd like to see.