Tracing back to work videos from quality information. I tried to grasp the current status of the process.

This page has been translated by machine translation. View original
Introduction
Hello! I'm tanaka-takeru from the Classmethod Manufacturing Business Technology Department.
- In the past, I have tried various approaches to track when and through what processes products were completed, but I have failed in many cases.
- Recording with a stopwatch was too time-consuming to capture every occurrence
- It was physically difficult to set up QR codes and positioning fixtures
- Adjusting image recognition parameters was too cumbersome to keep up with drawing revisions
- However, with the recent advances in VLMs, I feel there is strong potential to flexibly convert process records into data.
- This time, I want to try a workflow of analyzing work videos using a VLM to extract time and content, then linking that with quality information of finished products (in this case, weighing results) to understand the current situation.
- It's the gyoza video again, but... since I have not performed any gyoza-specific processing such as fine-tuning, I believe this approach can be applied to a wide variety of tasks.
Dashboard Demo
First, here is a look at the dashboard in action.
In this article, I would like to dive deeper into the dashboard design intent and the process of understanding the current situation, focusing on the process where two workers each make 25 gyoza (50 in total).
Design Intent
-
A set of questions is essential for any operational management dashboard.
For example, to improve economic efficiency beyond the current process, it is standard practice to design with the full picture in mind: "What hypotheses do we hold, what metrics do we look at, and what actions do we take?" -
This time, I want to understand the current situation with the question: what should we do to make gyoza of the same quality faster than we currently do?
-
First, I will list the metrics I want to manage, then think about the data needed to express them and the visualizations needed to understand them.
- Quality:
- Here, the weight of the finished gyoza is used as the metric. Getting the right amount of filling is actually surprisingly difficult.
- The recipe I referenced said to wrap 20g of filling, so with a wrapper weight of 3g, 23g per gyoza seems like a reasonable target weight.
- Since it was too much trouble to weigh and record each gyoza one by one, I took photos of each measurement and used a VLM to read the scale display and convert it to data (even taking the photos was a lot of work).
- What kind of distribution will the weights of the 50 gyoza show? An I-MR control chart seems like the right tool to check.
- Lead time:
- The time to make one gyoza (cycle time) is used as the metric.
- The video is split into small chunks and fed into the VLM. The detection target is defined as the time from when a human hand picks up a wrapper to when the hand places the gyoza on the tray and moves away, and this is converted into cycle time data.
- There are two workers. Will cycle times differ between them? Also, both were gyoza-making novices — will their cycle times improve as they make more?
- A box plot that shows variability seems like the right tool to check.
- Quality:
-
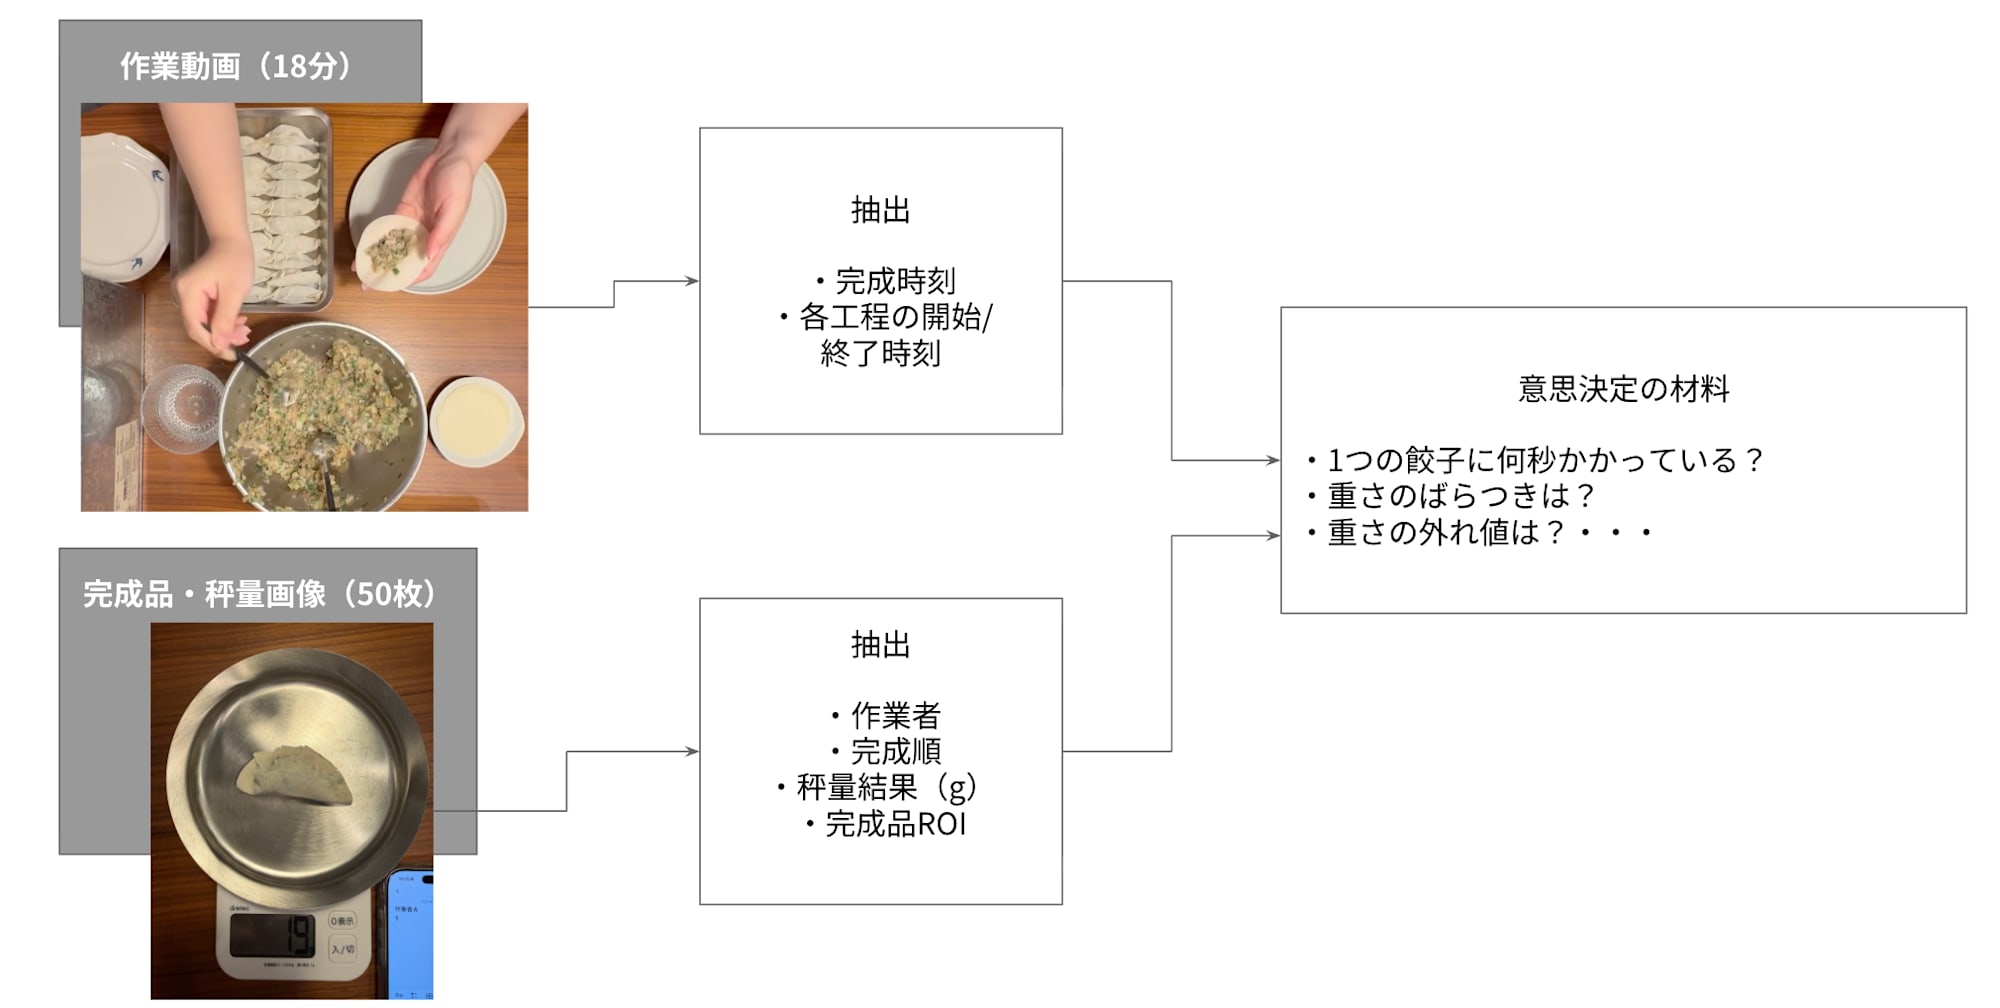
The overall data flow ended up looking like this.
-
After testing multiple VLM models, I am using Qwen/Qwen3.5-4B for video and Qwen3-VL 4B Instruct for images.
-
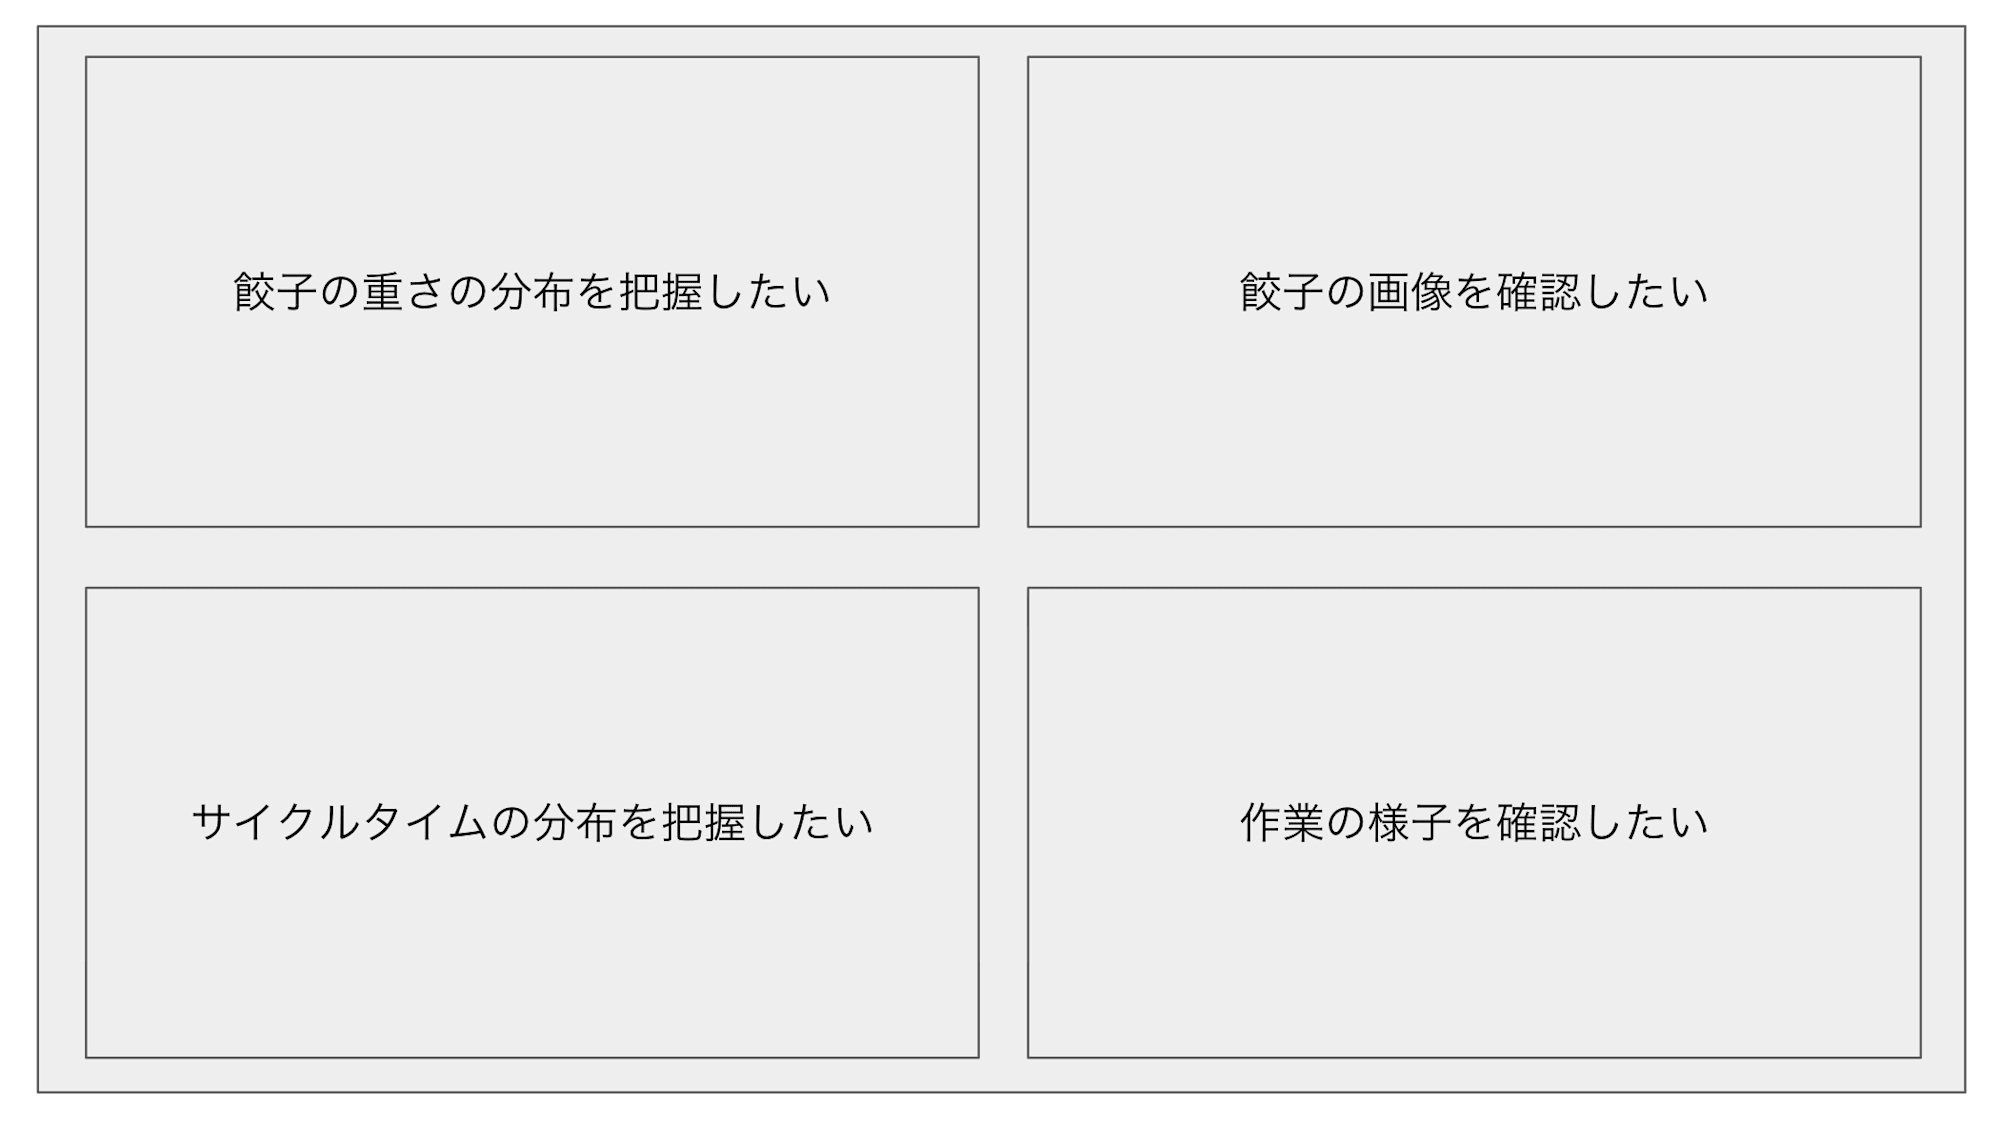
To have all this information in one place, I came up with the following layout.
-
It is very simple, but the flow is to find points of interest in the weight and cycle time distributions and then review the corresponding images and video.
-
An important aspect from a UX perspective is that clicking on a single point in the control chart causes the box plot, images, and video to update in sync. This makes it easy to get a tangible feel for the relationships between metrics and between the metrics and the images/video.
Understanding the Current Situation
I will watch the video again and think about "what should we do to make gyoza of the same quality faster than we currently do?" (This is the same video as at the beginning of the article.)
I apologize that it is hard to see, but I would appreciate it if you could read along while pausing the video at the relevant moments.
1. First, let's look at the control chart for weight. Video time: 3 seconds
- From the I chart, the average is tracking around 20.4g. The ±3σ limits are not being exceeded.
- Given that 23g is the target, the amount of filling is on the low side overall. Would practice allow us to pack in more?
- Comparing Worker A (blue) and Worker B (yellow), B may tend to produce heavier gyoza overall.
- Also, looking at the MR chart, Worker B seems to have more sudden fluctuations than Worker A.
2. Let's look at cycle time. Video time: 7 seconds
- Worker A has a median of 43 seconds, and Worker B has a median of 39 seconds.
- There does not appear to be any cycle time reduction with increased repetitions.
- Looking at the distribution, it seems like cycle time could converge to around 40–45 seconds. What was happening in the cases where it took more than 45 seconds?
3. Let's dig deeper into the longest cycle time (outlier). Video time: from 1 minute 22 seconds onward
- First, the weight of the gyoza made during the outlier cycle is distributed around 20g, so there is no issue with the weight.
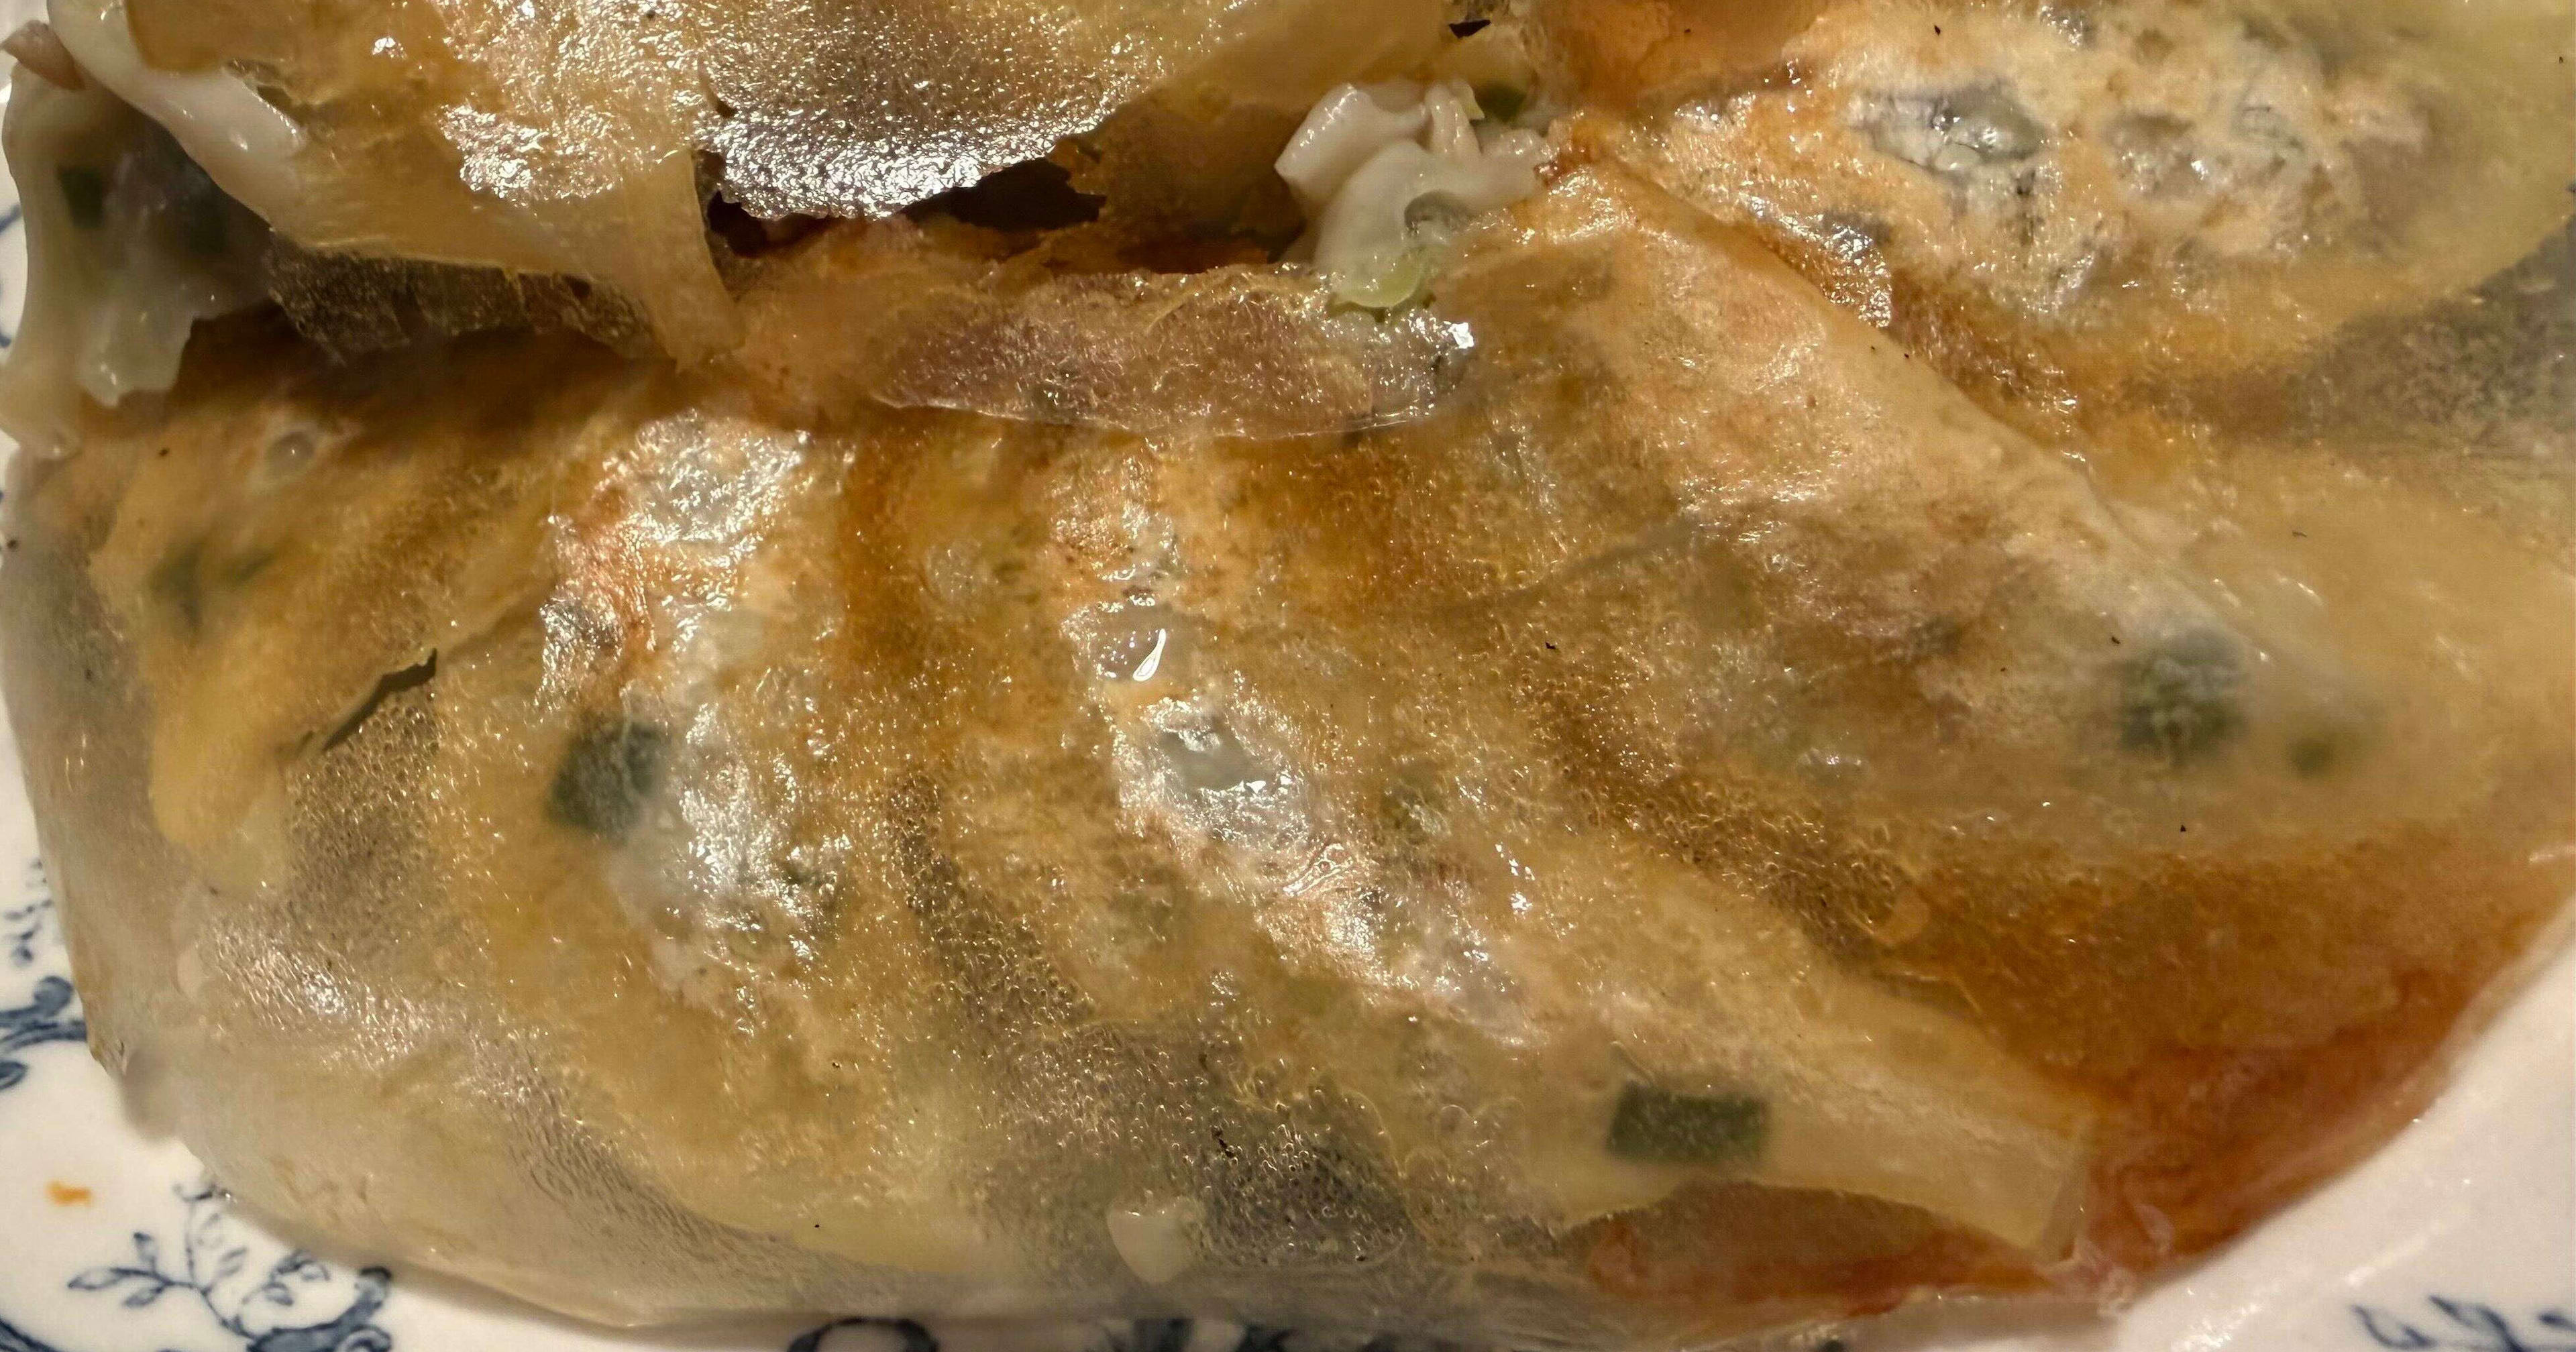
- Since judging by weight alone feels unreliable, looking at the photo of the finished gyoza confirms that it is neatly wrapped.
- Now, watching the work video:
- Before picking up the wrapper, the worker is counting the number of gyoza made so far.
- Also, after scooping the filling twice, the filling sticks to the wrapper and spoon and cannot be placed smoothly, requiring several adjustments.
- While wrapping, a large piece (cabbage?) pops out from the filling and has to be pushed back in.
- Finally, when placing it on the tray, the spaces on the tray are narrow, requiring a squeeze and rearrangement.
- From this, we can see the following:
- The outlier represents a correctly detected cycle time (it is not a value that should be excluded).
- There is no abnormality in the weight of the finished gyoza, but four overlapping factors during the making process may have significantly extended the cycle time.
Conclusion
-
Having obtained four hypotheses, in a real work setting we would immediately interview Worker A and likely come up with action items such as:
- Instead of placing gyoza freely on the tray, exploring a system with enough space and a uniquely determined placement position
- Exploring a jig that can scoop a fixed amount of filling and place it on the wrapper easily
- Investigating variability in the particle size of the filling ingredients
...and so on (we won't be doing this at home).
-
In this way, approaching hypothesis generation while maintaining a hands-on feel with the raw data and then investigating statistically significant relationships seems like a smooth path to improvement.
-
For a process as simple as this gyoza-making, many improvement points can be identified just by watching, but what I want to highlight most is that VLMs now make it possible to verbalize and structure human work and process conditions, including the concept of time.
-
If information can be easily extracted from video and linked to various manufacturing data including quality information, it is expected that we can properly understand complex current conditions and connect them to concrete actions.