
I've examined the implementation of Lambda that prevents DSQL maximum connection time exceeded errors

I am Iwata from the Retail App Co-Creation Department in Osaka.
Aurora DSQL has several specific constraints, one of which is the maximum connection time of 60 minutes. In this blog, I checked this constraint by setting up a Lambda function that connects to DSQL and runs every 5 minutes.
Environment
The environment used for this verification:
- Lambda
- Runtime: Node.js22x
- Architecture: x86
- Region: Virginia (us-east-1)
- Memory allocation: 128M
- Libraries, etc.
- pg: 8.16.3
- @aws-sdk/dsql-signer: 3.864.0
Let's try it
Now let's implement the Lambda function for verification.### When using pg's Client
First, here's an implementation example using pg's Client.
			import { Client } from "pg";
import { DsqlSigner } from "@aws-sdk/dsql-signer";

const region = process.env.AWS_REGION;
const clusterEndpoint = `${process.env.DSQL_CLUSTER_IDENTIFIER}.dsql.${region}.on.aws`;
const signer = new DsqlSigner({
	hostname: clusterEndpoint,
	region,
});
const token = await signer.getDbConnectAdminAuthToken();
const client = new Client({
	host: clusterEndpoint,
	port: 5432,
	database: "postgres",
	user: "admin",
	password: token,
	ssl: true,
});
await client.connect();

export const handler = async (event, context) => {
	await client.query("SELECT now()");
};
We're establishing a connection with DSQL outside the handler and maintaining that connection, then executing SELECT now() within the handler process. After deploying this Lambda and scheduling it to run every 5 minutes via Event Bridge scheduler, the logs showed the following output after some time:
			2025-08-16T05:08:03.735Z	668be42f-8fb4-40b9-b922-917b4961fd6a	ERROR	Uncaught Exception
{
    "errorType": "Error",
    "errorMessage": "Connection terminated unexpectedly",
    "stack": [
        "Error: Connection terminated unexpectedly",
        "    at Connection.<anonymous> (/var/task/node_modules/pg/lib/client.js:136:73)",
        "    at Object.onceWrapper (node:events:632:28)",
        "    at Connection.emit (node:events:518:28)",
        "    at Socket.<anonymous> (/var/task/node_modules/pg/lib/connection.js:62:12)",
        "    at Socket.emit (node:events:530:35)",
        "    at TCP.<anonymous> (node:net:351:12)",
        "    at TCP.callbackTrampoline (node:internal/async_hooks:130:17)"
    ]
}
[ERROR] [1755320883795] LAMBDA_RUNTIME Failed to post handler success response. Http response code: 400.
END RequestId: 3ae7d2b9-386f-4cf5-8be4-8a07c441bb17
REPORT RequestId: 3ae7d2b9-386f-4cf5-8be4-8a07c441bb17	Duration: 424.60 ms	Billed Duration: 425 ms	Memory Size: 128 MB	Max Memory Used: 109 MB	Status: error	Error Type: Runtime.ExitError
XRAY TraceId: 1-68a01233-79a00cff59419f8a19543d5a	SegmentId: 19f811623978708f	Sampled: true
```Subsequently, logs with the same request ID were output as follows. This occurred because the asynchronous execution of Lambda from the Event Bridge scheduler failed, resulting in automatic retry by the Lambda runtime.
AWS Application Signals enabled.
AWS Application Signals metrics export interval capped to 60000
Enabled batch unsampled span processor for Lambda environment.
OTEL_LOGS_EXPORTER is empty. Using default otlp exporter.
OTEL_METRICS_EXPORTER contains "none". Metric provider will not be initialized.
Setting TraceProvider for instrumentations at the end of initialization
AWS Distro of OpenTelemetry automatic instrumentation started successfully
(node:2) [DEP0040] DeprecationWarning: The punycode module is deprecated. Please use a userland alternative instead.
(Use node --trace-deprecation ... to show where the warning was created)
START RequestId: 3ae7d2b9-386f-4cf5-8be4-8a07c441bb17 Version: $LATEST
END RequestId: 3ae7d2b9-386f-4cf5-8be4-8a07c441bb17
REPORT RequestId: 3ae7d2b9-386f-4cf5-8be4-8a07c441bb17 Duration: 1115.67 ms Billed Duration: 1116 ms Memory Size: 128 MB Max Memory Used: 112 MB XRAY TraceId: 1-68a01233-79a00cff59419f8a19543d5a SegmentId: 4f516b95af47814f Sampled: true
Here is the trace result linked to the target trace ID. The error occurrence and retries by the Lambda runtime are clearly displayed.
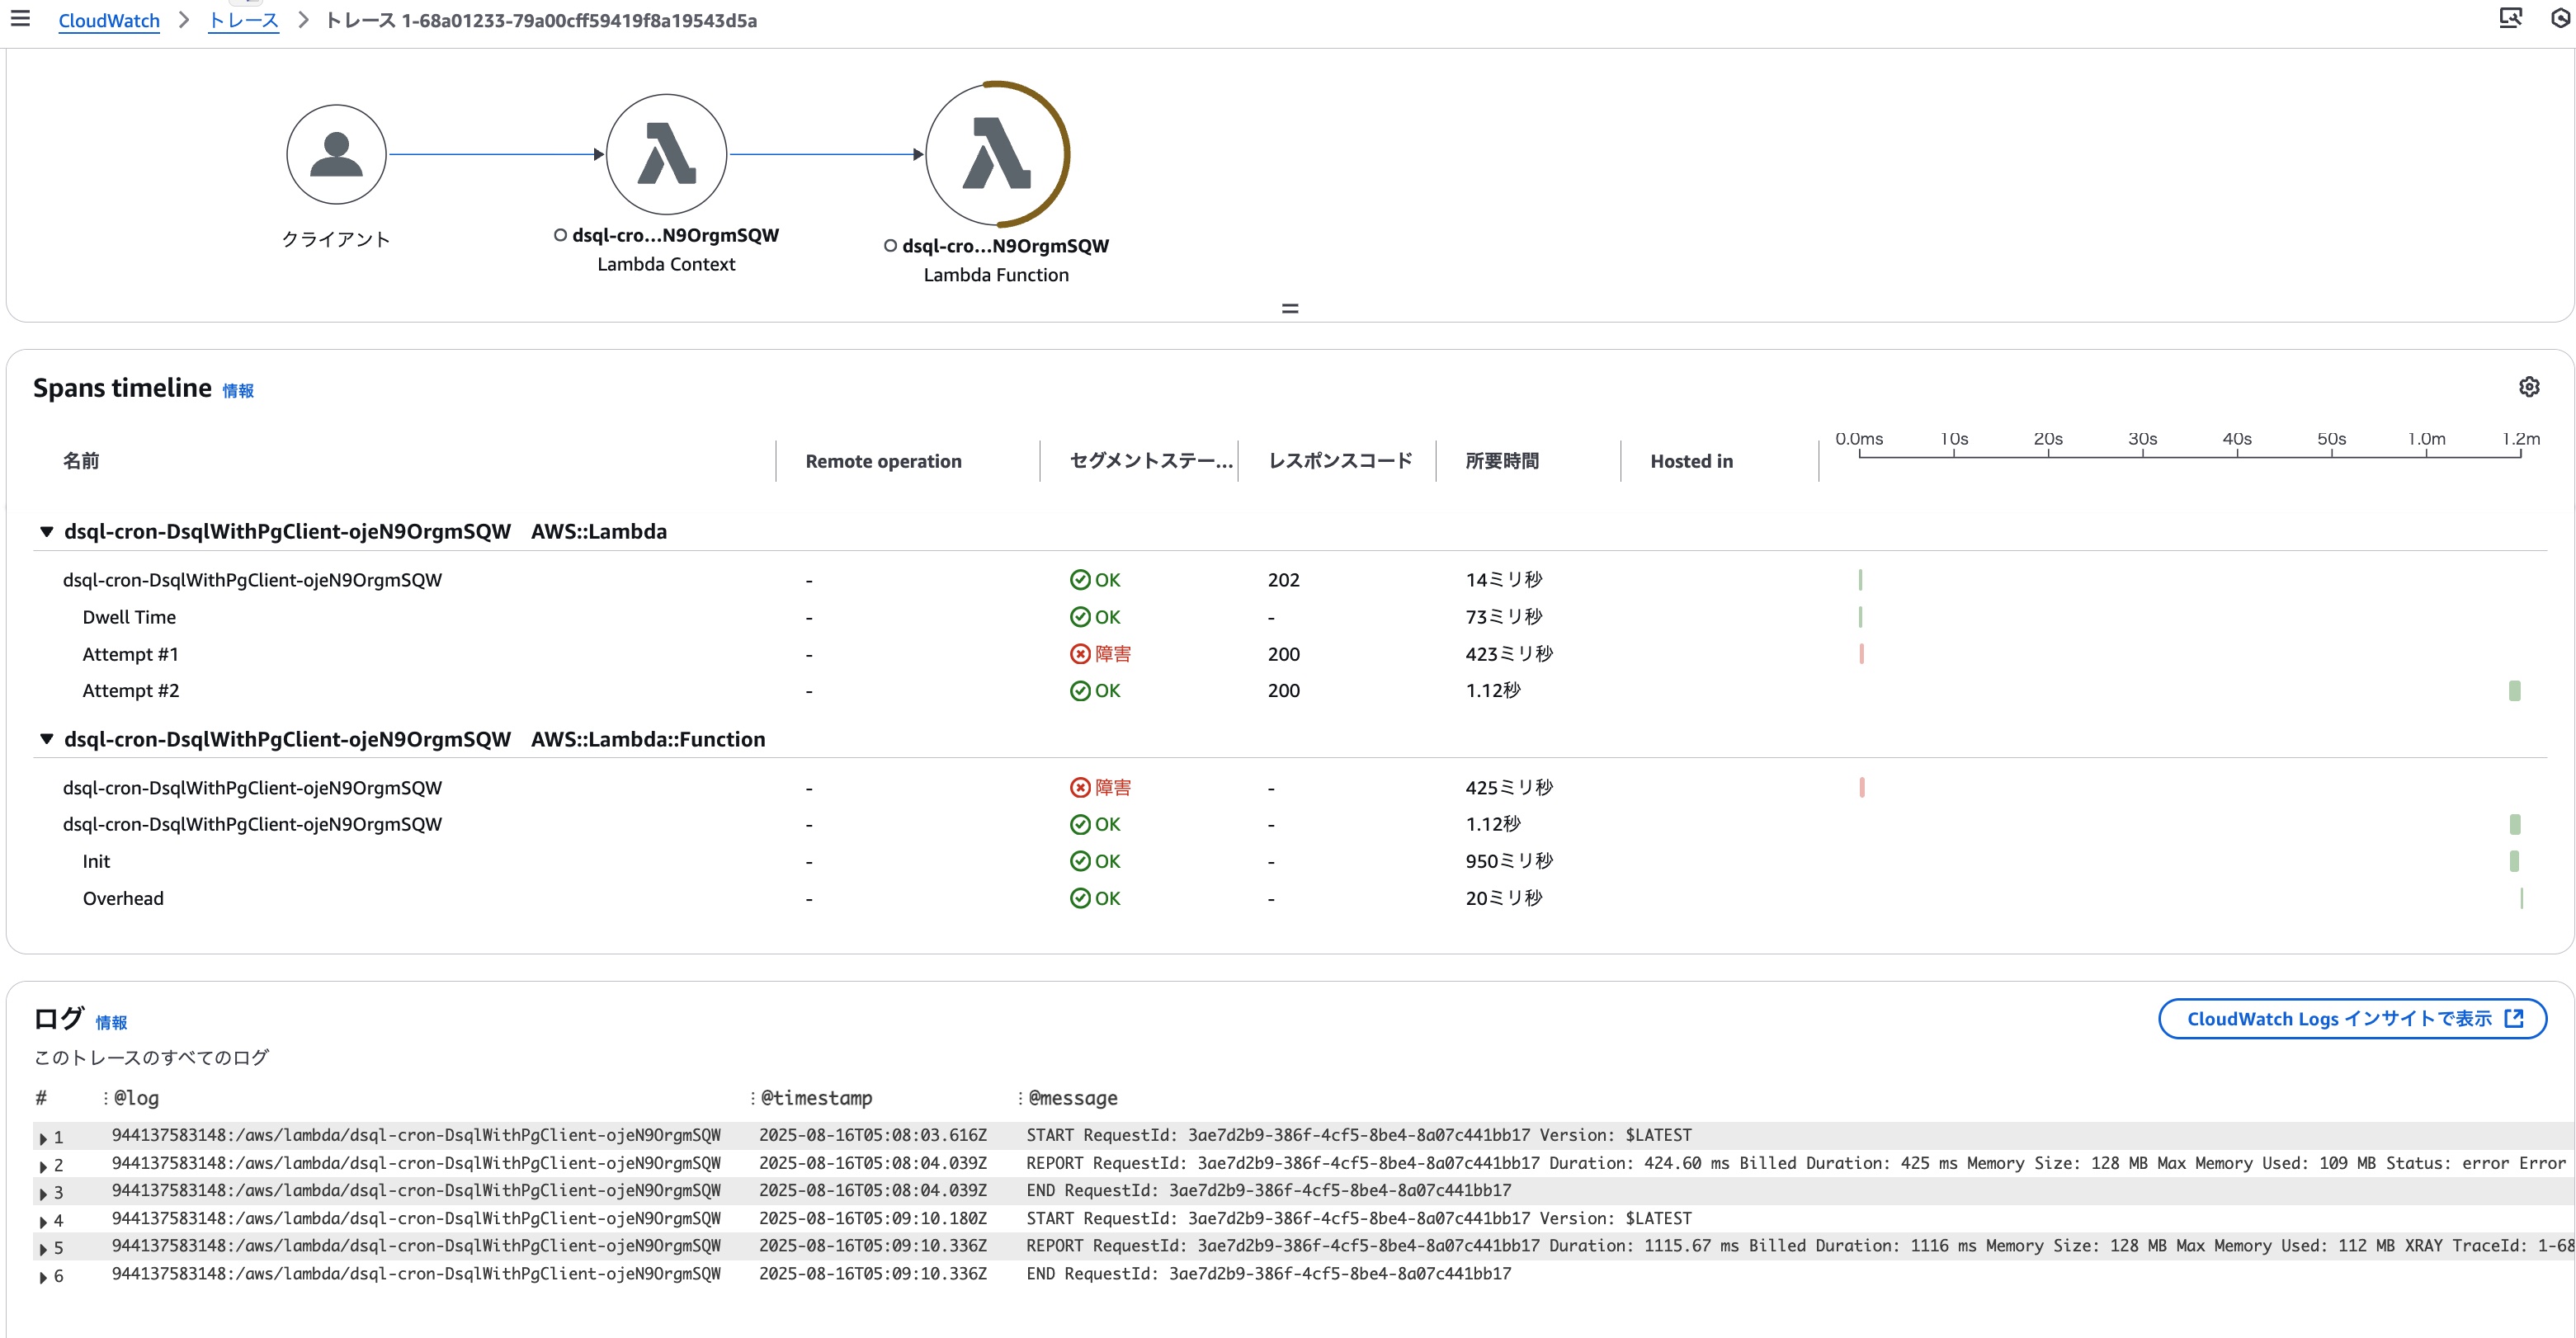
So, we've learned that maintaining a connection with DSQL without considering the maximum connection time will cause a maximum connection time exceeded error. This is definitely an important point to keep in mind when using DSQL.### Using pg's Pool
Having confirmed the maximum connection time exceeded error, let's now modify the implementation to prevent these errors. While connecting to and disconnecting from DSQL within each handler would avoid the maximum connection time exceeded error, this approach introduces unnecessary processing and prevents performance optimization, so we'll avoid it. Instead, we'll use the `pg` library's `Pool` to automatically discard connections from the connection pool after a certain time, allowing efficient use of DSQL connections.
The implementation is as follows:
```js:dsql-with-pg-pool.mjs
import { Pool } from "pg";
import { DsqlSigner } from "@aws-sdk/dsql-signer";
const region = process.env.AWS_REGION;
const clusterEndpoint = `${process.env.DSQL_CLUSTER_IDENTIFIER}.dsql.${region}.on.aws`;
const getToken = async () => {
const signer = new DsqlSigner({
hostname: clusterEndpoint,
region,
});
return signer.getDbConnectAdminAuthToken()
}
const pool = new Pool({
host: clusterEndpoint,
port: 5432,
database: "postgres",
user: "admin",
password: getToken,
ssl: true,
maxLifetimeSeconds: 60 * 50,
idleTimeoutMillis: 1000 * 60 * 50
});
export const handler = async (event, context) => {
await pool.query("SELECT now()");
};
The key points are:
- In the
Poolcreation options, we specifymaxLifetimeSecondsas60 * 50. This ensures that connections to DSQL in the connection pool will only live for a maximum of 50 minutes, preventing the maximum connection time exceeded error. - We also specify
idleTimeoutMillisas1000 * 60 * 50, which keeps idle DSQL connections in the connection pool for up to 50 minutes without discarding them. This makes it easier to reuse open DSQL connections even when Lambda execution frequency is low. *Note: The default value foridleTimeoutMillisis 10 seconds, so by default, if Lambda execution intervals exceed 10 seconds, a new DSQL connection would be opened. - Since the authentication token for connecting to DSQL has a default validity period of 15 minutes, we pass the
getTokenfunction instead of the token itself to thepasswordoption when creating the Pool. This ensures that a new authentication token is obtained and used as the password each time a new connection to DSQL is established.
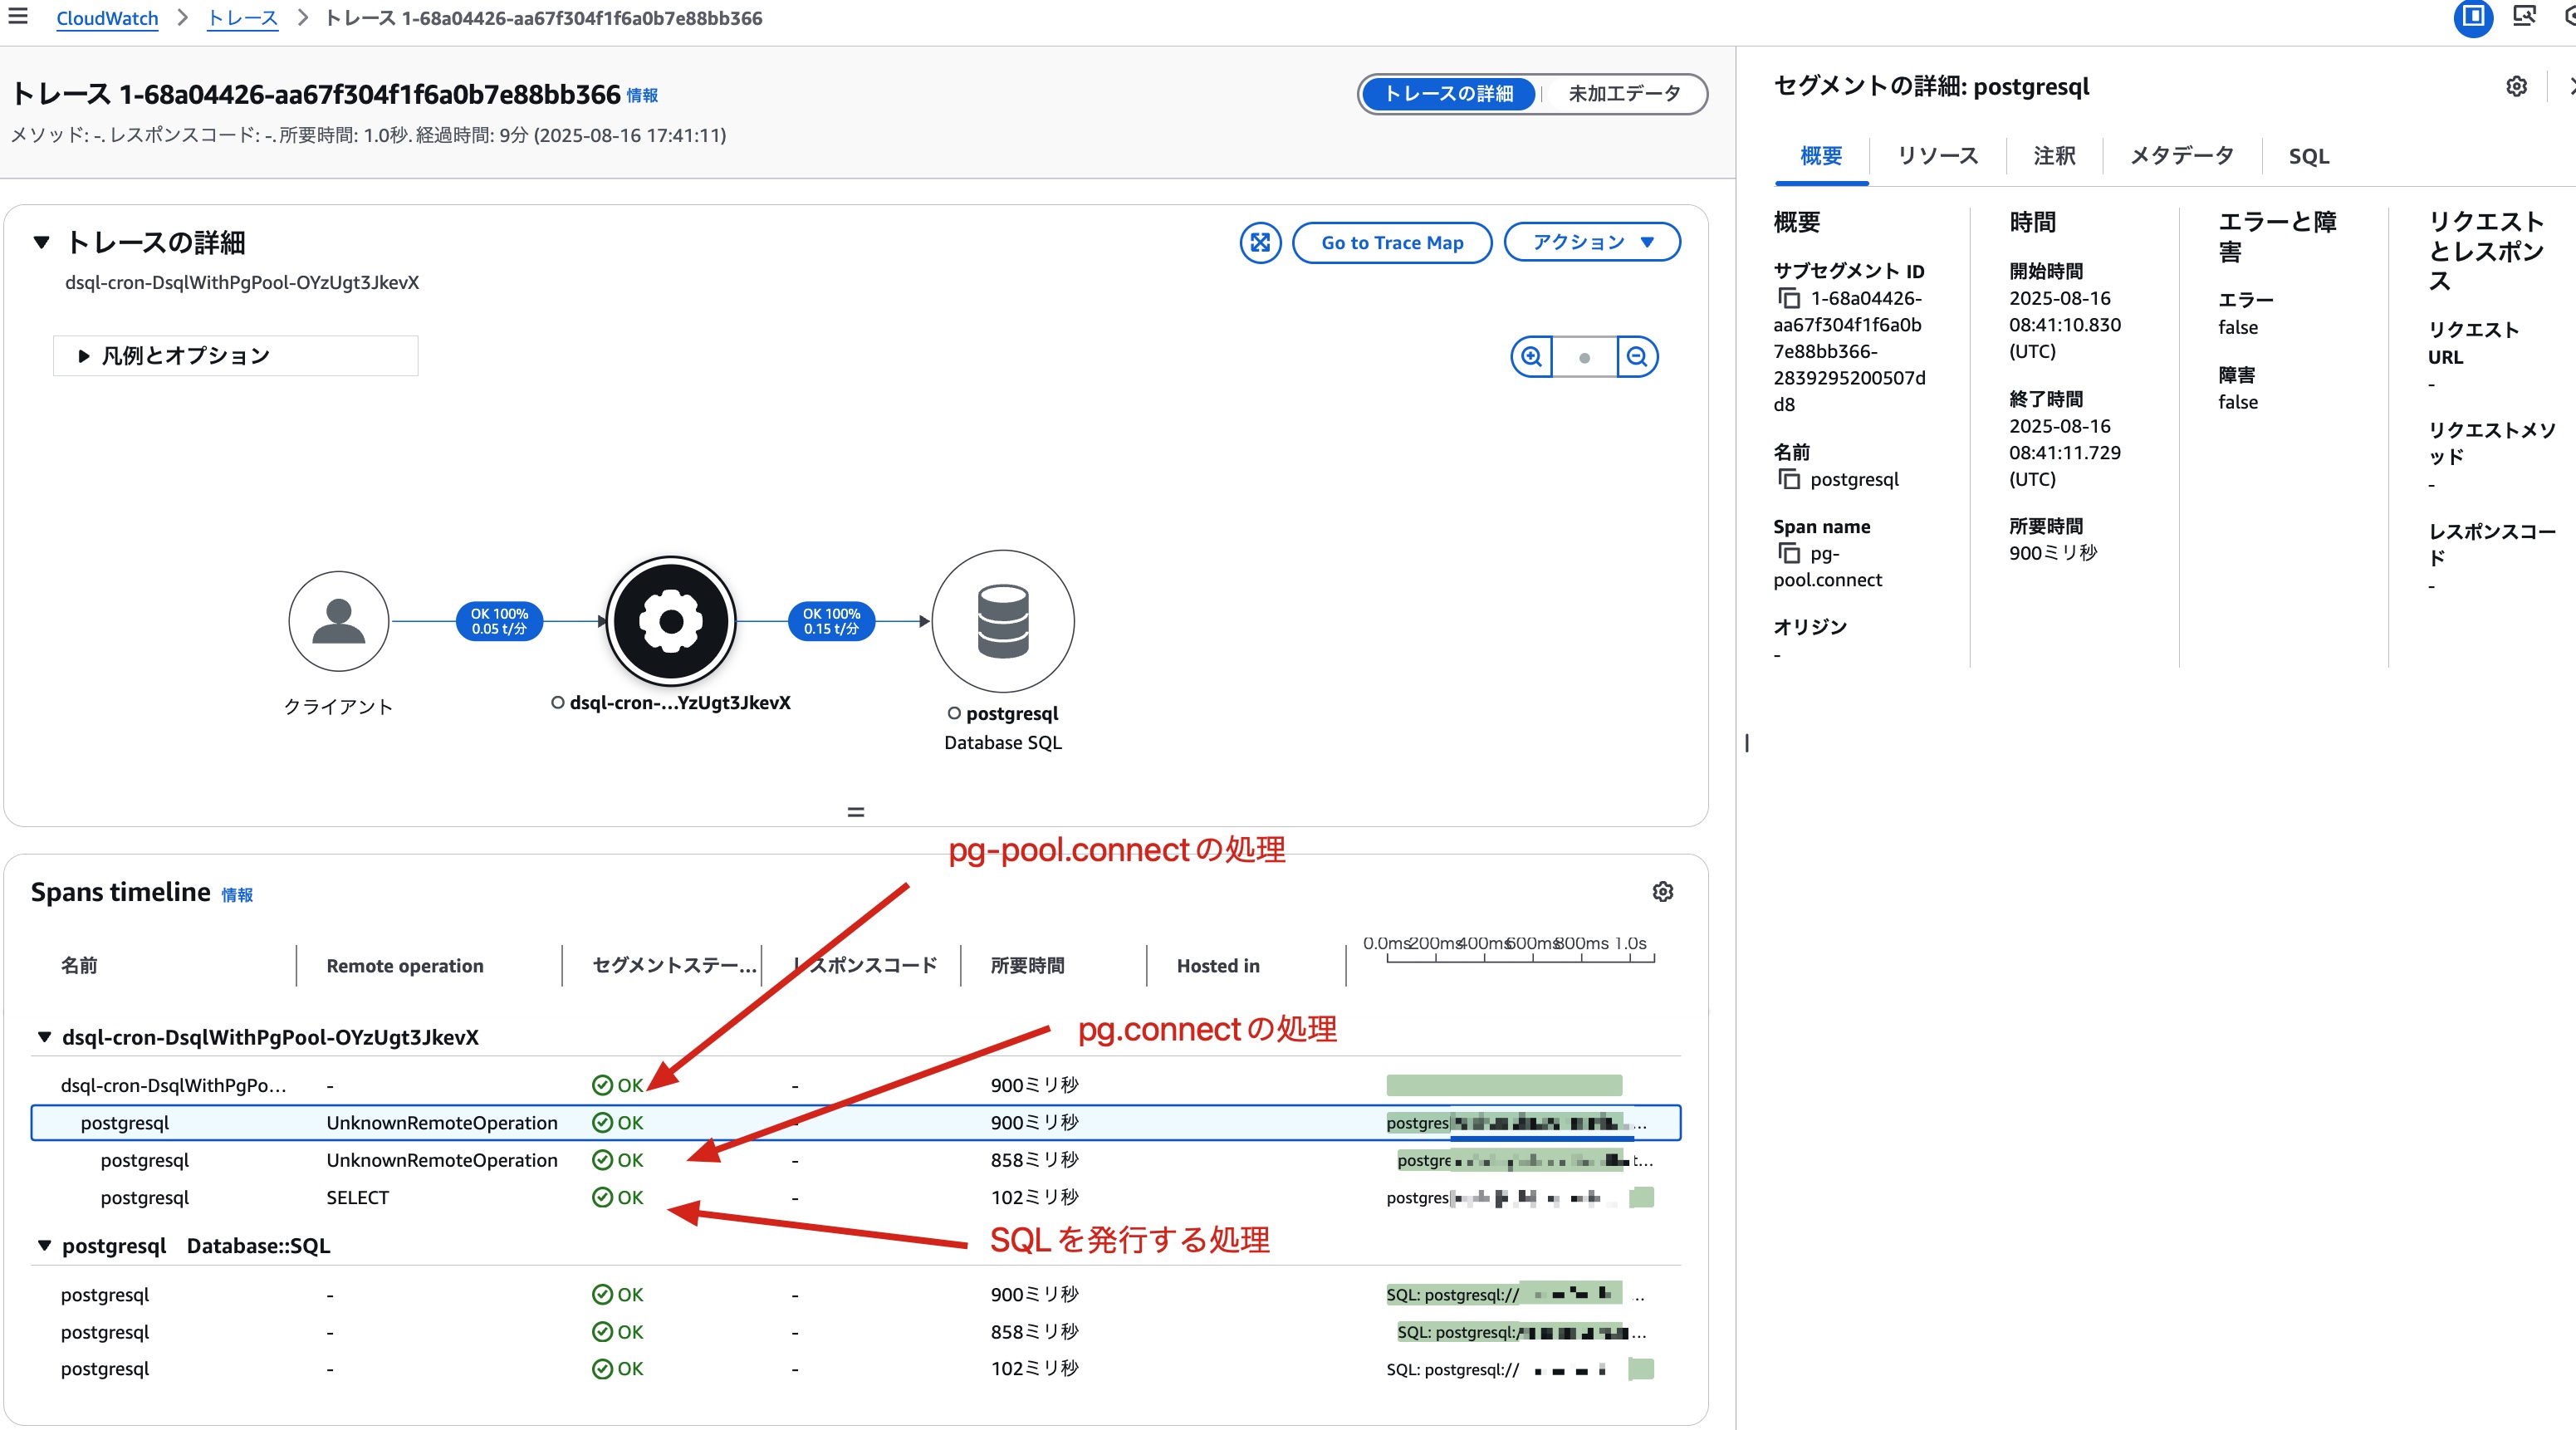
Let's deploy this Lambda and run it every 5 minutes from Event Bridge scheduler, then check the logs and traces. First, here's the trace result during a cold start right after deployment. During a cold start, there are no DSQL connections in the connection pool, so we can see that pg.connect is establishing a connection to DSQL.
For subsequent warm starts, we can see that pg-pool.connect is getting a DSQL connection from the connection pool, and pg.connect is not being called.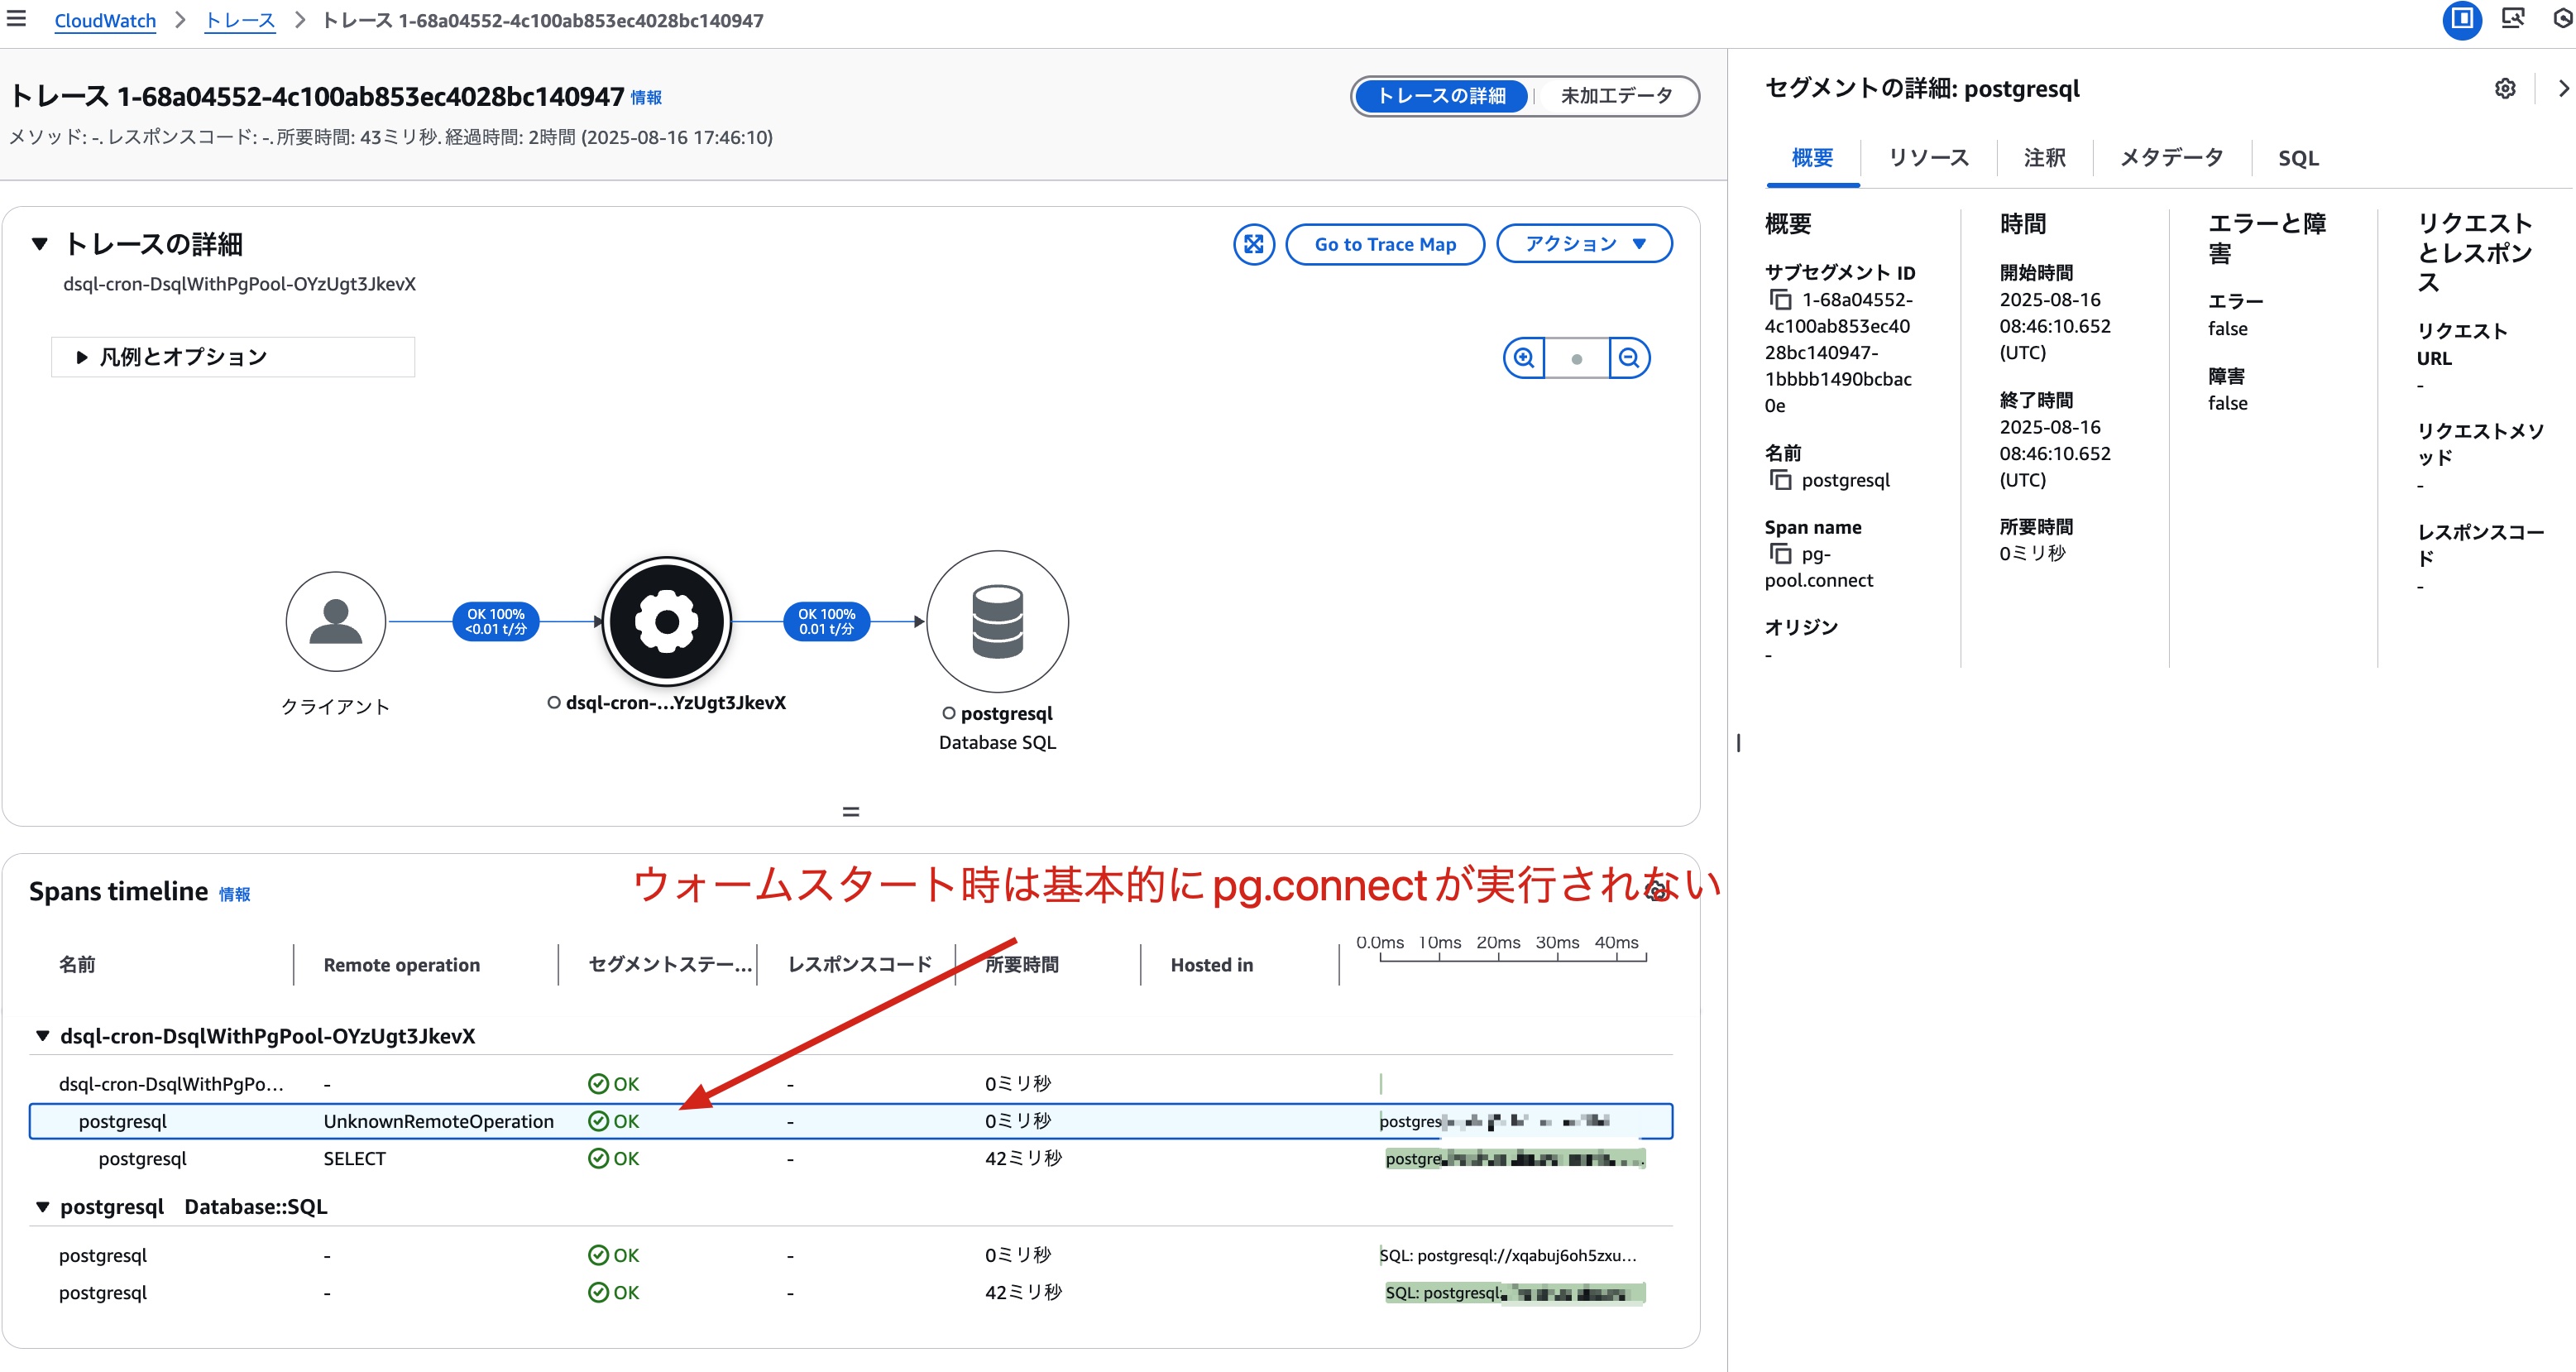
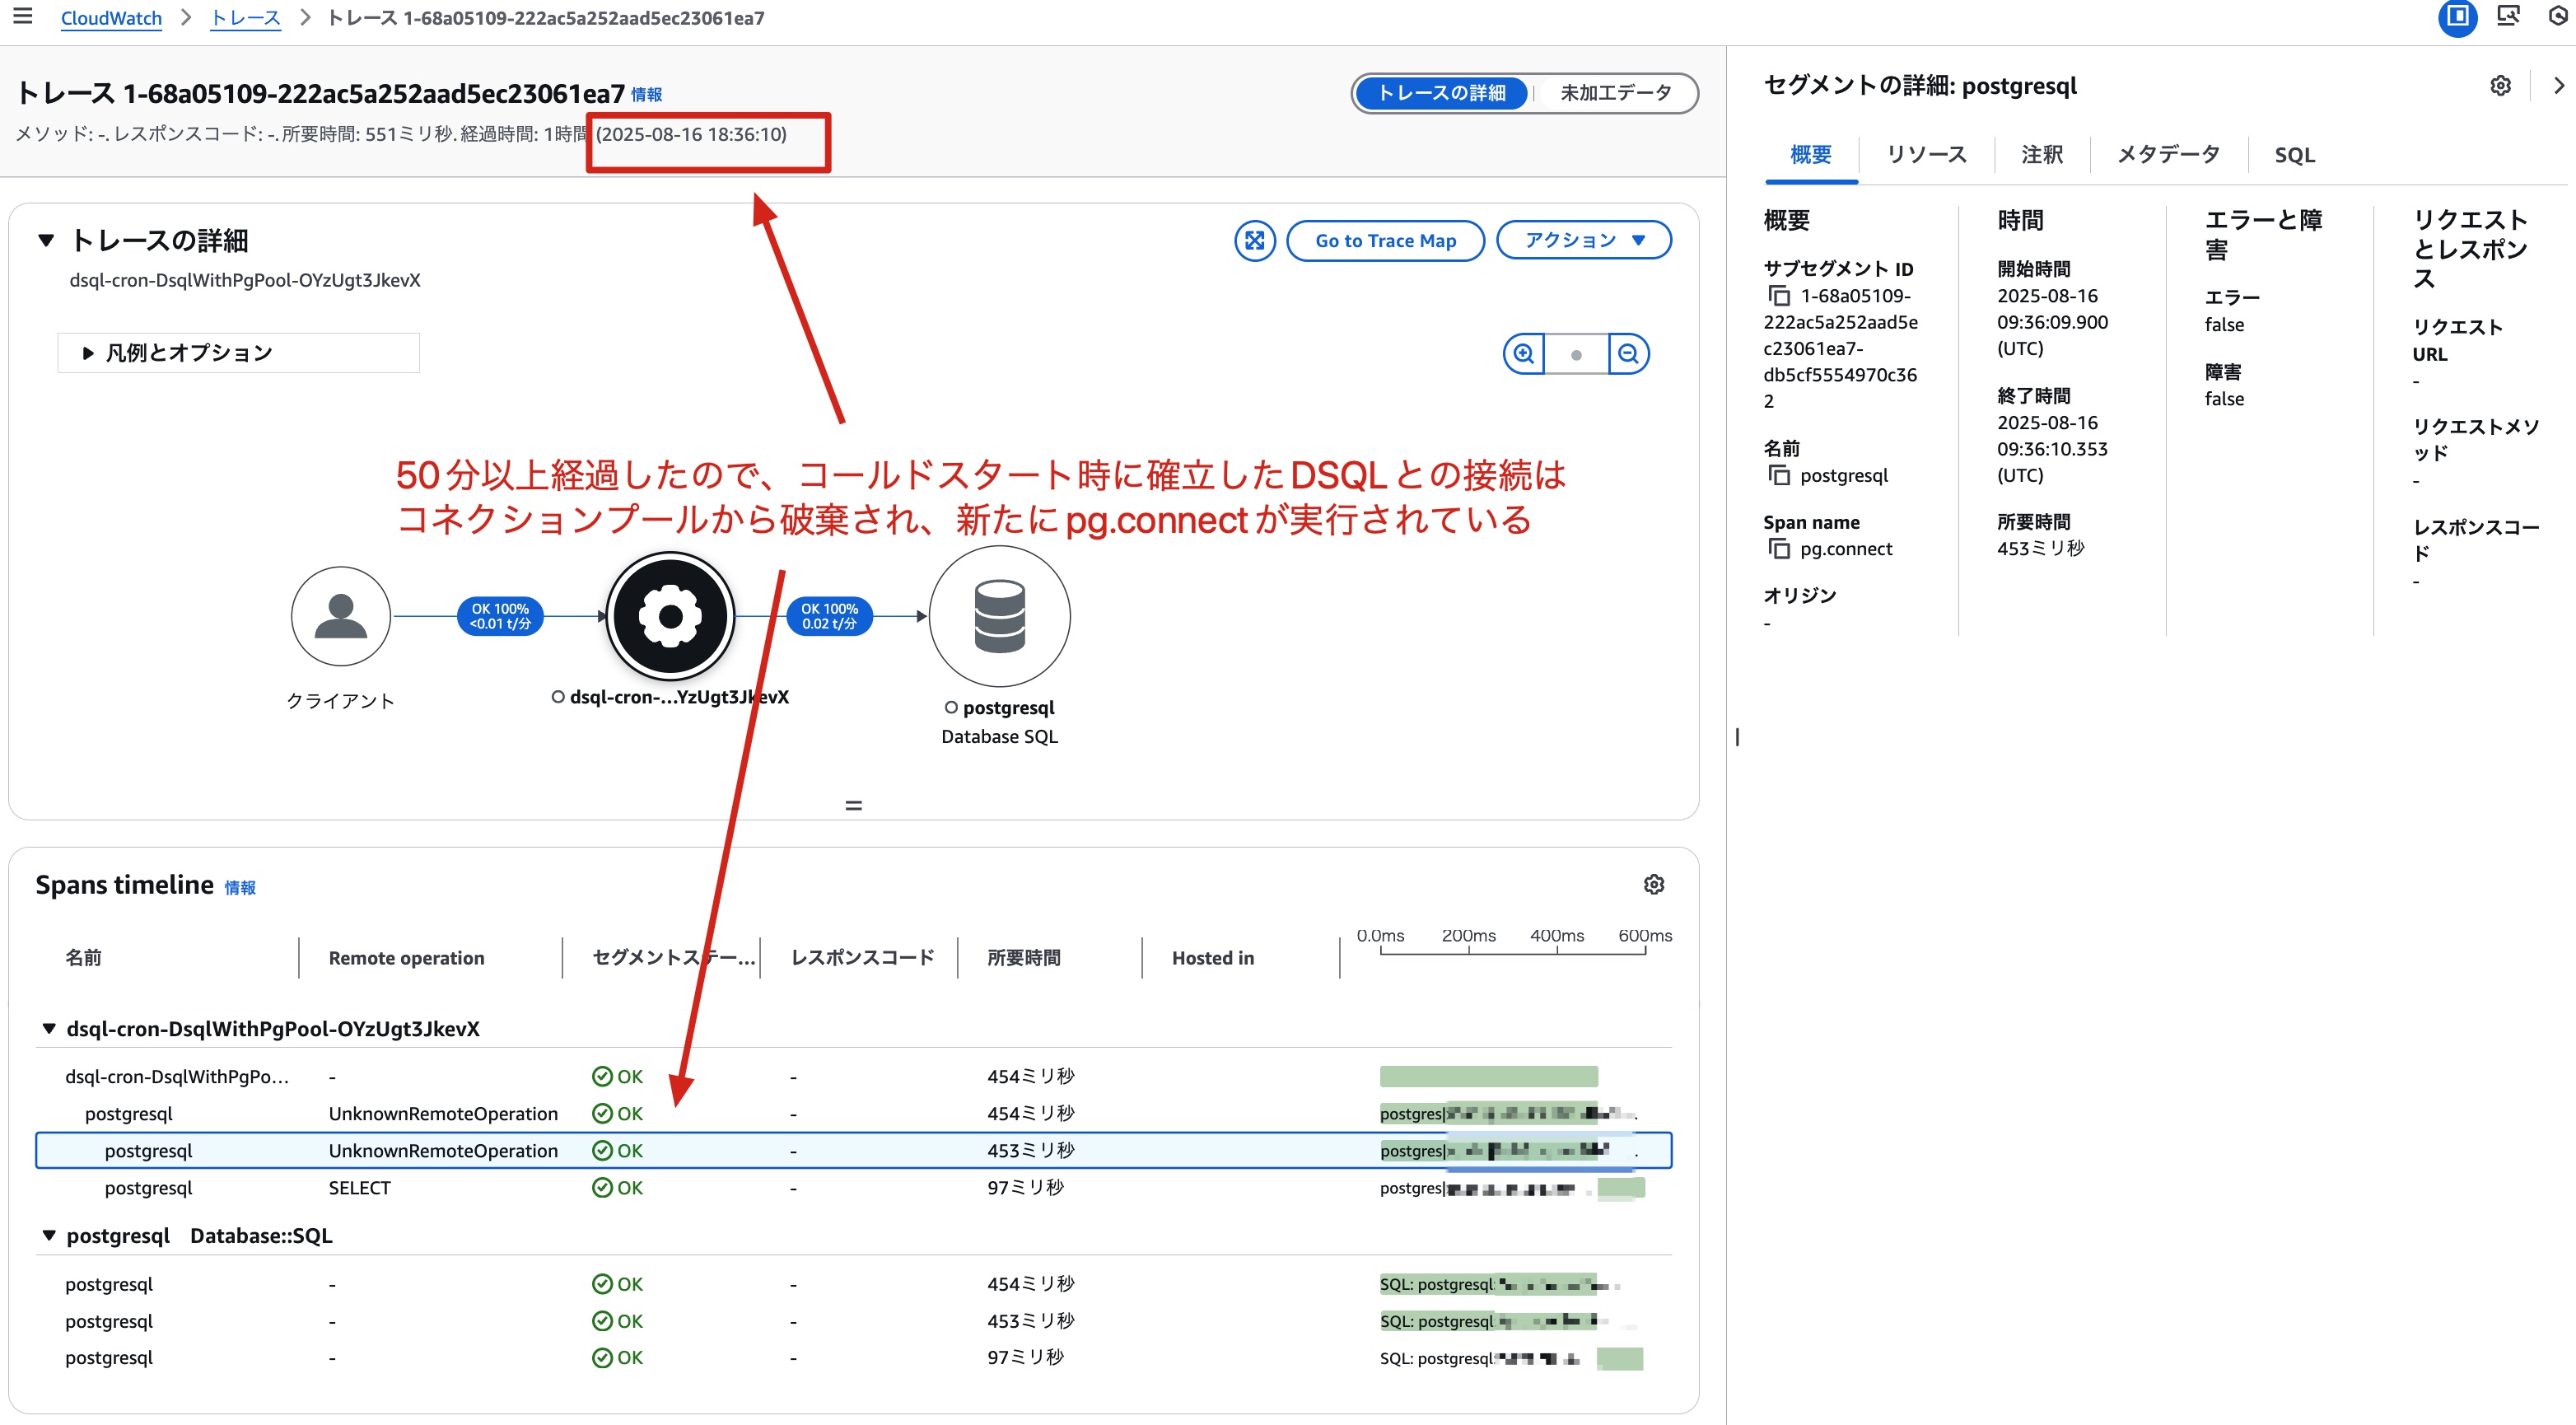
This is the trace result of a warm start after more than 50 minutes from the cold start. Because more than 50 minutes have passed, the connection to DSQL that was established during the cold start has been discarded from the connection pool, and we can see that pg.connect is being called again.
Let's check the logs for the relevant time period by executing the following query in Transaction Search:
			filter ispresent(attributes.db.name)
| display @timestamp, name
| sort startTimeUnixNano
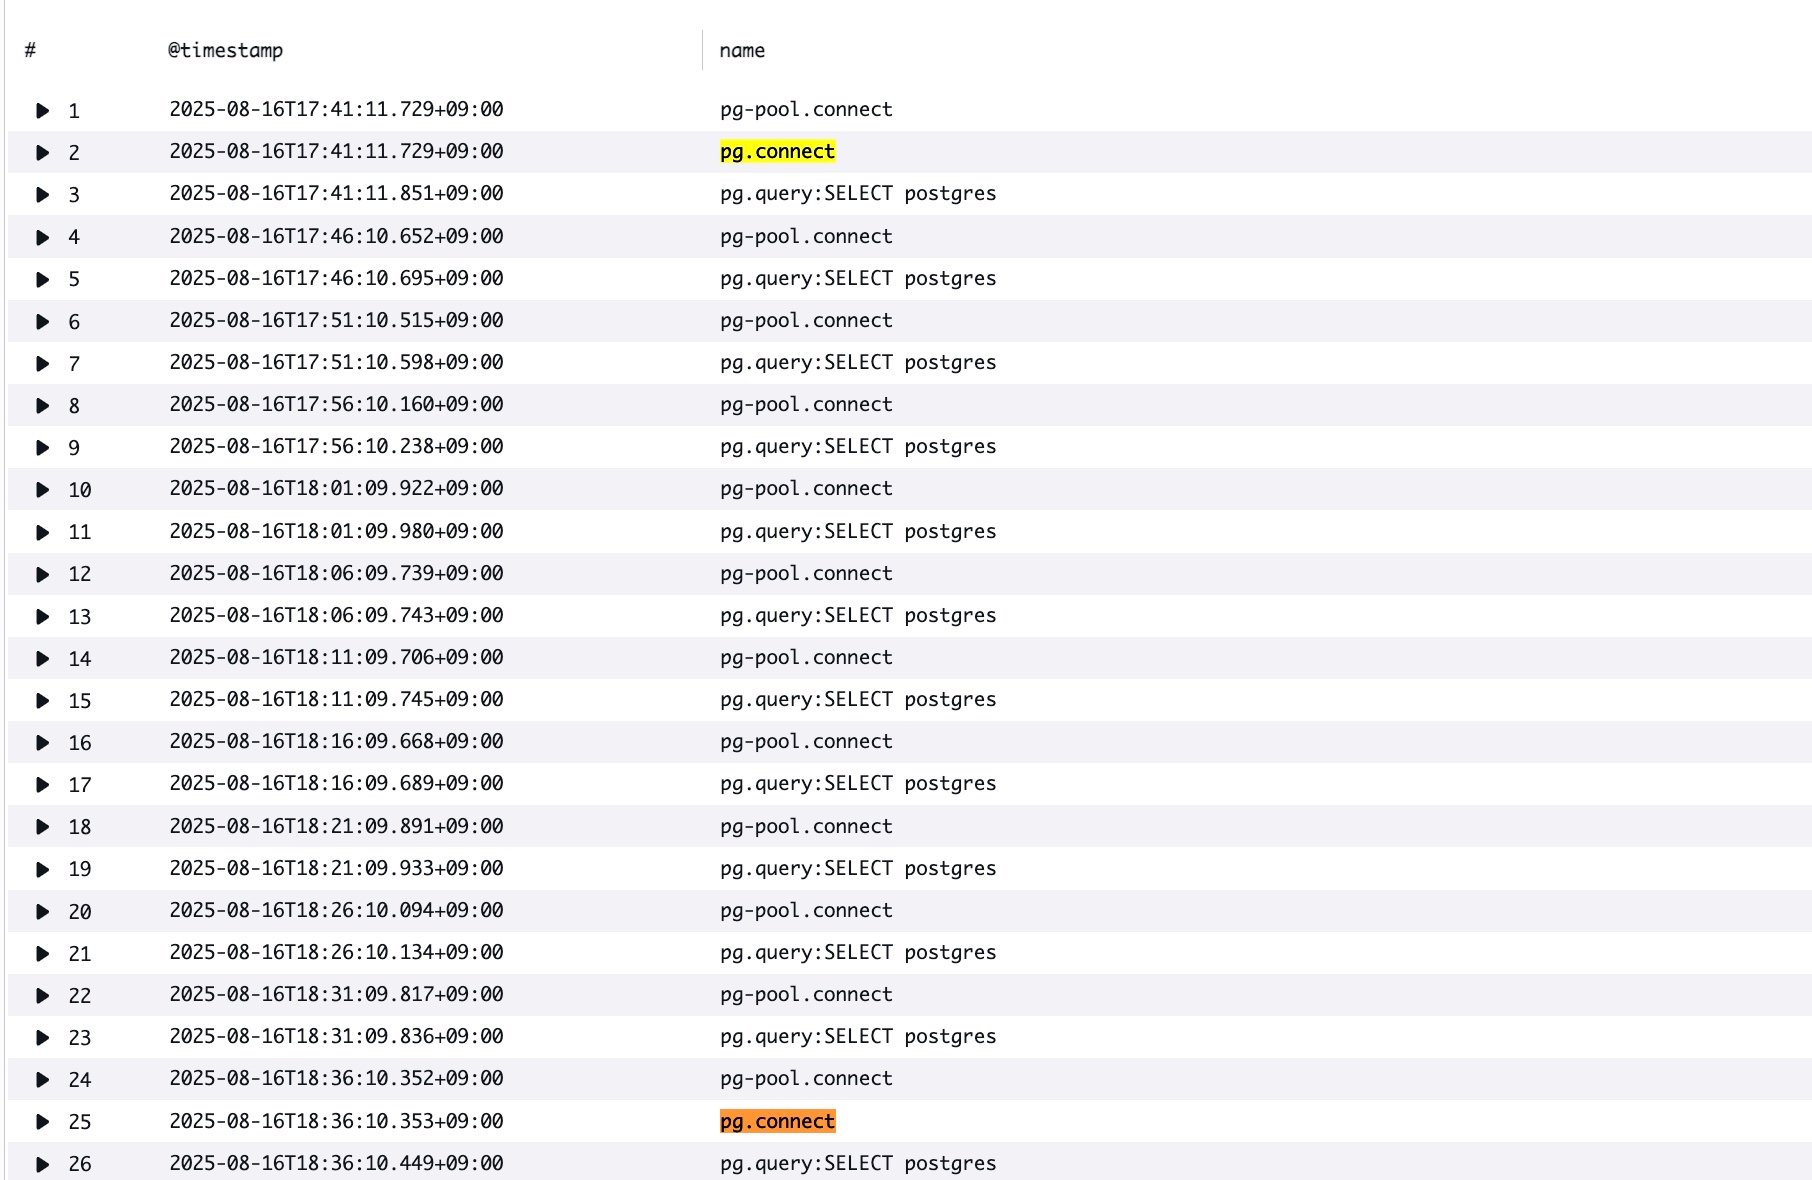
From these logs, we can also see that pg.connect is being executed again after more than 50 minutes.
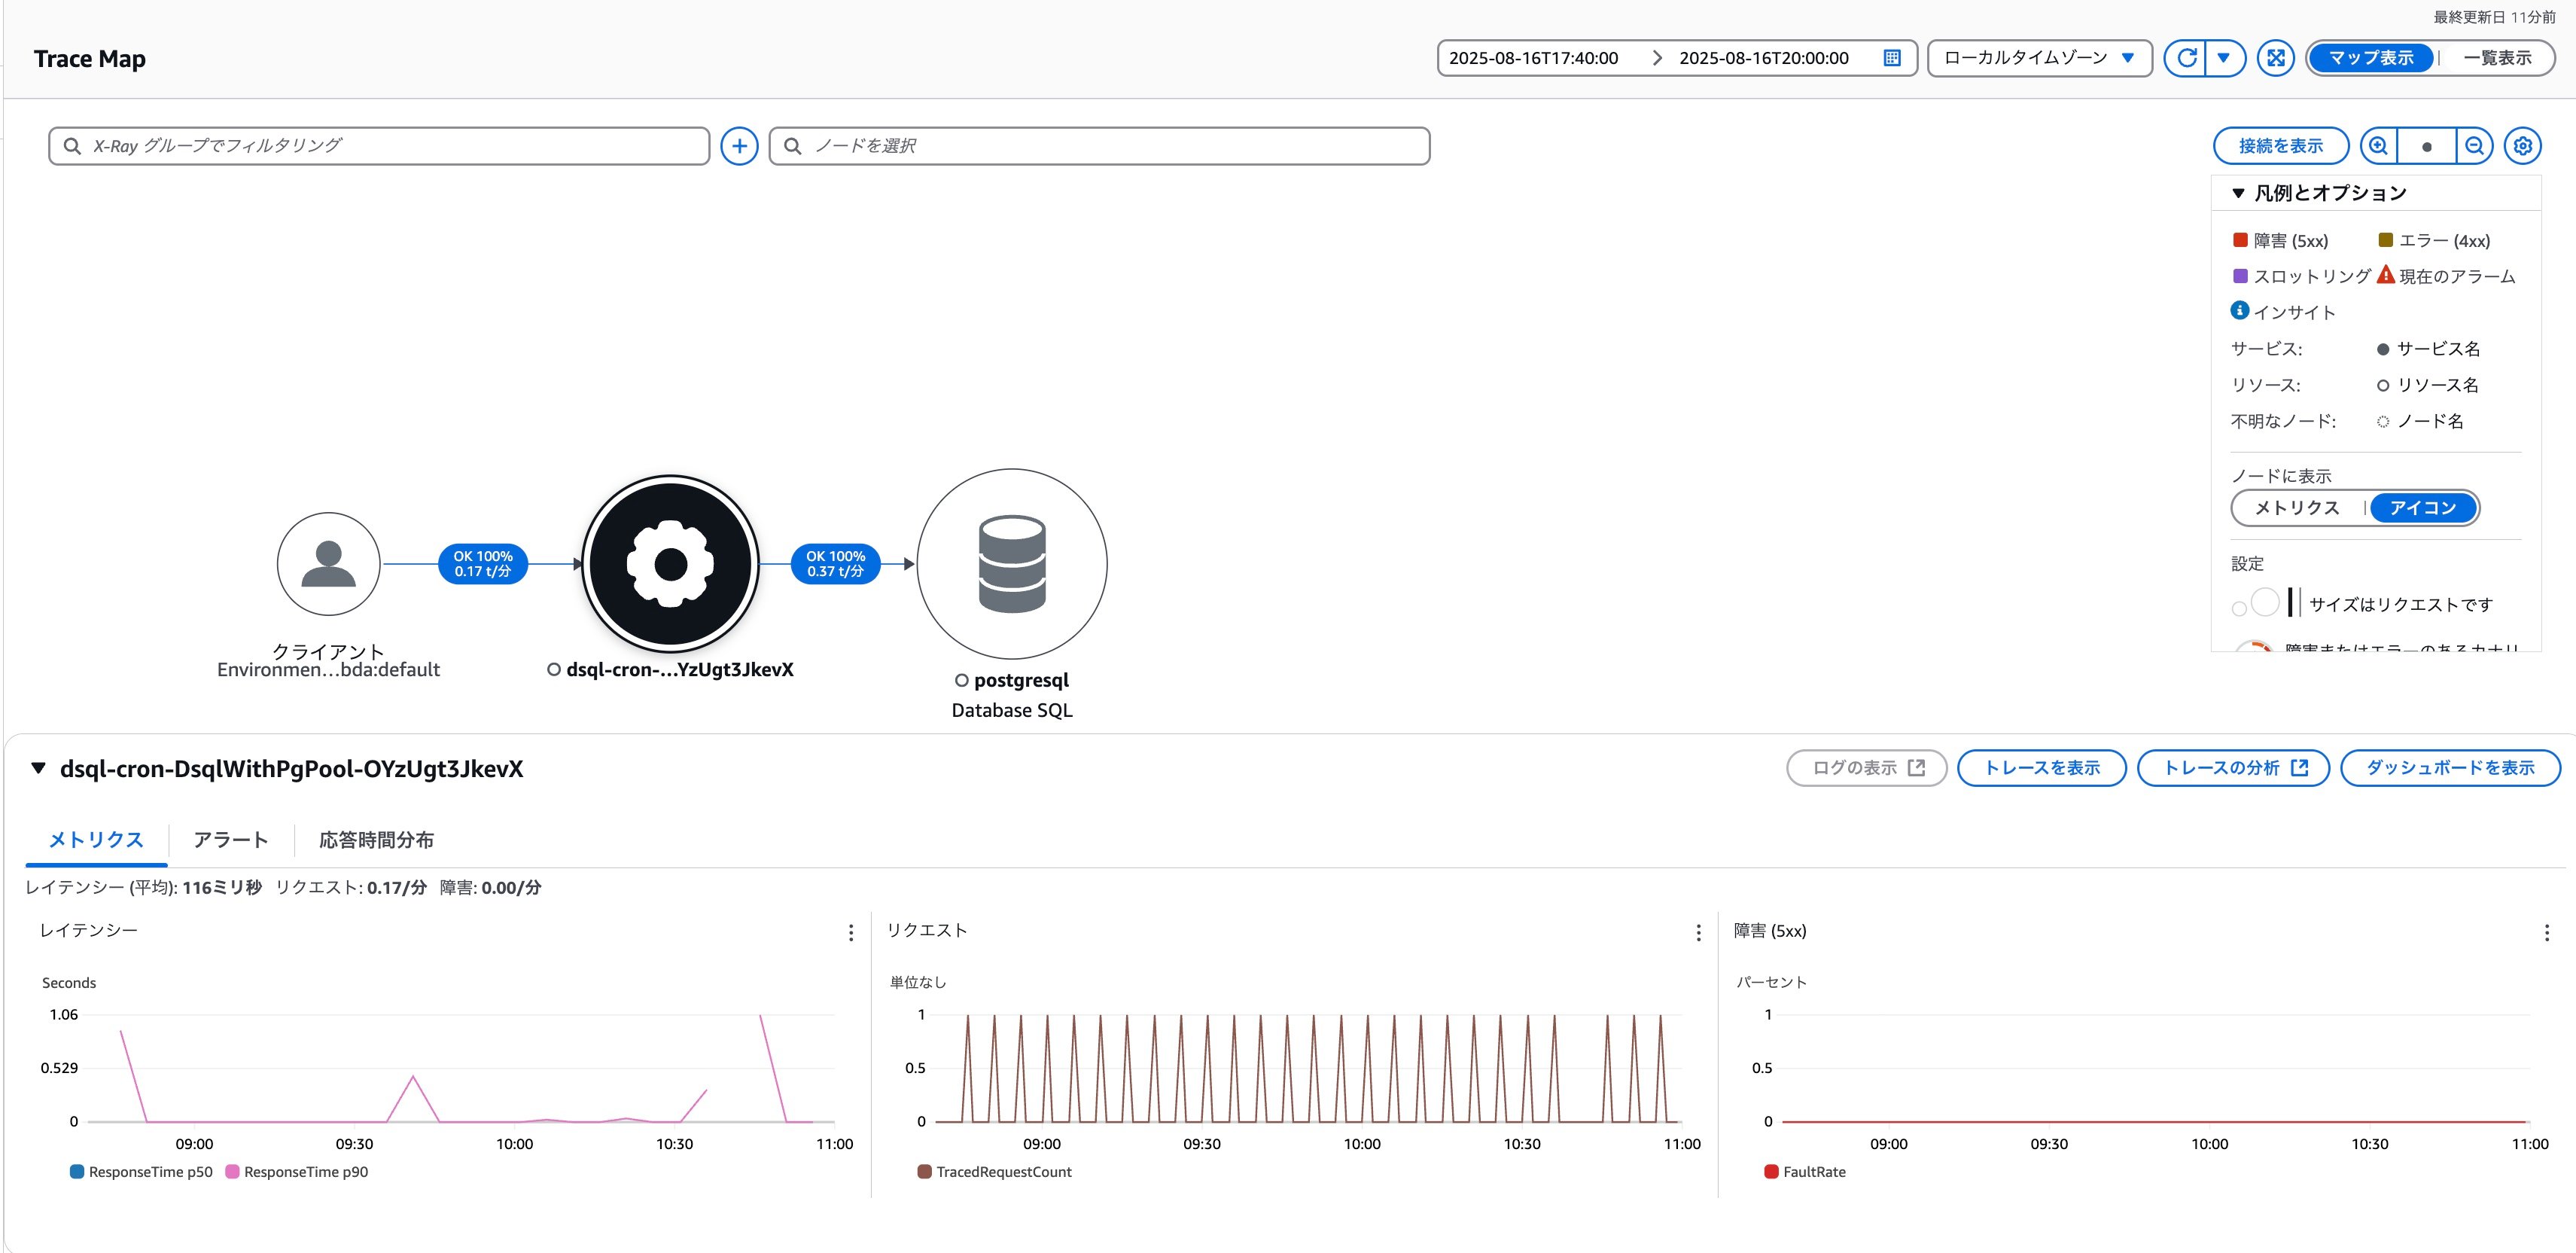
Looking at the trace map, there are no errors occurring with the DSQL connection. Similarly, the Connection terminated unexpectedly error could not be found in the Lambda logs.## SAM Template
Here's the SAM template I used for this verification. I'm including it for reference.
			AWSTemplateFormatVersion: 2010-09-09
Transform:
- AWS::Serverless-2016-10-31
Globals:
  Function:
    Timeout: 10
    Tracing: Active
    Runtime: nodejs22.x
    Layers:
      - arn:aws:lambda:us-east-1:615299751070:layer:AWSOpenTelemetryDistroJs:8
    Environment:
      Variables:
        OTEL_NODE_ENABLED_INSTRUMENTATIONS: pg
        AWS_LAMBDA_EXEC_WRAPPER: /opt/otel-instrument
        DSQL_CLUSTER_IDENTIFIER: !Ref Dsql
Resources:
  Dsql:
    Type: AWS::DSQL::Cluster
    Properties:
      DeletionProtectionEnabled: false
  DsqlWithPgClient:
    Type: AWS::Serverless::Function
    Properties:
      Handler: src/dsql-with-pg-client.handler
      Role: !GetAtt LambdaRole.Arn
      Events:
        CloudWatchEvent:
          Type: Schedule
          Properties:
            Schedule: rate(5 minutes)
  DsqlWithPgPool:
    Type: AWS::Serverless::Function
    Properties:
      Handler: src/dsql-with-pg-pool.handler
      Role: !GetAtt LambdaRole.Arn
      Events:
        CloudWatchEvent:
          Type: Schedule
          Properties:
            Schedule: rate(5 minutes)
  LambdaRole:
      Type: AWS::IAM::Role
      Properties:
        AssumeRolePolicyDocument:
          Version: '2012-10-17'
          Statement:
          - Effect: Allow
            Principal:
              Service:
              - 'lambda.amazonaws.com'
            Action: sts:AssumeRole
        Policies:
        -
          PolicyName: dsql-blog-policy
          PolicyDocument:
            Version: "2012-10-17"
            Statement:
            -
              Effect: "Allow"
              Action:
                - 'dsql:*'
                - "logs:*"
                - "xray:*"
              Resource: '*'
Conclusion
I've verified the maximum connection time for DSQL. Instead of implementing our own solution to avoid exceeding the maximum connection time, it's better to utilize the connection pool mechanisms provided by various libraries to simplify implementation.
In this verification, I only tested with simple SELECT statements, but when executing transactions, there will likely be additional connection management considerations that I'd like to verify in the future.## References
