
I Tried Expanding Lambda Web Functions Regions from Four to Five (Adding Ohio)

This page has been translated by machine translation. View original
Introduction
Recently, we migrated the backend of DevelopersIO (the Next.js runtime environment) to Lambda Web Functions.
We adopted the MultiRegion endpoint of Web Functions and initially started using it in four regions: Tokyo, Virginia, Oregon, and Frankfurt. After that, we switched to five regions by adding Ohio (us-east-2). This article introduces the results.
Switching to Five Regions
With Lambda Web Functions, an endpoint cannot be changed from MultiRegion to PerRegion after creation, and regions cannot be added or removed.
Therefore, this time we created a new Web Functions endpoint specifying five regions and swapped the origin of the public-facing CloudFront.
Requests That Reached Ohio
Daily Counts and Ratios
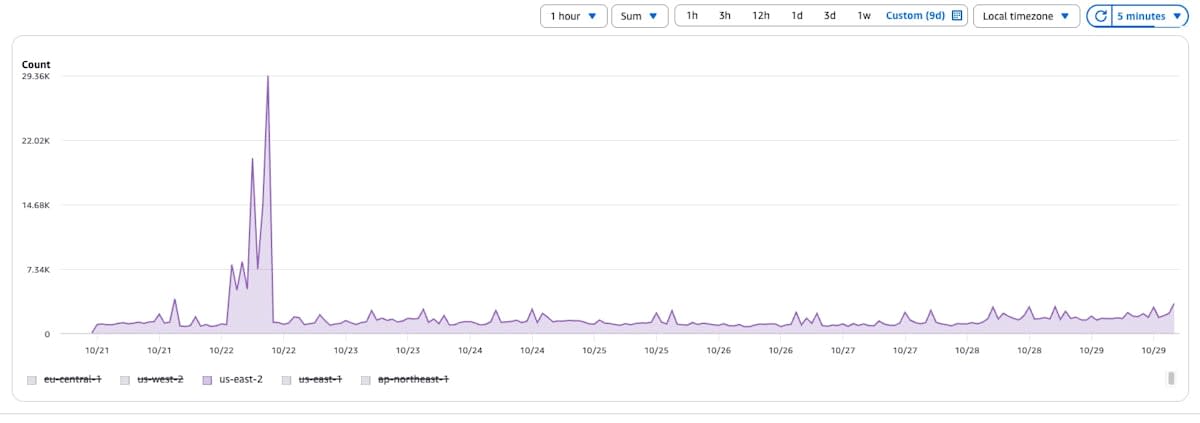
We aggregated the requests that reached Lambda after the introduction of Ohio on a daily basis (JST).
| Date (JST) | Total | Ohio | Ohio ratio | Tokyo ratio |
|---|---|---|---|---|
| 10/21 Wed | 441,332 | 30,602 | 6.9% | 27.3% |
| 10/22 Thu | 524,262 | 118,048 | 22.5% | 24.8% |
| 10/23 Fri | 502,080 | 36,656 | 7.3% | 37.6% |
| 10/24 Sat | 422,285 | 35,970 | 8.5% | 21.8% |
| 10/25 Sun | 391,098 | 29,824 | 7.6% | 22.4% |
| 10/26 Mon | 535,743 | 26,778 | 5.0% | 24.5% |
| 10/27 Tue | 424,303 | 29,131 | 6.9% | 30.8% |
| 10/28 Wed | 453,619 | 44,460 | 9.8% | 28.8% |
| 10/29 Thu (through 16:00 hour) | 337,683 | 35,175 | 10.4% | 27.3% |
Comparison with Before Ohio Was Introduced
Comparing the typical daily counts per region before and after the introduction of Ohio, it appears that requests that had gone to Virginia moved to Ohio.
| Region | Before Ohio (requests/day) | After Ohio (requests/day) |
|---|---|---|
| Tokyo | 123,852 | 123,686 |
| Oregon | 95,112 | 91,856 |
| Virginia | 135,530 | 107,182 |
| Ohio | 0 | 32,974 |
| Frankfurt | 55,208 | 77,284 |
The Spike on 10/22
From the 02:00 hour to the 09:00 hour (JST) on 10/22, requests concentrated in Ohio.
| 10/22 (JST) | Ohio (requests/hour) | Tokyo (requests/hour) |
|---|---|---|
| 02:00 hour | 7,755 | 3,875 |
| 03:00 hour | 4,991 | 3,047 |
| 04:00 hour | 8,073 | 3,242 |
| 05:00 hour | 5,152 | 3,131 |
| 06:00 hour | 19,927 | 3,108 |
| 07:00 hour | 7,330 | 3,432 |
| 08:00 hour | 14,673 | 4,642 |
| 09:00 hour | 29,403 | 6,726 |
| Median outside 02:00–09:00 hours (p10–p90) | 1,257 (936–2,292) | 4,463 (2,946–7,843) |
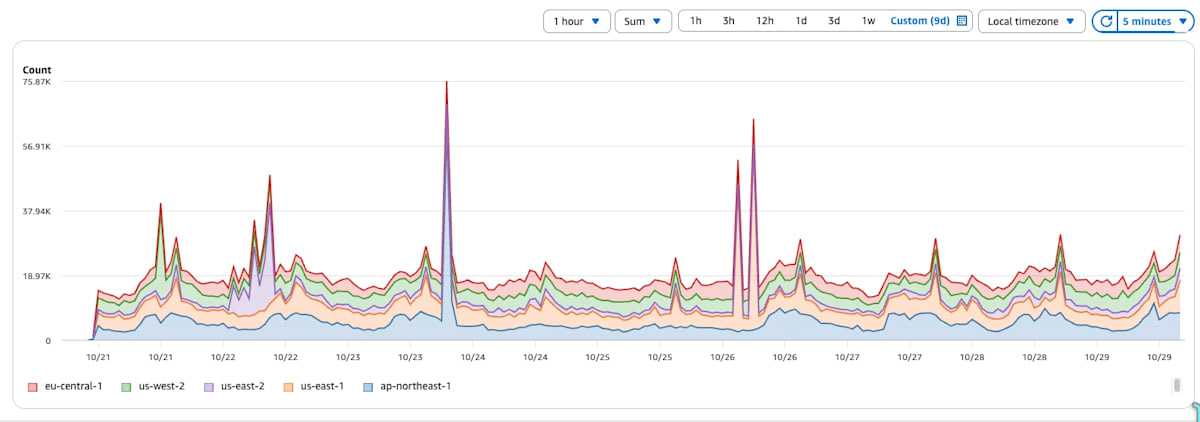
In the graph stacking the five regions, spikes occur every few days. In every case, only one region grows.
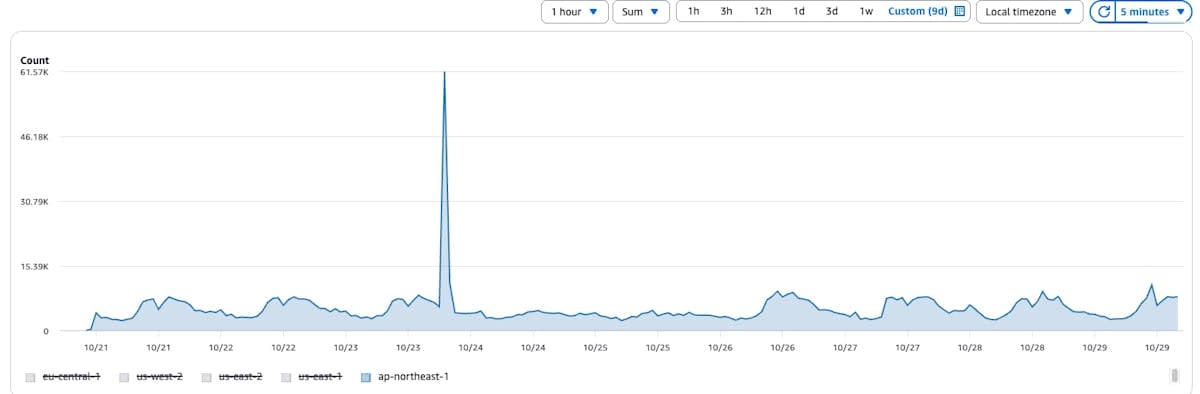
Before the multi-region deployment, the backend existed only in Tokyo, and all spikes reached Tokyo. After the deployment, even while other regions spiked, Tokyo's request count stayed within its normal range. The peak on 10/23 is a spike in Tokyo itself.
During the Ohio spike on 10/22, access from a UA calling itself ShapBot was concentrated. According to CloudFront logs, of the 158,026 requests that reached the origins of all regions from the 02:00 hour to the 08:00 hour (JST), 70,844 were requests from ASN 396982 (Google Cloud). Of those, 91% were requests from a UA calling itself ShapBot. ShapBot is the name of a crawler UA listed in Parallel's official documentation.
Access Sources by Region
For the five days of 10/24–10/28 (UTC), we estimated the UAs commonly seen in each region.
| Region | Top UAs (estimated share) | Total of UAs claiming to be browsers |
|---|---|---|
| Tokyo | Windows browsers 34%, Mac browsers 13%, Bytespider 8%, Hatena-Favicon 5%, ZennBot 4% | 56% |
| Oregon | bingbot 69%, Googlebot 3%, ElevenlabsCrawler 2% | 17% |
| Virginia | Slackbot 24%, scanner claiming to be NVIDIA's PSIRT 15%, ExaSearchBot 8%, SemrushBot 5%, Googlebot 3%, Amazonbot 3% | 22% |
| Ohio | UAs calling themselves crawler 21%, ClaudeBot 16%, Googlebot 8%, ShapBot 4%, aws-update-hub 3% | 33% |
| Frankfurt | DataForSeoBot 10%, LinkupBot 5%, serpstatbot 4% | 63% |
For the same period, we also estimated the proportion of requests coming from the ASNs of cloud and hosting providers.
| Region | Originating from ASNs of cloud/hosting providers | Main providers |
|---|---|---|
| Tokyo | 48% | Amazon, Google |
| Oregon | 88% | Microsoft |
| Virginia | 81% | Amazon |
| Ohio | 63% | Google, Amazon |
| Frankfurt | 45% | Hetzner, Google Cloud, OVH |
Of the requests that reached Lambda, 37% came from UAs claiming to be browsers, so human access is a minority. The remaining roughly 63% are UAs of bots and crawlers. Furthermore, requests coming from the ASNs of cloud and hosting providers account for about 67% of the total, and about half even in Tokyo. Since this includes bots claiming to be browsers, actual human access may be even lower.
Conclusion
In the Ohio region, which we added after migrating to Lambda Web Functions, we confirmed that it is processing a certain number of requests from bots and crawlers.
The service quotas of Web Functions (maxTotalArmVCpus, maxTotalRateLimit) are managed per region. Therefore, adding regions can be expected to have the effect of scaling out by increasing the number of processing destinations, as well as narrowing the blast radius of sudden request concentration.
In DevelopersIO's workload, most of the data is retrieved from external APIs via Contentful's CDN, and regional resources such as RDS or ELB are not required. Partly for this reason, the impact on Lambda-related costs from adding regions to Web Functions was minor (a few percent).
If you adopt Web Functions for a site that receives many requests from overseas bots and crawlers, we recommend making use of all available regions, unless there is a reason to avoid a multi-region configuration, such as an organizational SCP restricting the regions you can use.