
I verified the data lost when Loki / Tempo on ECS Fargate goes down

This page has been translated by machine translation. View original
Hello, I'm sora from the Game Solutions Department.
This time, I'll write about my investigation into how much data is lost when Loki / Tempo tasks placed on ECS Fargate go down.
Previously when self-hosting Grafana on ECS Fargate, I had directed the storage destinations to CloudWatch / X-Ray / AMP.
This time, I'll replace those storage destinations with self-hosted Loki / Tempo.
Since both write to S3 after accumulating data locally, with Fargate's ephemeral storage, any data that was being accumulated at the time of a crash will be lost.
I verified the following points this time.
- Confirming that Loki / Tempo write "accumulate then to S3" by checking S3 objects
- How much data is lost for Tempo and Loki respectively when a task is forcibly stopped
Architecture
The following architecture was built this time.
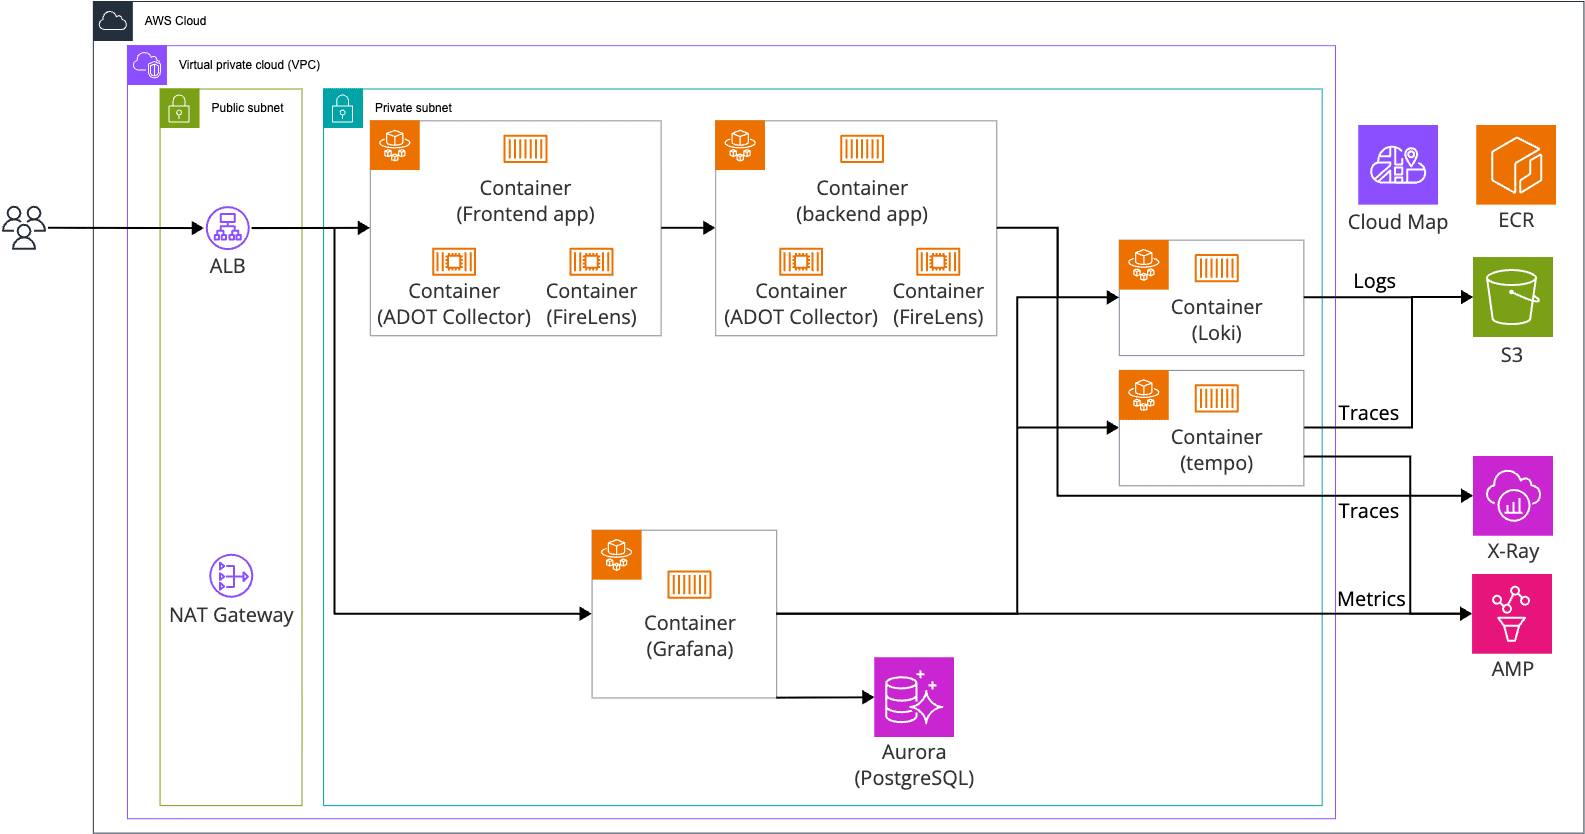
Grafana, Loki, Tempo, and the sample app are all running on Fargate as separate ECS tasks.
They are not crammed into a single task.
Sample app logs are sent to Loki by FireLens, and traces are sent to Tempo by ADOT Collector.
Loki temporarily stores logs locally and Tempo temporarily stores traces locally, before writing to their respective S3 buckets.
Metrics are not sent from the app; instead, Tempo's metrics-generator generates them from traces and remote writes to AMP.
The same traces are also sent from ADOT to X-Ray.
This is to show that the same traces remain on the X-Ray side when Tempo goes down.
The versions used are as follows.
- Grafana: 13.2.1
- Loki: 3.7.7
- Tempo: 3.0.3
The Grafana configuration DB is Aurora Serverless v2, the same as last time, and communication with Loki / Tempo is resolved via Cloud Map within the private subnet.
The Mechanism of Accumulating Then Writing to S3
How long Loki / Tempo accumulate before writing to S3 is determined by configuration.
Since this is the core of this verification, let me organize it first.
Loki
Loki groups logs as streams for each combination of labels.
Log lines coming into that stream are accumulated in memory as chunks, and flushed when conditions are met.
The relationship is that a stream is a logical unit determined by labels, and a chunk is a storage unit divided by time.
Multiple chunks hang from a single stream.
The main flush conditions are as follows.
| Parameter | Default | Role |
|---|---|---|
chunk_idle_period |
30m | Time until flushing chunks of streams that have stopped writing |
max_chunk_age |
2h | Maximum time from when a chunk starts being created until it is flushed |
Note that with the default 2 hours, it's not possible to observe data being dropped to S3, so max_chunk_age is shortened to 3 minutes from the operational check through Verification 2.
It is returned to the default in Verification 3.
Tempo
The Tempo used this time is version 3.0.
In version 3.0, released in August 2026, the internal components were replaced from ingester / compactor to live_store / block_builder.
The 2.x configuration cannot be used as-is.
Tempo has two deployment modes, and this time I'm using monolithic mode where all roles run in a single process.
The other option, microservices, requires Kafka as a prerequisite, so it cannot be chosen for this configuration running in a single task.
Tempo also temporarily accumulates received spans and writes them to S3 after grouping them into units called blocks.
The component responsible for accumulation is live_store, which was newly introduced in 3.0.
| Parameter | Default | Role |
|---|---|---|
max_block_duration |
30s | Maximum time until a block is cut |
There is also max_block_bytes (default 50MB) which cuts by size, but with the traffic volume in this case, the 30-second limit is hit first.
block_builder is a microservices-only component that reads data from Kafka and is not running in monolithic mode.
Setup
This time I also built it with Terraform.
I'll omit the code since there are many basic resources.
Just one point: I've set minimum_healthy_percent to 0 for the ECS service.
This way, old and new tasks don't run simultaneously during replacement, allowing observation of the behavior of a single-task configuration as-is.
Operational Check
Registering Data Sources
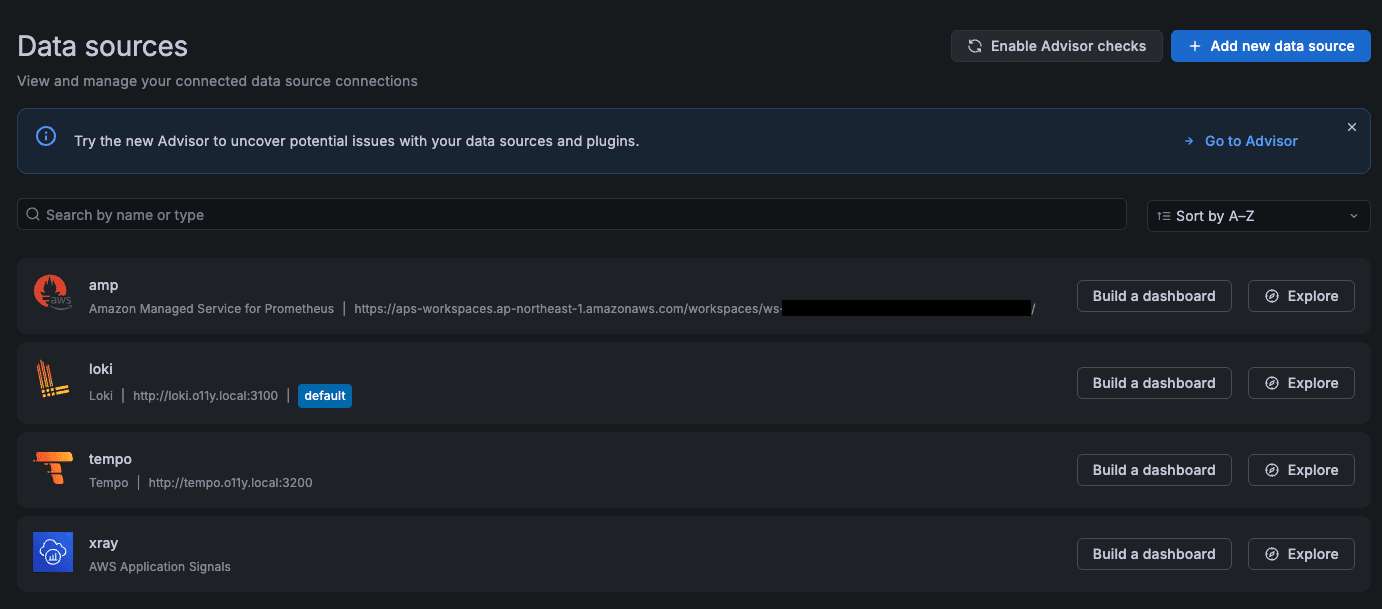
From the left menu Connections → Data sources → Add new data source, register the four data sources: Loki, Tempo, AMP, and X-Ray.
For Loki / Tempo, just enter the Cloud Map name in the URL.
AMP and X-Ray are plugins, so they are installed at startup using GF_INSTALL_PLUGINS.
Confirm that Save & test returns OK for each.
Checking Logs with Loki and Traces with Tempo
The sample app has endpoints that respond normally and endpoints that return errors.
Access these for several minutes to accumulate logs, traces, and metrics.
In Explore, select "Loki" as the data source and run a query with {job="app"}, and the access logs for frontend / backend were confirmed.
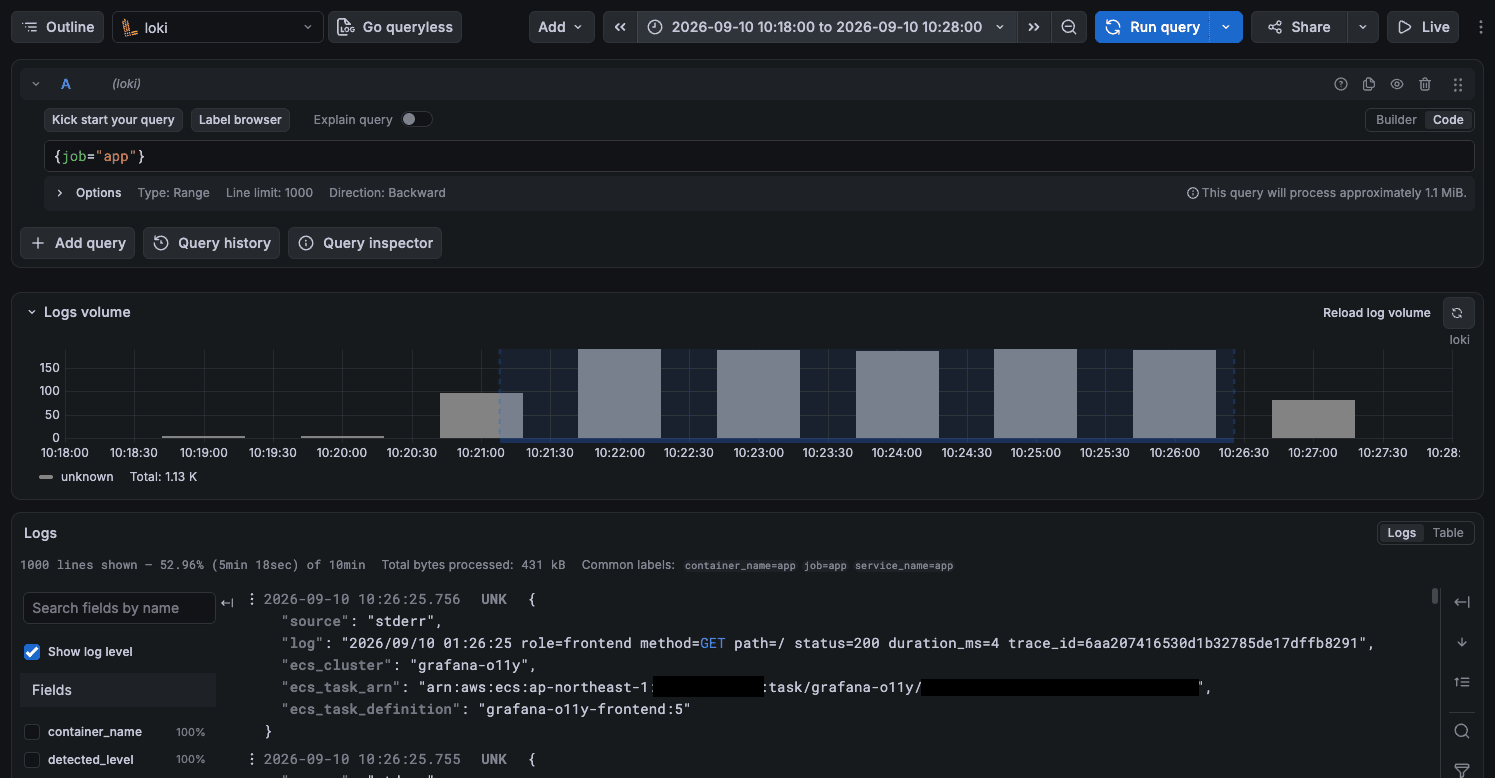
1,129 lines have come in over 10 minutes.
The histogram of log volume at the top with no gaps is the "normal state" for comparison afterwards.
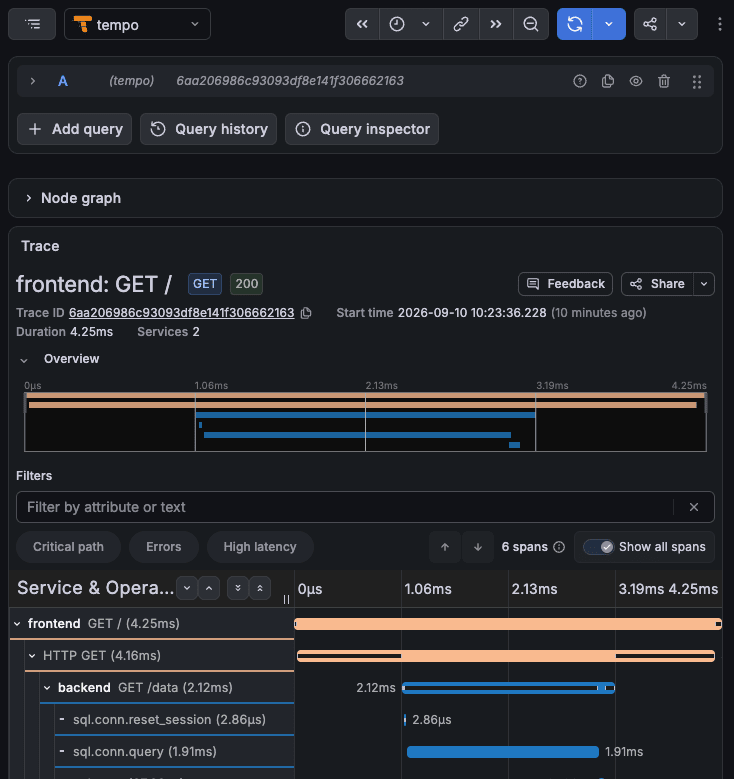
Select "Tempo" as the data source, set Query type to Search, and execute, and a list of traces was displayed.
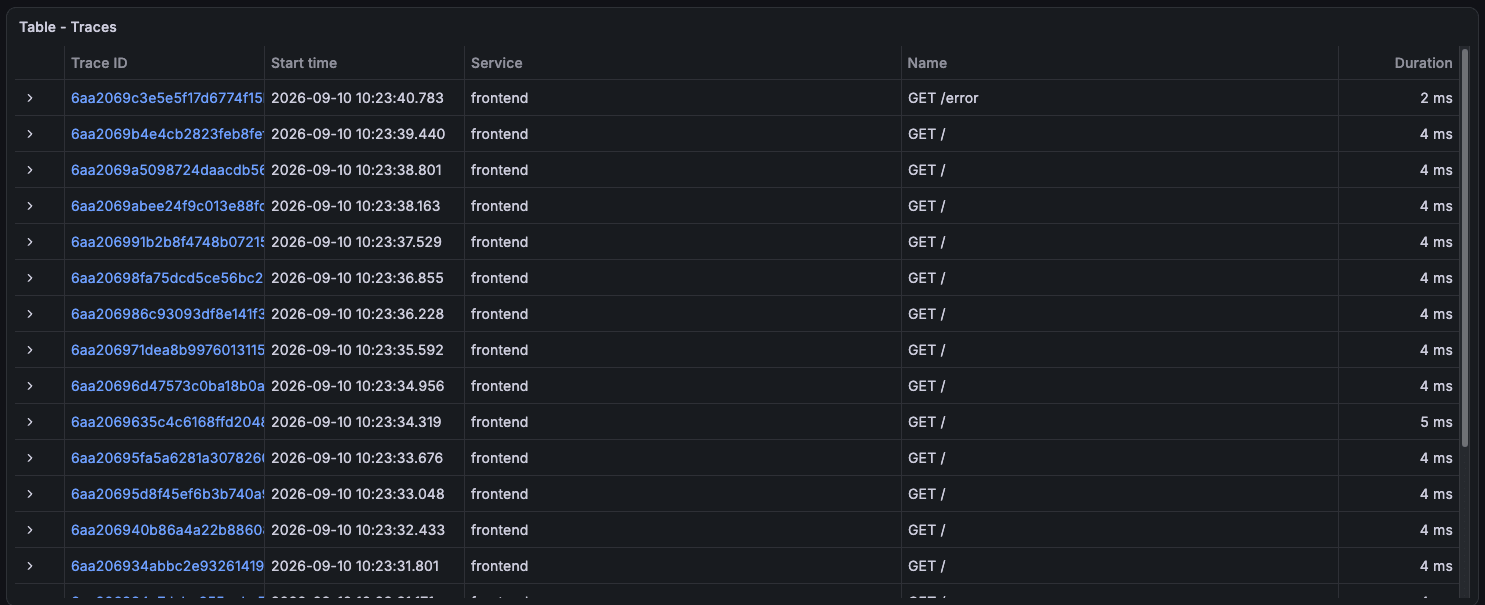
Opening one shows 6 spans lined up: frontend → HTTP GET → backend → sql.conn.query → sql.rows.
Checking Metrics with AMP
This time, the app is not sending metrics.
Only traces are being sent, and Tempo is building metrics from those traces.
This is a Tempo feature called metrics-generator, and this time I have enabled two processors.
overrides:
  defaults:
    metrics_generator:
      processors: ["span-metrics", "service-graphs"]
span-metrics counts received spans by "span name × status" and turns them into histograms of call count, error count, and latency.
service-graphs aggregates "which service called which service" from the parent-child relationships of spans.
Both are written to AMP in Prometheus remote write format.
The advantage is that Rate / Errors / Duration can be obtained without adding metrics instrumentation to the app side.
On the other hand, if Tempo stops, metrics generation also stops.
Select "Amazon Managed Service for Prometheus" as the data source and run the following query.
sum(rate(traces_spanmetrics_calls_total[1m])) by (span_name)
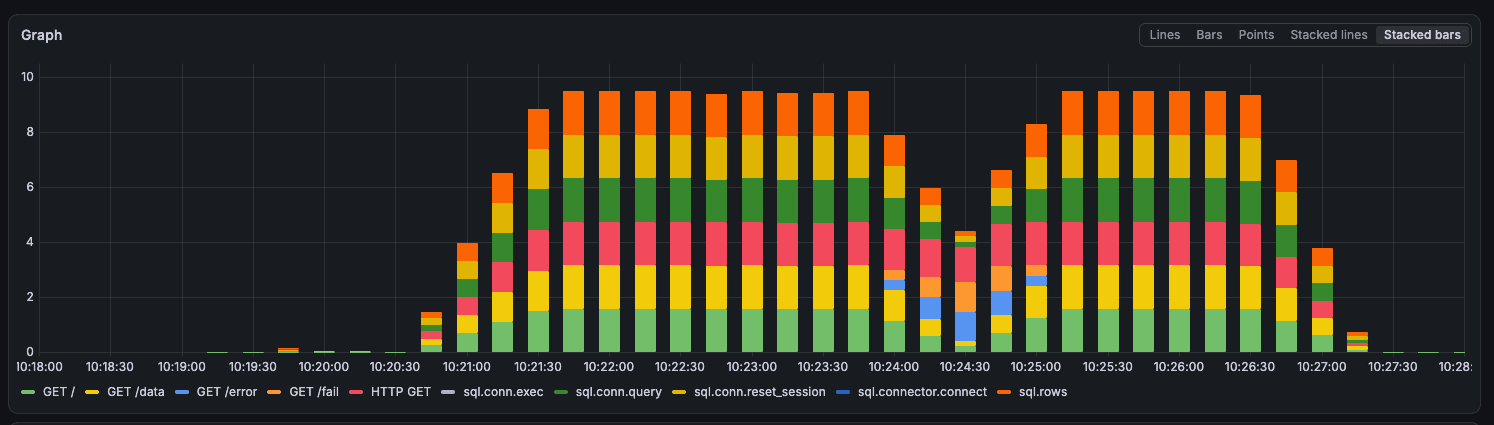
Rates per span name such as GET / and sql.conn.query appeared.
GET /error and GET /fail spike only during the time period when errors were flowing.
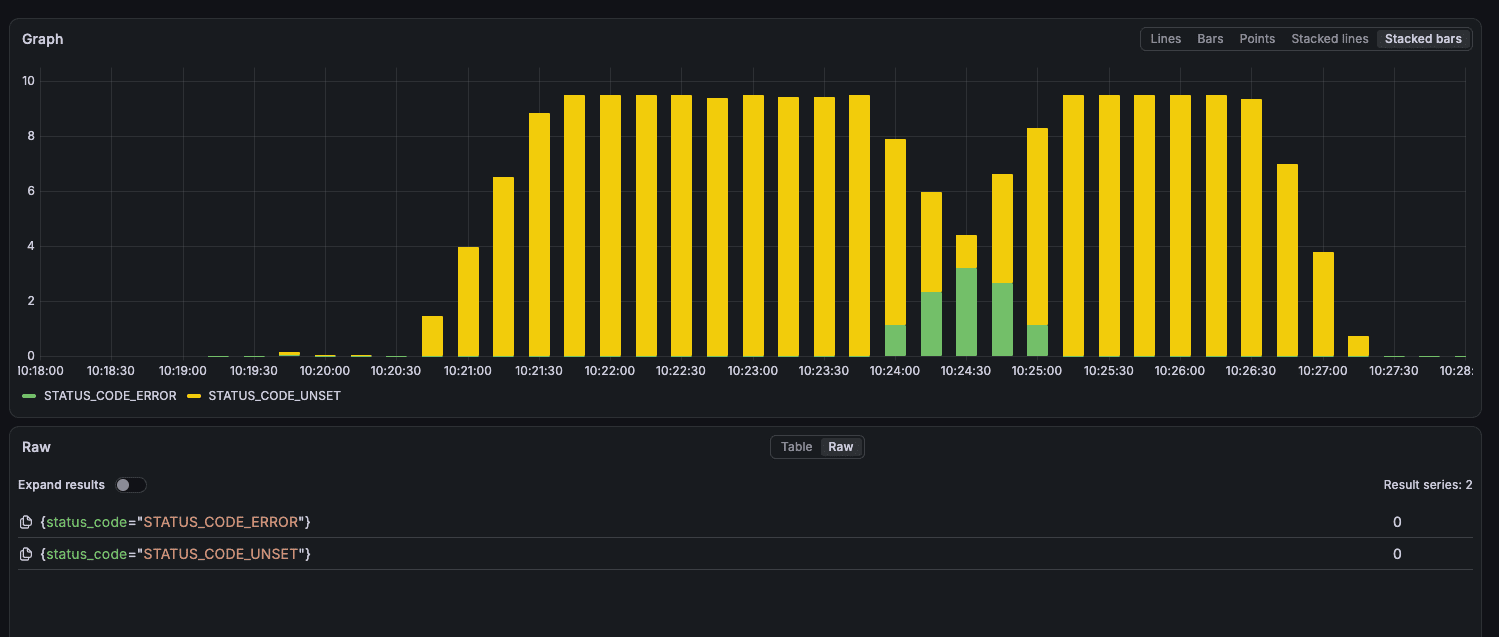
By the way, if you output traces_spanmetrics_calls_total as-is, it becomes a monotonically increasing counter, and you cannot read "the fact that it stopped" from the graph.
Since I'll be doing before/after comparisons in the subsequent verifications, I'll use rate().
Using by (status_code) makes the error peaks stand out clearly.
Checking the Service Graph
Setting Tempo's Query type to Service Graph allows viewing relationships between services.
To make this work, you need to specify the AMP data source for Service graph in the Tempo data source settings.
Note that this Service graph setting is located inside the expanded Additional settings section and is collapsed by default.
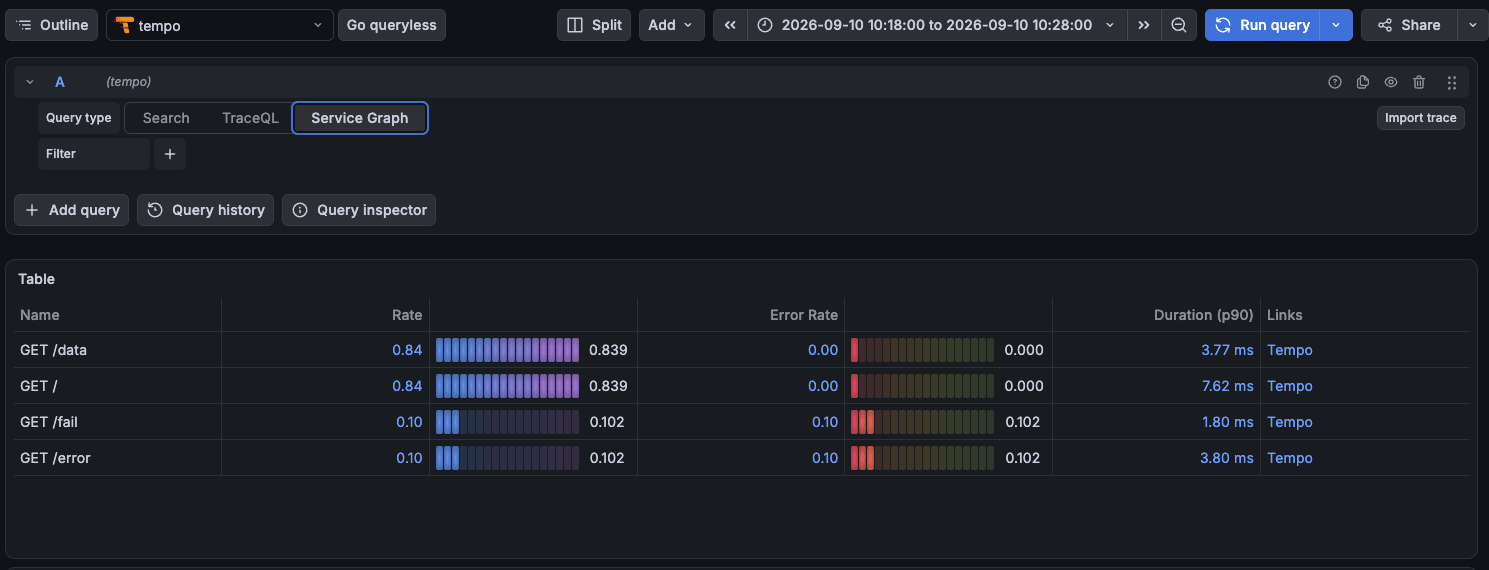
Rate / Error Rate / Duration(p90) are shown per span.
The Error Rate for GET /error and GET /fail is 0.102.
Opening the Node graph on the same screen looks like this.
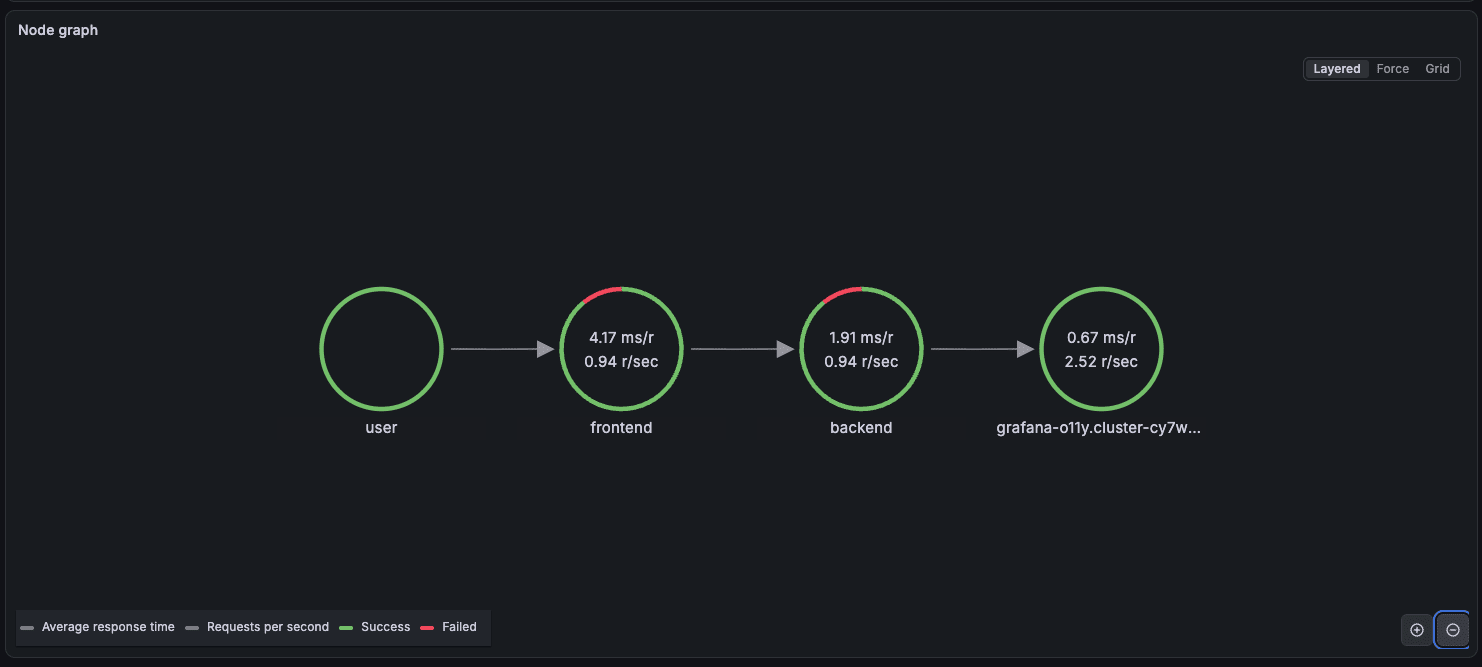
Four nodes were connected: user → frontend → backend → Aurora.
Configuring Related Logs
When you click and expand a span in the trace details, a Related logs button appears to the right of the span name.
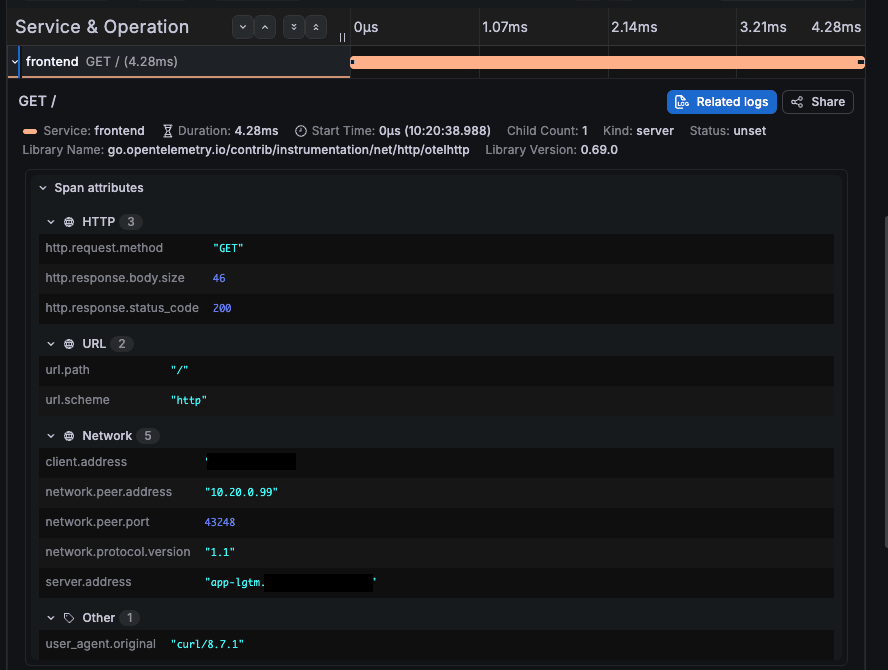
To make this work, you need to configure Trace to logs in the Tempo data source settings.
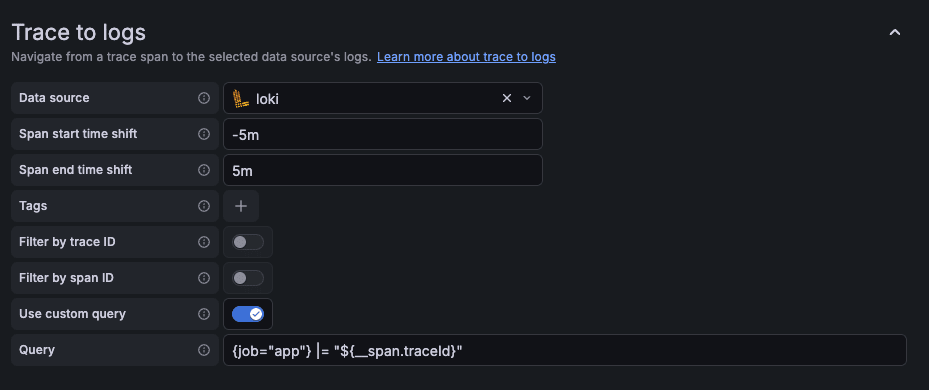
| Item | Value |
|---|---|
| Data source | loki |
| Span start time shift | -5m |
| Span end time shift | 5m |
| Filter by trace ID | OFF |
| Use custom query | ON |
| Query | {job="app"} |= "${__span.traceId}" |
After configuring, pressing Related logs takes you to Loki.
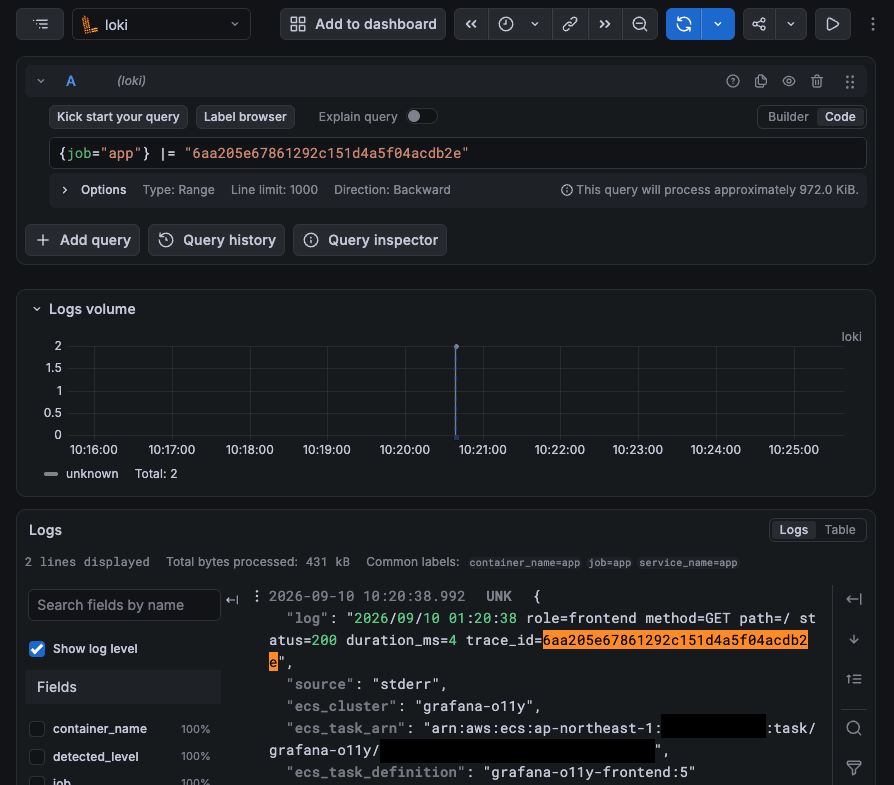
Frontend and backend appeared as 2 lines with the same trace_id.
Incidentally, Amazon Managed Service for Prometheus did not appear in Trace to metrics when configuring the data source.
This is because grafana-amazonprometheus-datasource is not the core Prometheus type.
What Is Placed in S3
After letting data flow for a while, objects increase in S3.
Tempo dropped to S3 within 30-60 seconds with the default values.
$ aws s3 ls s3://grafana-o11y-tempo-<account-id>/ --recursive
2026-09-10 10:50:00   57627  single-tenant/c38ea03b-.../data.parquet
2026-09-10 10:50:00      42  single-tenant/c38ea03b-.../index
2026-09-10 10:50:00     435  single-tenant/c38ea03b-.../meta.json
2026-09-10 10:50:35  102424  single-tenant/d6253ae4-.../bloom-0
2026-09-10 10:50:35   69612  single-tenant/d6253ae4-.../data.parquet
The block interval is 35 seconds, consistent with the default 30s of max_block_duration.
One block is composed of a set of data.parquet / index / meta.json (+ bloom-0).
Loki stores chunks and indexes separately.
$ aws s3 ls s3://grafana-o11y-loki-<account-id>/ --recursive
2026-09-10 10:22:02    7937  fake/e2728b8663a305d9/1a088e533ae:1a088e84cfb:3f25a496
2026-09-10 10:25:05   14351  fake/e2728b8663a305d9/1a088e84f69:1a088eb18da:4b9e7df2
2026-09-10 11:19:21     440  index/index_20706/fake/...-compactor-...tsdb.gz
The files under fake/ are chunks.
fake is the tenant ID when auth_enabled: false.
The filename under index/ contains compactor, indicating it was recreated by the compactor.
The chunk interval of about 3 minutes is because max_chunk_age is shortened to 3 minutes for observation purposes.
With the default 2 hours, nothing would drop for a while even if you waited.
Loki Chunks Are Not Raw Logs
Let me download one S3 chunk and look inside.
$ aws s3 cp s3://.../fake/e2728b8663a305d9/1a084ed391d:... ./loki-chunk.bin
$ file loki-chunk.bin
loki-chunk.bin: data

$ xxd loki-chunk.bin | head -5
00000000: 0000 00de ff06 0000 734e 6150 7059 01cc  ........sNaPpY..
00000010: 0000 9e90 7796 7b22 6669 6e67 6572 7072  ....w.{"fingerpr
00000020: 696e 7422 3a31 3633 3137 3235 3738 3039  int":16317257809
sNaPpY is the magic bytes for Snappy compression.
Running strings on it, only the leading metadata is readable.
$ strings loki-chunk.bin | head -3
sNaPpY
{"fingerprint":16317257809230235097,"userID":"fake","from":1788936534.301,"through":1788936537.813,
 "metric":{"__name__":"logs","container_name":"app","job":"app","service_name":"app"},"encoding":129}
The header contains the label set and time range in JSON, and the log body is compressed with Snappy.
Tempo's meta.json Contains replicationFactor: 1
In contrast, Tempo's meta.json can be read as-is.
$ aws s3 cp s3://.../single-tenant/9aebeec7-.../meta.json - | python3 -m json.tool
{
    "format": "vParquet4",
    "blockID": "9aebeec7-e169-4a38-976a-bb8c3e33aff8",
    "tenantID": "single-tenant",
    "startTime": "2026-09-10T06:48:54Z",
    "endTime": "2026-09-10T06:52:27Z",
    "totalObjects": 355,
    "compactionLevel": 2,
    "dedicatedColumns": [
        {"n": "http.request.method"}, {"n": "url.path"}, {"n": "url.route"}
    ],
    "replicationFactor": 1
}
In Tempo 3.0, the design changed so that Kafka handles durability, and the replication mechanism itself was eliminated.
Because Kafka provides durability, Tempo 3.0 operates with a replication factor of 1 (RF1), eliminating the need for ingester replication.
Verification 1: Replacing the Loki Task
First, let me check what happens when tasks are replaced in the same way as a normal deployment.
The important thing here is replacing while there is unflushed data.
Comparing before and after with data that has already been written to S3 wouldn't prove anything since there's no reason for it to disappear.
I replace while traffic is flowing.
About 5 minutes after starting to flow data, here is what was captured with Explore fixed to 10:40:00~10:50:00.
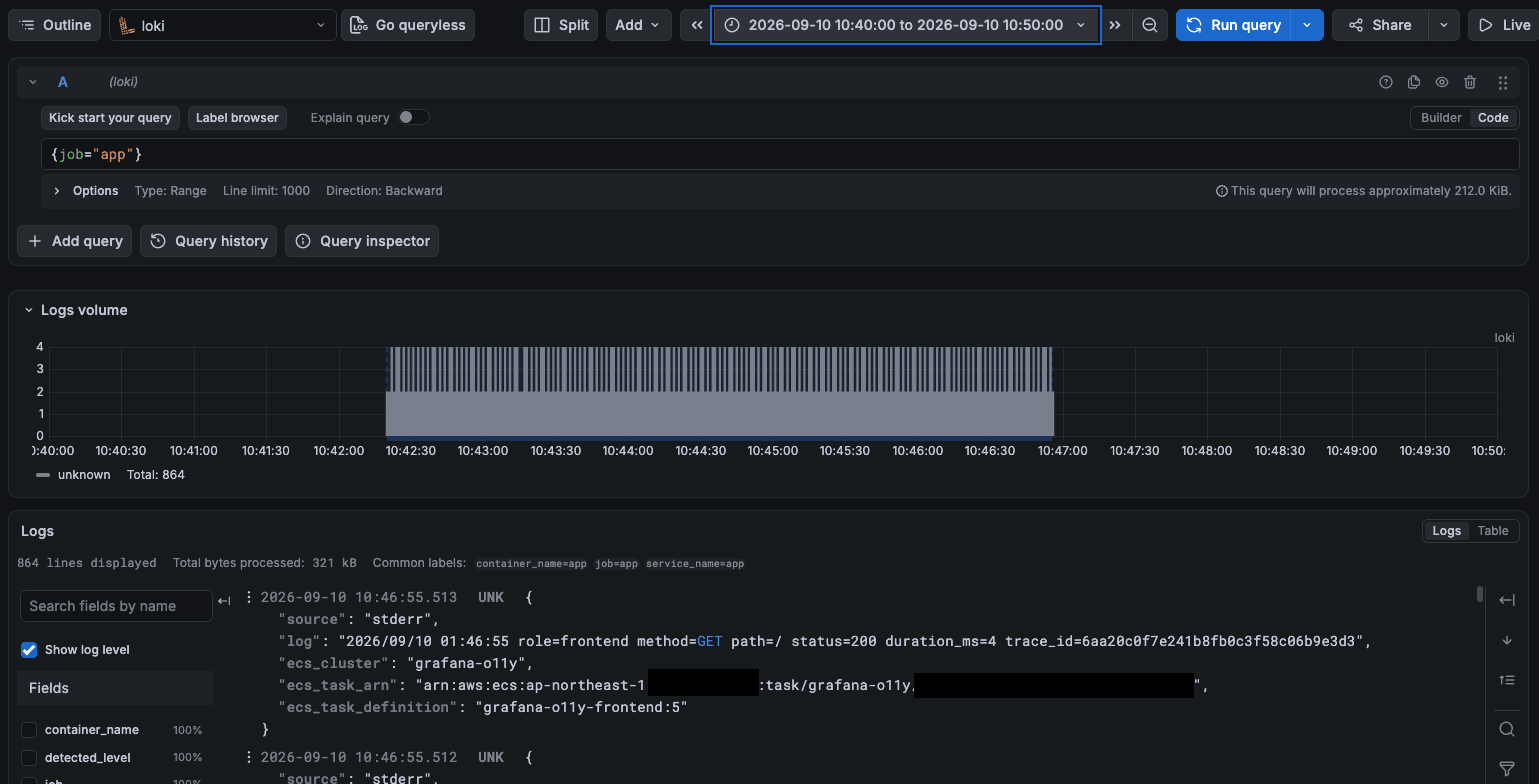
In this state, I apply force-new-deployment.
$ aws ecs update-service --cluster grafana-o11y --service grafana-o11y-loki --force-new-deployment
After the new task came up, here is what was captured again with the same 10:40:00~10:50:00.
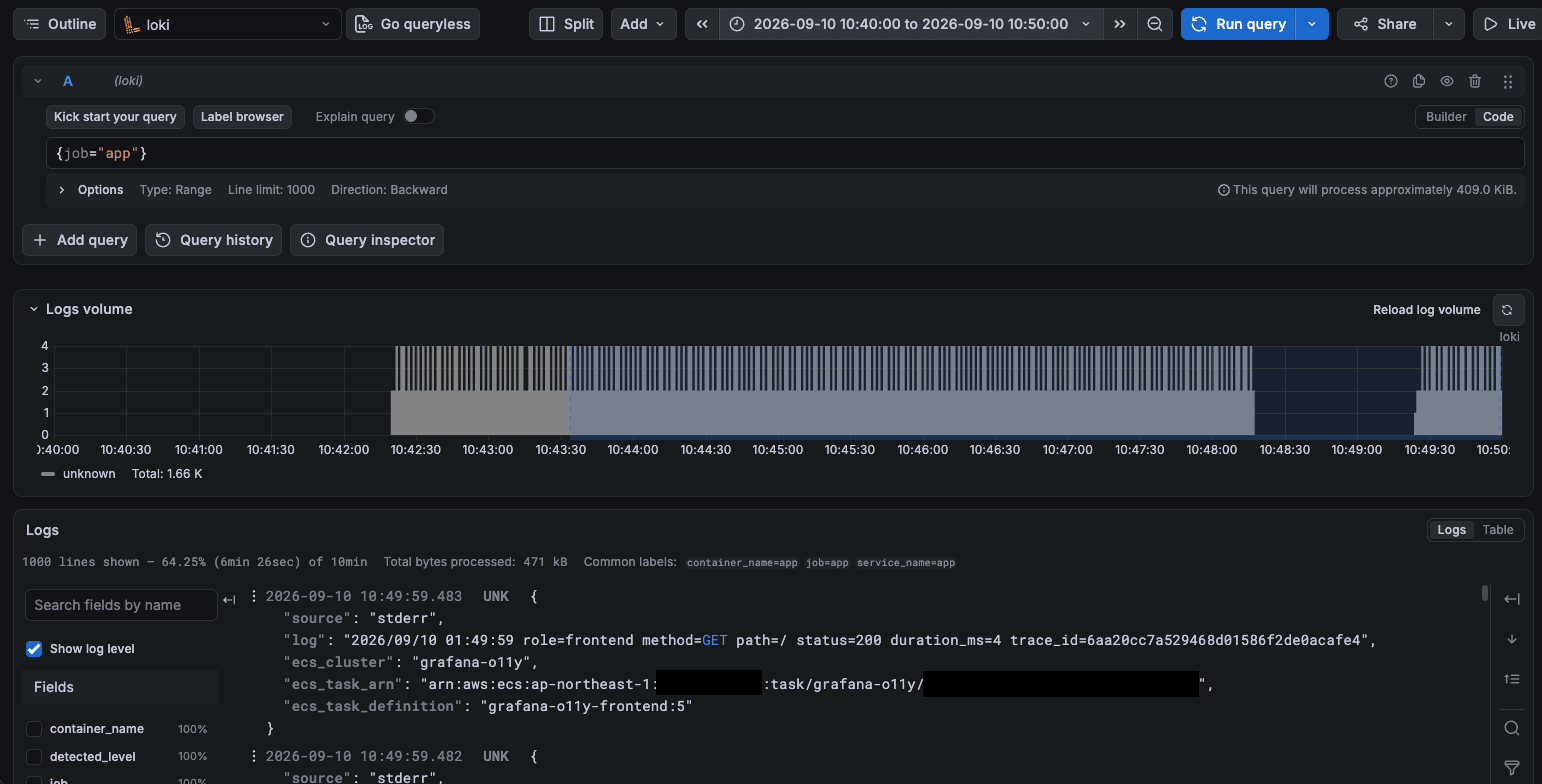
The logs before replacement remain intact, with a gap around 10:48:15~10:49:20.
Counting in 15-second intervals, the results were as follows.
| Time | Line Count |
|---|---|
| 10:48:00 | 46 |
| 10:48:15 | 48 |
| 10:48:30 | 6 |
| 10:48:45~10:49:15 | 0 |
| 10:49:30 | 17 |
| 10:49:45 | 48 |
SIGTERM was sent at 10:48:17.
Since the 10:48:15 bucket containing that moment remains full, not a single log line that Loki had already received was lost.
Looking at Loki's logs, the moment of flushing was recorded.
$ aws logs tail /ecs/grafana-o11y/loki --since 10m | grep -iE 'flush|shutdown'
02:48:17 caller=manager.go:273  msg="stopping user managers"
02:48:17 caller=flush.go:305    msg="flushing stream" user=fake immediate=true
                                total_uncomp="163 kB" forced=1
02:48:17 caller=lifecycler.go   msg="lifecycler entering final sleep before shutdown"
immediate=true / forced=1 is the forced flush from SIGTERM.
One second later, it dropped to S3.
2026-09-10 10:48:18 11941 fake/e2728b8663a305d9/1a088fe03e8:1a089005950:2689ee66
This gap is not "unflushed data was lost."
The gap is the approximately 70 seconds during which Loki was not running, and it represents the data that Fluent Bit could not send during that time.
Since minimum_healthy_percent = 0, old and new tasks don't run simultaneously, which creates this blank period.
The reason data was not lost is because flush_on_shutdown: true is set.
When Loki receives SIGTERM, it writes all in-memory chunks to S3 before exiting.
Verification 2: Forcibly Stopping Tempo
Next, I'll try stopping the Tempo task with stop-task.
$ TASK=$(aws ecs list-tasks --cluster grafana-o11y --service-name grafana-o11y-tempo \
    --query 'taskArns[0]' --output text)
$ aws ecs stop-task --cluster grafana-o11y --task $TASK --reason "verify ephemeral buffer loss"
The stop was at 10:56:02, and the new task came up at 10:58:16, so it was down for about 2 minutes and 14 seconds.
Only 30 Seconds Were Lost
Narrowing the Explore time range to around the gap and clicking the Start time column to sort in ascending order reveals the missing section.
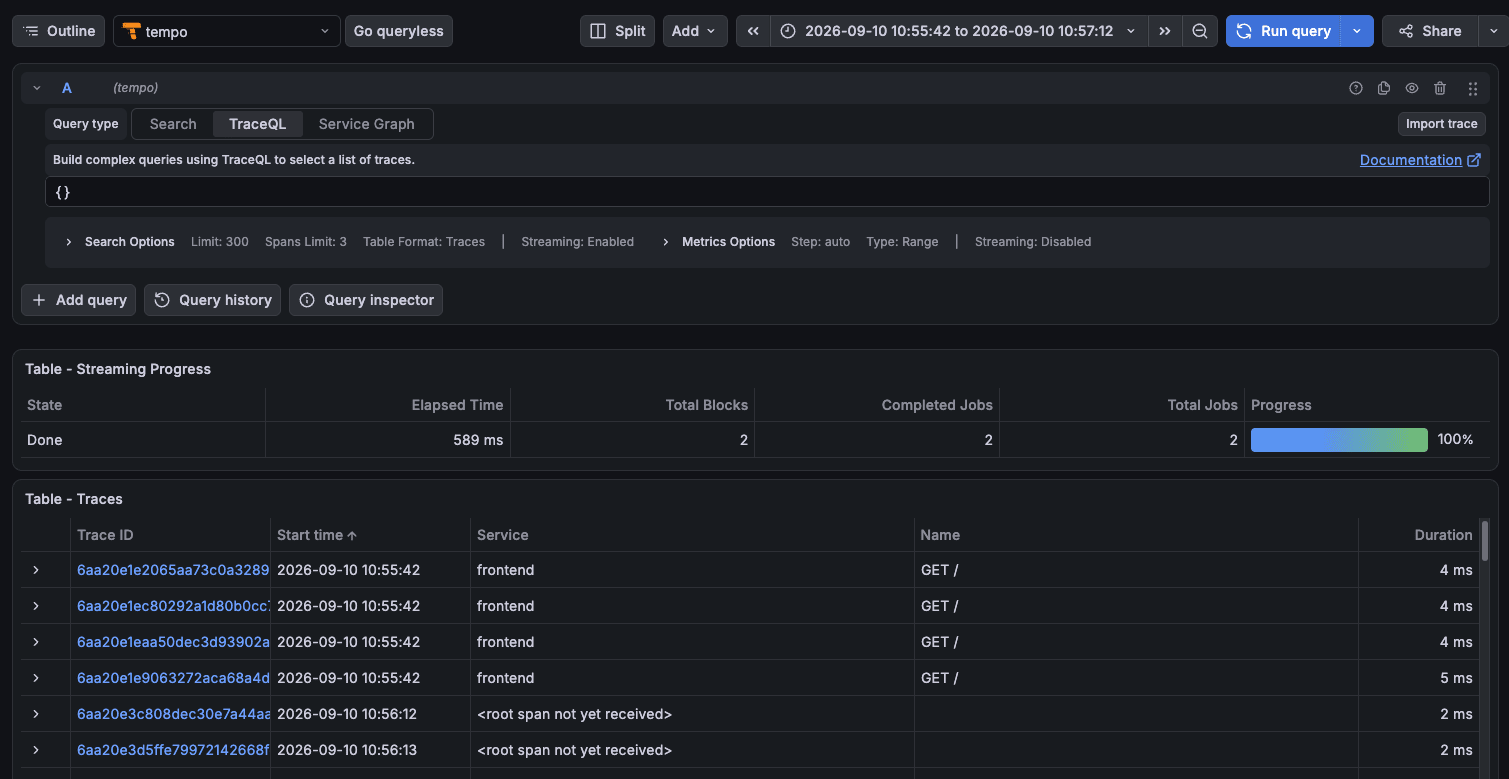
2026-09-10 10:55:42.818   ← last trace before stop
2026-09-10 10:56:12       ← first trace after recovery
The gap was 30 seconds.
This matches the default 30s of live_store.max_block_duration.
In other words, no matter how long data continues to flow, the maximum Tempo can lose is capped at one recent block.
The Same Period Remains in X-Ray
Narrowing the time range to the gap itself (10:55:45~10:57:00), Tempo is empty.
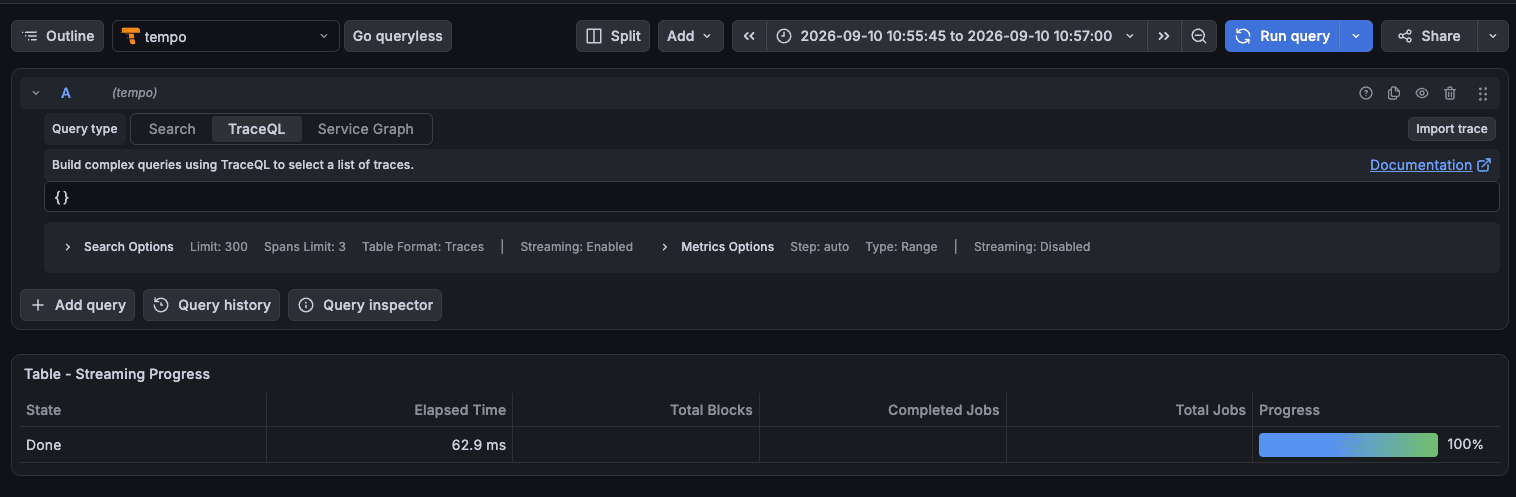
Looking at X-Ray over the exact same range, the result was as follows.
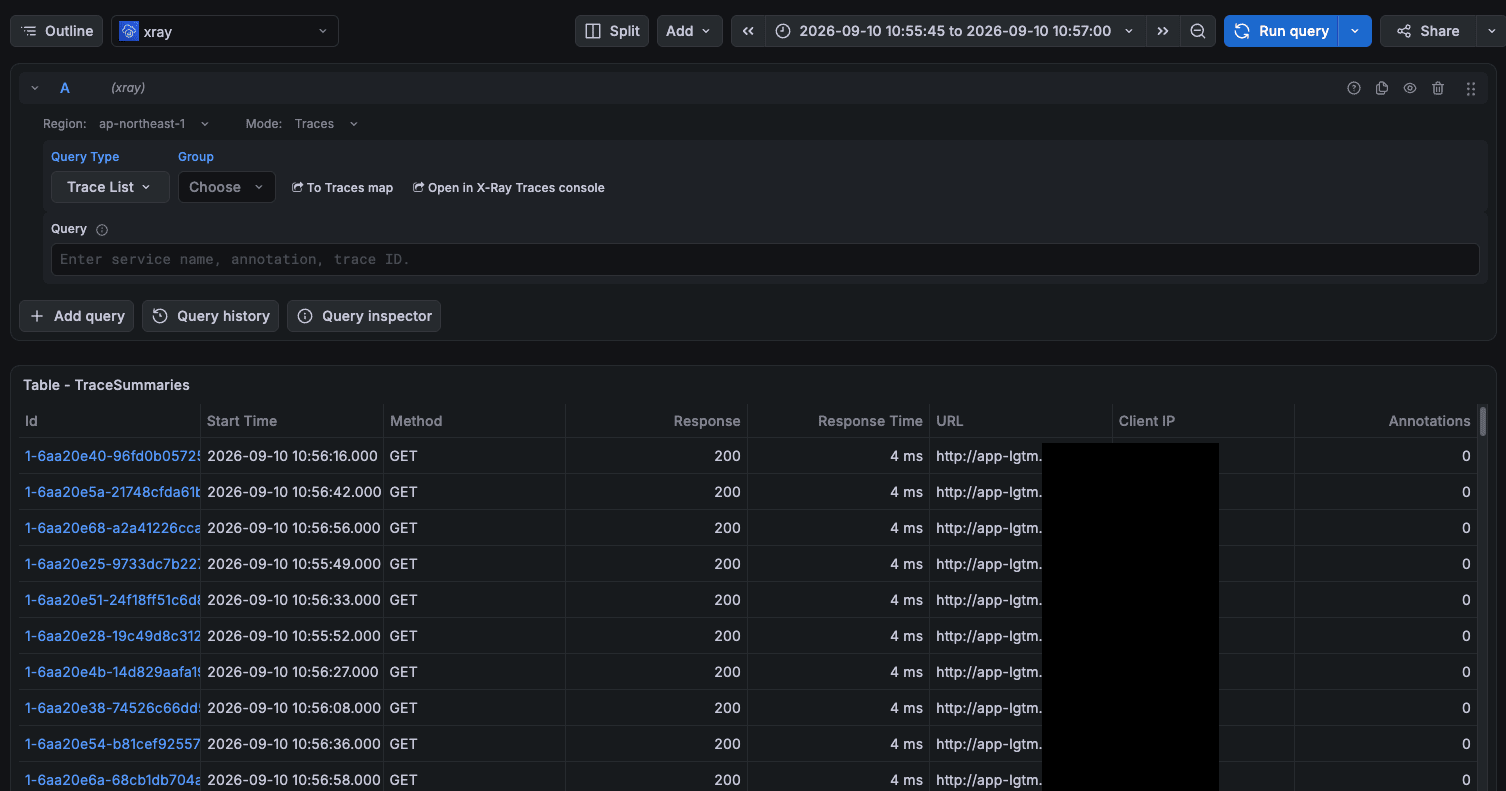
All 242 items remain intact.
The data that was double-sent from ADOT was confirmed to remain as expected.
Traces Are Split Before and After Recovery
This was something I hadn't anticipated, but around the time of recovery, traces with <root span not yet received> appeared intermittently.
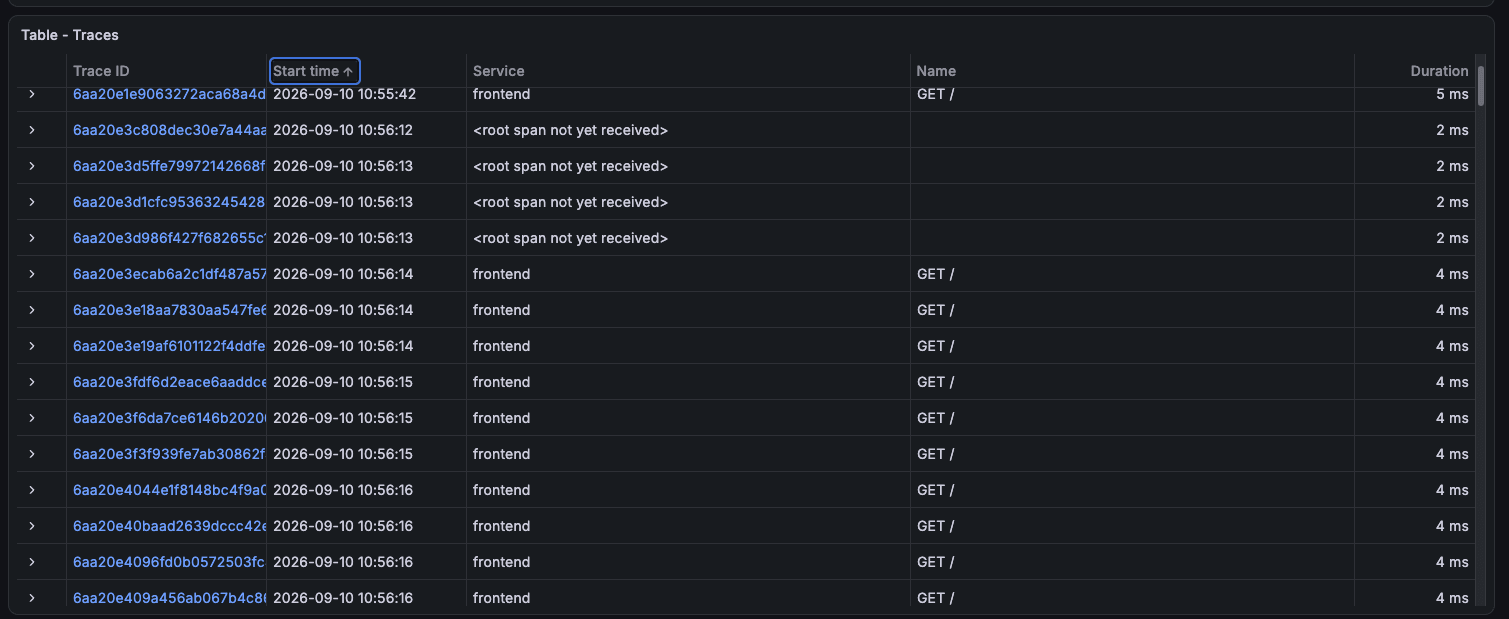
| Period | Count |
|---|---|
| 10:56:12~10:56:13 | 4 |
| 10:56:29~10:56:33 | 16 |
| 10:56:54~10:56:58 | 16 |
These are traces where the backend span arrived but only the frontend root span was lost.
Since the ADOT sidecar for frontend and backend each have separate retry queues, if only one of them drops data, the trace becomes fragmented.
Rather than simply "only 30 seconds of data is lost," traces were also broken in the period around that gap.
AMP Had a 3.5-Minute Gap, But Previous Data Remains
Since metrics-generator is co-located in the same task as Tempo, when Tempo stops, metrics generation also stops.
Let me look at the same query as before verification.
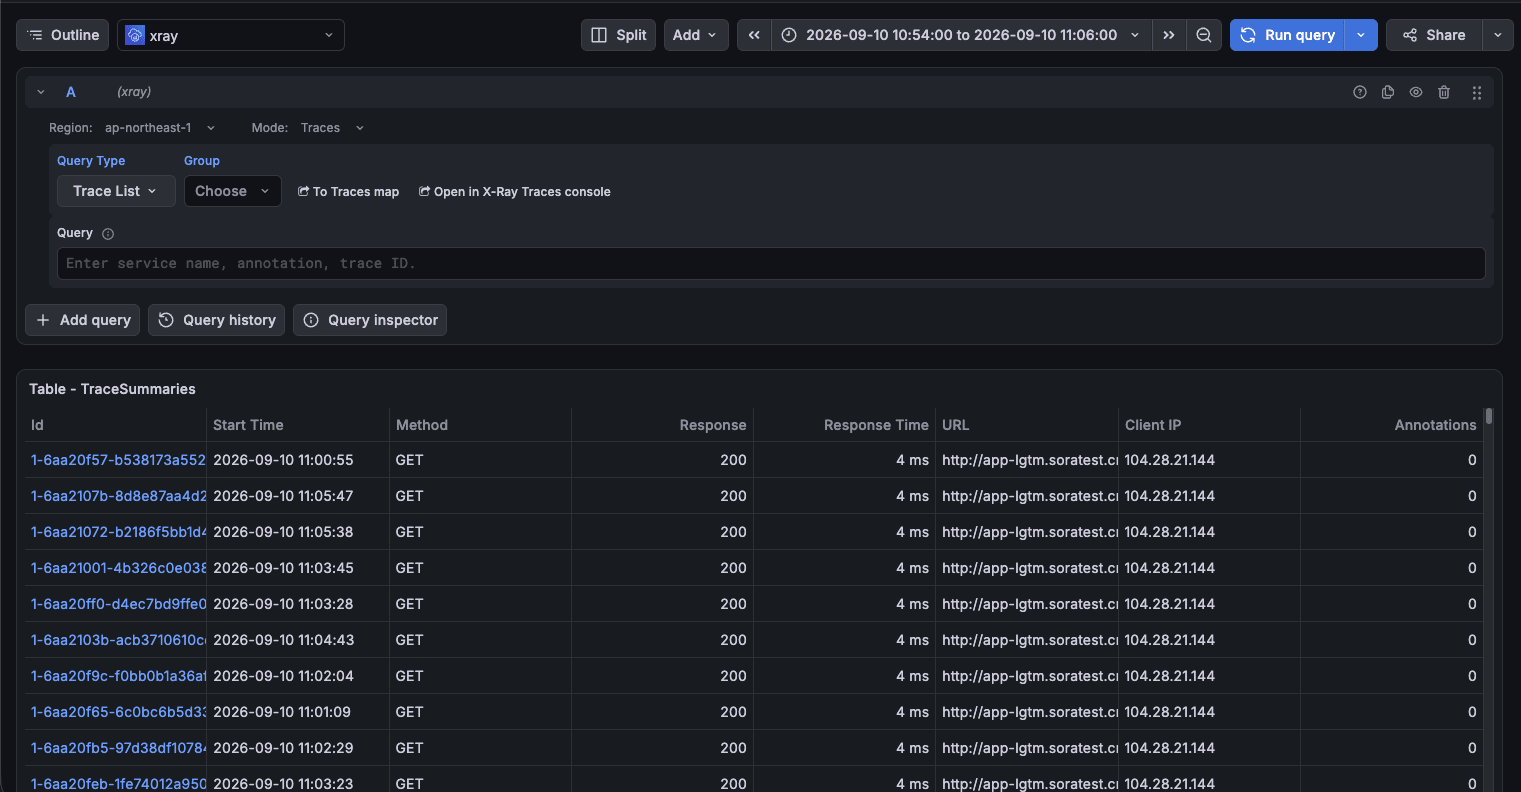
About 3.5 minutes from 10:56:30~11:00:00 was empty.
This is larger than Tempo's gap (30 seconds).
This is due to the mechanism by which metrics-generator sends data to AMP.
Generated metrics are first written to a file (WAL) within the task, and then sent sequentially to AMP.
Since this file is in the task's storage, it is lost when the task is replaced, and it starts over from an empty state on startup.
The recovery is later than for traces because sending doesn't start until the preparation is complete.
Incidentally, this method of "sending metrics to a Prometheus-compatible destination" is called remote write.
Since AMP is Prometheus-compatible, it can receive data in this form.
However, the values from before this point remain in AMP.
What we're looking at here are values in the form called RED metrics (Rate / Errors / Duration),
which aggregate "how many times per second was it called," "how many of those were errors," and "how long did it take."
Even if individual traces are lost, the trend of how many times it was called and how many errors occurred at what time remains.
Verification 3: Forcibly Stopping Loki Without Flushing
Finally, I'll try stopping Loki after returning max_chunk_age to the default 2 hours.
loki_chunk_idle_period = "3m"    # default is 30m
loki_max_chunk_age     = "2h"    # returning to default
There's one problem here.
Since stop-task sends SIGTERM, leaving flush_on_shutdown: true would cause a clean flush just like in Verification 1, so no gap would appear.
Therefore, I set flush_on_shutdown to false to reproduce the state where the task falls without flushing in time.
ingester:
  wal:
    enabled: true
    dir: /loki/wal
    flush_on_shutdown: false   # drop without flushing
About 2.5 minutes after starting to flow traffic, here is what was captured from 11:26:00~11:38:00.
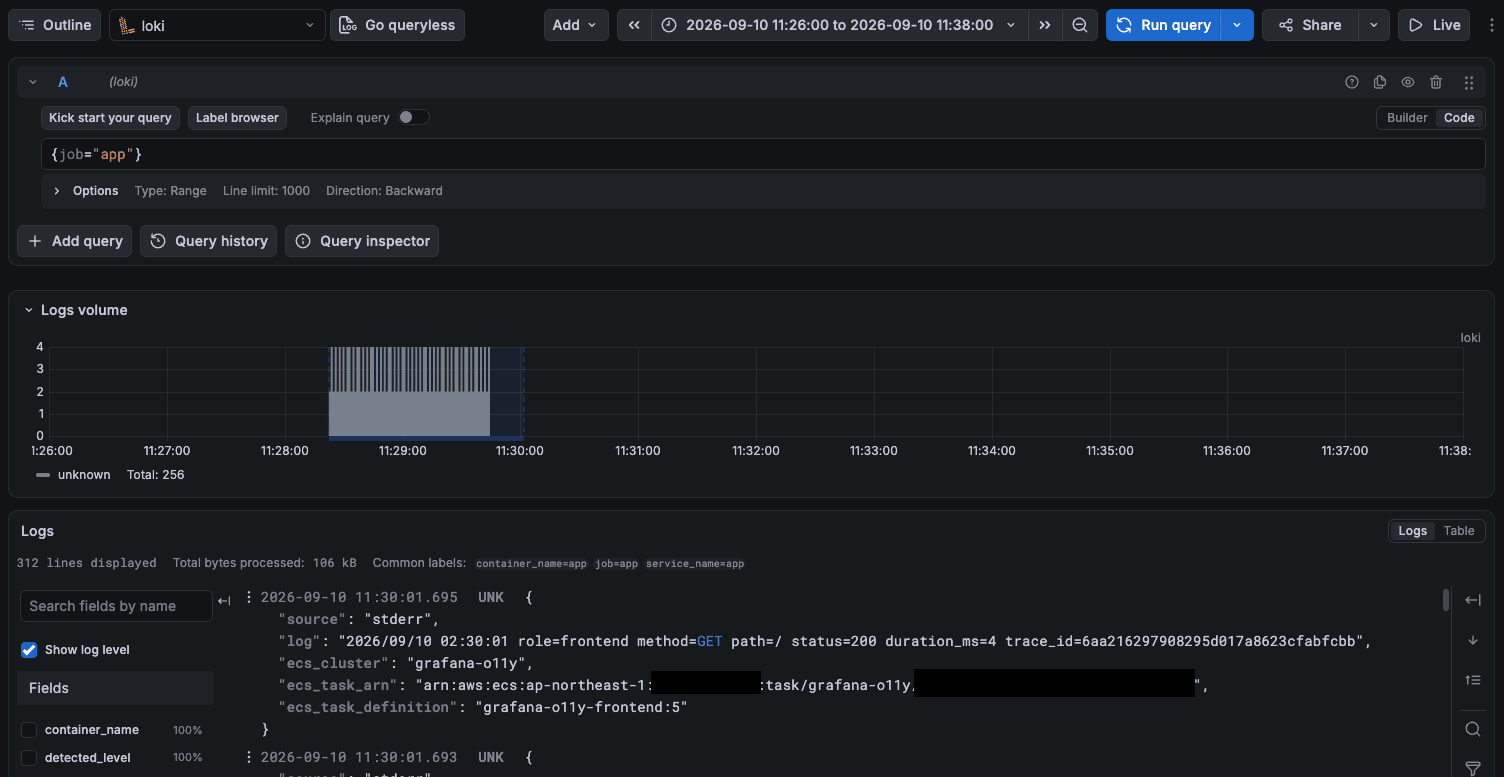
At this point, no chunks have been added to S3.
With max_chunk_age at 2 hours and traffic continuously flowing so it doesn't become idle either, all the logs Loki holds are in memory.
$ aws s3 ls s3://grafana-o11y-loki-<account-id>/ --recursive | tail -2
2026-09-10 11:09:16  14287  fake/e2728b8663a305d9/1a08910812c:...
2026-09-10 11:19:21    440  index/index_20706/...compactor...
I ran stop-task in this state.
After the new task came up, here is what was captured again with the same 11:26:00~11:38:00.
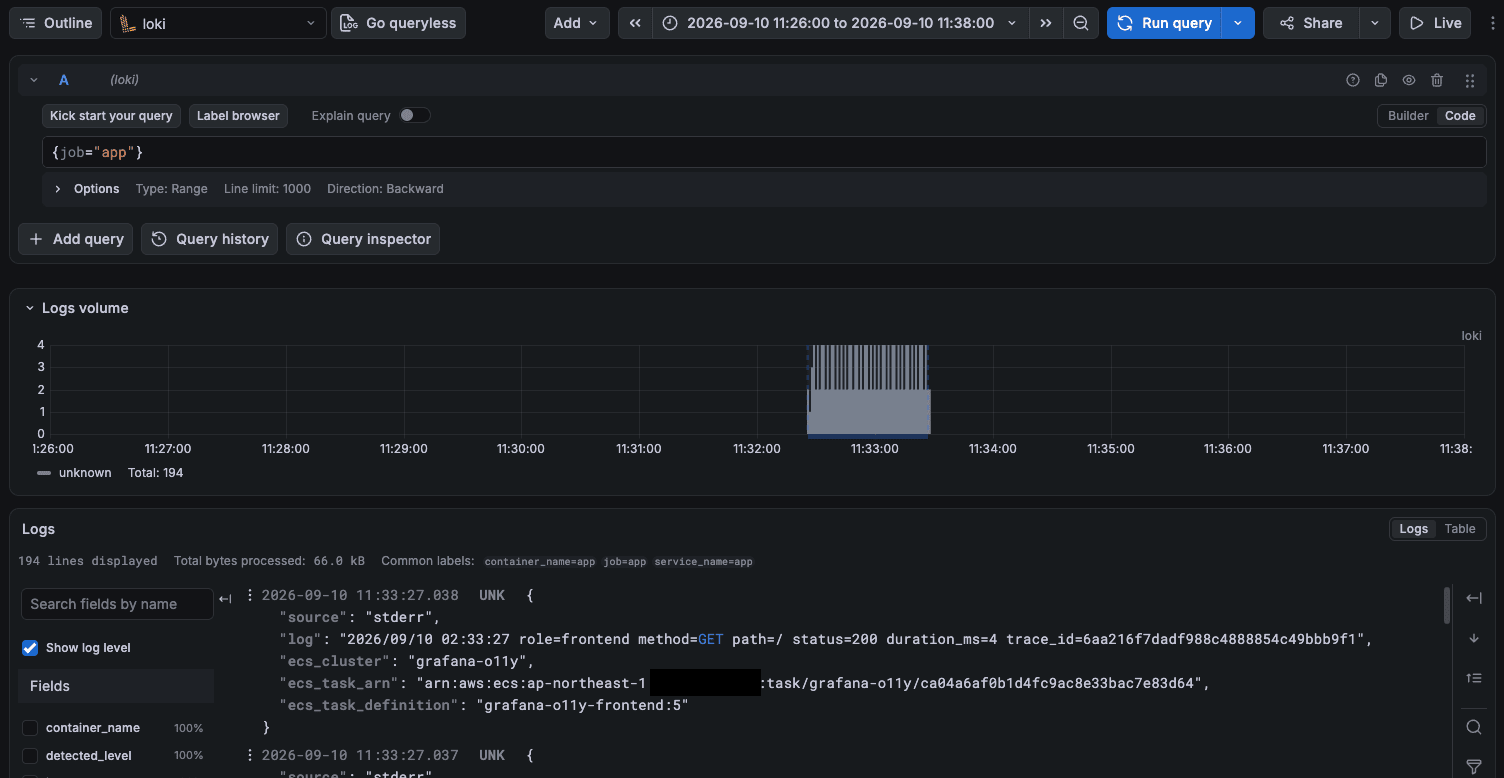
About 4 minutes from 11:28:22~11:32:20 were completely lost.
| Time | Line Count |
|---|---|
| 11:26:00~11:32:00 | all 0 |
| 11:32:30 | 12 |
| 11:33:00 | 96 |
Looking at S3, not a single chunk was added before or after the stop.
The difference in logs is clear.
# Verification 1 (flush_on_shutdown: true)
02:48:17 msg="stopping user managers"
02:48:17 msg="flushing stream" immediate=true forced=1 total_uncomp="163 kB"
02:48:17 msg="lifecycler entering final sleep before shutdown"

# Verification 3 (flush_on_shutdown: false)
02:31:04 msg="stopping user managers"
02:31:04 msg="lifecycler entering final sleep before shutdown"      ← no flush
Supplementary Notes: Regarding Redundancy
This time both ran as a single task, but let me also look at whether data loss can be reduced by adding redundancy.
Loki has a configuration called "HA monolithic" where multiple instances are clustered with memberlist, replication_factor is set to 3, and they share object storage.
For high availability in monolithic mode, you can configure high availability by running two Loki instances using memberlist_config configuration and a shared object store and setting the replication_factor to 3.
Simple scalable deployment (SSD) is scheduled to be removed in version 4.0, and HA monolithic is also mentioned as the migration destination.
Simple Scalable Deployment (SSD) mode is being deprecated and will be removed with the Loki 4.0 release.
On the other hand, Tempo's scalable monolithic (SSB), which existed in 2.x, was removed in 3.0, leaving just monolithic and microservices.
The scalable-single-binary target is no longer available in Tempo 3.0.
Since microservices requires Kafka as a prerequisite, building on AWS would require separately preparing something like MSK.
Closing
This time, I placed Loki / Tempo on ECS Fargate and confirmed the "accumulate then write to S3" behavior and how much data is lost when a task goes down.
I hope this article proves helpful to someone.
I hope this article proves helpful to someone.