
Amazon GuardDuty has been set up to publish usage metrics to Amazon CloudWatch
This page has been translated by machine translation. View original
Hello. I'm Omori from Tech Support.
My daughter has recently become addicted to Pokemon GO.
As a result, my phone's battery drains quickly.
Introduction
Metrics to check usage in GuardDuty have become available.*1
I just wasn't aware of it, but it seems this was released in November 2025.*2
Until now, I believe usage could only be understood through Cost and Usage Reports or Cost Explorer, but now we can see how much analysis was performed by GuardDuty during a specified period.
Usage Metrics
The metrics available for checking usage are as follows:
| Protection Plan | Data Source | Metric Name | Unit | Description |
|---|---|---|---|---|
| Basic Threat Detection | CloudTrailEvents | AnalyzedCount | Count | Number of CloudTrail management events analyzed |
| Basic Threat Detection | VPCFlowLogDNSLogEvents | AnalyzedBytes | Bytes | Amount of VPC flow logs and DNS logs analyzed |
| EKS Protection | KubernetesAuditLogs | AnalyzedCount | Count | Number of Amazon EKS audit log events analyzed |
| S3 Protection | S3DataEvents | AnalyzedCount | Count | Number of S3 data events analyzed |
| Runtime Monitoring | RuntimeMonitoringEC2 | MonitoredVcpuHours | Count (vCPU-hours) | EC2 vCPU hours monitored by Runtime Monitoring |
| Runtime Monitoring | RuntimeMonitoringEKS | MonitoredVcpuHours | Count (vCPU-hours) | Amazon EKS vCPU hours monitored by Runtime Monitoring |
| Runtime Monitoring | RuntimeMonitoringFargate | MonitoredVcpuHours | Count (vCPU-hours) | Fargate vCPU hours monitored by Runtime Monitoring |
| Malware Protection for EC2 | OnDemandEBSSnapshot | ScannedBytes | Bytes | Amount of on-demand EBS snapshot data scanned |
| Malware Protection for EC2 | OnDemandEBSVolume | ScannedBytes | Bytes | Amount of on-demand EBS volume data scanned |
| Malware Protection for EC2 | MalwareProtectionEBS | ScannedBytes | Bytes | Amount of EBS data scanned by Malware Protection |
| RDS Protection | RDS | MonitoredAcuHours | Count (ACU hours) | Amazon RDS Aurora capacity units being monitored |
| RDS Protection | RDSLimitless | MonitoredAcuHours | Count (ACU hours) | Amazon RDS Aurora Limitless ACU monitoring hours |
| RDS Protection | AuroraScaleout | MonitoredAcuHours | Count (ACU hours) | Aurora scaleout ACU hours being monitored |
| RDS Protection | RDS | MonitoredVcpuHours | Count (vCPU-hours) | Amazon RDS vCPU monitoring hours |
| Lambda Protection | LambdaNetworkLogs | AnalyzedBytes | Bytes | Amount of Lambda network logs analyzed |
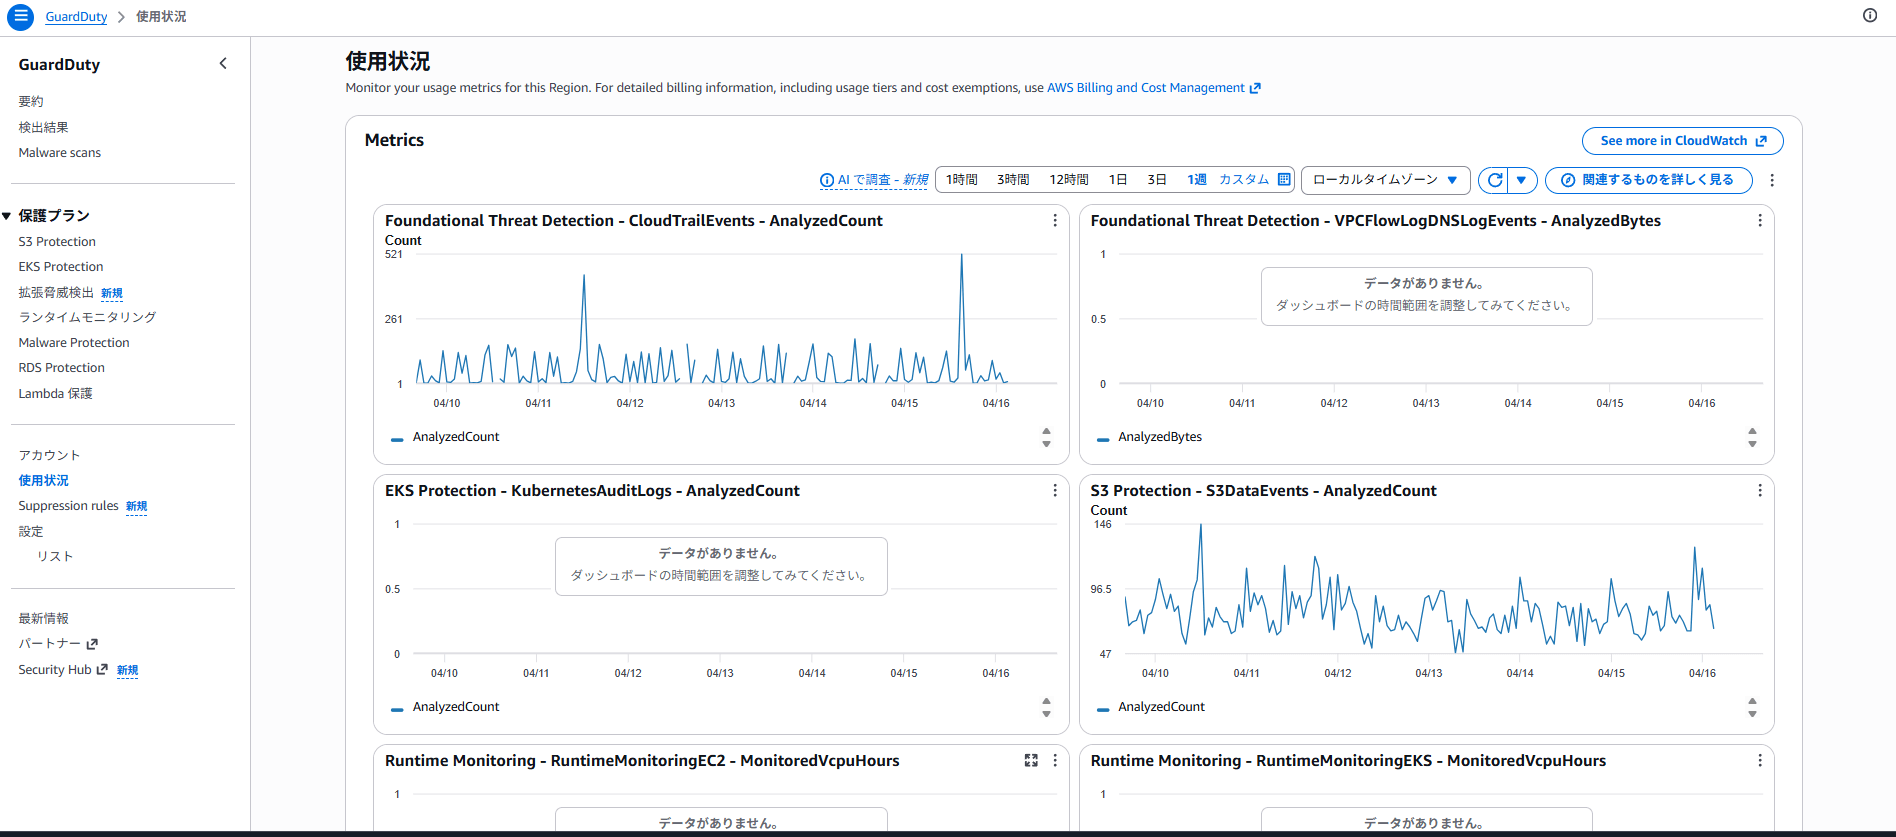
These metrics can be viewed on a single screen in the "Usage" section of the GuardDuty console's navigation pane.
S3 Malware Protection Usage Metrics
These don't appear to be displayed in the GuardDuty console, so they need to be checked in the CloudWatch console.
| Metric Name | Unit | Description |
|---|---|---|
| CompletedScanCount | Count | Number of S3 object malware scans completed in a specific time frame. |
| FailedScanCount | Count | Number of S3 object malware scans that failed in a specific time frame. |
| SkippedScanCount | Count | Number of S3 object malware scans skipped in a specific time frame. |
| InfectedScanCount | Count | Number of S3 object malware scans that detected potentially malicious objects in a specific time frame. |
| CompletedScanBytes | Count | Number of S3 object bytes scanned in a specific time frame. |
Checking the Number of CloudTrail Management Events Analyzed During a Specific Period
Based on the blog "How to Display Total Data Volume for a Specified Period in CloudWatch Dashboard and Introduction to Display Method Using Metric Math", I tried to get the total metrics for the target period.
In my test environment, the number of CloudTrail management events analyzed in March 2026 was 35,657.
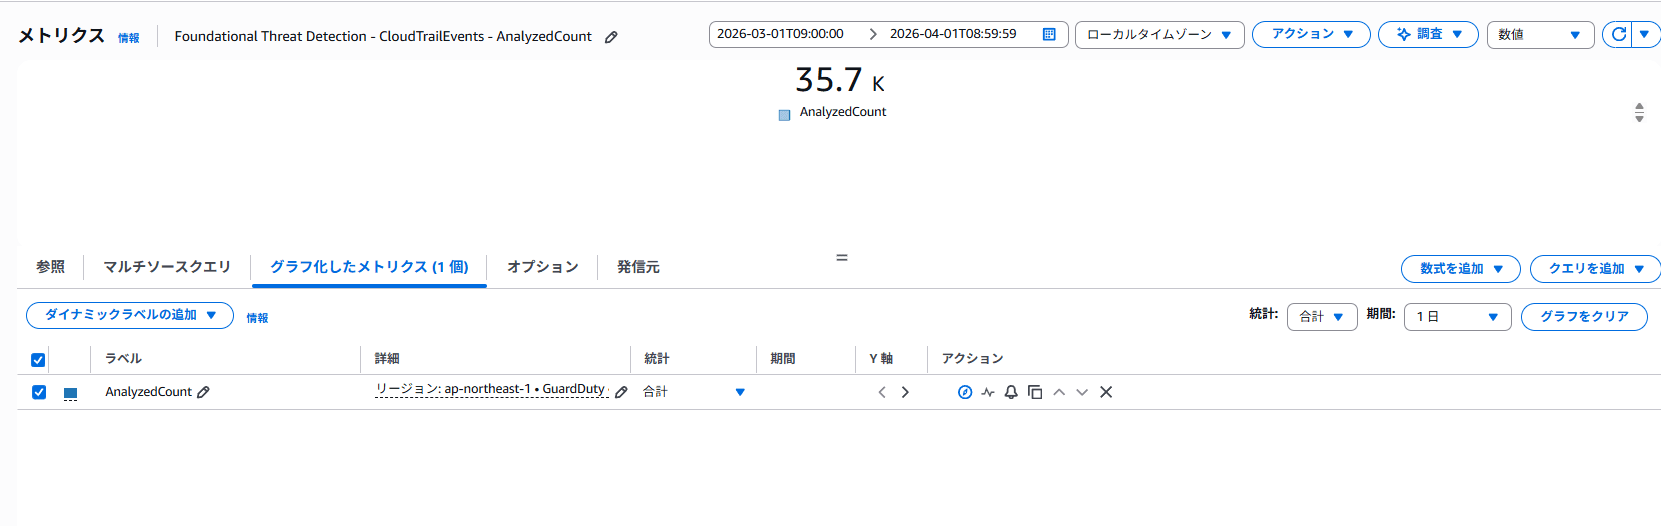
*While the capture shows "35.7 K", I confirmed the exact value of 35,657 for AnalyzedCount by obtaining a CSV file through the action button in the top right of the console.
■Metric specification conditions
-
Specified target period (2026/03/01 09:00:00–2026/04/01 08:59:59)
*The target period is set considering that monthly usage is aggregated in UTC time.
It's more efficient to specify the target period in UTC time from the beginning. -
Selected "Sum" as the statistic in the Graphed Metrics tab
-
Selected "The time range value shows the value from the entire time range" in the widget type "Number" in the Options tab
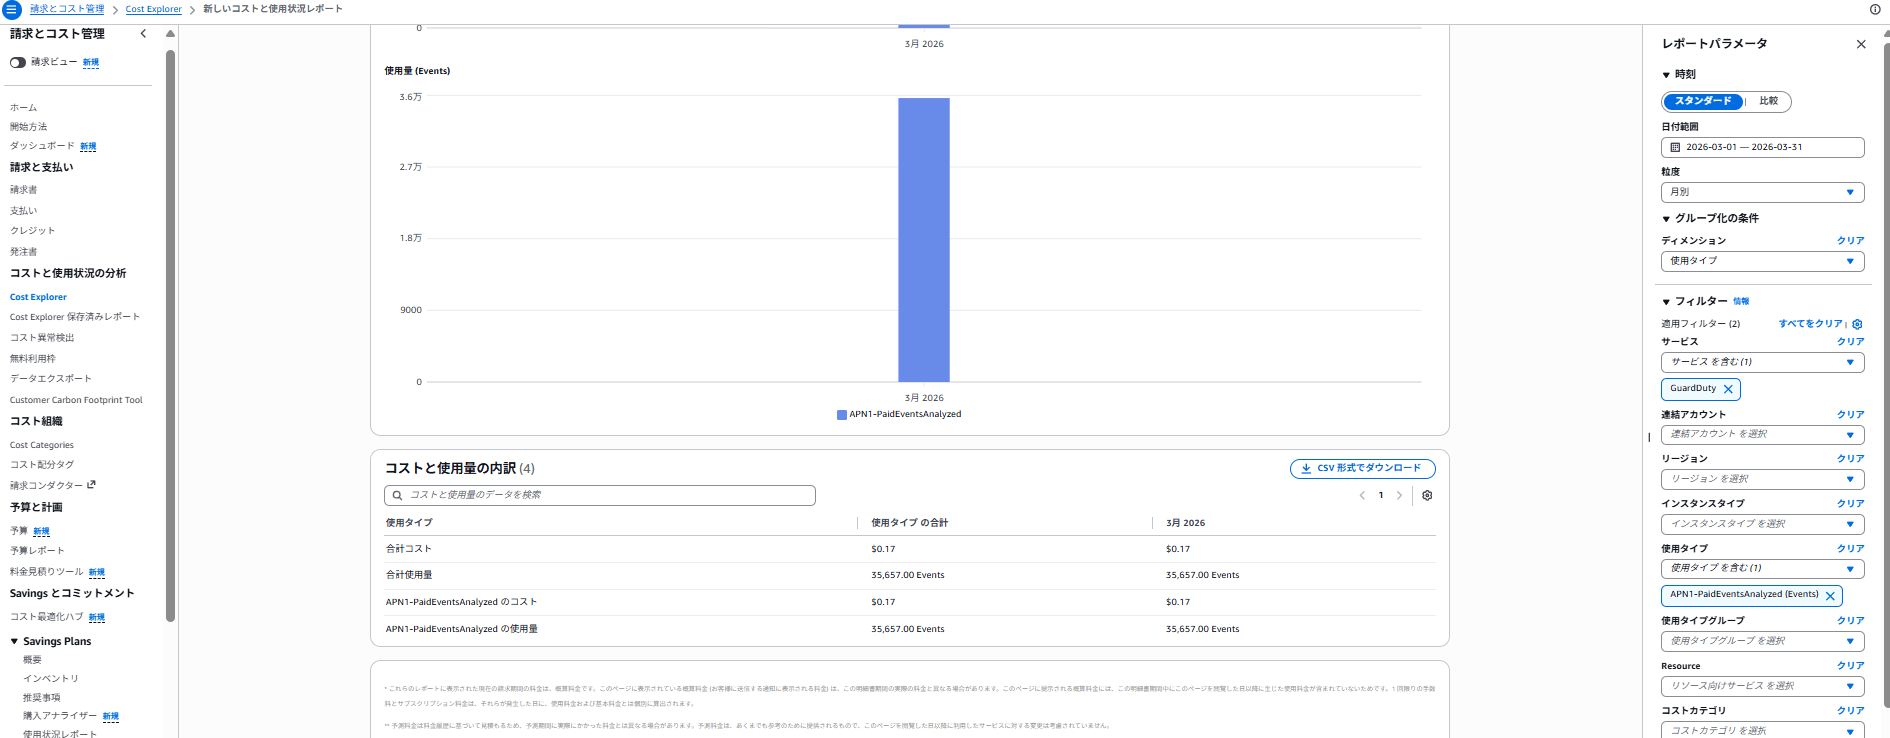
This matches the usage amount "35,657.00 Events" for usage type "APN1-PaidEventsAnalyzed (Events)" in Cost Explorer.
What's Now Possible with Published Metrics
-
As metrics are published within 24 hours, you can understand usage over time before it's reflected in Cost Explorer
*According to the official Cost Explorer documentation, data up to the previous day is reflected -
You can set alarms for GuardDuty usage metrics
-
You can calculate costs based on aggregated usage using the pricing documentation
Conclusion
With the publication of usage metrics, it's now possible to track actual usage over time.
You can also calculate costs before they're reflected in Cost Explorer.
I hope this information is helpful to someone.
References
1.Monitoring GuardDuty Usage and Estimating Costs
2.Amazon GuardDuty Document History
About Classmethod Operations, Inc.
We are an operations company within the Classmethod Group.
We are a team of experts specializing in operations, maintenance development, support, information systems, and back-office functions, providing everything from business outsourcing to problem solving and high-value-added services through mechanisms that fully utilize IT and AI.
We are recruiting members for various positions.
If you are interested in our culture, mechanisms, and work styles that jointly realize "Operation Excellence" and "Work and live in your own way," please visit the Classmethod Operations, Inc. Recruitment Site.
*Changed company name from Annotation Inc. in January 2026
