
Testing a Configuration for Centralized CloudWatch Alarm Management in a Multi-Account Environment
This page has been translated by machine translation. View original
Hello! I'm Yoshida from the Cloud Business Division.
When operating AWS in a multi-account environment, monitoring configurations tend to be scattered across different accounts. Creating CloudWatch Alarms and SNS for each account requires significant effort. As the number of resources and accounts increases, management becomes more complicated and the risk of missing monitoring points increases.
To solve this issue, we can consolidate metrics using Cross-Account Observability. Furthermore, by setting up CloudWatch Alarms with Multi Time Series Metrics Insights queries (Metrics Insights queries using GROUP BY and ORDER BY), we can identify which resource in which account caused the alarm to trigger.
In this article, I verified a configuration that centralizes CloudWatch Alarm management in a monitoring account, formats subjects and notifications, and routes notifications to appropriate destinations based on the account.
About Cross-Account Observability
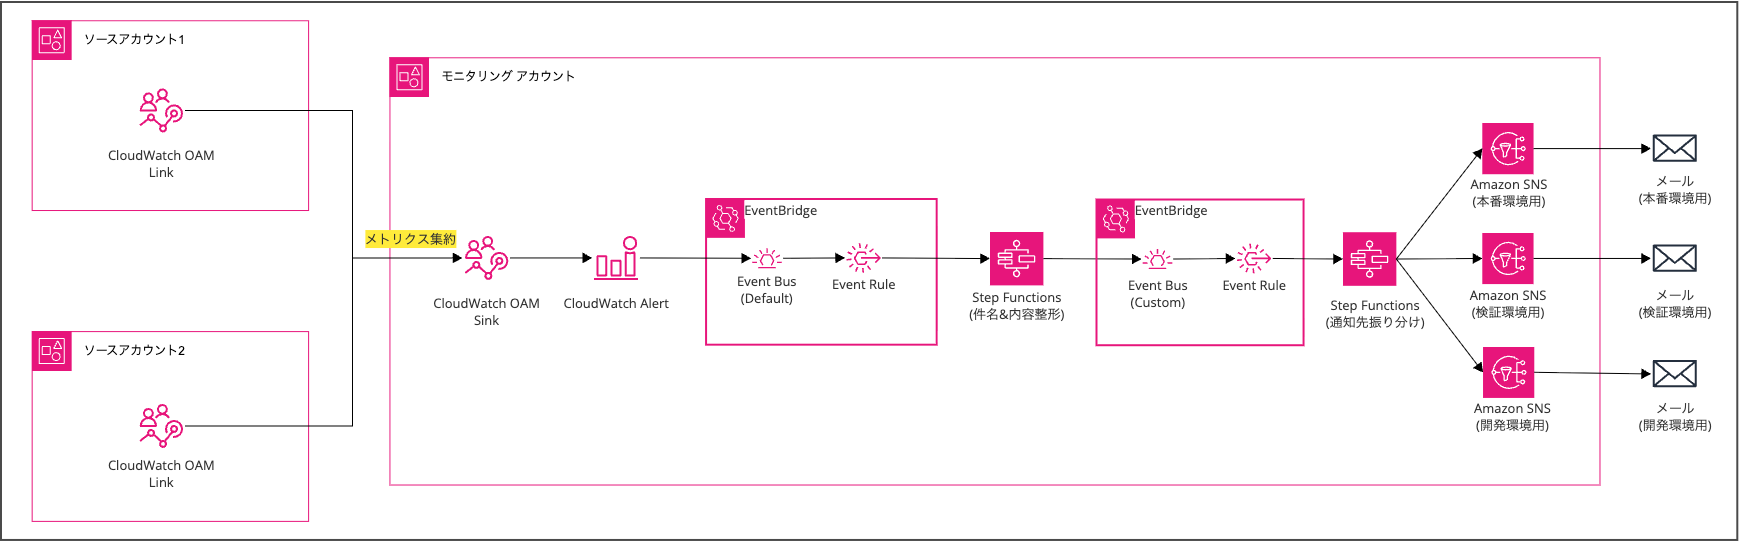
Cross-Account Observability is a feature that aggregates monitoring data from multiple accounts using CloudWatch Observability Access Manager (OAM). By creating a Sink in the monitoring account and Links from source accounts, you can consolidate metrics, logs, and X-Ray traces.
This feature allows you to centrally access metrics from all source accounts from the CloudWatch console in the monitoring account.
For more information on Cross-Account Observability, refer to this article:
About Multi Time Series Metrics Insights Queries
Metrics Insights is a feature that allows you to analyze CloudWatch metrics using SQL-like queries. A new feature added in September 2025 enables creating alarms using Multi Time Series Metrics Insights queries with GROUP BY and ORDER BY clauses.*1
In Multi Time Series alarms, dimensions specified in the GROUP BY clause are treated as individual "Contributors" and evaluated independently.
When an alarm triggers, in addition to the CloudWatch Alarm State Change event, a CloudWatch Alarm Contributor State Change event is generated. This event contains an attribute called alarmContributor.attributes, which includes the values of the dimensions specified in the GROUP BY clause. By specifying GROUP BY AWS.AccountId, ${resource identifier (e.g., InstanceId)}, you can retrieve the source account and resource identifier (such as instance ID).
This information is used for formatting alarms and routing notifications.
Overall Monitoring Architecture
In this verification, I built two monitoring patterns:
| Pattern | Overview | Suitable Cases |
|---|---|---|
| Pattern A | Monitor all accounts with a single alarm | When the same threshold works for all accounts |
| Pattern B | Create alarms for each account | When different thresholds are needed per account |
Both patterns share the same processing flow from alarm triggering to notification:
- CloudWatch Alarm transitions to alarm state
- EventBridge rule (default bus) detects the CloudWatch Alarm Contributor State Change event
- Step Functions (formatting process) extracts information from the event and generates a notification message
- Formatted event is forwarded to a custom event bus
- EventBridge rule (custom bus) detects the formatted event
- Step Functions (routing process) determines the notification destination based on the account ID
- SNS sends an email
Pattern A: Consolidated Monitoring for All Accounts
Pattern A monitors resources across all source accounts with a single alarm.
It's suitable when a common threshold can be applied to all accounts.
By using GROUP BY AWS.AccountId, ${resource identifier} in the Metrics Insights query, a Contributor is created for each account and resource combination. When an alarm is triggered, a CloudWatch Alarm Contributor State Change event occurs, and the account ID is included in alarmContributor.attributes, allowing Step Functions to route the notification.
The benefit of this configuration is that there are fewer alarms to manage.
When adding a new account, there's no need to create new alarms.
Pattern B: Account-Specific Monitoring
Pattern B creates alarms for each source account.
The Metrics Insights query uses WHERE AWS.AccountId = 'xxx' GROUP BY ${resource identifier} to target only a specific account. Since alarms are created for each account, thresholds can be set individually.
For example, you can set alerts at 80% CPU utilization for production accounts and 90% for development accounts.
In Pattern B, the alarmContributor.attributes in CloudWatch Alarm Contributor State Change events doesn't include the account ID (since account ID isn't specified in GROUP BY).
Instead, we embed the account ID in the alarm name using a naming convention and extract it in Step Functions.
Building Pattern A
From here, I'll describe the steps to build each pattern.
I'll introduce the method using AWS CLI, providing JSON settings and commands for each step.
I recommend running these commands in CloudShell.
Build Order and Verification Method
Resources are created in reverse order of the processing flow because target resources need to be prepared in advance for referencing during rule and state machine configuration.
In this article, we'll use custom metrics (in the Test/EC2 namespace) for testing. This allows us to verify alarm operation without provisioning actual EC2 instances, by publishing metrics via AWS CLI.
To verify operation, run the following command:
aws cloudwatch put-metric-data \
  --namespace "Test/EC2" \
  --metric-name "CPUUtilization" \
  --value 95 \
  --unit Percent \
  --dimensions InstanceId=i-test00001
Setting up Cross-Account Observability
First, set up the OAM Sink/Link as the foundation for metric aggregation. For detailed setup instructions, refer to this blog:
When setting the Sink policy by OU unit, be cautious. To include child OUs with the aws:PrincipalOrgPaths condition, you need to use StringLike with a wildcard at the end. If you specify only the parent OU path with StringEquals, you'll get an error when creating a Link from an account belonging to a child OU.
{
    "Version": "2012-10-17",
    "Statement": [
        {
            "Effect": "Allow",
            "Principal": "*",
            "Action": ["oam:CreateLink", "oam:UpdateLink"],
            "Resource": "*",
            "Condition": {
                "ForAllValues:StringEquals": {
                    "oam:ResourceTypes": "AWS::CloudWatch::Metric"
                },
                "ForAnyValue:StringLike": {
                    "aws:PrincipalOrgPaths": "o-xxxxxxxxxx/r-xxxx/ou-xxxx-xxxxxxxx/*"
                }
            }
        }
    ]
}
Creating SNS Topics
Create SNS topics for routing destinations. For verification, I prepared three topics: default, production account, and development account.
# Create topics
aws sns create-topic --name test-sns-default-alarm-notification
aws sns create-topic --name test-sns-production-alarm-notification
aws sns create-topic --name test-sns-development-alarm-notification

# Add subscriptions (change email addresses as appropriate)
aws sns subscribe \
  --topic-arn "arn:aws:sns:ap-northeast-1:<monitoring-account-ID>:test-sns-default-alarm-notification" \
  --protocol email \
  --notification-endpoint "your-email@example.com"

aws sns subscribe \
  --topic-arn "arn:aws:sns:ap-northeast-1:<monitoring-account-ID>:test-sns-production-alarm-notification" \
  --protocol email \
  --notification-endpoint "your-email@example.com"

aws sns subscribe \
  --topic-arn "arn:aws:sns:ap-northeast-1:<monitoring-account-ID>:test-sns-development-alarm-notification" \
  --protocol email \
  --notification-endpoint "your-email@example.com"
For this verification, I used aliases for development and production notification destinations.
For example, your-email+production@example.com for production and your-email+development@example.com for development.
After adding a subscription, you'll receive a confirmation email - click the link to confirm.
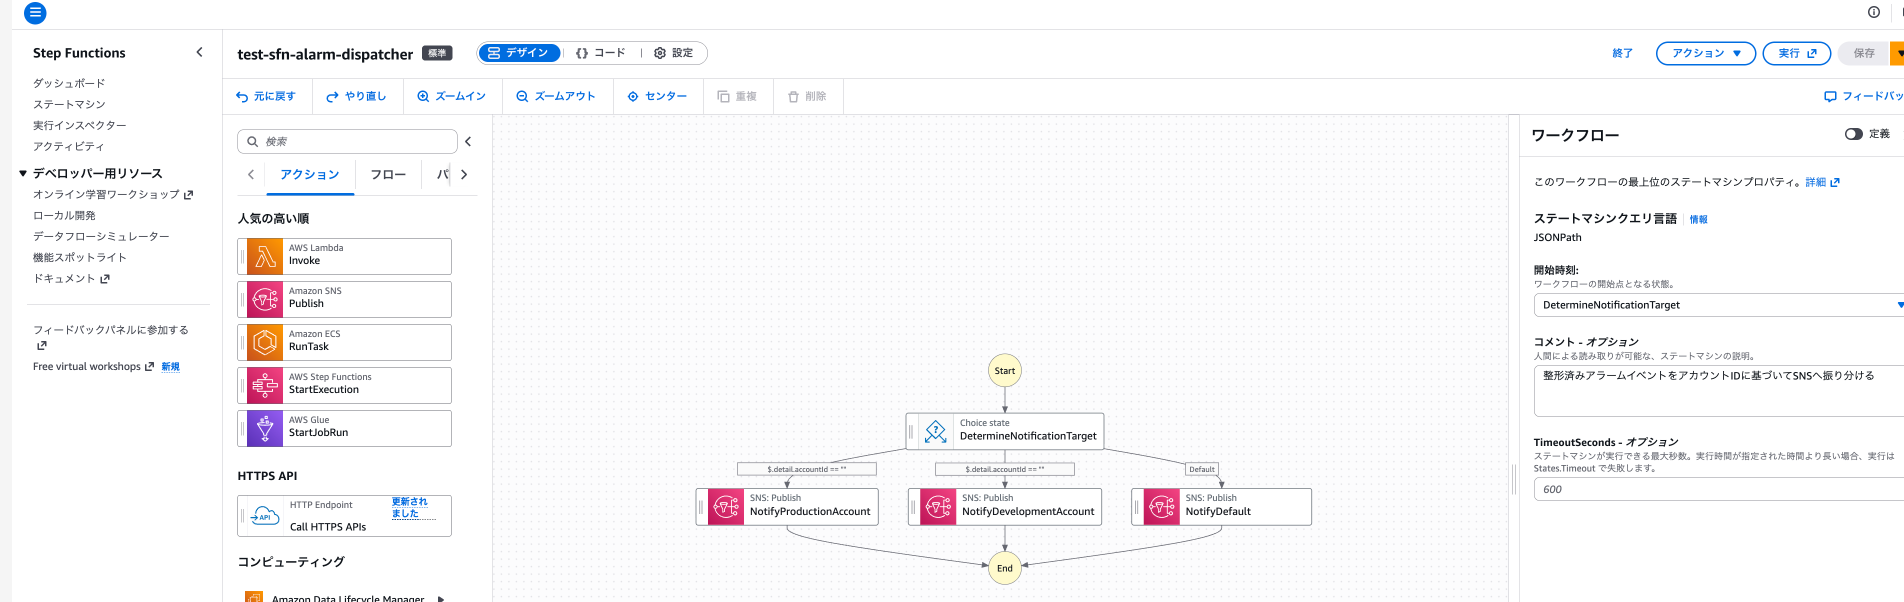
Creating Step Functions (Routing Process)
Create a state machine to route formatted events received from the custom event bus to SNS topics based on account ID.
It checks $.detail.accountId in the input event and uses a Choice state to branch and execute SNS Publish.
The flow diagram looks like this:
Creating an IAM role (for routing Step Functions)
Common trust policy for Step Functions IAM roles (sfn-trust-policy.json)
{
  "Version": "2012-10-17",
  "Statement": [
    {
      "Effect": "Allow",
      "Principal": {
        "Service": "states.amazonaws.com"
      },
      "Action": "sts:AssumeRole"
    }
  ]
}
IAM policy (sfn-dispatcher-permission-policy.json)
{
  "Version": "2012-10-17",
  "Statement": [
    {
      "Effect": "Allow",
      "Action": "sns:Publish",
      "Resource": [
        "arn:aws:sns:ap-northeast-1:<monitoring-account-ID>:test-sns-default-alarm-notification",
        "arn:aws:sns:ap-northeast-1:<monitoring-account-ID>:test-sns-production-alarm-notification",
        "arn:aws:sns:ap-northeast-1:<monitoring-account-ID>:test-sns-development-alarm-notification"
      ]
    }
  ]
}
# Create role
aws iam create-role \
  --role-name test-role-sfn-alarm-dispatcher \
  --assume-role-policy-document file://sfn-trust-policy.json

# Attach policy
aws iam put-role-policy \
  --role-name test-role-sfn-alarm-dispatcher \
  --policy-name test-policy-sfn-alarm-dispatcher \
  --policy-document file://sfn-dispatcher-permission-policy.json
Creating a state machine
State machine definition (dispatcher-state-machine.json)
{
  "Comment": "Route formatted alarm events to SNS based on account ID",
  "StartAt": "DetermineNotificationTarget",
  "States": {
    "DetermineNotificationTarget": {
      "Type": "Choice",
      "Choices": [
        {
          "Variable": "$.detail.accountId",
          "StringEquals": "<production-account-ID>",
          "Next": "NotifyProductionAccount"
        },
        {
          "Variable": "$.detail.accountId",
          "StringEquals": "<development-account-ID>",
          "Next": "NotifyDevelopmentAccount"
        }
      ],
      "Default": "NotifyDefault"
    },
    "NotifyProductionAccount": {
      "Type": "Task",
      "Resource": "arn:aws:states:::sns:publish",
      "Parameters": {
        "TopicArn": "arn:aws:sns:ap-northeast-1:<monitoring-account-ID>:test-sns-production-alarm-notification",
        "Subject.$": "$.detail.subject",
        "Message.$": "$.detail.message"
      },
      "End": true
    },
    "NotifyDevelopmentAccount": {
      "Type": "Task",
      "Resource": "arn:aws:states:::sns:publish",
      "Parameters": {
        "TopicArn": "arn:aws:sns:ap-northeast-1:<monitoring-account-ID>:test-sns-development-alarm-notification",
        "Subject.$": "$.detail.subject",
        "Message.$": "$.detail.message"
      },
      "End": true
    },
    "NotifyDefault": {
      "Type": "Task",
      "Resource": "arn:aws:states:::sns:publish",
      "Parameters": {
        "TopicArn": "arn:aws:sns:ap-northeast-1:<monitoring-account-ID>:test-sns-default-alarm-notification",
        "Subject.$": "$.detail.subject",
        "Message.$": "$.detail.message"
      },
      "End": true
    }
  }
}
aws stepfunctions create-state-machine \
  --name "test-sfn-alarm-dispatcher" \
  --definition file://dispatcher-state-machine.json \
  --role-arn "arn:aws:iam::<monitoring-account-ID>:role/test-role-sfn-alarm-dispatcher"
Creating a Custom Event Bus
Create a custom event bus to receive formatted events. Separating from the default bus helps distinguish between raw and formatted events.
aws events create-event-bus --name test-custom-event-bus
Creating an EventBridge Rule (Custom Bus)
Create a rule to detect formatted events on the custom event bus and forward them to the routing Step Functions.
Creating an IAM role
Common trust policy for EventBridge IAM roles (eventbridge-trust-policy.json)
{
  "Version": "2012-10-17",
  "Statement": [
    {
      "Effect": "Allow",
      "Principal": {
        "Service": "events.amazonaws.com"
      },
      "Action": "sts:AssumeRole"
    }
  ]
}
IAM policy (eventbridge-to-sfn-dispatcher-permission-policy.json)
{
  "Version": "2012-10-17",
  "Statement": [
    {
      "Effect": "Allow",
      "Action": "states:StartExecution",
      "Resource": "arn:aws:states:ap-northeast-1:<monitoring-account-ID>:stateMachine:test-sfn-alarm-dispatcher"
    }
  ]
}
# Create role
aws iam create-role \
  --role-name test-role-eventbridge-to-sfn-dispatcher \
  --assume-role-policy-document file://eventbridge-trust-policy.json

# Attach policy
aws iam put-role-policy \
  --role-name test-role-eventbridge-to-sfn-dispatcher \
  --policy-name test-policy-eventbridge-to-sfn-dispatcher \
  --policy-document file://eventbridge-to-sfn-dispatcher-permission-policy.json
Creating a rule
The event pattern should match the source and detail-type set in the formatting process.
Event pattern (custom-event-pattern.json)
{
  "source": ["custom.alarm.formatter"],
  "detail-type": ["Formatted Alarm Notification"]
}
aws events put-rule \
  --name "test-ebrule-custom-to-sfn" \
  --event-bus-name "test-custom-event-bus" \
  --event-pattern file://custom-event-pattern.json \
  --state ENABLED
Setting up the target
aws events put-targets \
  --rule "test-ebrule-custom-to-sfn" \
  --event-bus-name "test-custom-event-bus" \
  --targets '[{
    "Id": "StepFunctionsTarget",
    "Arn": "arn:aws:states:ap-northeast-1:<monitoring-account-ID>:stateMachine:test-sfn-alarm-dispatcher",
    "RoleArn": "arn:aws:iam::<monitoring-account-ID>:role/test-role-eventbridge-to-sfn-dispatcher"
  }]'
Creating Step Functions (Formatting Process)
Create a state machine to receive CloudWatch Alarm Contributor State Change events, format them for notification, and forward them to the custom event bus.
Creating an IAM role (for formatting Step Functions)
IAM policy (sfn-formatter-permission-policy.json)
{
  "Version": "2012-10-17",
  "Statement": [
    {
      "Effect": "Allow",
      "Action": "events:PutEvents",
      "Resource": "arn:aws:events:ap-northeast-1:123456789012:event-bus/test-custom-event-bus"
    }
  ]
}
# Create role
aws iam create-role \
  --role-name test-role-sfn-alarm-formatter \
  --assume-role-policy-document file://sfn-trust-policy.json

# Attach policy
aws iam put-role-policy \
  --role-name test-role-sfn-alarm-formatter \
  --policy-name test-policy-sfn-alarm-formatter \
  --policy-document file://sfn-formatter-permission-policy.json
Creating a state machine
State machine definition (sfn-formatter-permission-policy.json)
{
  "Comment": "Format CloudWatch Alarm events and forward to custom event bus",
  "StartAt": "FormatMessage",
  "States": {
    "FormatMessage": {
      "Type": "Pass",
      "Parameters": {
        "accountId.$": "$.detail.alarmContributor.attributes['AWS.\"AccountId\"']",
        "alarmName.$": "$.detail.alarmName",
        "resourceAttributes.$": "$.detail.alarmContributor.attributes",
        "state.$": "$.detail.state.value",
        "reason.$": "$.detail.state.reason",
        "timestamp.$": "$.time"
      },
      "Next": "BuildNotification"
    },
    "BuildNotification": {
      "Type": "Pass",
      "Parameters": {
        "accountId.$": "$.accountId",
        "alarmName.$": "$.alarmName",
        "resourceAttributes.$": "$.resourceAttributes",
        "subject.$": "States.Format('CloudWatch Alarm: {} - {}', $.alarmName, $.state)",
        "message.$": "States.Format('Account ID: {}\nAlarm Name: {}\nResource Info: {}\nState: {}\nReason: {}\nTimestamp: {}', $.accountId, $.alarmName, States.JsonToString($.resourceAttributes), $.state, $.reason, $.timestamp)"
      },
      "Next": "PutToCustomBus"
    },
    "PutToCustomBus": {
      "Type": "Task",
      "Resource": "arn:aws:states:::events:putEvents",
      "Parameters": {
        "Entries": [
          {
            "Source": "custom.alarm.formatter",
            "DetailType": "Formatted Alarm Notification",
            "Detail": {
              "accountId.$": "$.accountId",
              "alarmName.$": "$.alarmName",
              "resourceAttributes.$": "$.resourceAttributes",
              "subject.$": "$.subject",
              "message.$": "$.message"
            },
            "EventBusName": "test-custom-event-bus"
          }
        ]
      },
      "End": true
    }
  }
}
Keeping the entire alarmContributor.attributes as resourceAttributes allows support for resources other than EC2 (like DynamoDB, RDS, Lambda, etc.).
aws stepfunctions create-state-machine \
  --name "test-sfn-alarm-formatter" \
  --definition file://formatter-state-machine.json \
  --role-arn "arn:aws:iam::<monitoring-account-ID>:role/test-role-sfn-alarm-formatter"
Creating an EventBridge Rule (Default Bus)
Create a rule to detect CloudWatch Alarm Contributor State Change events on the default event bus and forward them to the formatting Step Functions.
Creating an IAM role
IAM policy (eventbridge-to-sfn-formatter-permission-policy.json)
{
  "Version": "2012-10-17",
  "Statement": [
    {
      "Effect": "Allow",
      "Action": "states:StartExecution",
      "Resource": "arn:aws:states:ap-northeast-1:<monitoring-account-ID>:stateMachine:test-sfn-alarm-formatter"
    }
  ]
}
# Create role
aws iam create-role \
  --role-name test-role-eventbridge-to-sfn \
  --assume-role-policy-document file://eventbridge-trust-policy.json

# Attach policy
aws iam put-role-policy \
  --role-name test-role-eventbridge-to-sfn \
  --policy-name test-policy-eventbridge-to-sfn \
  --policy-document file://eventbridge-to-sfn-formatter-permission-policy.json
Creating a rule
Event pattern (default-event-pattern.json)
{
  "source": ["aws.cloudwatch"],
  "detail-type": ["CloudWatch Alarm Contributor State Change"],
  "resources": [{
    "wildcard": "arn:aws:cloudwatch:ap-northeast-1:<monitoring-account-ID>:alarm:test-*"
  }]
}
This uses a prefix specification.
If you want all alarms to use this notification infrastructure, you could use a wildcard for the entire alarm name.
Please modify as appropriate.
aws events put-rule \
  --name "test-ebrule-alarm-to-sfn" \
  --event-pattern file://default-event-pattern.json \
  --state ENABLED
Setting up the target
aws events put-targets \
  --rule "test-ebrule-alarm-to-sfn" \
  --targets '[{
    "Id": "StepFunctionsTarget",
    "Arn": "arn:aws:states:ap-northeast-1:<monitoring-account-ID>:stateMachine:test-sfn-alarm-formatter",
    "RoleArn": "arn:aws:iam::<monitoring-account-ID>:role/test-role-eventbridge-to-sfn"
  }]'
Creating a CloudWatch Alarm
Finally, create an alarm using a Metrics Insights query. In Pattern A, we use GROUP BY AWS.AccountId, InstanceId to monitor EC2 instances across all accounts with a single alarm.
As mentioned at the beginning of the instructions, we'll use custom metrics (in the Test/EC2 namespace) for testing.
This alarm will trigger when CPUUtilization exceeds 80%.
Creating an alarm
Alarm definition (alarm.json)
{
  "AlarmName": "test-ec2-cpu-high",
  "Metrics": [
    {
      "Id": "q1",
      "Expression": "SELECT MAX(CPUUtilization) FROM \"Test/EC2\" GROUP BY AWS.AccountId, InstanceId ORDER BY MAX() DESC",
      "Period": 60,
      "Label": "CPU Utilization"
    }
  ],
  "Threshold": 80,
  "ComparisonOperator": "GreaterThanThreshold",
  "EvaluationPeriods": 1,
  "DatapointsToAlarm": 1,
  "TreatMissingData": "notBreaching"
}
aws cloudwatch put-metric-alarm --cli-input-json file://alarm.json
Since we're triggering Step Functions via EventBridge, there's no need to set alarm actions.
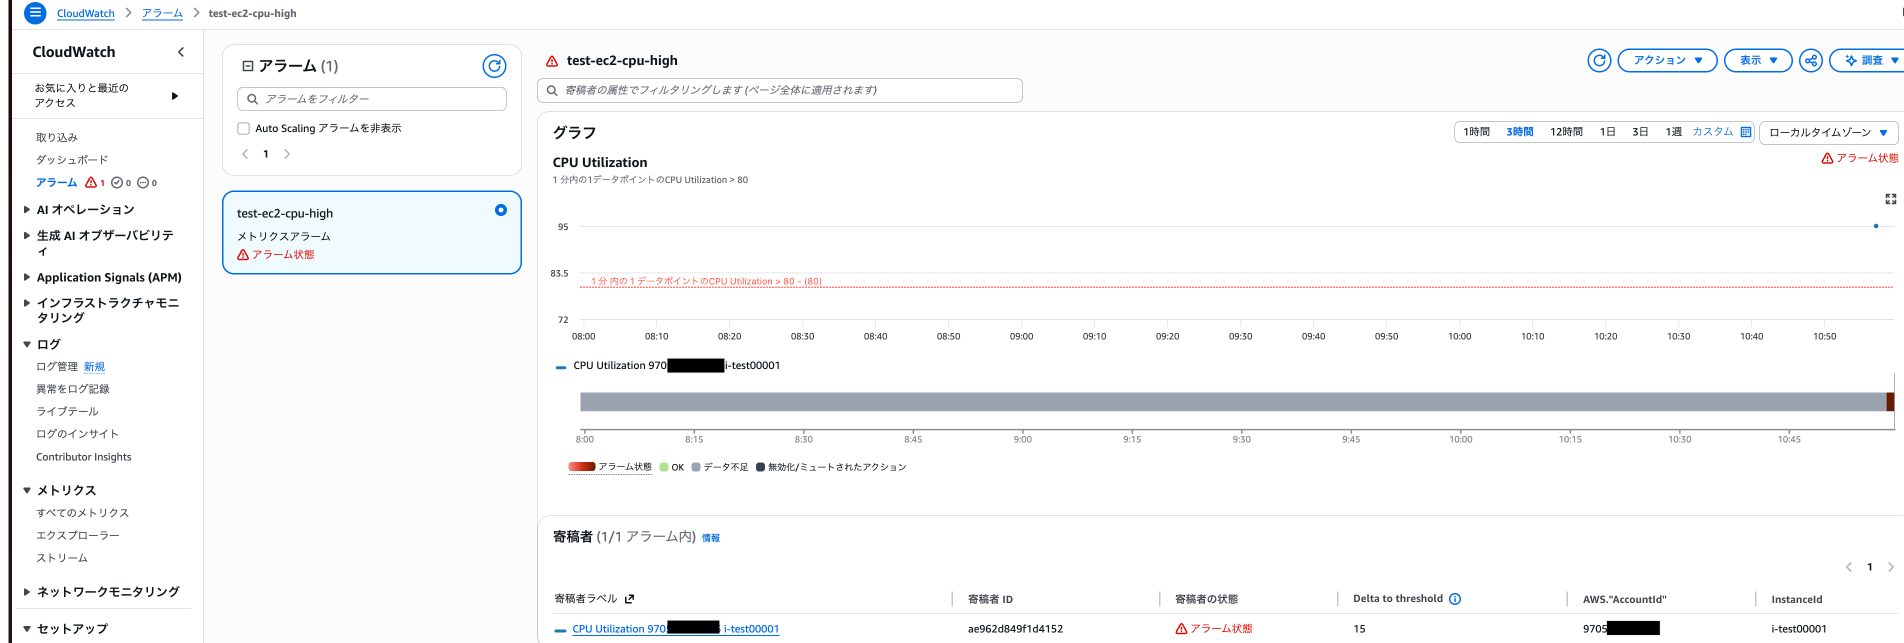
Verifying Pattern A
Once the setup is complete, conduct an end-to-end test by publishing custom metrics from pseudo-production and pseudo-development accounts.
To make it easier to identify which environment the results are from, I'm showing the first 3 digits of the account ID in screenshots:
- Pseudo-production account: 970XXXXXXXXX
- Pseudo-development account: 977XXXXXXXXX
Let's first create a metric data point that exceeds the threshold (80%) in the pseudo-production account:
aws cloudwatch put-metric-data \
  --namespace "Test/EC2" \
  --metric-name "CPUUtilization" \
  --value 95 \
  --unit Percent \
  --dimensions InstanceId=i-test00001
After a while, the alarm in the monitoring account went into alarm state!
After waiting a bit longer, an email was sent to the production account email address (with the "production" alias):
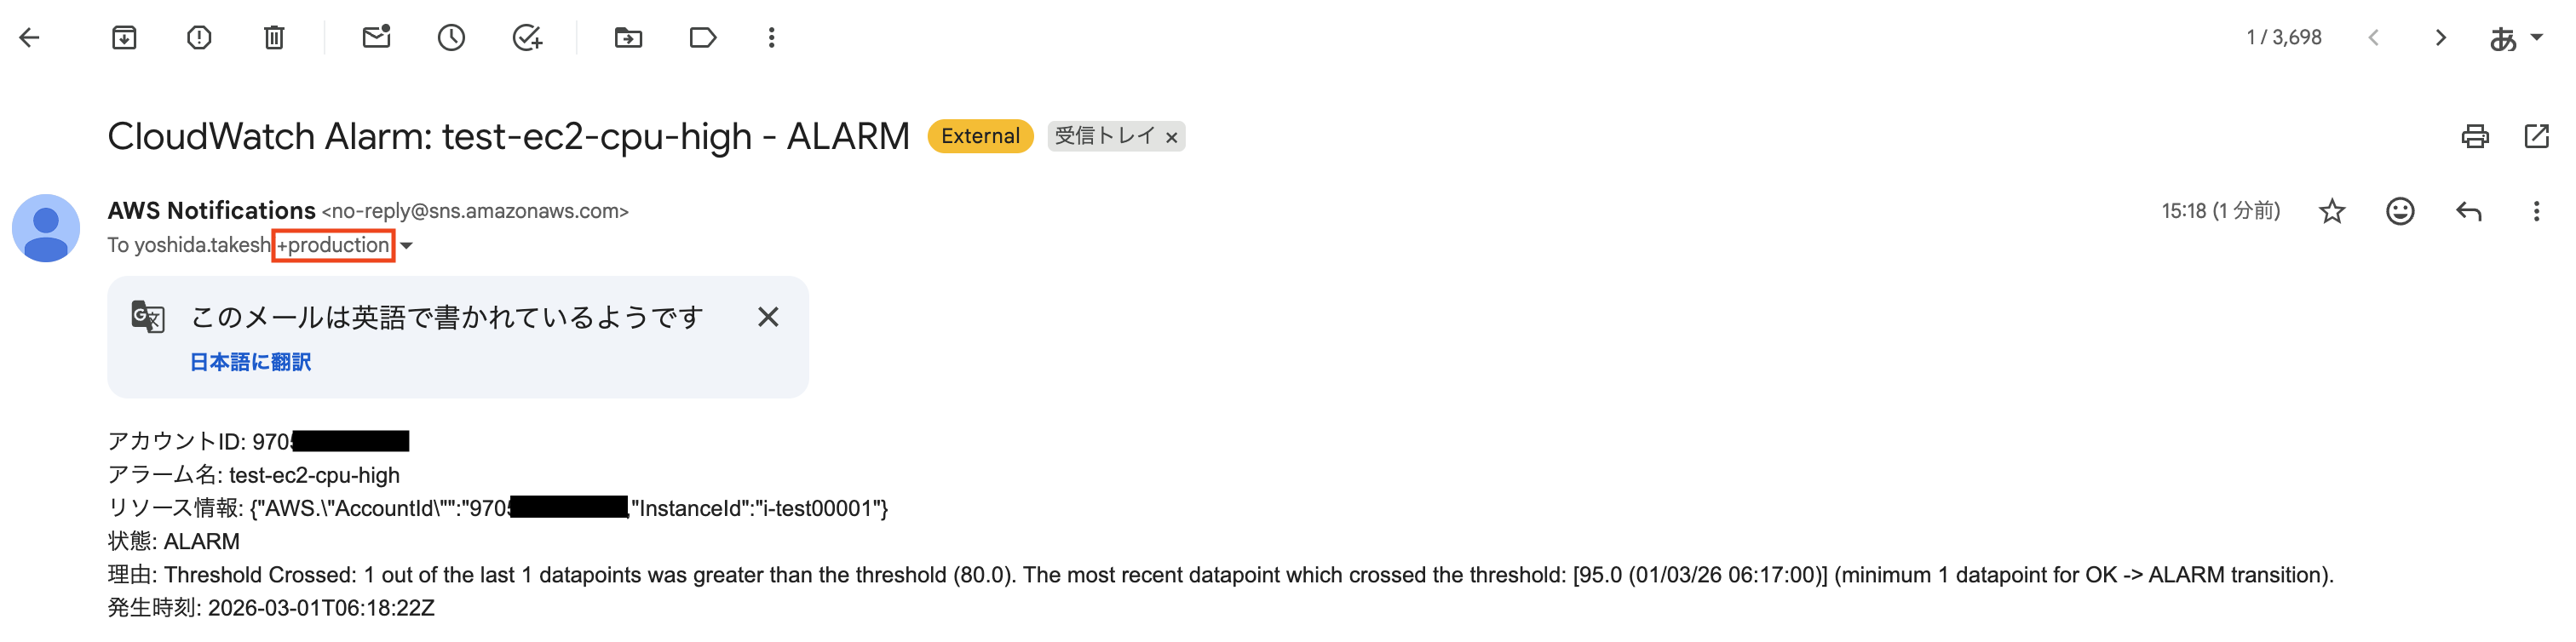
Next, I created a metric data point exceeding the threshold (80%) in the pseudo-development environment.
This time, an email was sent to the development account email address (with the "development" alias):
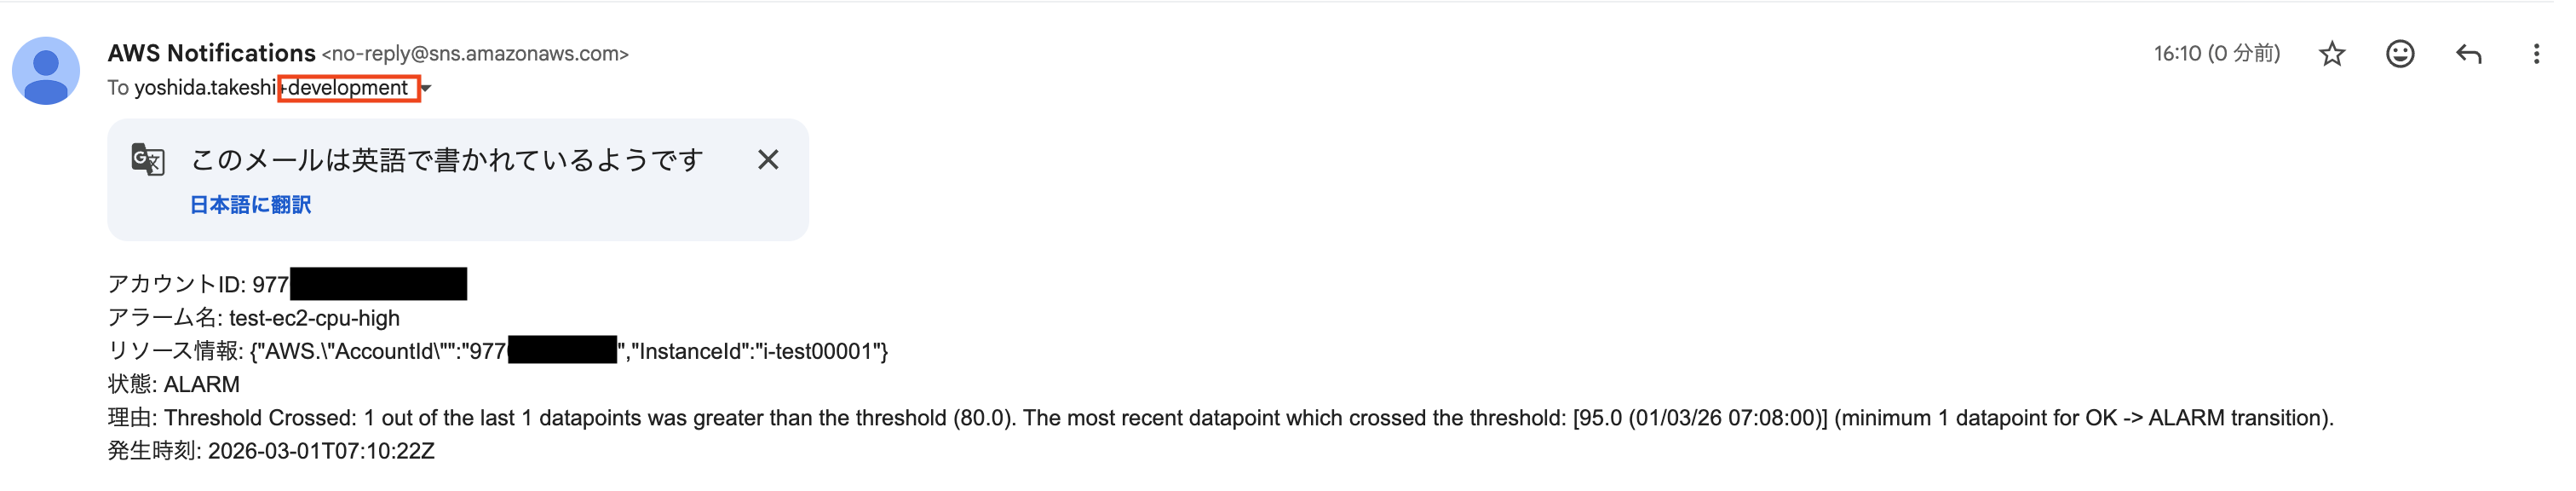
We can see that notifications are being properly routed based on the account.
Building Pattern B
For Pattern B, I'll only explain the differences from Pattern A.
SNS topics, the routing state machine, custom event bus, and EventBridge rules (default and custom buses) are shared with Pattern A.
Alarm Configuration
In Pattern B, alarms are created for each source account.
| Item | Pattern A | Pattern B |
|---|---|---|
| Query | GROUP BY AWS.AccountId, InstanceId |
WHERE AWS.AccountId = 'xxx' GROUP BY InstanceId |
| Number of alarms | 1 (common for all accounts) | Created per source account |
| Threshold | Common for all accounts | Can be set per source account |
| Alarm name | test-ec2-cpu-high |
test-account-{account-ID}-ec2-cpu-high |
Here are examples of alarms for production accounts (threshold 80%) and development accounts (threshold 90%):
Pattern B alarm example (for production accounts)
{
  "AlarmName": "test-account-111122223333-ec2-cpu-high",
  "Metrics": [
    {
      "Id": "q1",
      "Expression": "SELECT MAX(CPUUtilization) FROM \"Test/EC2\" WHERE AWS.AccountId = '111122223333' GROUP BY InstanceId ORDER BY MAX() DESC",
      "Period": 60,
      "Label": "CPU Utilization"
    }
  ],
  "Threshold": 80,
  "ComparisonOperator": "GreaterThanThreshold",
  "EvaluationPeriods": 1,
  "DatapointsToAlarm": 1,
  "TreatMissingData": "notBreaching"
}
Pattern B alarm example (for development accounts)
{
  "AlarmName": "test-account-444455556666-ec2-cpu-high",
  "Metrics": [
    {
      "Id": "q1",
      "Expression": "SELECT MAX(CPUUtilization) FROM \"Test/EC2\" WHERE AWS.AccountId = '444455556666' GROUP BY InstanceId ORDER BY MAX() DESC",
      "Period": 60,
      "Label": "CPU Utilization"
    }
  ],
  "Threshold": 90,
  "ComparisonOperator": "GreaterThanThreshold",
  "EvaluationPeriods": 1,
  "DatapointsToAlarm": 1,
  "TreatMissingData": "notBreaching"
}
We use the naming convention test-account-{account-ID}-ec2-cpu-high for alarm names.
This is to extract the account ID in Step Functions later.
# For production accounts
aws cloudwatch put-metric-alarm --cli-input-json file://alarm-pattern-b-production.json

# For development accounts
aws cloudwatch put-metric-alarm --cli-input-json file://alarm-pattern-b-development.json
Step Functions Formatting Changes
Pattern B does not include account ID in the alarmContributor.attributes of Contributor State Change events. This is because the account ID is not specified in the GROUP BY.
Instead, we extract the account ID from the alarm name. We split the alarm name by hyphens using States.StringSplit and get the third element (index 2) using States.ArrayGetItem.
{
  "Comment": "CloudWatch Alarm イベントを整形してカスタムイベントバスへ転送する(パターンB)",
  "StartAt": "ExtractInfo",
  "States": {
    "ExtractInfo": {
      "Type": "Pass",
      "Parameters": {
        "alarmName.$": "$.detail.alarmName",
        "resourceAttributes.$": "$.detail.alarmContributor.attributes",
        "state.$": "$.detail.state.value",
        "reason.$": "$.detail.state.reason",
        "timestamp.$": "$.time"
      },
      "Next": "ParseAccountId"
    },
    "ParseAccountId": {
      "Type": "Pass",
      "Parameters": {
        "alarmName.$": "$.alarmName",
        "accountId.$": "States.ArrayGetItem(States.StringSplit($.alarmName, '-'), 2)",
        "resourceAttributes.$": "$.resourceAttributes",
        "state.$": "$.state",
        "reason.$": "$.reason",
        "timestamp.$": "$.timestamp"
      },
      "Next": "BuildNotification"
    },
    "BuildNotification": {
      "Type": "Pass",
      "Parameters": {
        "accountId.$": "$.accountId",
        "alarmName.$": "$.alarmName",
        "resourceAttributes.$": "$.resourceAttributes",
        "subject.$": "States.Format('CloudWatch Alarm: {} - {}', $.alarmName, $.state)",
        "message.$": "States.Format('アカウントID: {}\nアラーム名: {}\nリソース情報: {}\n状態: {}\n理由: {}\n発生時刻: {}', $.accountId, $.alarmName, States.JsonToString($.resourceAttributes), $.state, $.reason, $.timestamp)"
      },
      "Next": "PutToCustomBus"
    },
    "PutToCustomBus": {
      "Type": "Task",
      "Resource": "arn:aws:states:::events:putEvents",
      "Parameters": {
        "Entries": [
          {
            "Source": "custom.alarm.formatter",
            "DetailType": "Formatted Alarm Notification",
            "Detail": {
              "accountId.$": "$.accountId",
              "alarmName.$": "$.alarmName",
              "resourceAttributes.$": "$.resourceAttributes",
              "subject.$": "$.subject",
              "message.$": "$.message"
            },
            "EventBusName": "test-custom-event-bus"
          }
        ]
      },
      "End": true
    }
  }
}
Verifying Pattern B's Operation
In Pattern B, we'll verify that different thresholds can be set for each account.
We'll create metric data with 85% CPU utilization for both pseudo-production and development accounts.
# Only the production account alarm should trigger (Production: 85% > 80%, Development: 85% < 90%)
aws cloudwatch put-metric-data \
  --namespace "Test/EC2" \
  --metric-name "CPUUtilization" \
  --value 85 \
  --unit Percent \
  --dimensions InstanceId=i-test00001
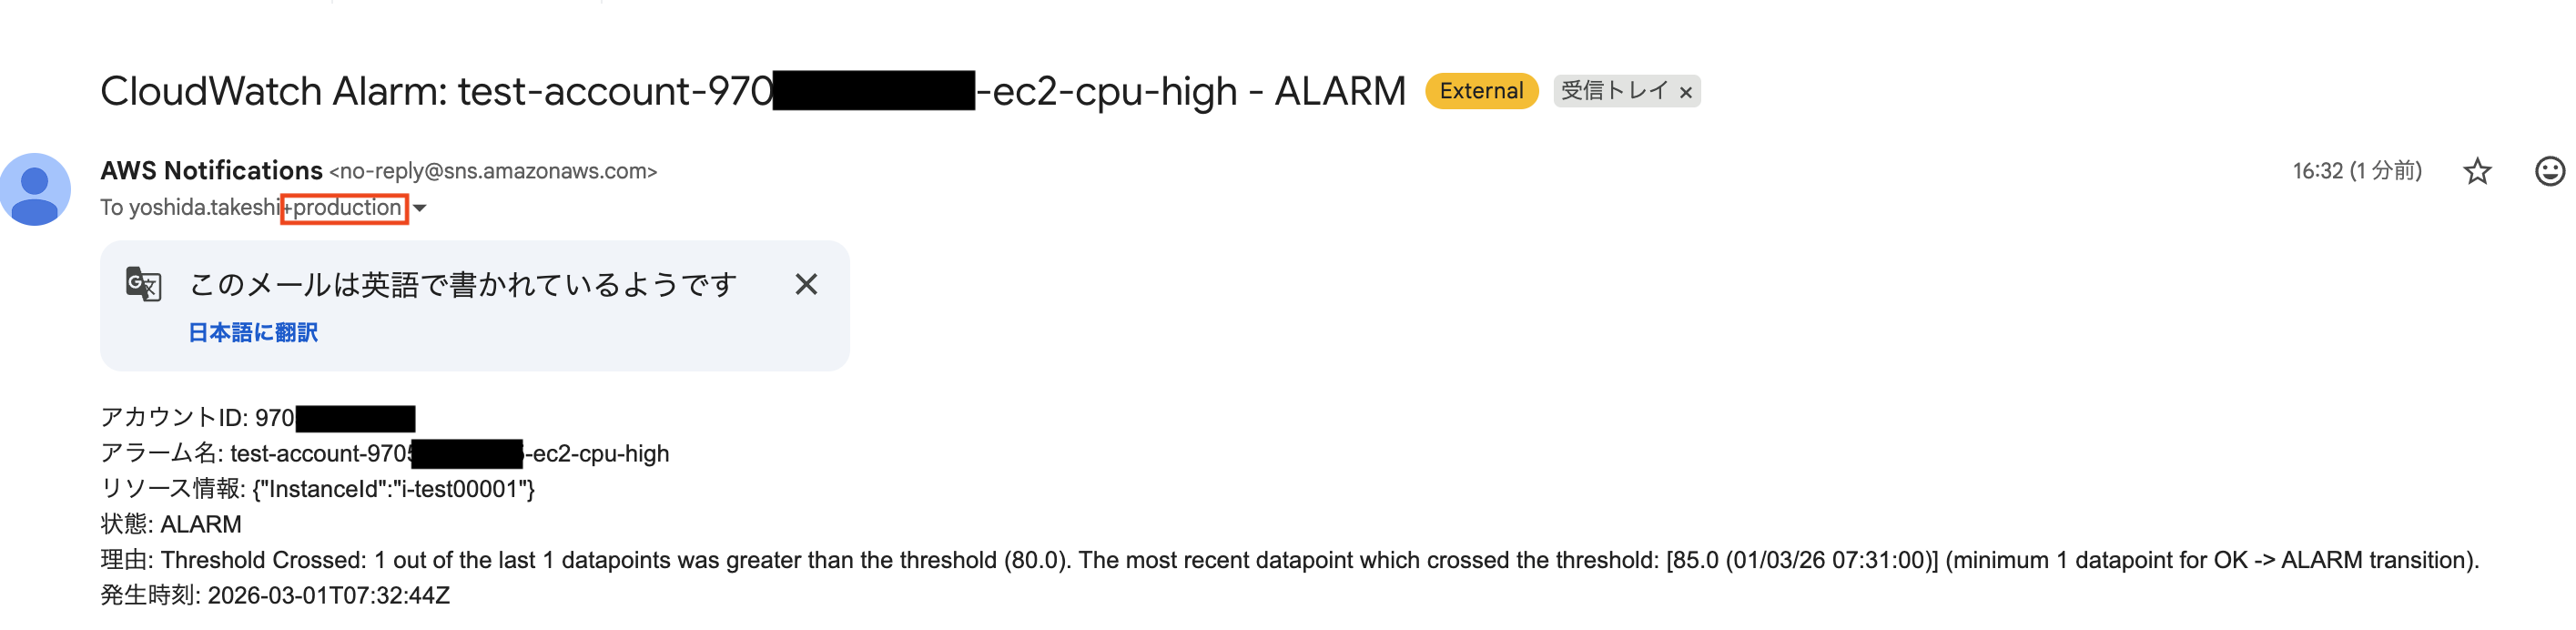
After waiting a while, we confirmed that only the production account alarm entered the alarm state!
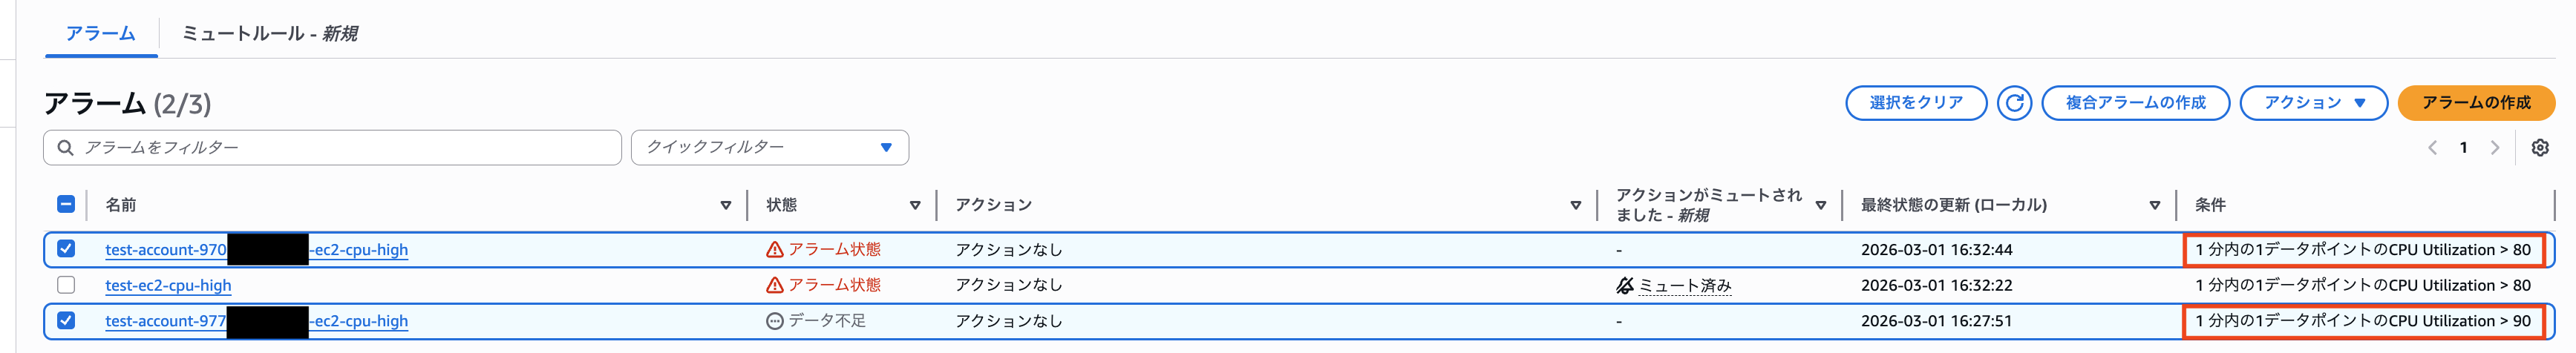
The email was only delivered to the production account's email address.
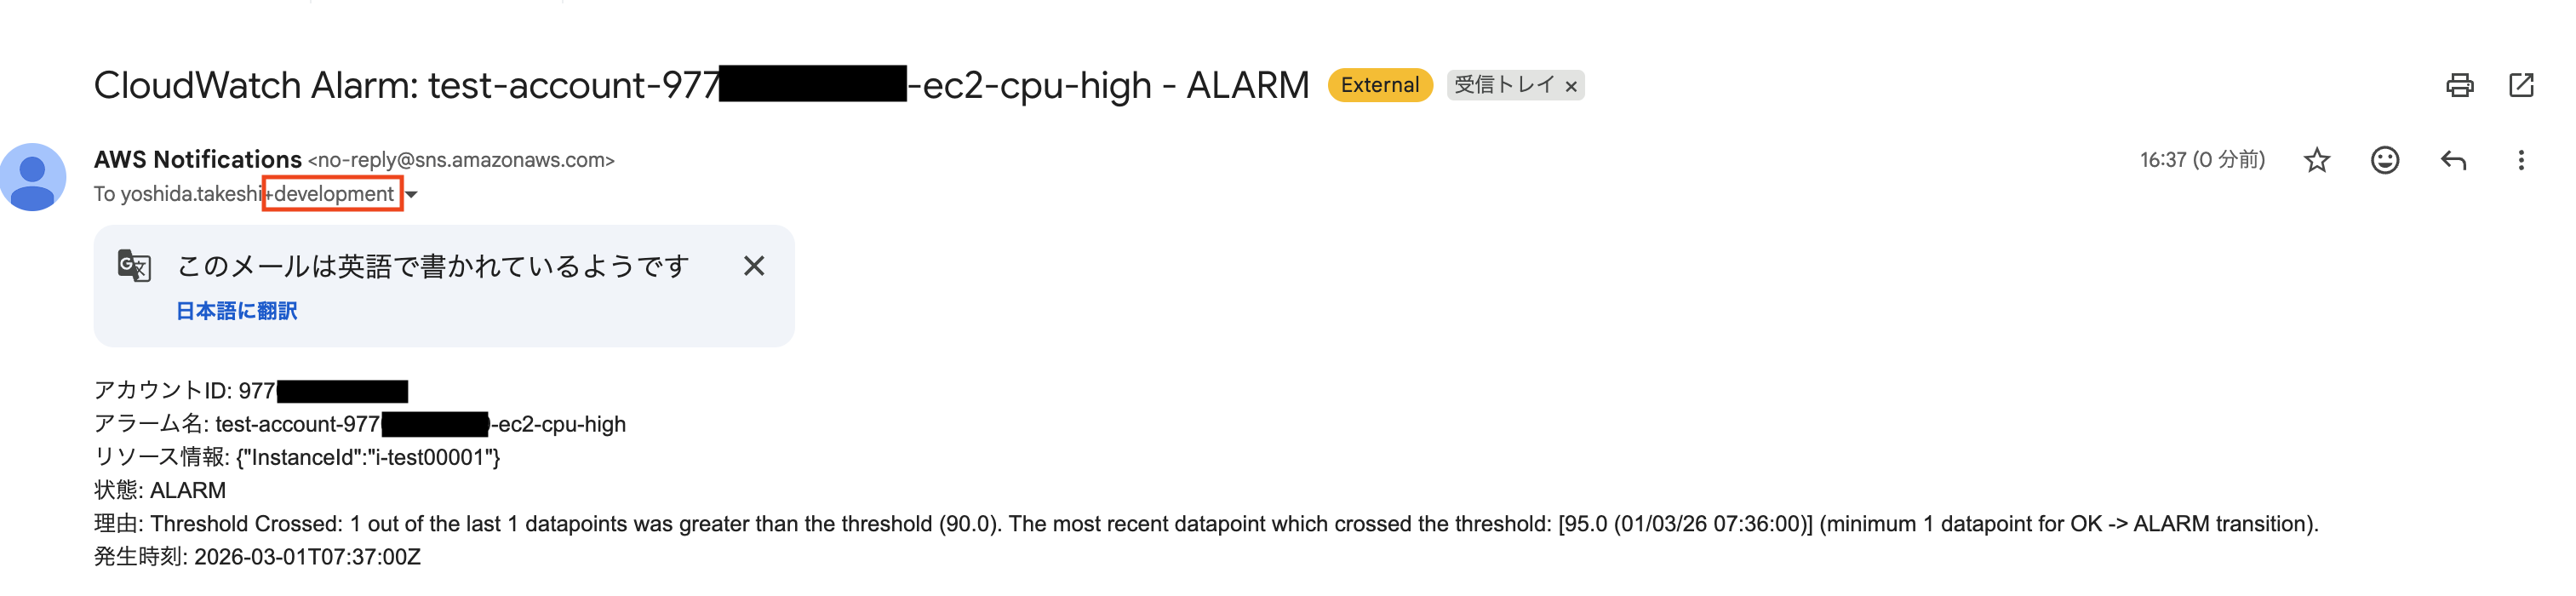
Next, let's create metric data with 95% CPU utilization for both pseudo-production and development accounts.
# Development account alarm should also trigger (Production: 95% > 80%, Development: 95% > 90%)
aws cloudwatch put-metric-data \
  --namespace "Test/EC2" \
  --metric-name "CPUUtilization" \
  --value 95 \
  --unit Percent \
  --dimensions InstanceId=i-test00001
The alert email was also delivered to the development environment's email address!
Conclusion
In this article, we verified a configuration that centralizes monitoring in a multi-account environment by combining Cross-Account Observability and CloudWatch Alarm Contributor State Change events.
However, I realized after testing that CloudWatch also supports metric monitoring based on resource tags.
In this experiment, we used account IDs to set alarm trigger conditions and route notifications, but using resource tags might be more elegant.
Nevertheless, I believe the configuration tested here can serve as a reference for centralized CloudWatch Alarm management in multi-account environments.
I hope this article has been helpful to you.
This was Yoshida from the Cloud Business Division!
References
- Consolidate monitoring environments with Amazon CloudWatch Cross-Account Observability | Column | Cloud Solutions|Services|Business Customers|NTT East
- *1 Amazon CloudWatch query alarms support individual metric monitoring - AWS
- *1 Create an alarm based on a Multi Time Series Metrics Insights query
- *1 Testing Amazon CloudWatch query alarms' support for individual metric monitoring
- Aggregate metrics information from AWS Organizations member accounts using CloudWatch Cross-Account Observability
- [Update] Amazon CloudWatch now enables metric monitoring using resource tags, allowing dynamic CloudWatch alarms that automatically adapt to resource additions and changes | DevelopersIO