
I Tried Out Splunk's Machine Data Lake

This page has been translated by machine translation. View original
Introduction
As the volume of logs ingested into Splunk grows, a question arises: "Should we keep putting all of them into an Index?" Some logs are used for searches and alerts, while others are only kept just in case.
Machine Data Lake (MDL) in Splunk Cloud Platform is a feature that first keeps ingested logs in a raw table on low-cost object storage, and then promotes only the data that needs to be searched or analyzed so that you can use it.
In this article, I put AWS CloudTrail logs that are already being ingested into Splunk Cloud into a raw table, promote them to two kinds of destinations, an Analytics table and a Splunk index, and check the differences in the search results of each.
Prerequisites
This verification was performed in an environment where AWS CloudTrail logs are already being ingested into Splunk Cloud.
- Ingestion settings: CloudTrail has already been ingested via Data Inputs
- Ingestion architecture: CloudTrail → CloudWatch Logs → Amazon Data Firehose → HEC (Splunk)
- Ingestion destination before configuring MDL: Splunk index (
index=aws) - Verification environment: Splunk Cloud Platform 10.7
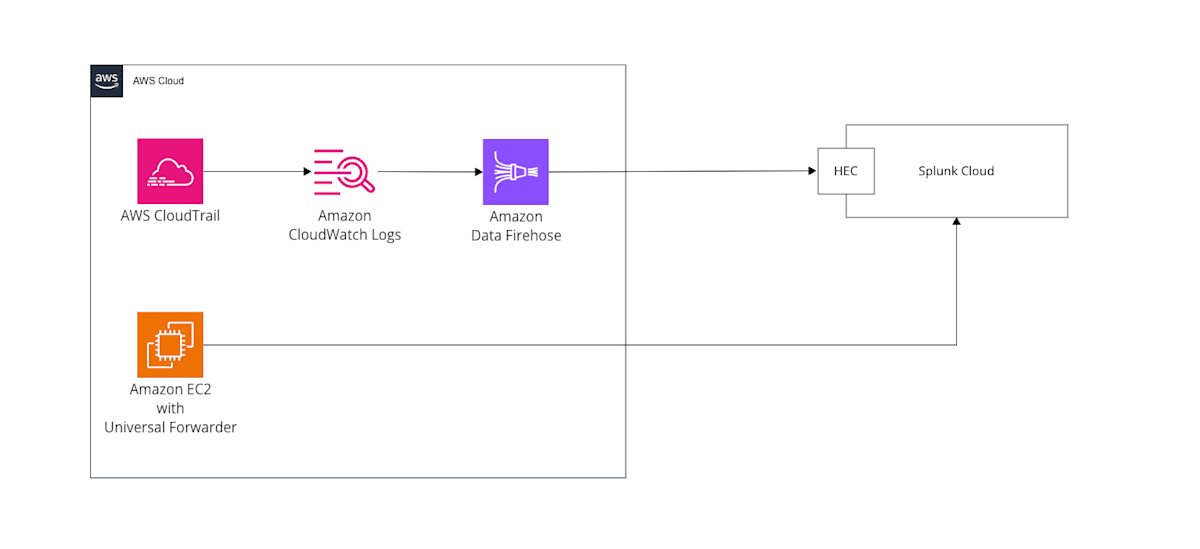
The EC2 instance with the Universal Forwarder installed, shown at the bottom of the diagram, is used in the supplementary section at the end of the article.
Terminology that makes up Machine Data Lake
Machine Data Lake has its own concepts and terminology. Before starting the verification, let's first go over these terms.
Where data is kept, and promotion
| Term | Description |
|---|---|
| raw table | The place where ingested data is kept. There are five fields available for searching: host, source, sourcetype, _time, and _raw (the event body) |
| promotion | Extracting only the necessary data from a raw table as a new dataset. The original raw data is not deleted |
| Analytics table | One of the promotion destinations. You run analytical searches on the fields you select. Columnar (Iceberg-based) |
| Splunk index | One of the promotion destinations. Used in Splunk searches, dashboards, and alerts |
| Static promotion / Streaming promotion | Promotes data for a specified period just once / continuously promotes data that arrives after the start |
In this article, I use static promotion.
Ingesting data into a raw table
There are two routes for ingesting data into a raw table: Direct routing and Pipeline routing.
| Direct routing | Pipeline routing | |
|---|---|---|
| Where data is routed | Configuration of the source (UF, HEC, etc.) | On the Splunk Cloud side (landing definition of the raw table) |
| Changing source settings | Required (specify the raw table as the destination index) | Not required (existing ingestion settings stay as they are) |
| Suitable scenarios | New data sources | When you want to switch gradually for data that already reaches Splunk Cloud |
In addition, you can choose whether to also keep the data routed to the raw table in the Splunk index that you have been using until now.
| Description | |
|---|---|
| MDL only | Matched events go only into the raw table |
| dual routing | Events go into both the raw table and the existing Splunk index |
This time, since I am handling CloudTrail that has already been ingested, I proceed with Pipeline routing (MDL only). Direct routing is touched on as a supplement at the end of the article.
Overview of the verification
I proceed in the following flow.
CloudTrail(取り込み済み)
  → raw table(landing 定義で振り分け)
      ├ Analytics table へ昇格 → 検索
      └ Splunk index へ昇格   → 検索
1. Create a raw table and ingest CloudTrail
First, create a raw table and configure Pipeline routing.
Start creating the dataset
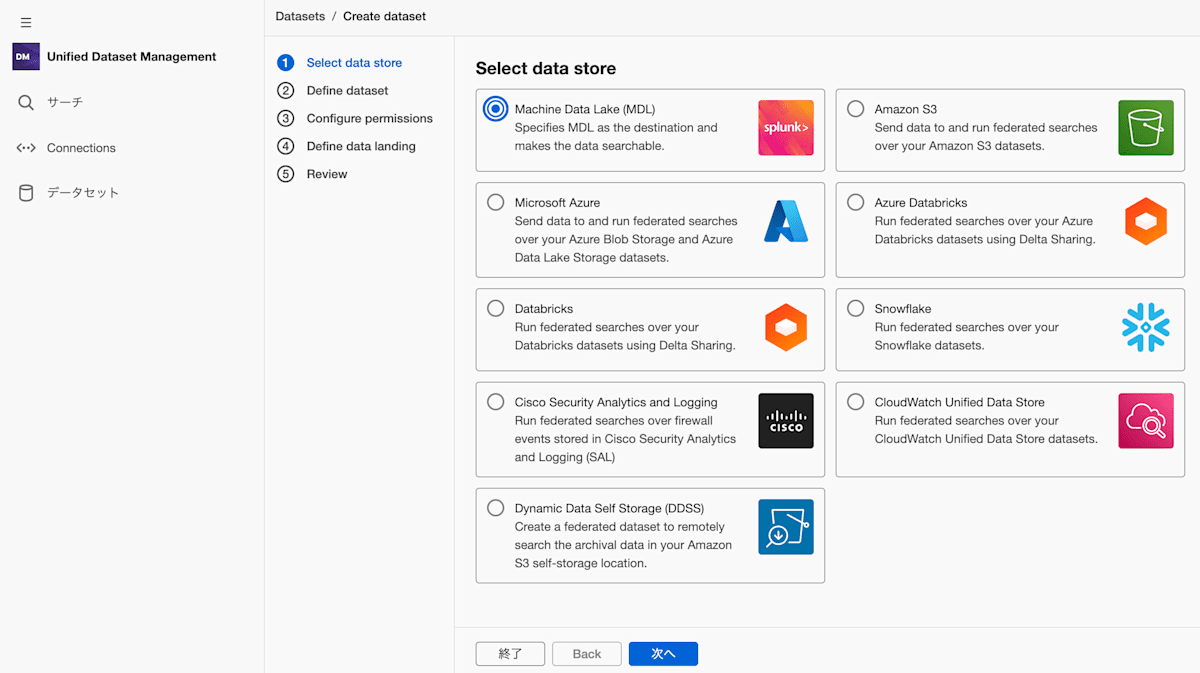
From "Create" in the Catalog, select "Dataset".

For the data store, select "Machine Data Lake (MDL)".
Decide the name and retention period (Define dataset)
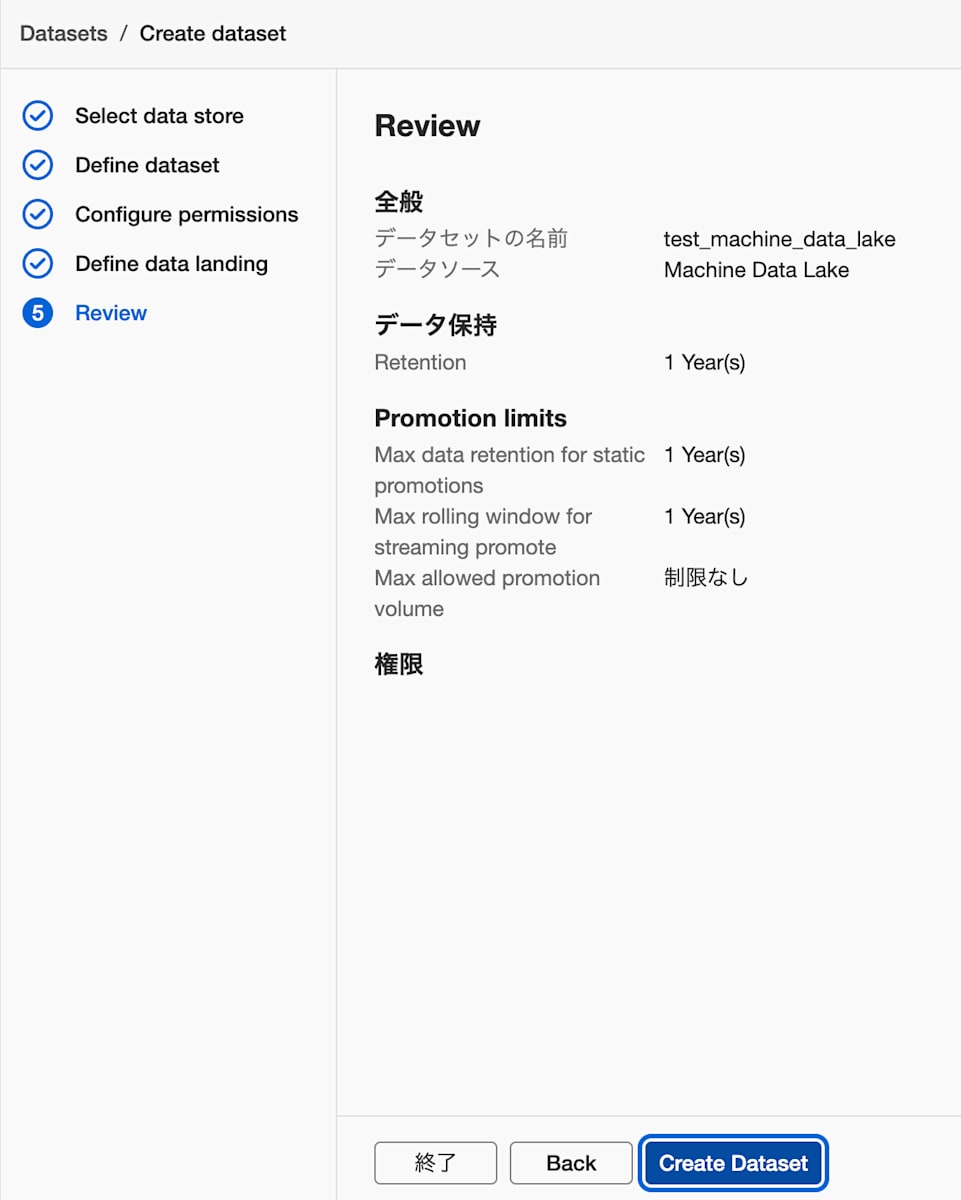
In Define dataset, configure the following items.
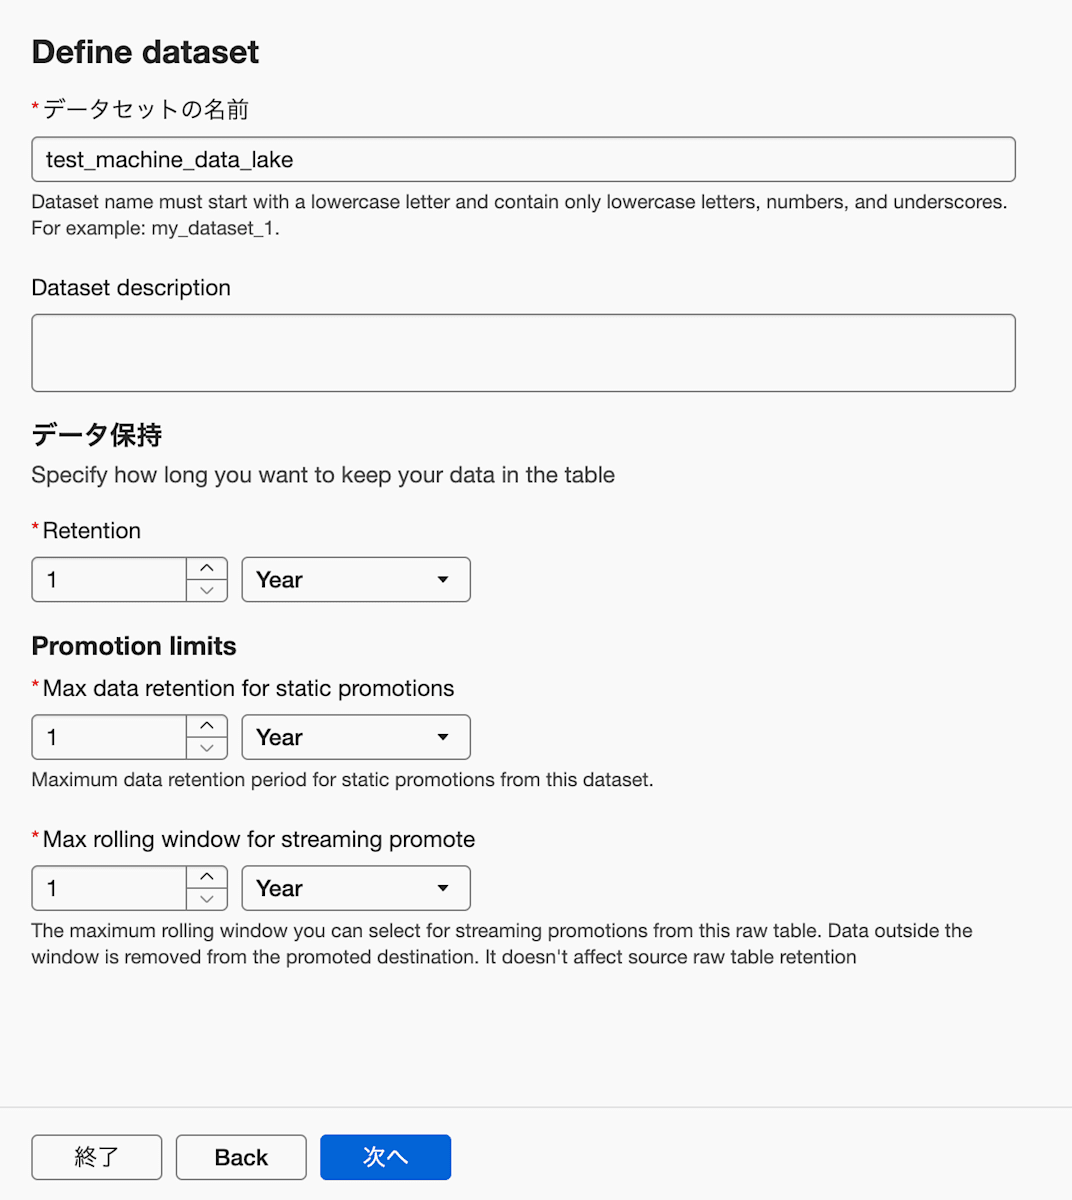
- Dataset name: e.g.
test_machine_data_lake - Retention: 1 Year
- Promotion limits
- Max data retention for static promotions: 1 Year
- Max rolling window for streaming promote: 1 Year. This is the maximum rolling window you can select for streaming promotion, and data outside the window is deleted from the promotion destination. It does not affect the retention period of the original raw table
※Set the retention period and Promotion limits according to your requirements
Configure access permissions (Configure permissions)
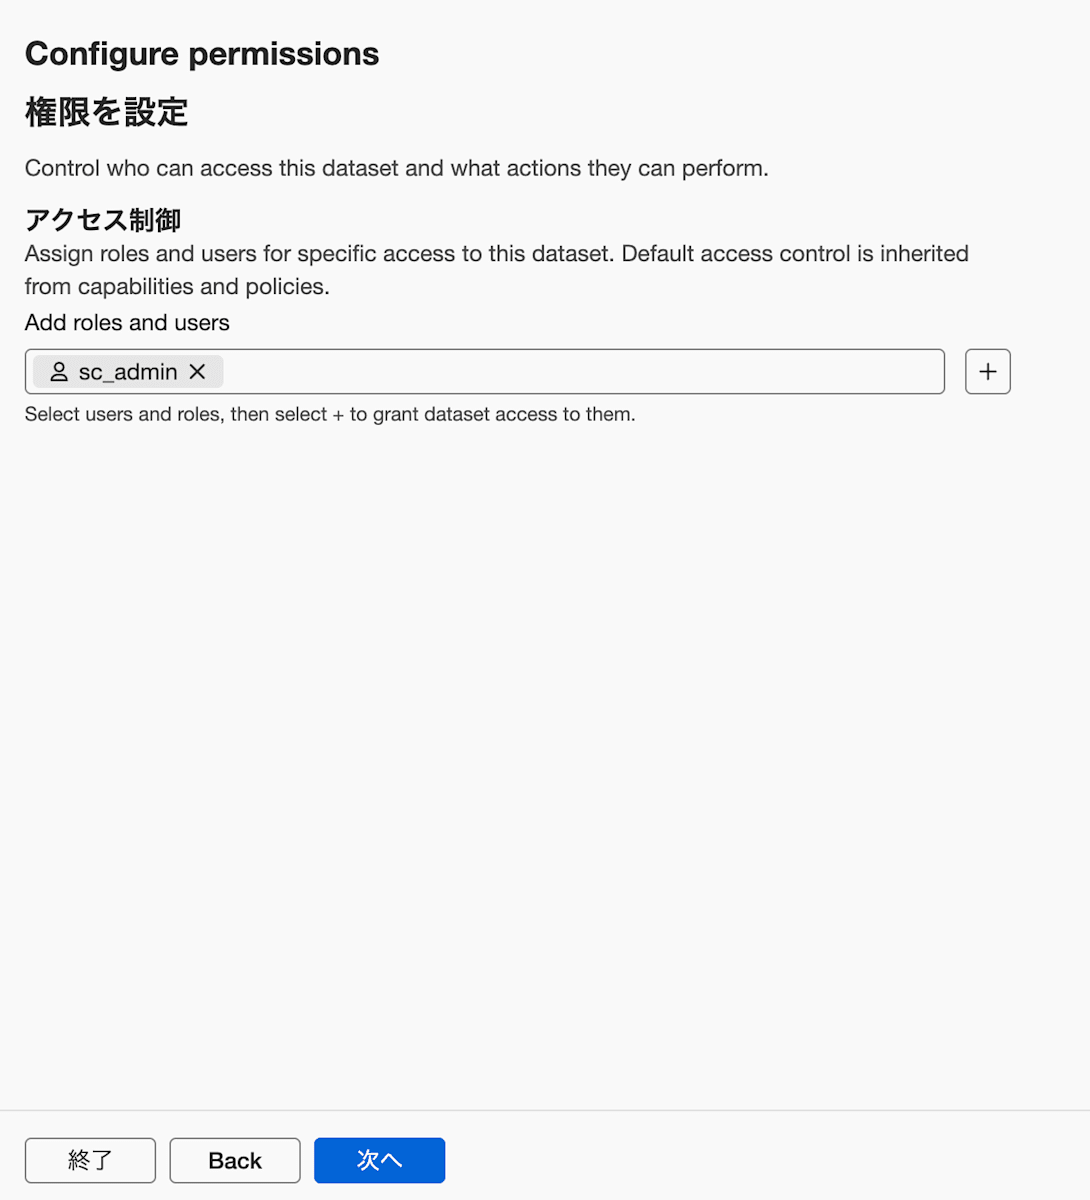
In Configure permissions, specify the users and roles that are allowed access. This time I set sc_admin.
Configure the routing of CloudTrail (Define data landing)
This is the step that corresponds to configuring Pipeline routing. To use Pipeline routing (landing definition), the initial setup of the Ingest Processor (requesting access, creating a service account, and connecting the tenant to Splunk Cloud Platform) is required.
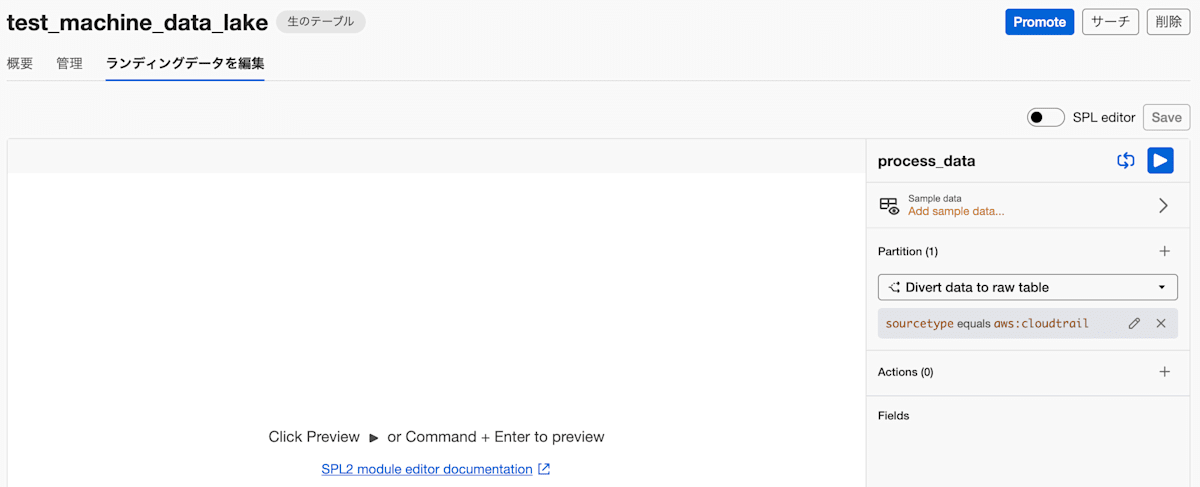
In Define data landing, the landing definition is configured with the Ingest Processor's process_data pipeline.
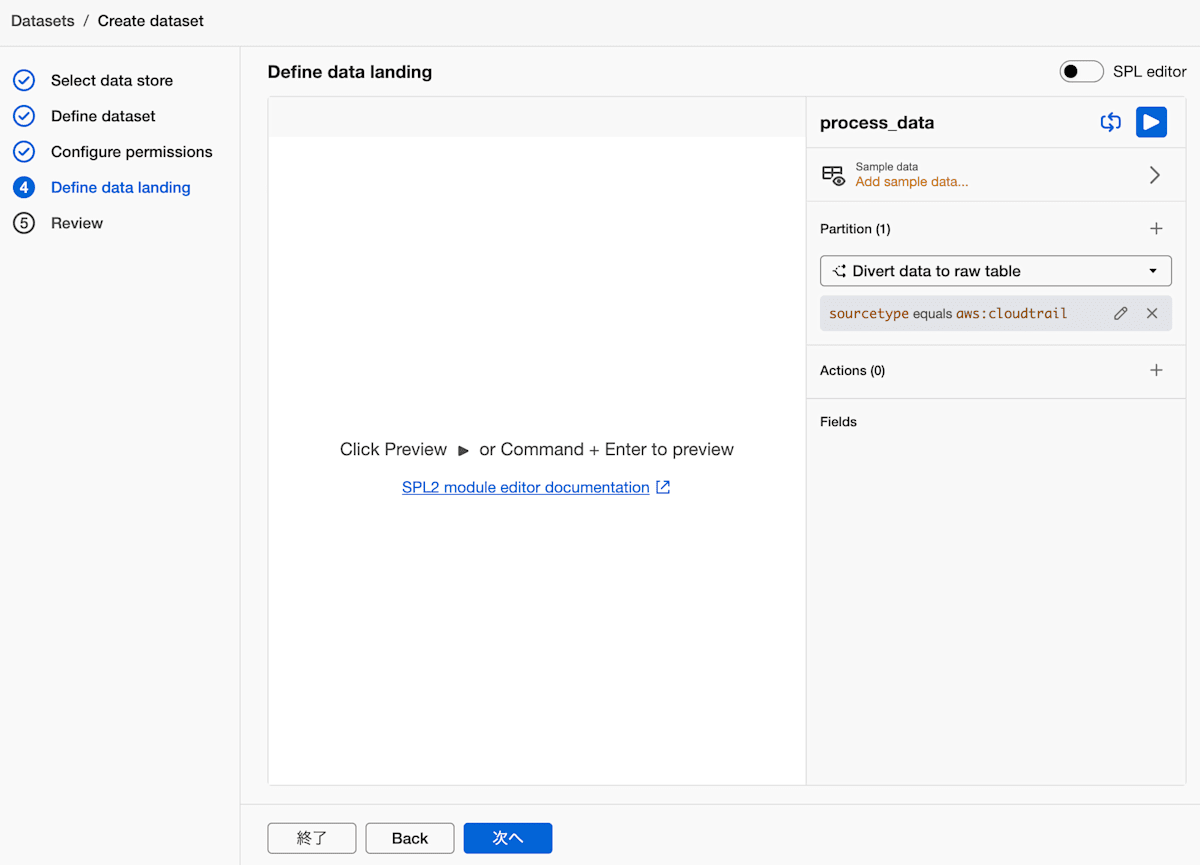
For Partition, I selected "Divert data to raw table" and set the condition to sourcetype equals aws:cloudtrail. This setting diverts events whose sourcetype is aws:cloudtrail, among the events that already reach Splunk Cloud, to the raw table.
This time I verified with the "MDL only" setting. With this setting, matched CloudTrail events no longer flow to index=aws, the previous ingestion destination.
※If you want to keep them in both the raw table and the existing index, use dual routing
Review the contents and create (Review)
Finally, in Review, check the settings and click "Create Dataset".
Confirm that CloudTrail has entered the raw table
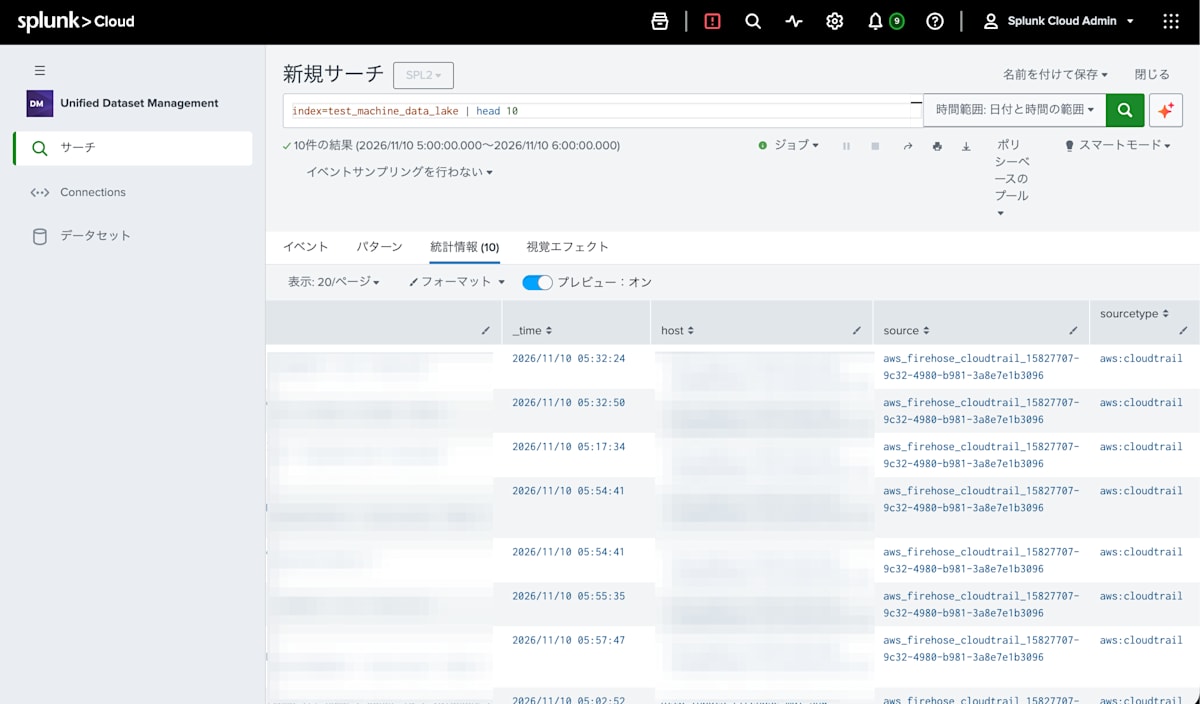
CloudTrail events entered the raw table I created. The sourcetype is aws:cloudtrail.
2. Search the raw table
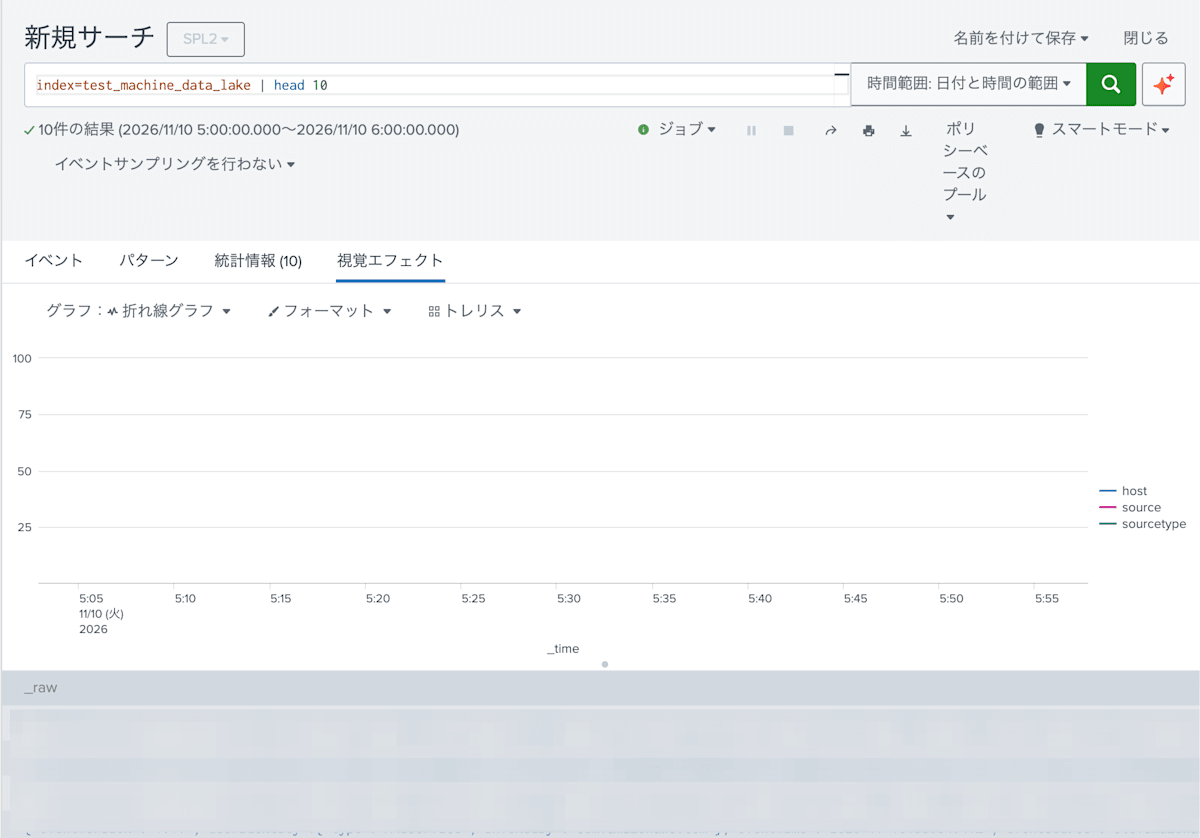
You search a raw table by specifying the name of the raw table in index=.
index=test_machine_data_lake
Note that the raw table could only be searched with SPL2. The official documentation also states that raw searches are done with SPL2 (Key Machine Data Lake terms).
As seen on the previous screen, the only fields displayed are the five: host, source, sourcetype, _time, and _raw. CloudTrail items such as eventName and eventSource are not recognized as fields. Also, results appear only in the "Statistics" tab, and the "Events" tab shows 0 results.
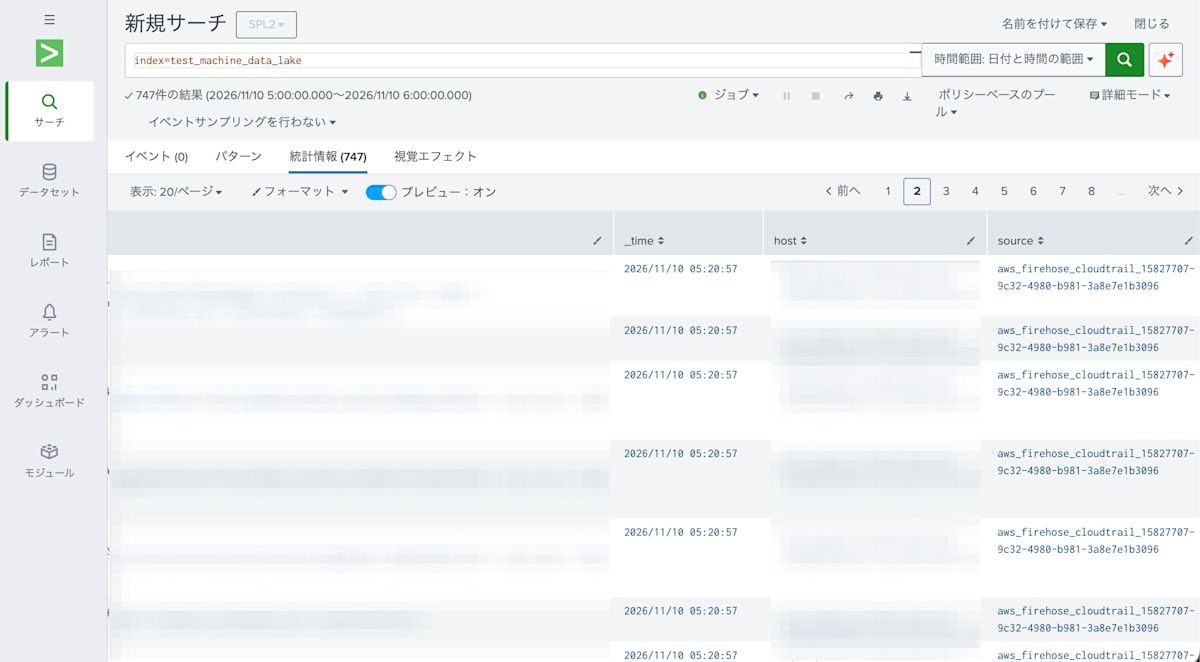
Visualizations also appear not to be available.
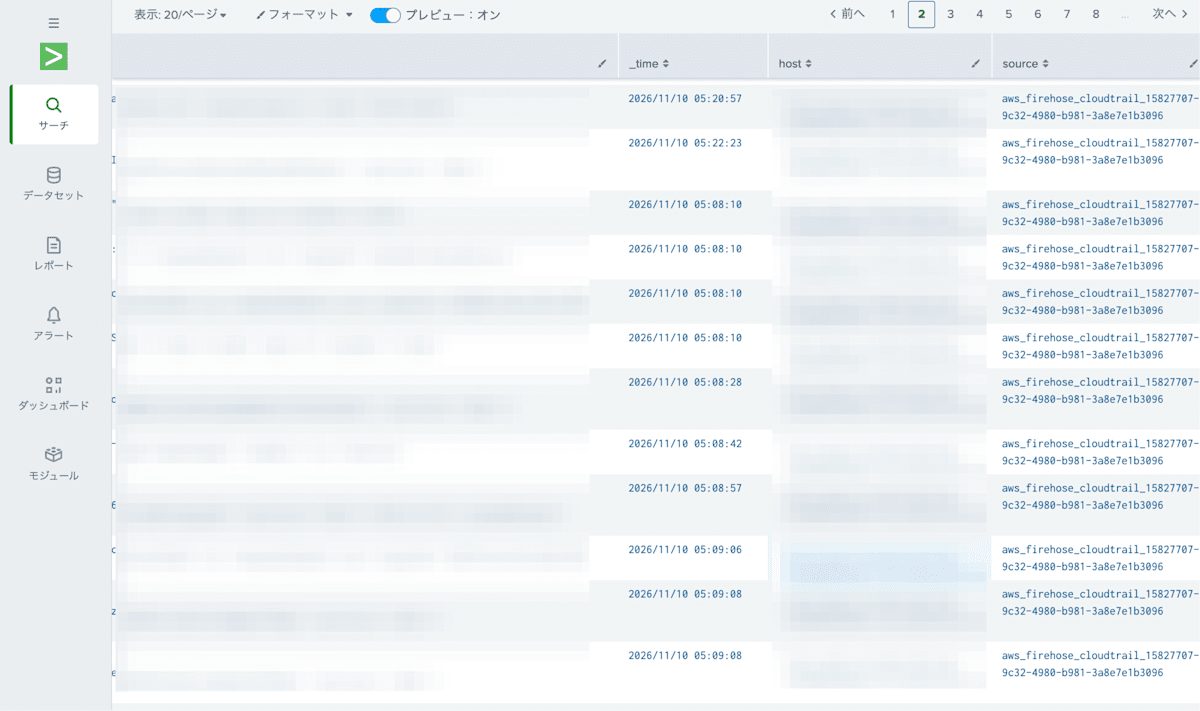
Sort order is not guaranteed
Search results from a raw table are not necessarily ordered by time. Looking at the second page, 05:20:57 is followed by 05:22:23, and then 05:08:10.
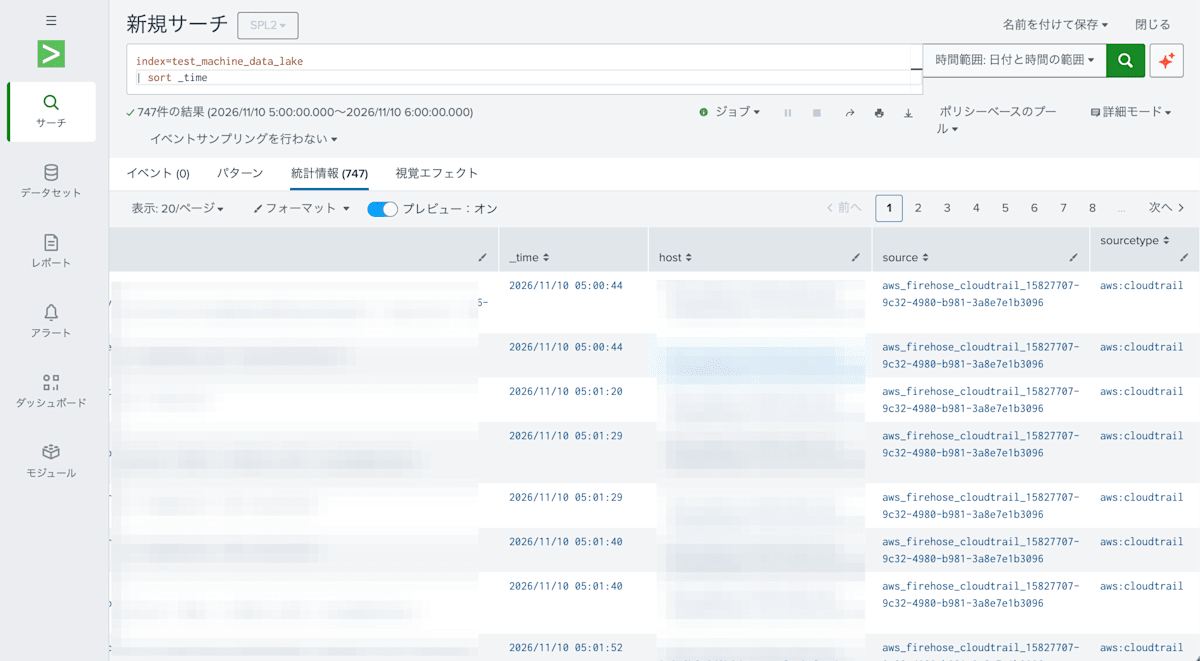
When you want to sort by time, use sort.
index=test_machine_data_lake
| sort _time
Searching inside _raw
You can search against the string in _raw. Here is an example that looks for events where eventName is ListInstances.
index=test_machine_data_lake _raw="*\"eventName\":\"ListInstances\"*"
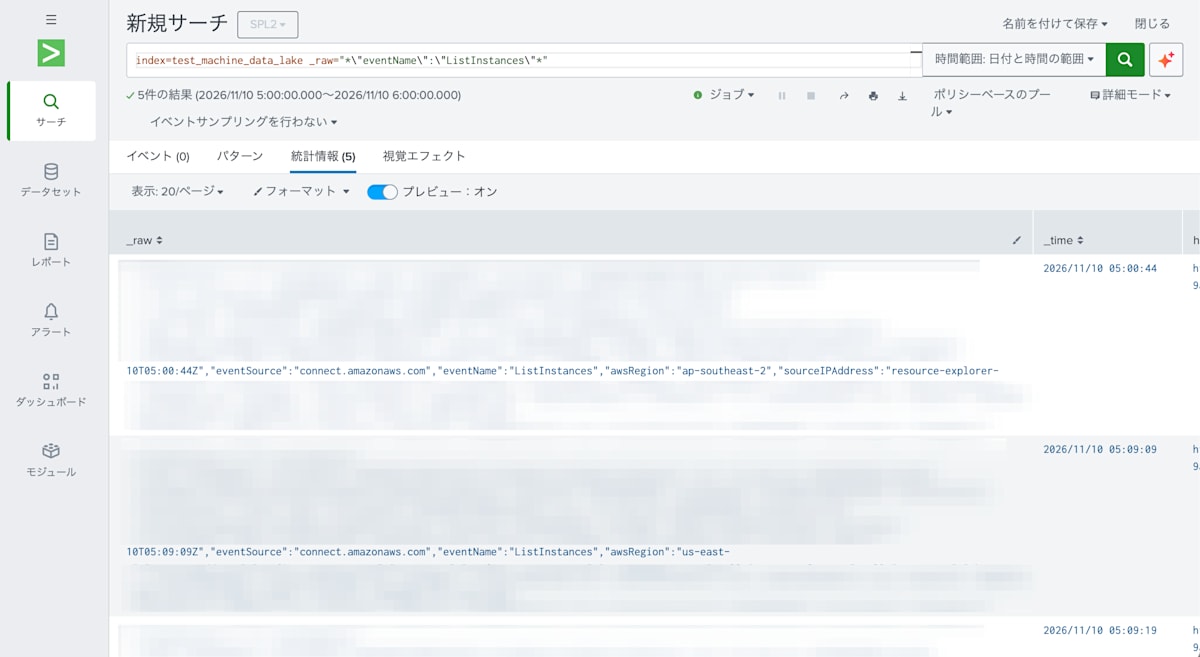
5 events were found. Even though they are not recognized as fields, you can narrow down results as strings.
Search time for all events
I ran a search that retrieves all events (747) for the time range 5:00 to 6:00. The runDuration in the job inspector was 17.851 seconds. Since this verification used a very small amount of data, I suspect that searching data on the order of KB or MB would take even longer.
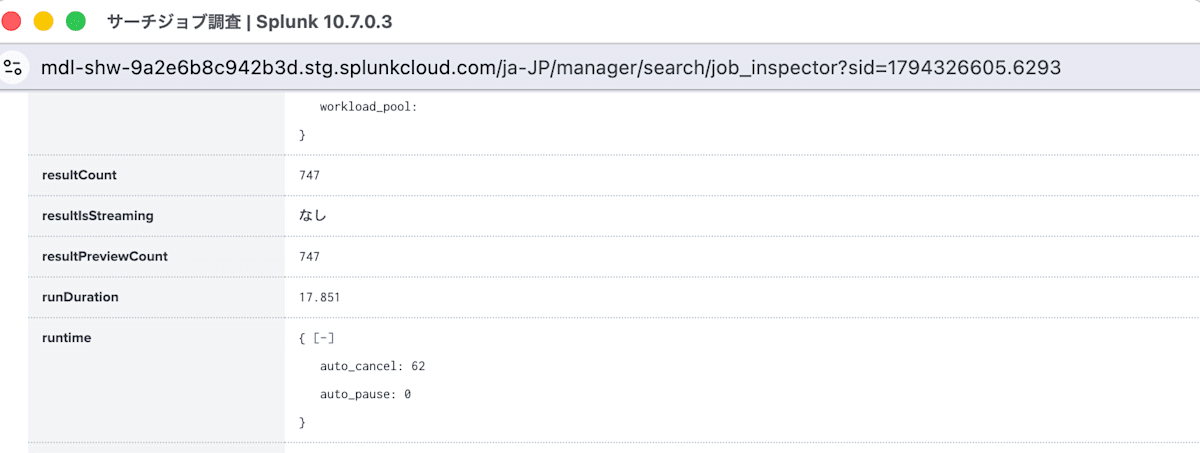
As these checks show, a raw table at least allows string searches within the data. On the other hand, the sort order is not guaranteed, aggregation by field is not possible, and the search speed is slow, so it turns out to be unsuitable for repeated searches and analysis. So, we promote the necessary data.
Supplement: Extract from _raw with rex and aggregate
Even before promotion, you can aggregate by extracting fields from _raw with rex. Here is an example that counts events by eventName.
index=test_machine_data_lake
| rex field=_raw /"eventName":"(?<eventName>[^"]+)"/
| stats count() by eventName
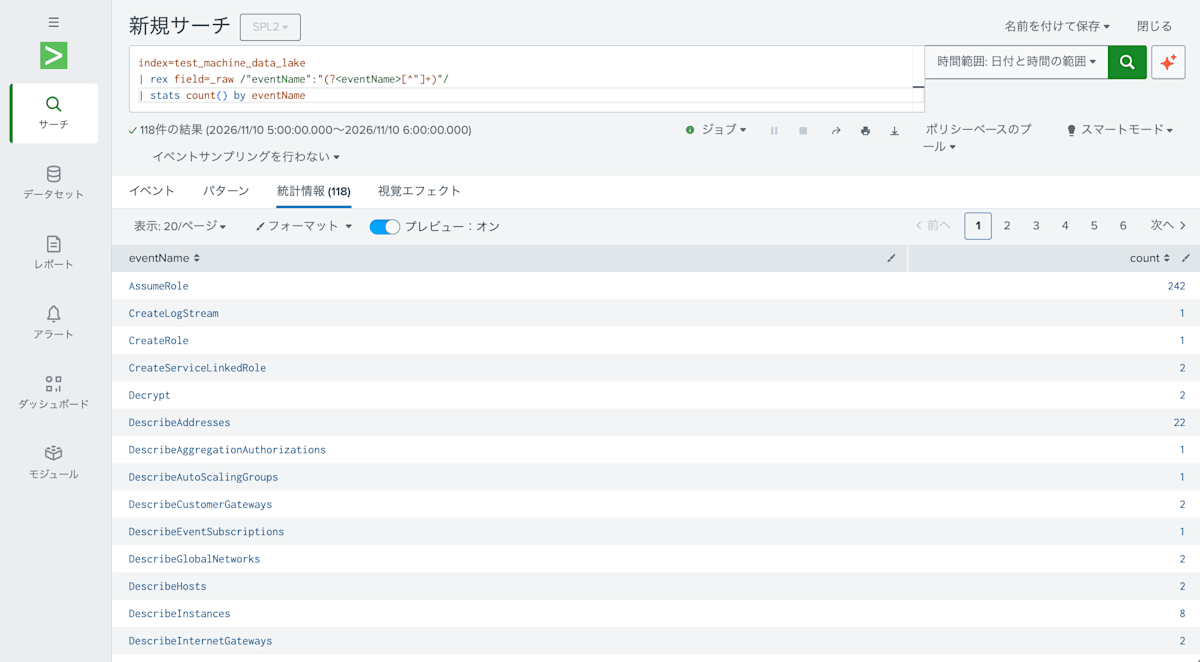
118 kinds of eventName were found, and AssumeRole was the most frequent with 242 events. However, you need to write this rex every time you search. For frequently used items, it is easier to turn them into fields when promoting.
3. Promote CloudTrail to an Analytics table
First, promote to an Analytics table. Select the raw table in the Catalog and click "Promote".
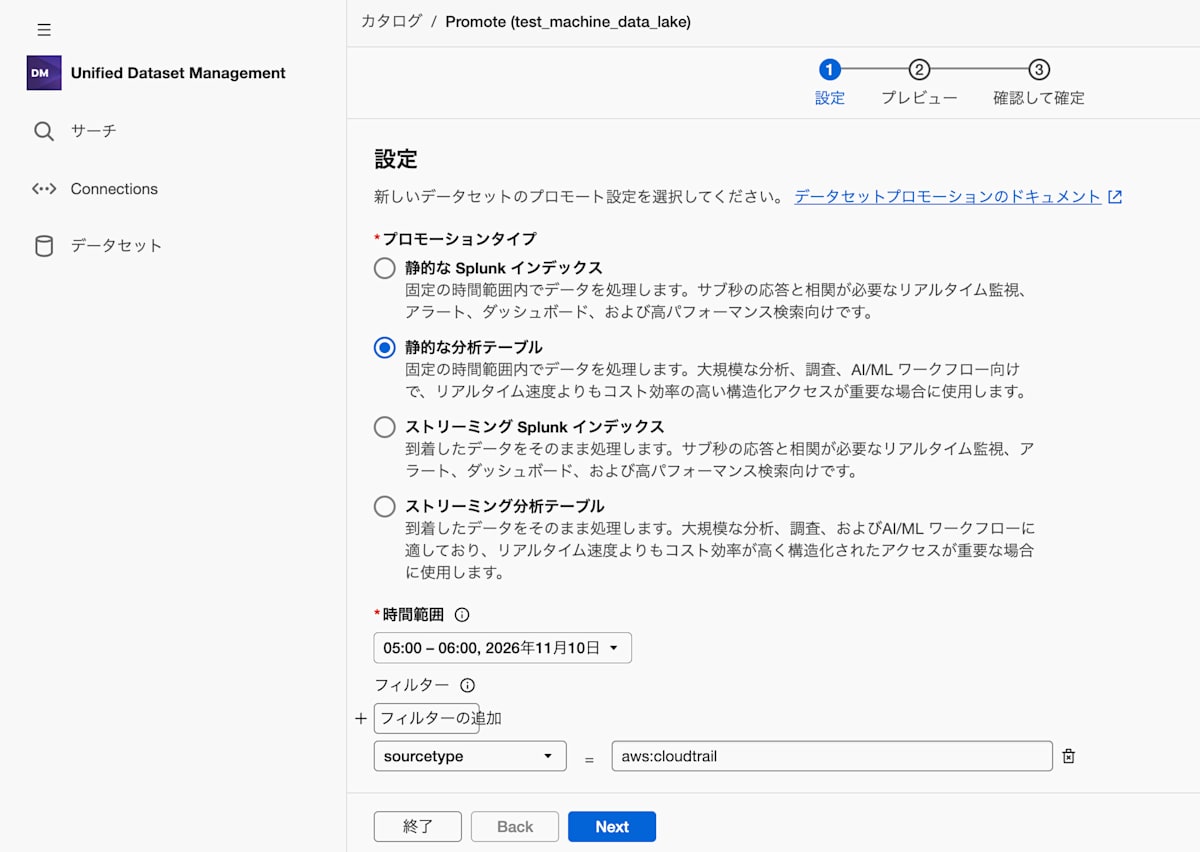
On the settings screen, you choose the promotion type from four options.
- Static Splunk index
- Static analytics table
- Streaming Splunk index
- Streaming analytics table
This time I selected "Static analytics table", set the time range to 05:00 to 06:00 on 2026/11/10, and set the filter to sourcetype = aws:cloudtrail.
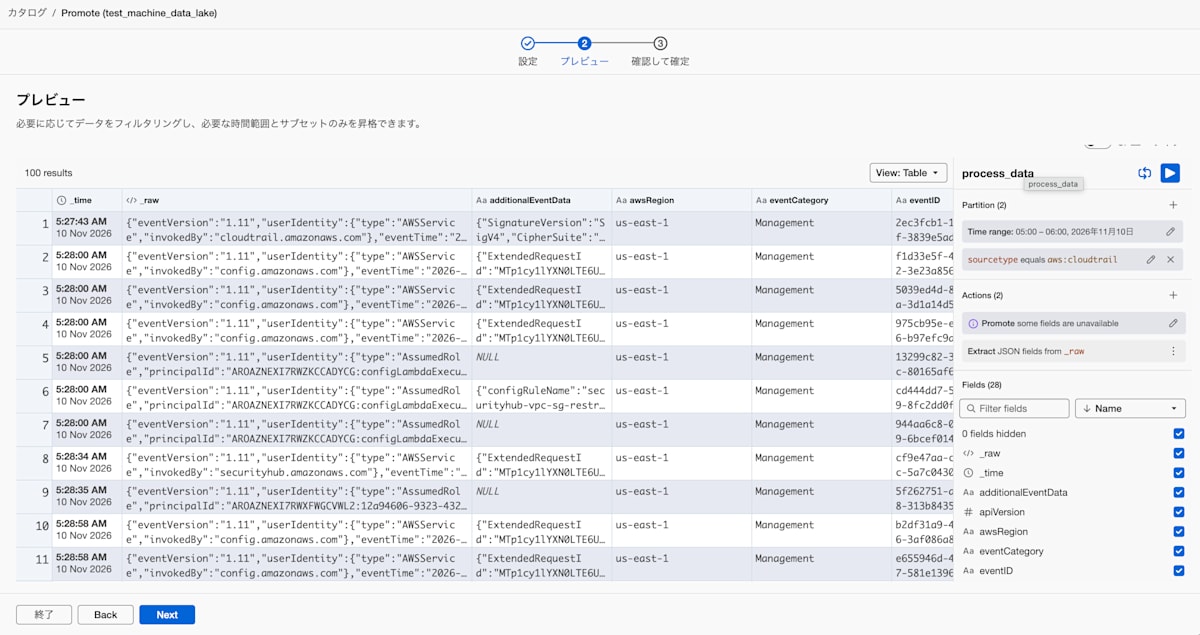
On the next preview screen, you can check the contents of the data to be promoted. At this point, there are only five fields: host, source, sourcetype, _time, and _raw.
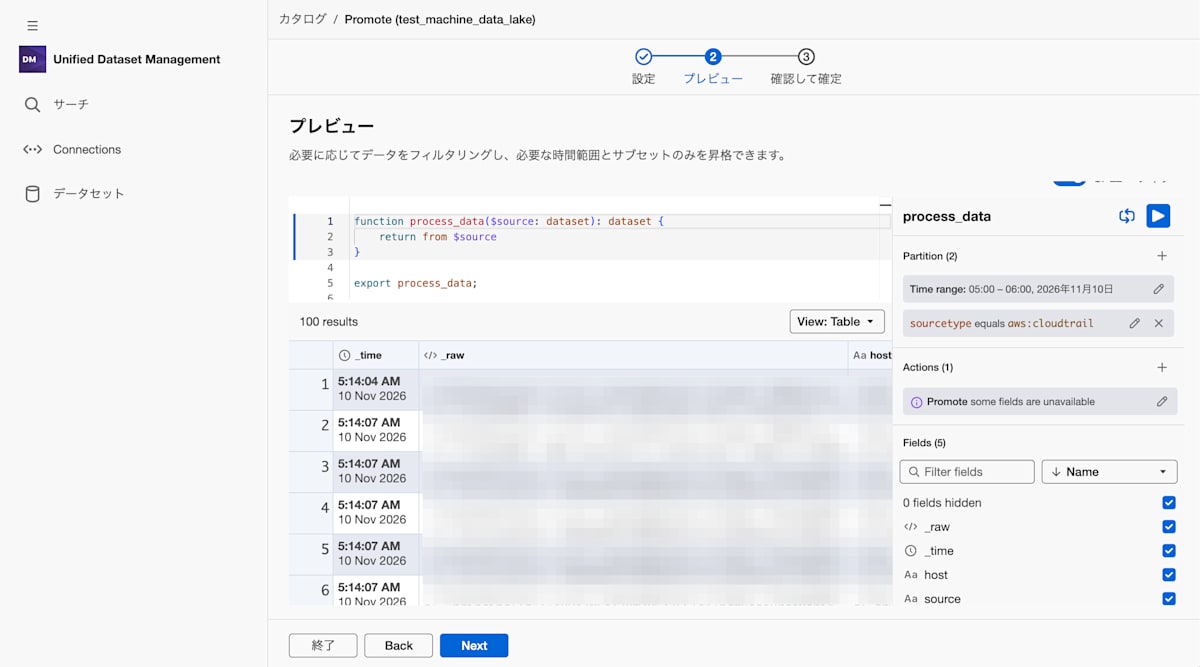
For an Analytics table, you need to select the fields to promote. When you add Actions, you can choose processing such as field extraction and masking.
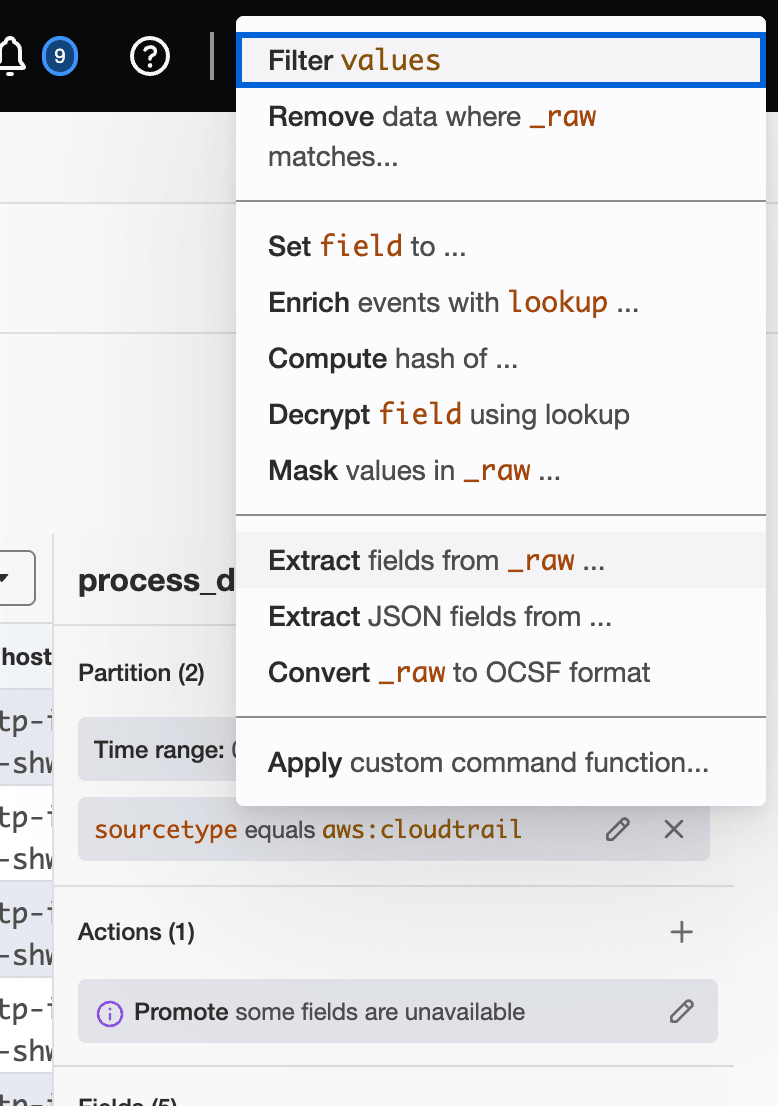
Since CloudTrail is JSON, I select "Extract JSON fields from _raw". The number of fields then became 28.
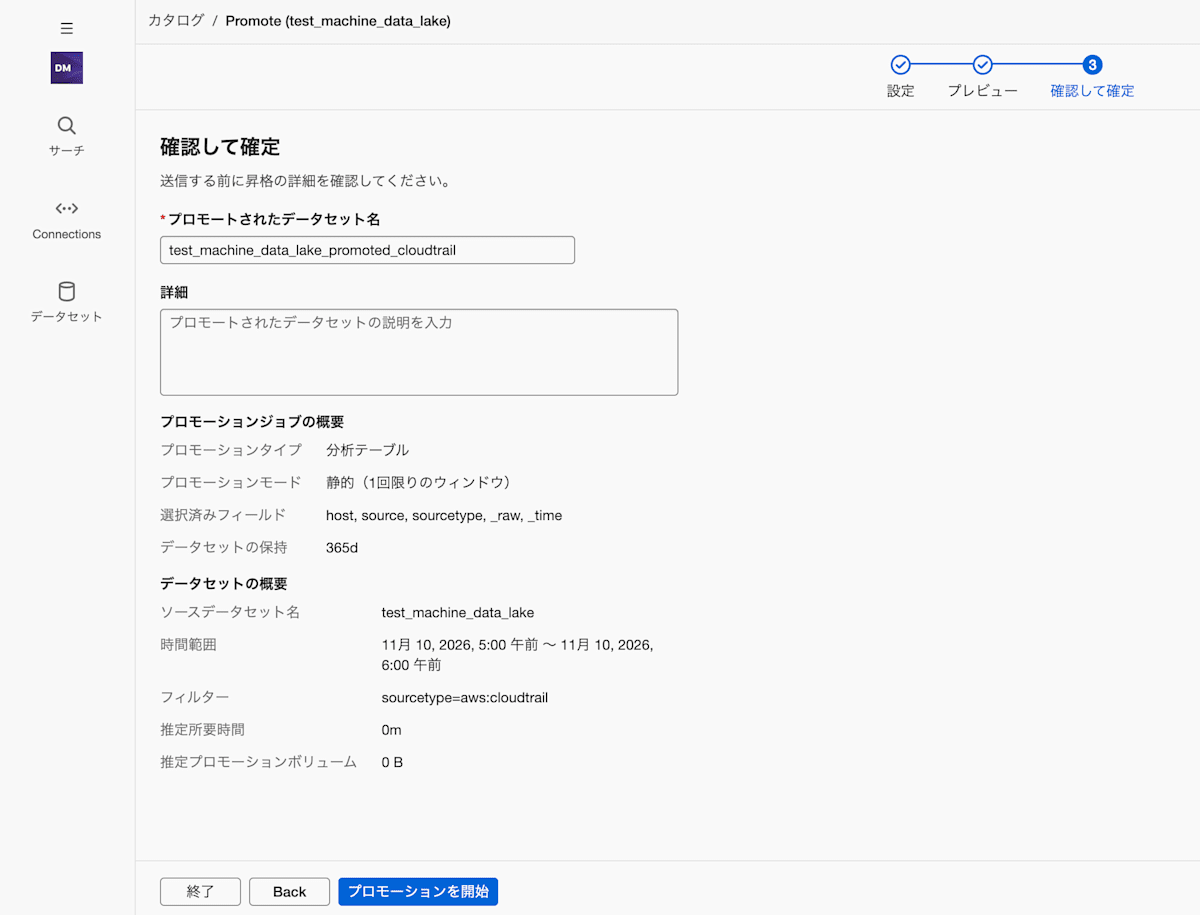
Finally, I named the promoted dataset test_machine_data_lake_promoted_cloudtrail and started the promotion.
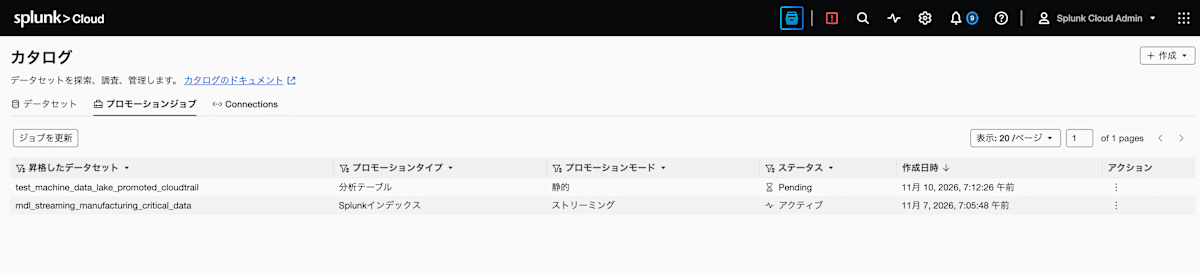
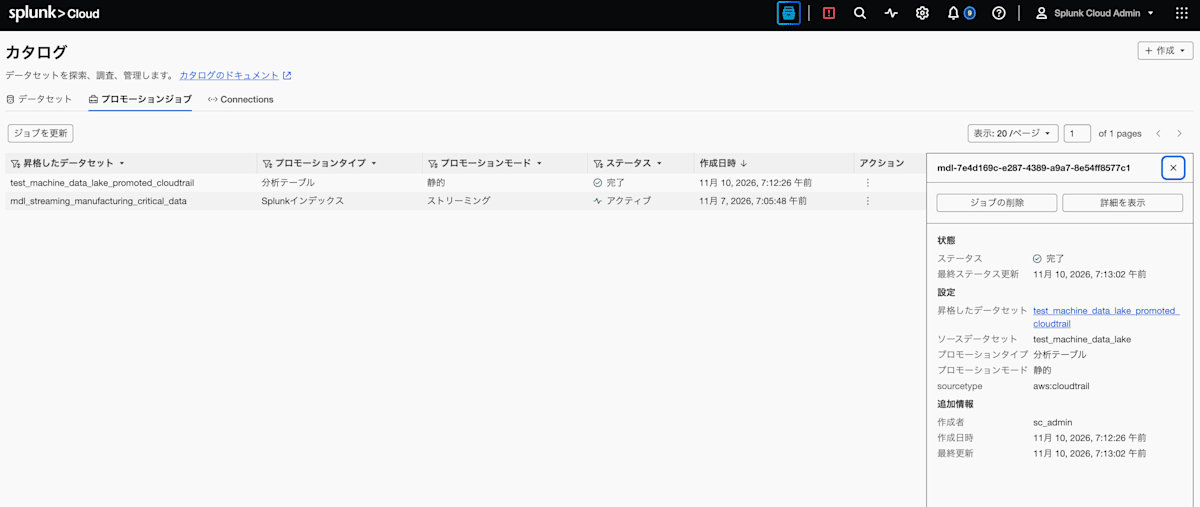
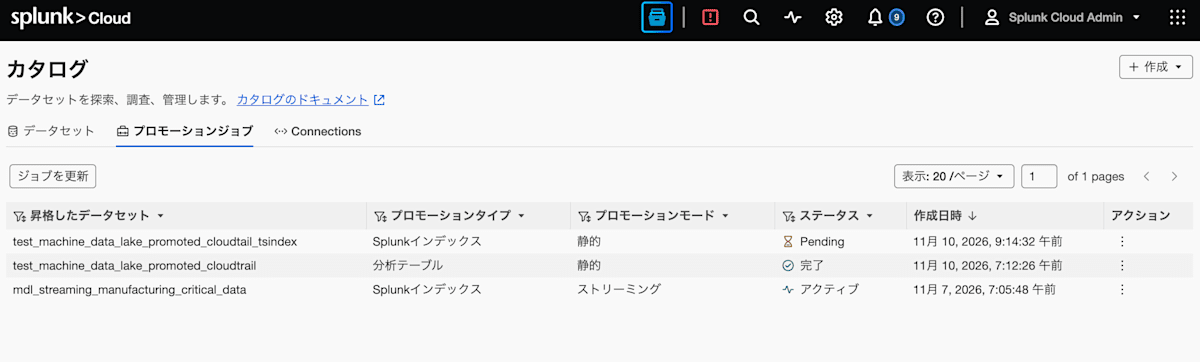
You can check the progress in the "Promotion jobs" tab of the Catalog. It was Pending at first, and after a while it became "Completed".
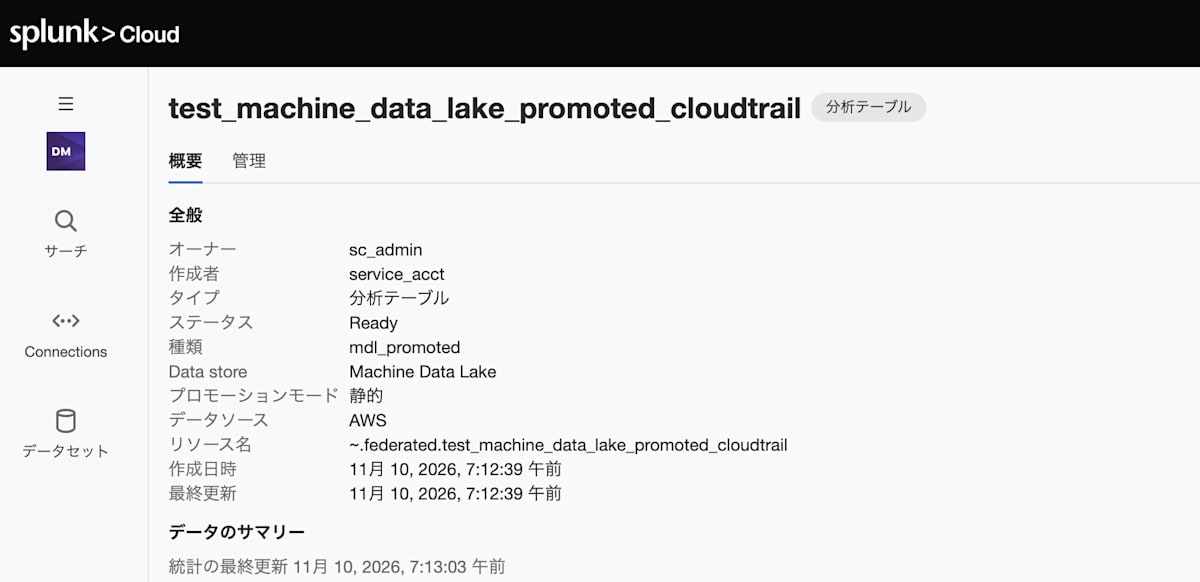
This is the overview of the promoted dataset. The data store is Machine Data Lake and the type is mdl_promoted.
4. Search the Analytics table
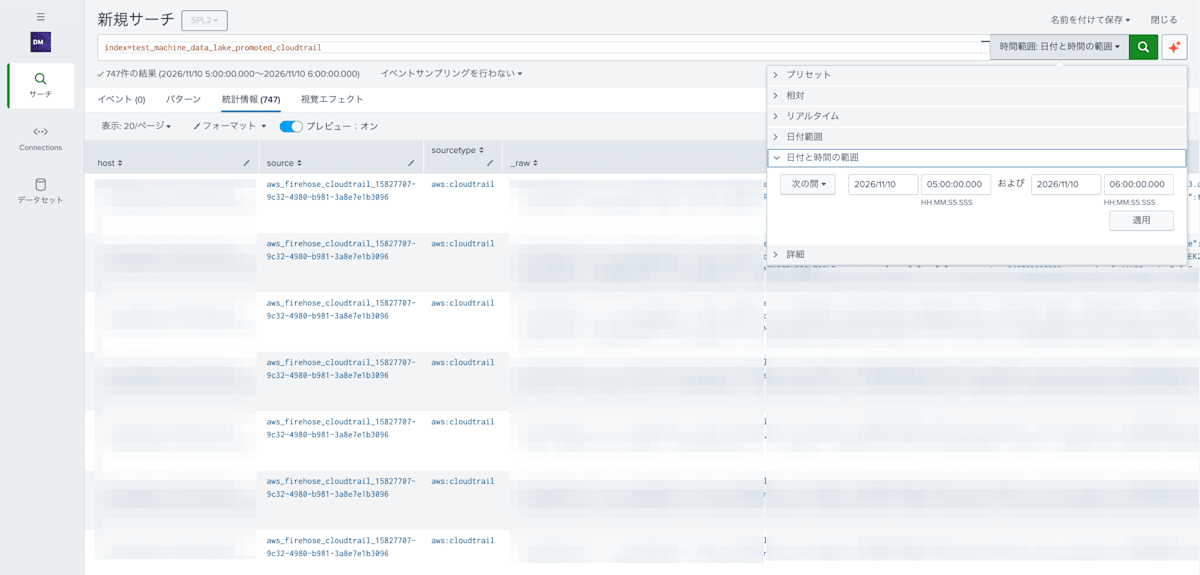
You also search an Analytics table by specifying its name in index=.
index=test_machine_data_lake_promoted_cloudtrail
Like the raw table, the Analytics table could only be searched with SPL2.
747 events were found. As with the raw table, results appear only in the "Statistics" tab, and the "Events" tab shows 0 results. The difference is that the items extracted at promotion time are lined up as columns.
Aggregation by field
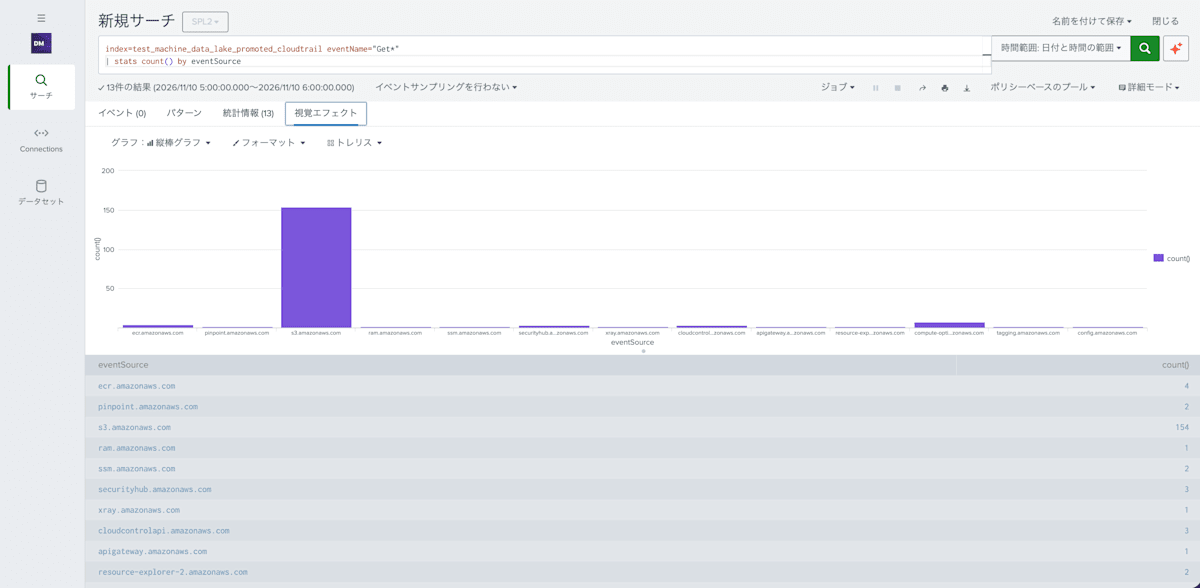
Count events whose eventName starts with Get, by eventSource.
index=test_machine_data_lake_promoted_cloudtrail eventName="Get*"
| stats count() by eventSource
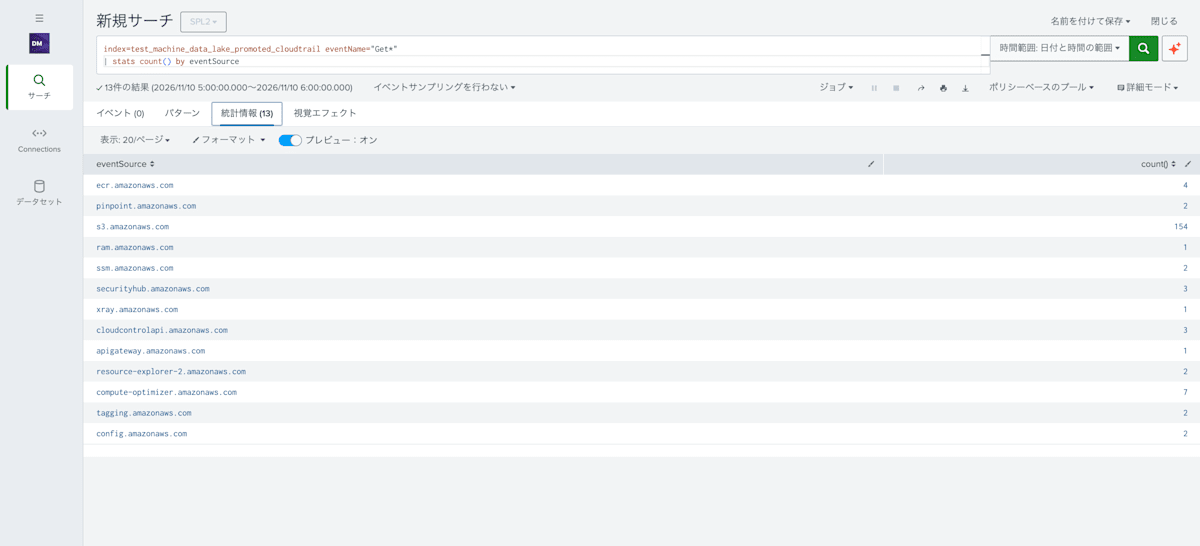
13 results were returned, and s3.amazonaws.com was the most frequent with 154 events. You can also make a bar chart in the "Visualizations" tab.
Events are not displayed
Searching with only eventName="Get*" finds 184 events. However, the "Events" tab says "No results found", and the results are displayed in the "Statistics" tab.
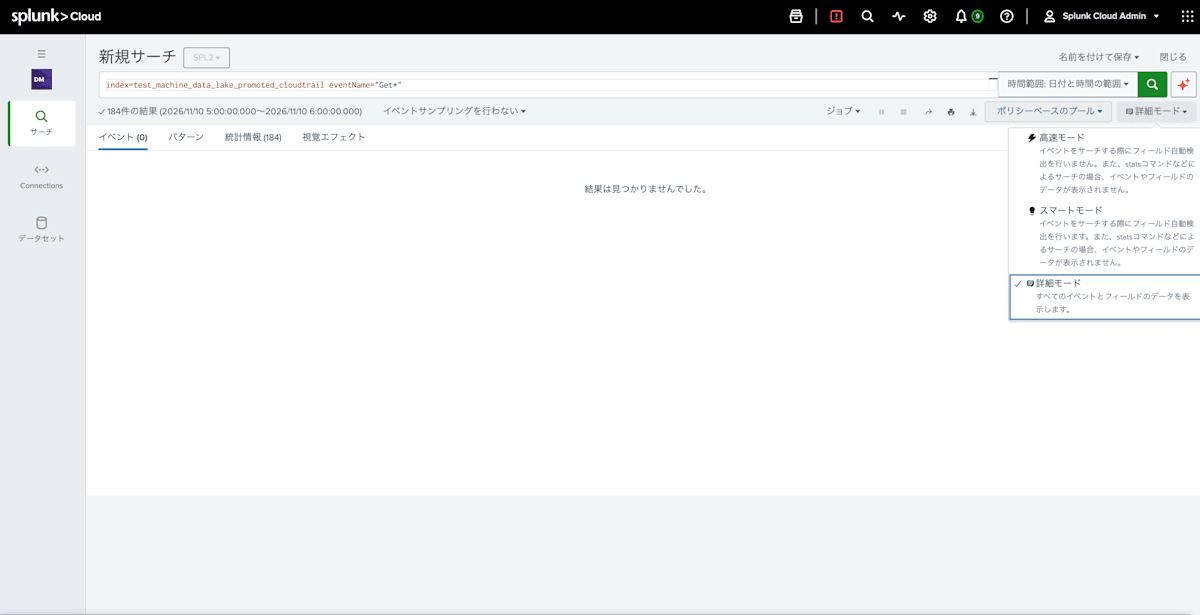
An Analytics table is suited not for viewing events one by one, but for aggregation and analysis.
Sort order
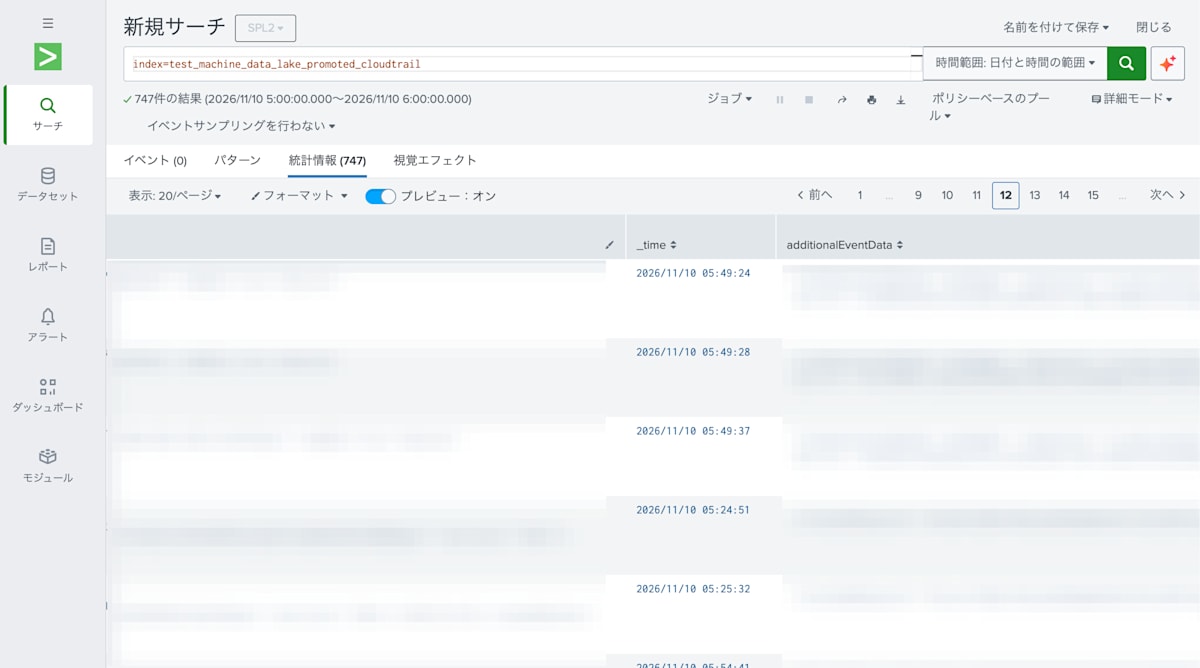
The Analytics table is also not ordered by time unless you add sort. On page 12, 05:49:37 is followed by 05:24:51, going back in time.
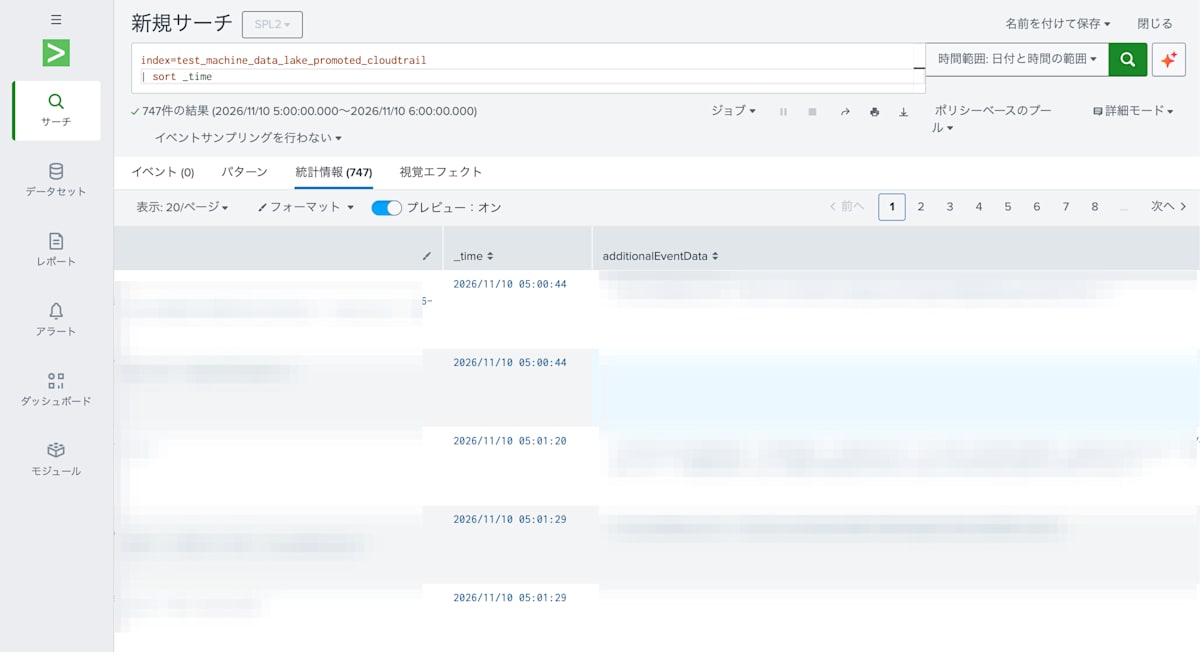
Adding | sort _time puts the results in ascending time order.
Search time for all events
Under the same conditions as the raw table (time range 5:00 to 6:00), I ran a search that retrieves all events (747). The runDuration in the job inspector was 3.519 seconds.
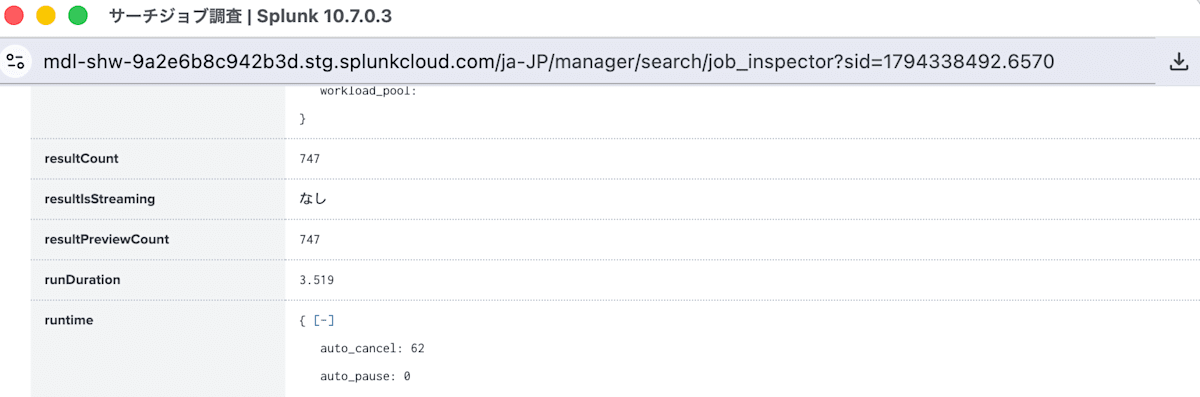
Compared with 17.851 seconds for the raw table, the promoted Analytics table can be searched in a shorter time.
5. Promote the same CloudTrail to a Splunk Index
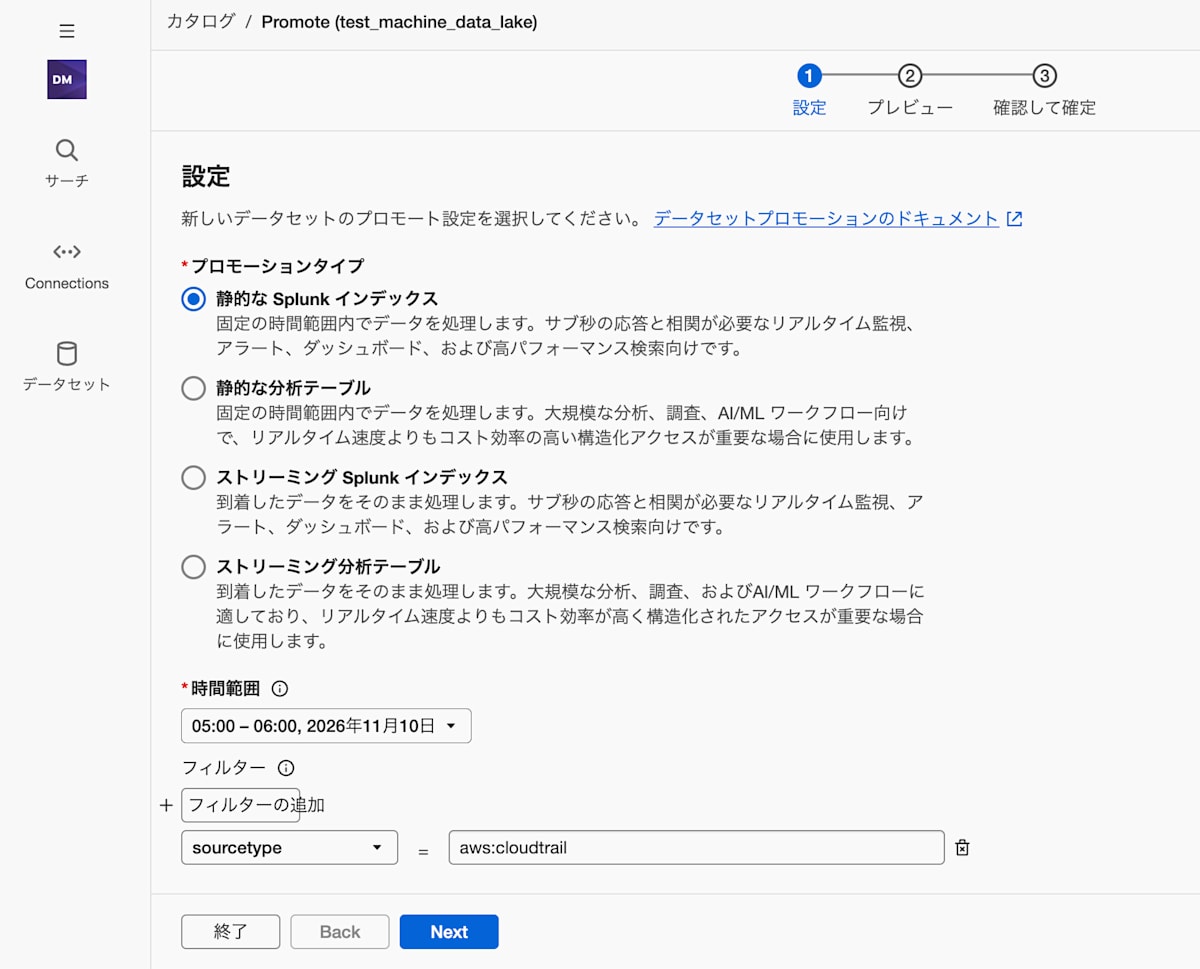
From the same raw table, this time I promote to a Splunk index. I selected "Static Splunk index" as the promotion type, and used the same time range and filter.
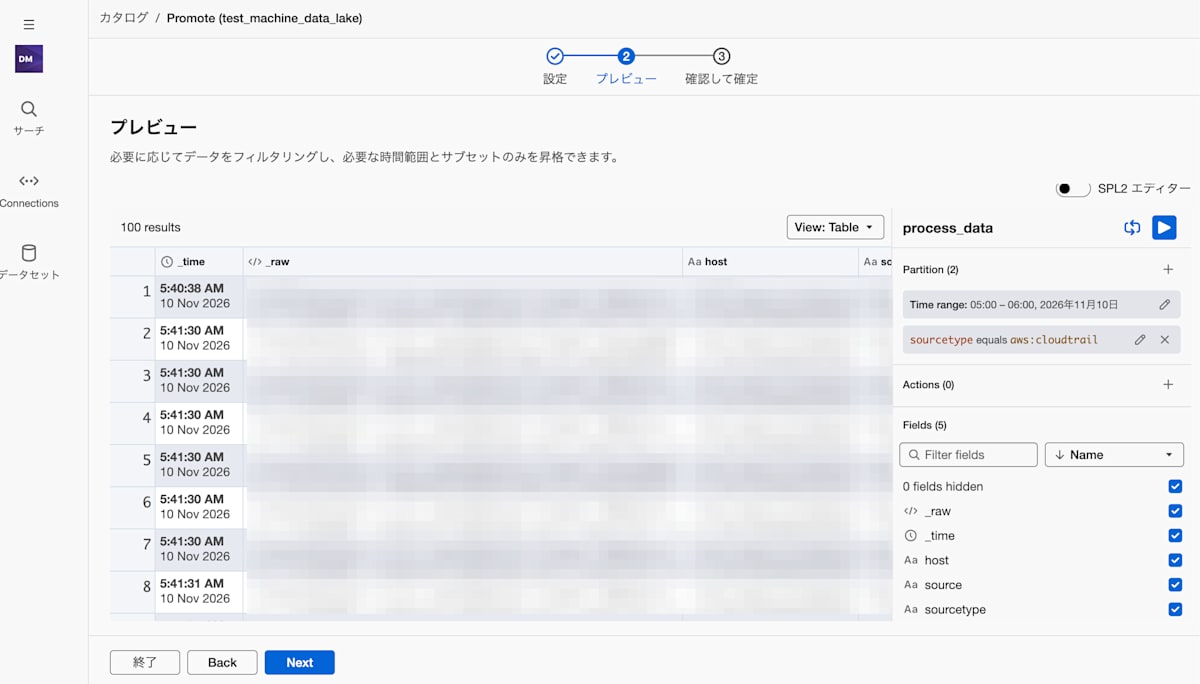
In the preview, there is no need to add Actions for field extraction as there was for the Analytics table.
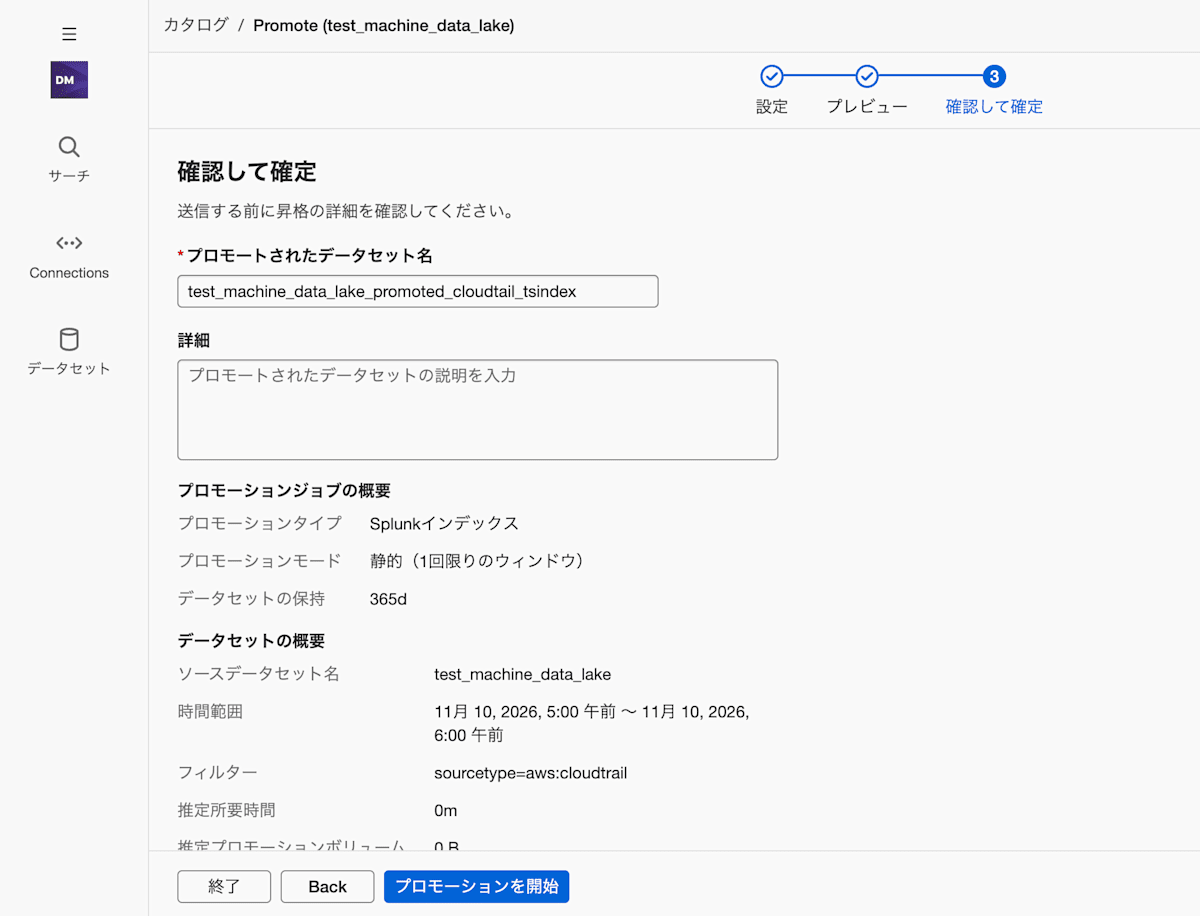
I named the dataset test_machine_data_lake_promoted_cloudtrail_tsindex and started the promotion.
A promotion job is created and is Pending at first. Wait for a while until it completes.
6. Search the Splunk Index
You also search a Splunk index by specifying its name in index=.
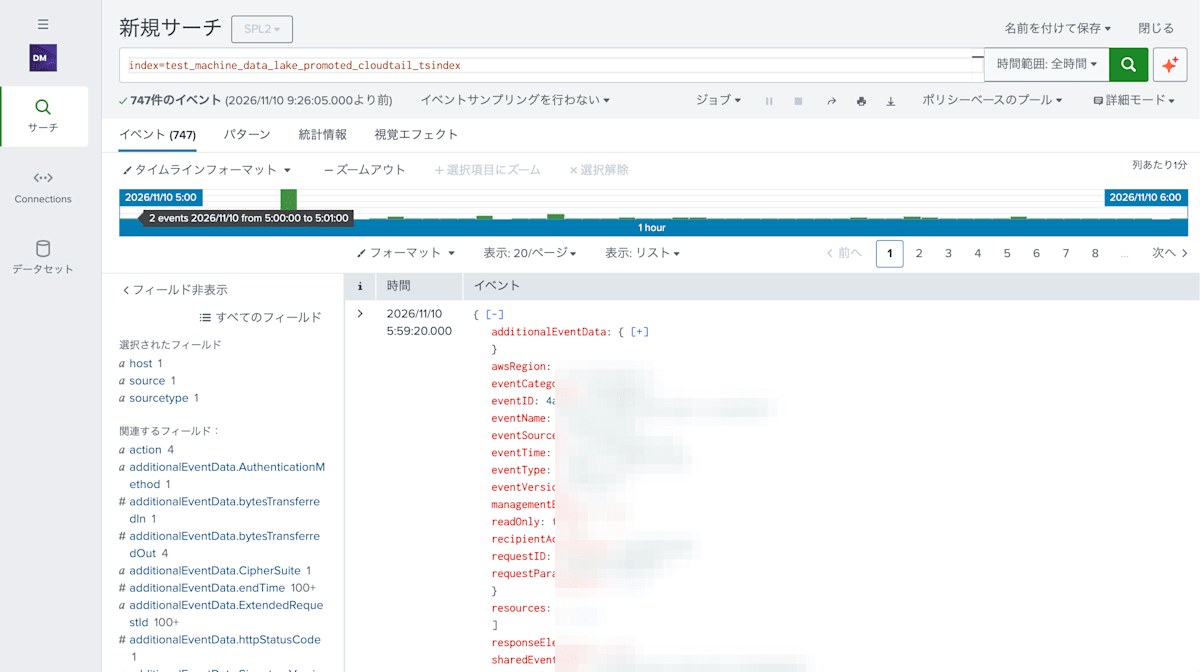
index=test_machine_data_lake_promoted_cloudtrail_tsindex
Unlike the raw table and Analytics table, the Splunk index could also be searched with SPL.
747 events were displayed in the "Events" tab. The JSON is automatically expanded, and items such as eventName and eventSource are listed in the field list on the left. No operation to extract fields at promotion time was needed.
The sort order is descending by time (newest first).
Search time for all events
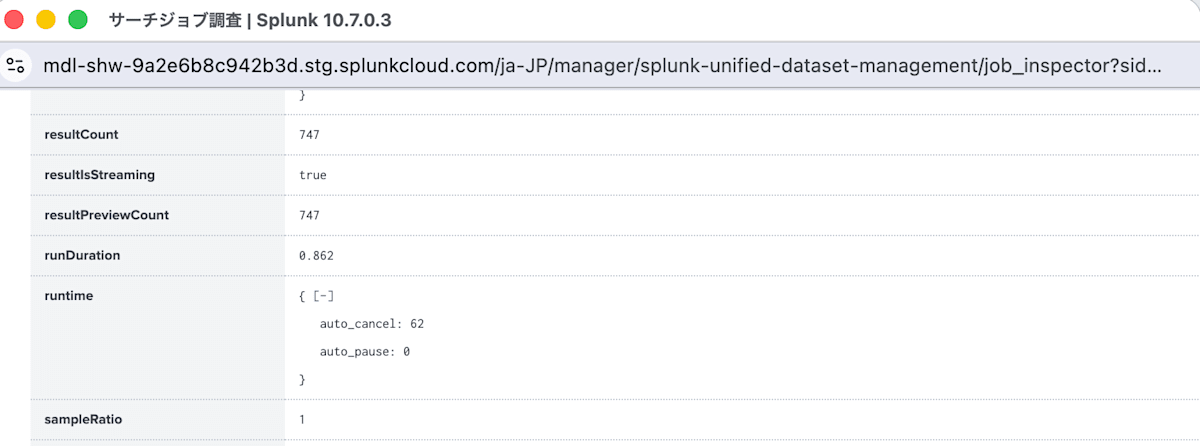
The runDuration of the search that retrieves all events (747) was 0.862 seconds.
Differences between raw table / Analytics table / Splunk index
Here is a summary of the differences found in this verification.
| Item | raw table | Analytics table | Splunk index |
|---|---|---|---|
| Axes available for aggregation | host / source / sourcetype / _time. Items inside _raw are possible if extracted with rex |
JSON automatically recognized by extraction at promotion time (28 fields) | Items automatically extracted by Splunk TA, etc. |
| Field extraction at promotion | - | Required (JSON extraction) | Not required |
| How search results appear | Statistics tab only | Statistics tab and Visualizations | All (Events, Patterns, Statistics, Visualizations) |
| Search language | SPL2 only | SPL2 only | SPL also possible |
| Order by time | Random | Random | Descending |
| Search time to retrieve all events (747) | 17.851 seconds | 3.519 seconds | 0.862 seconds |
Guidelines for choosing between them are as follows.
- raw table: Checking whether data has come in, and narrowing down by strings
- Analytics table: When you want to select items and perform aggregation and analysis
- Splunk index: When you want to view events one by one, or use them for monitoring, dashboards, and alerts
Supplement: Sending to a raw table from a UF with Direct routing
Up to this point, I used Pipeline routing to divert data that already reaches Splunk Cloud to the raw table. When adding a new data source, you can also use Direct routing, which sets the raw table directly as the destination in the source's configuration.
For a Universal Forwarder (UF), specify the resource name of the raw table in the index of the input. The resource name is in the format ~.federated.<raw table name>. With a UF, you do not need to change outputs.conf.
This time, I configured a script input like the following in the UF's inputs.conf. It is a setting that reads auditd logs converted into a readable form with ausearch, using rlog.sh.
# This script reads the auditd logs translated with ausearch
[script://./bin/rlog.sh]
sourcetype = auditd
source = auditd
interval = 60
disabled = 0
index = ~.federated.test_machine_data_lake
The key point is that index specifies the resource name of the raw table from earlier (~.federated.test_machine_data_lake). This single line makes the raw table the destination.
When I sent Linux audit logs (auditd) from the UF, they went into the same raw table test_machine_data_lake.
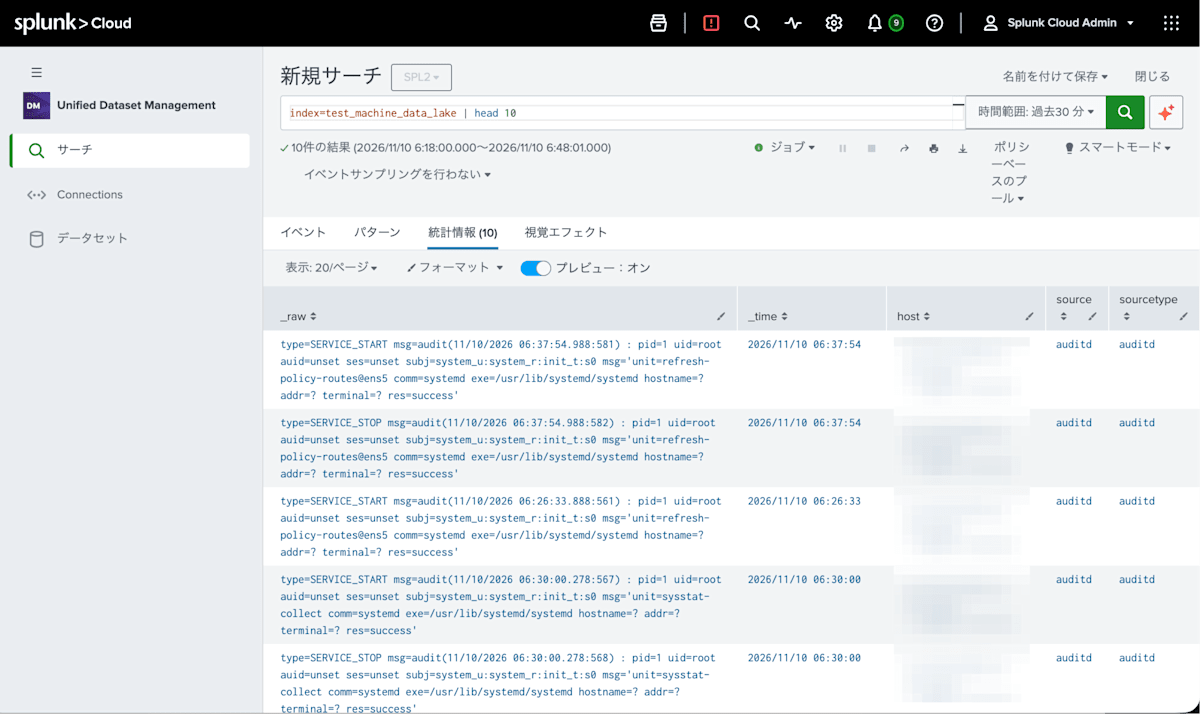
At this time, I did not change anything in the raw table's landing definition. The landing definition remains only sourcetype equals aws:cloudtrail, which is for diverting CloudTrail. The auditd data sent from the UF enters the raw table with only the source-side setting, regardless of the landing definition.
In other words, this raw table receives data through two routes: Pipeline routing (CloudTrail) and Direct routing (auditd).
Summary
I tried Machine Data Lake with CloudTrail that was already being ingested.
I learned that you can easily configure, within Splunk alone, a usage pattern where you first accumulate data in a raw table and then extract only the data whose use has been decided into a promotion destination that suits the purpose.
Instead of "just put everything into an Index for now," you can now choose the retention destination and usage for each kind of data, which made it easier, I felt, to build a data strategy in Splunk. I also expect that it will become possible to use data more affordably and more easily when needed.
I hope this is helpful for those who are concerned about retention and search costs as the logs handled in Splunk grow.
Reference links
- Get started with Machine Data Lake
- Create a Machine Data Lake raw table
- Choose how to route data to Machine Data Lake
- First-time setup instructions for the Ingest Processor solution
- Prepare a data source for Machine Data Lake
- Machine Data Lake prerequisites
- Onboarding and promoting data with Cisco Data Fabric powered by the Splunk platform(Splunk Lantern)
- Promote data to an analytics table
- Promote data to a Splunk index
- Search Machine Data Lake data from the Catalog
- Data ingestion mechanisms and intervals in Data Manager
- Specific differences between SPL and SPL2
- sort command: Overview, syntax, and usage(SPL2)
- rex command: Overview, syntax, and usage(SPL2)