
I tried enabling the MySQL Endpoint of TiDB Cloud Lake and visualizing logs from Grafana

This page has been translated by machine translation. View original
Hello, I'm sora from the Game Solutions Division.
This time, I'll write about enabling the MySQL Endpoint for TiDB Cloud Lake and visualizing logs stored in Lake from Grafana.
Enabling the MySQL Endpoint
To connect from tools that can only use the MySQL protocol, such as Grafana's MySQL data source, you need to enable the MySQL Endpoint.
The MySQL Endpoint is disabled by default, and enabling it requires submitting a support ticket.
Once approved, it becomes available at the account level, and from there you can toggle it on/off per Warehouse.
Open the Warehouse settings from Admin > Warehouses and turn on Enable MySQL Endpoint under Advanced Options.
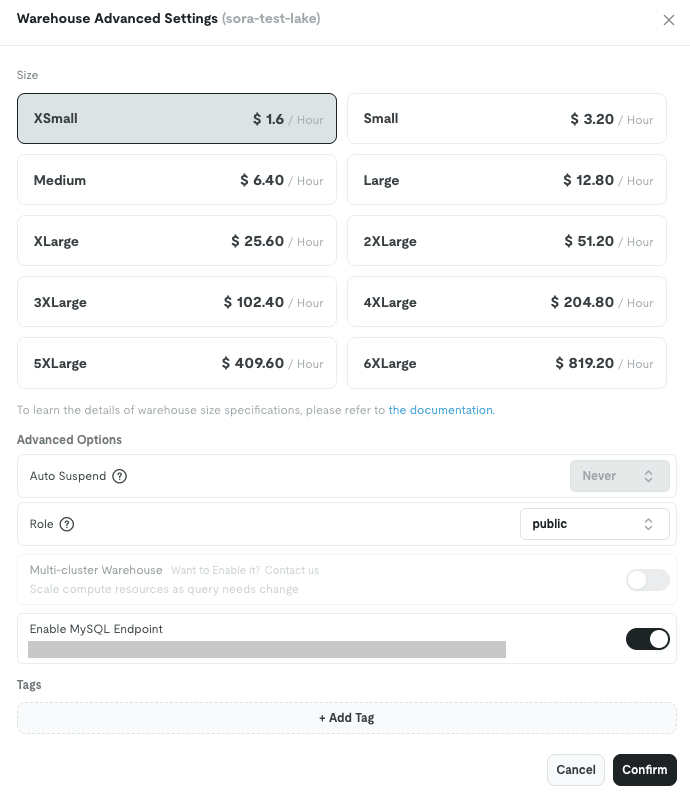
The moment I turned it on, the Auto Suspend dropdown was locked to Never and grayed out.
This is how the following behavior described in the official documentation appears on screen.
When MySQL Endpoint is enabled, Auto Suspend is automatically disabled (set to 0) for the warehouse. This means the warehouse will remain running continuously and incur costs even when idle.
In other words, once you turn on the MySQL Endpoint, that Warehouse will keep running until you stop or delete it yourself.
Below the toggle, the hostname dedicated to that Warehouse is displayed.
It takes the form <tenant>-<warehouse name>-<id>.ep.aws-ap-northeast-1.default.lake.tidbcloud.com, with a different hostname for each Warehouse.
Checking the Connection Information
Let's open Connect from the Warehouse list.
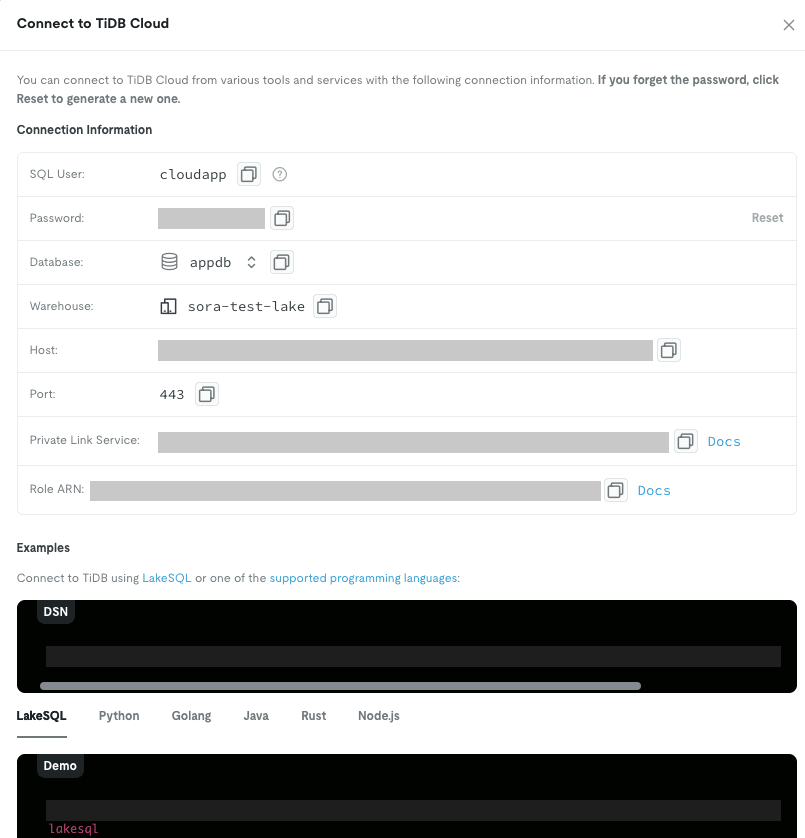
The Host shows <tenant>.gw.aws-ap-northeast-1.default.lake.tidbcloud.com and the Port shows 443, but this is the connection information for lake:// used by LakeSQL and language-specific drivers.
This is different from the MySQL Endpoint hostname (<tenant>-<warehouse name>-<id>.ep....) shown in the settings screen earlier, and even when sora-test-lake with MySQL Endpoint enabled was selected, the display on this screen did not change.
When connecting via MySQL, I used the MySQL Endpoint hostname from the settings screen and connected on the standard MySQL port 3306.
The username and password from the Connect dialog worked as-is.
Comparing the two connection paths side by side:
| Item | lake:// (LakeSQL, language-specific drivers) |
MySQL Endpoint |
|---|---|---|
| Host | <tenant>.gw.<region>... (shared per tenant) |
<tenant>-<warehouse>-<id>.ep.<region>... (per Warehouse) |
| Port | 443 | 3306 |
| Warehouse specification | ?warehouse= query parameter |
Included in the hostname |
Let's try connecting with the mysql client.
For the logs, I'll use appdb.app_logs that was loaded into Lake in the following article.
There are 500,000 rows of logs containing level / service / message, a JSON attributes field (stored as VARIANT on the Lake side), and logged_at.
$ mysql -h $H -P 3306 -u cloudapp --ssl-mode=REQUIRED -e "SELECT VERSION();"
version()
8.0.90-v1.2.942-nightly-43828ad679(rust-1.94.0-nightly-2026-09-13T22:15:15.214402223Z)

$ mysql -h $H -P 3306 -u cloudapp --ssl-mode=REQUIRED -D appdb -e "SELECT COUNT(*) FROM app_logs;"
COUNT(*)
500000
VERSION() starts in MySQL 8.0 format, with Rust build information appended at the end.
TiDB Cloud Lake is based on Databend, which shows up here as well.
Note that MySQL-specific statements like SHOW STATUS do not work.
ERROR 1105 (HY000) at line 1: SyntaxException. Code: 1005, Text = error:
  --> SQL:1:6
  |
1 | SHOW STATUS LIKE 'Ssl_cipher'
  |      ^^^^^^ unexpected `STATUS`. Did you mean `SHOW STAGES`, `SHOW DATABASES`, or `SHOW FUNCTIONS`?
The error is coming from Lake's parser, not MySQL.
The structure is such that only the protocol is MySQL, while the SQL remains Lake's.
TLS Is Not Enforced
Connecting with --ssl-mode=DISABLED also worked.
$ mysql -h $H -P 3306 -u cloudapp --ssl-mode=DISABLED -e "SELECT 1;"
1
1
Since TLS is not enforced on the server side, if the client specifies nothing, the connection will be made in plain text.
Adding a MySQL Data Source to Grafana
Grafana is self-hosted on ECS Fargate, running OSS version 13.2.2.
From the left menu, go to Connections > Add new connection, search for MySQL, and add it.
Since it's a core built-in data source, no plugin installation is needed.
The settings screen looks like this:
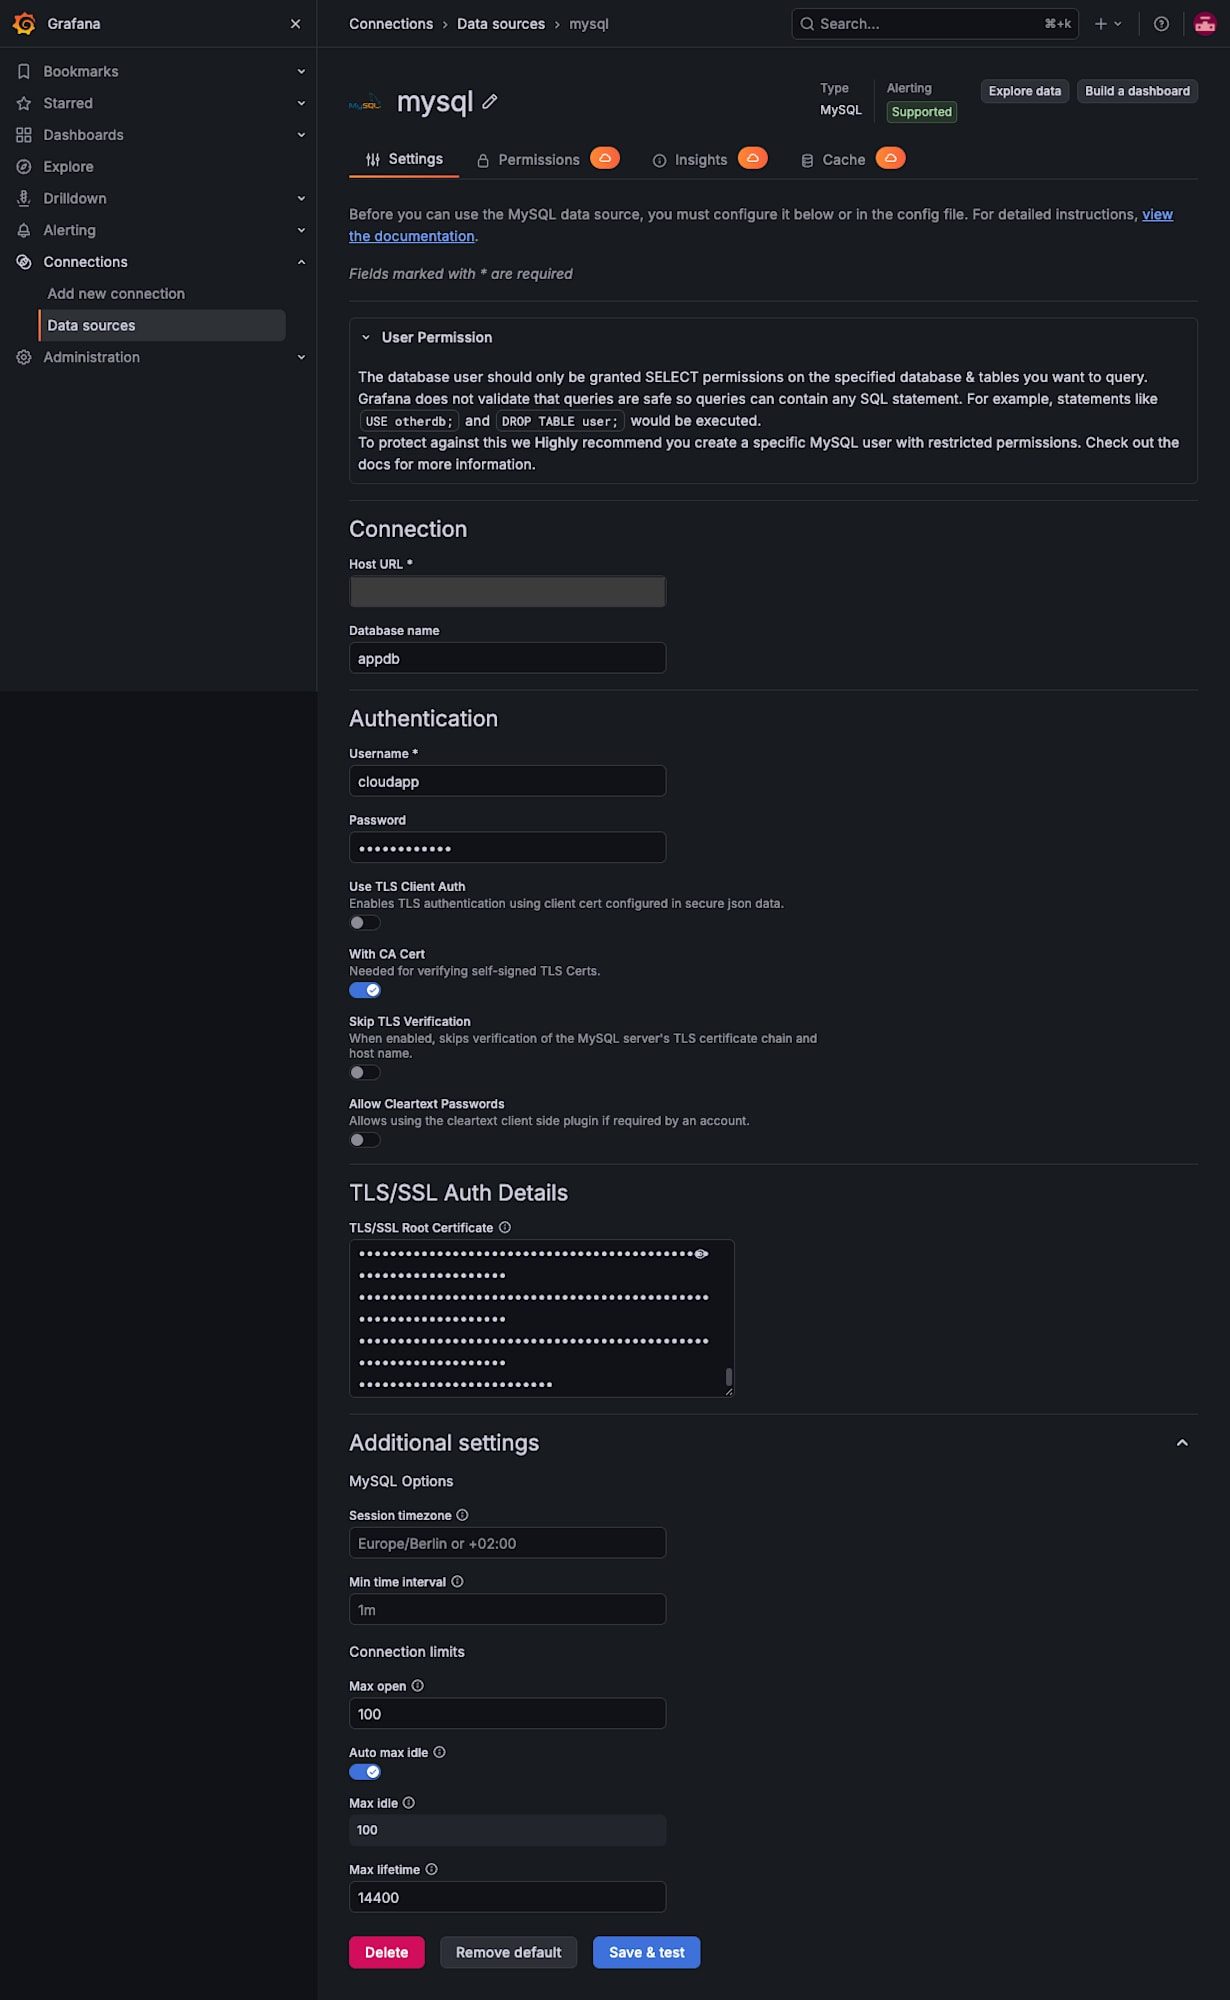
Enter <MySQL Endpoint hostname>:3306 for the Host URL, appdb for the Database name, and the values from the Connect dialog for Username and Password.
For TLS, I enabled With CA Cert and pasted ISRG Root X1, the Let's Encrypt root certificate, into the TLS/SSL Root Certificate field.
If you don't configure any TLS-related toggles in Grafana's MySQL data source, it connects in plain text.
As we saw earlier, the Lake side also accepts plain text connections, so Save & test will pass even without any configuration.
Clicking Save & test resulted in Database Connection OK.
Viewing Logs in Explore
In Explore, select mysql as the data source and display raw logs in Table format.
Grafana's MySQL data source has macros for handling time ranges, and normally you would write $__timeFilter(logged_at).
However, this macro expands to MySQL's FROM_UNIXTIME, and since Lake doesn't have that function, it results in UnknownFunction.
The same applies to $__timeGroup for time series, which expands to UNIX_TIMESTAMP.
Instead, I used $__unixEpochFilter and $__unixEpochGroup, which are designed for columns that store time as a numeric UNIX timestamp in seconds.
These expand to numeric comparisons without wrapping functions, so passing a column where logged_at is converted to a numeric value in seconds using Lake's TO_UNIX_TIMESTAMP works fine.
SELECT logged_at AS time, message, level, service
FROM (SELECT *, TO_UNIX_TIMESTAMP(logged_at) AS ts FROM appdb.app_logs) t
WHERE $__unixEpochFilter(ts)
ORDER BY logged_at DESC
LIMIT 500
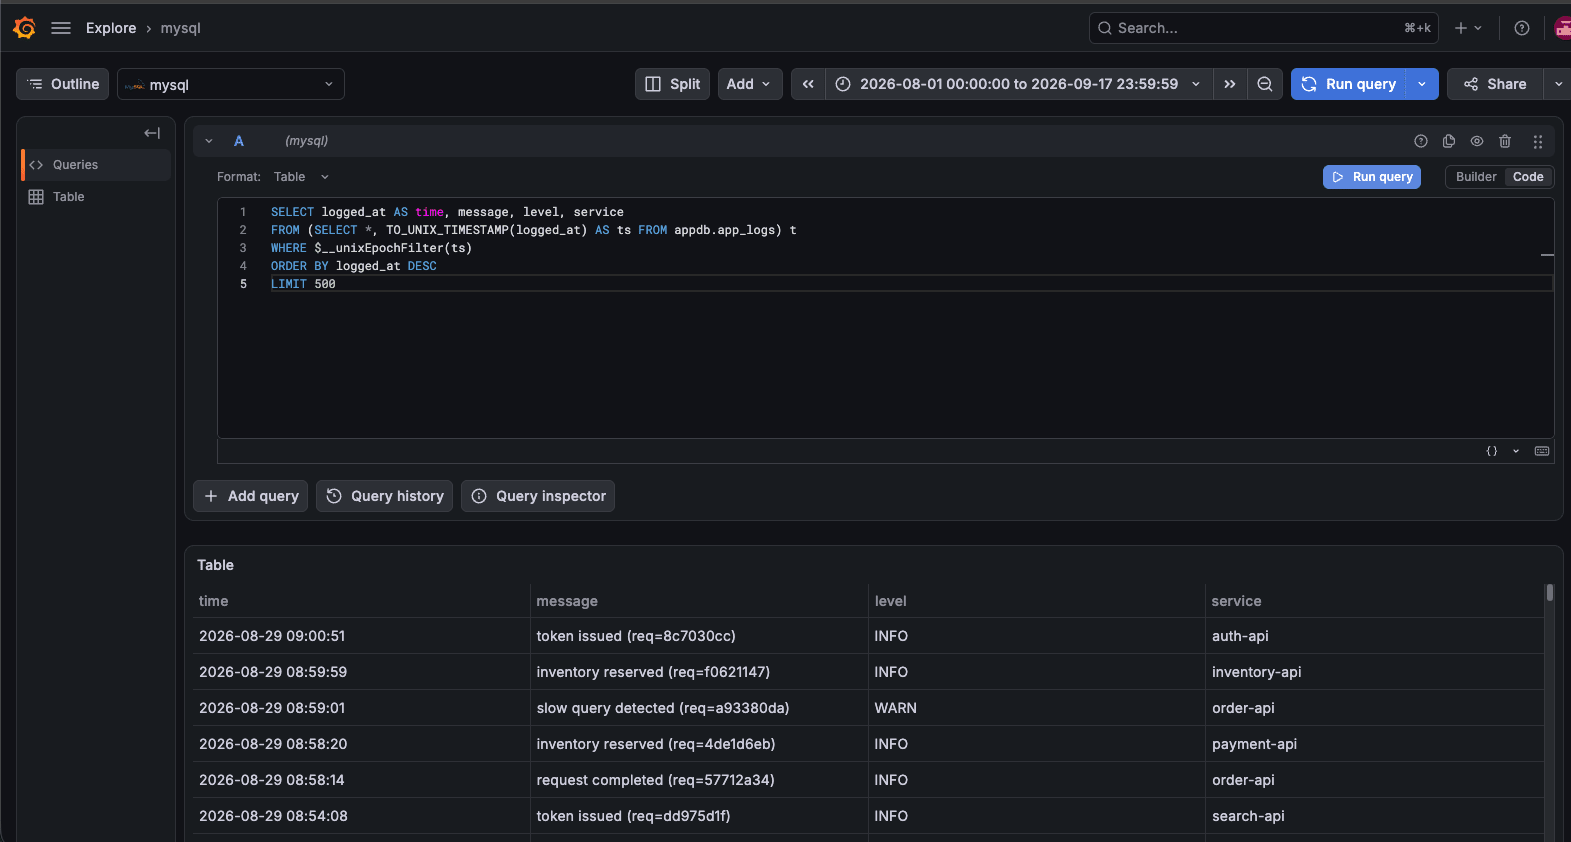
message, level, and service are displayed as rows, with no need for conversion to a log-specific format.
Creating a Time Series
The trend of counts by level can also be written in the same format.
Set Format to Time series and round to hourly intervals using $__unixEpochGroup.
SELECT
  $__unixEpochGroup(ts, '1h') AS time,
  level AS metric,
  COUNT(*) AS value
FROM (SELECT *, TO_UNIX_TIMESTAMP(logged_at) AS ts FROM appdb.app_logs) t
WHERE $__unixEpochFilter(ts)
GROUP BY 1, 2
ORDER BY 1
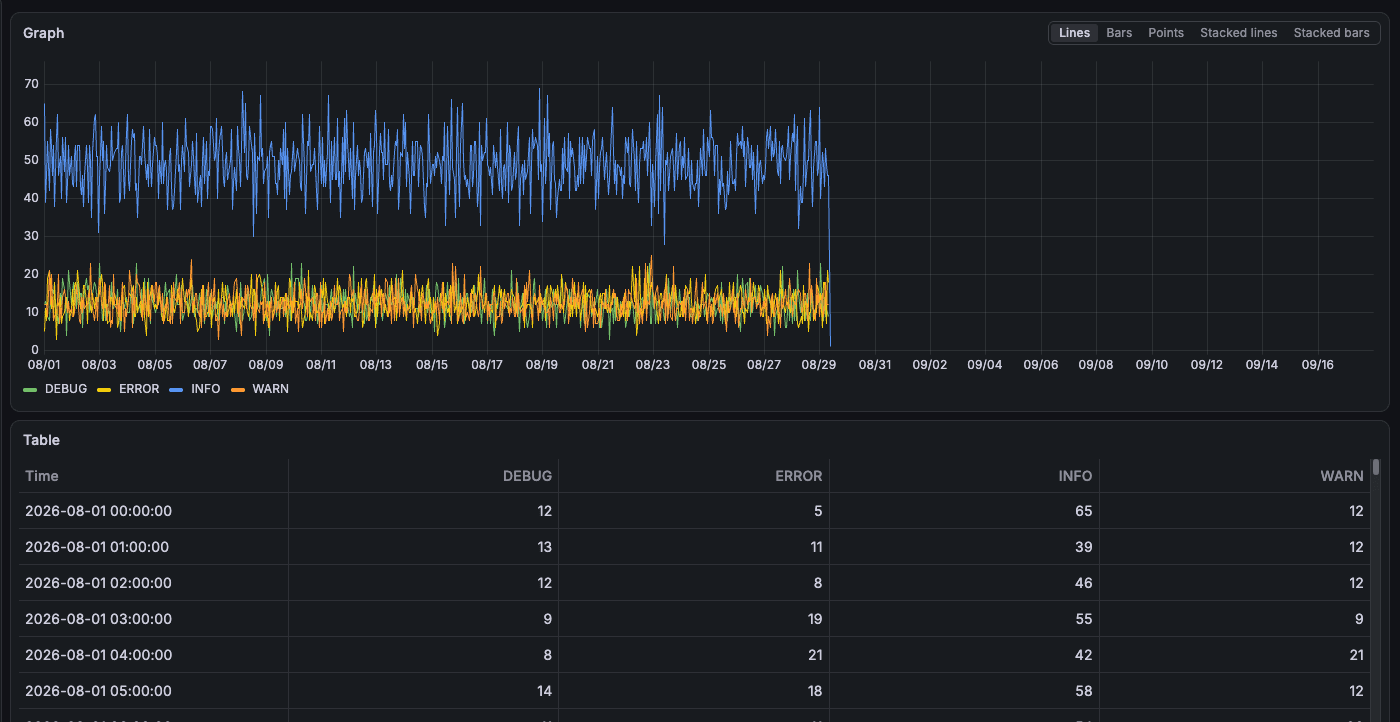
Four series appeared: DEBUG / ERROR / INFO / WARN.
The time column remains a numeric value in seconds, but Grafana interprets a numeric time as a UNIX timestamp.
The MySQL data source rule that naming the third string column metric makes it the series name also works as expected.
Creating a Dashboard
I took the queries that worked in Explore, turned them into panels, and built a dashboard in Grafana.
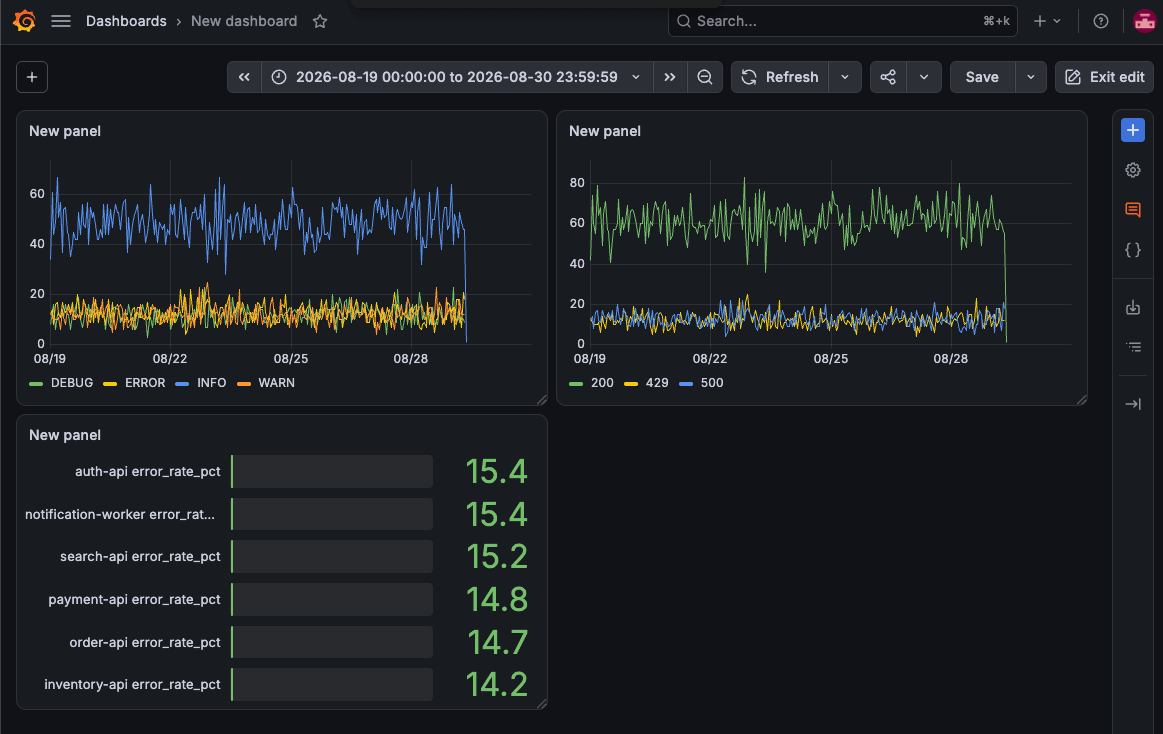
The top-left shows count trends by level, the top-right by HTTP status, and the bottom-left shows error rate by service as a Bar gauge.
For aggregations without a time axis, such as error rate, you must set Format to Table; otherwise it fails with db has no time column.
TiDB Cloud Lake also has a Dashboard feature, so I ran the same aggregation in a Worksheet and turned it into a line chart.
SELECT DATE_TRUNC(HOUR, logged_at) AS hour, level, COUNT(*) AS cnt
FROM appdb.app_logs
WHERE logged_at BETWEEN '2026-08-19' AND '2026-08-31'
GROUP BY 1, 2
ORDER BY 1;
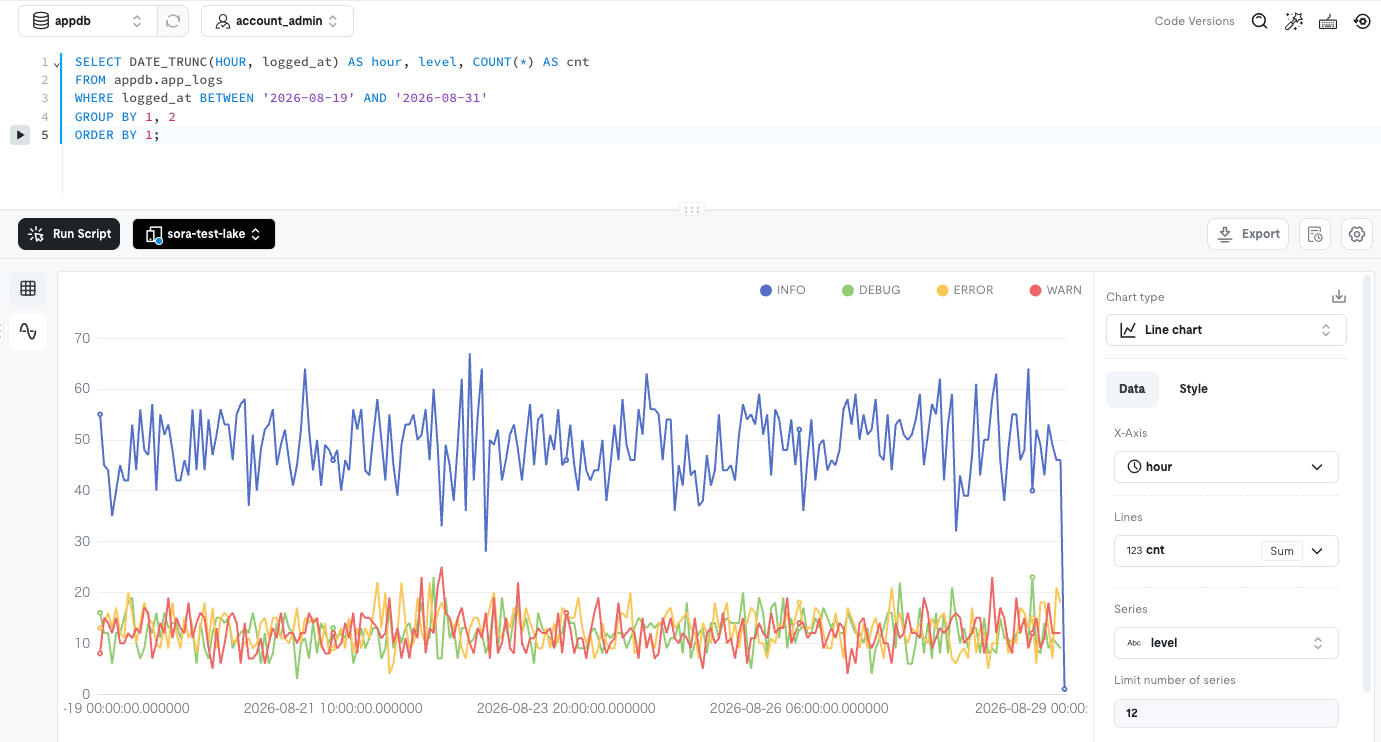
By specifying hour for X-Axis, cnt for Lines, and level for Series in the Chart settings, I got a graph in the same form as Grafana.
Addendum: Change Timezone with SET GLOBAL
Looking closely at the Explore results, a row that was 2026-08-29 00:00:51 on Lake was displayed as 2026-08-29 09:00:51.
This is because logged_at is a TIMESTAMP without timezone information, and Lake's default timezone is UTC.
There is no timezone setting in the Lake console, so you change it with SET GLOBAL in SQL.
Let's check the current value in Worksheet.
SHOW SETTINGS LIKE 'timezone';
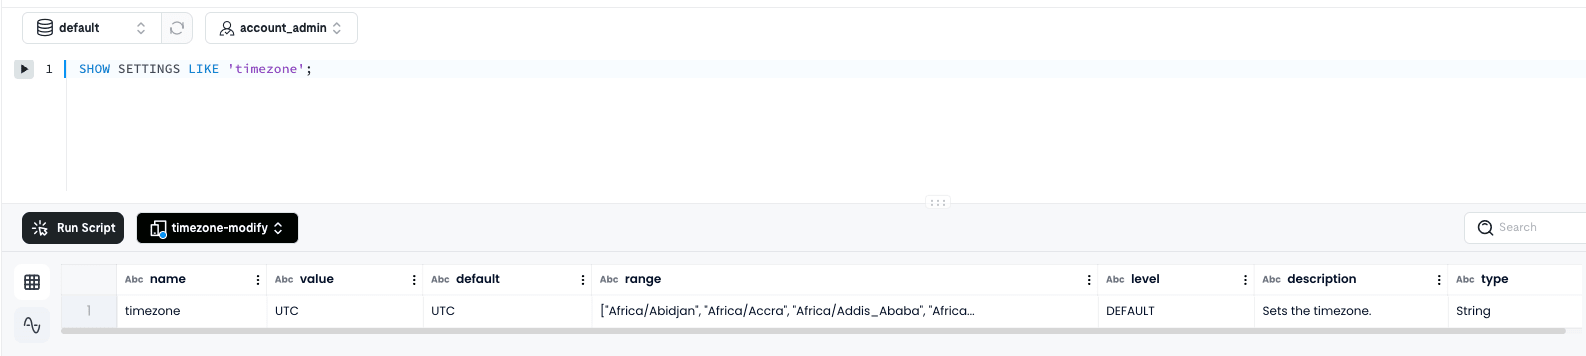
The value is UTC and the level is DEFAULT.
The range field contains a list of timezone names.
SET GLOBAL timezone = 'Asia/Tokyo';
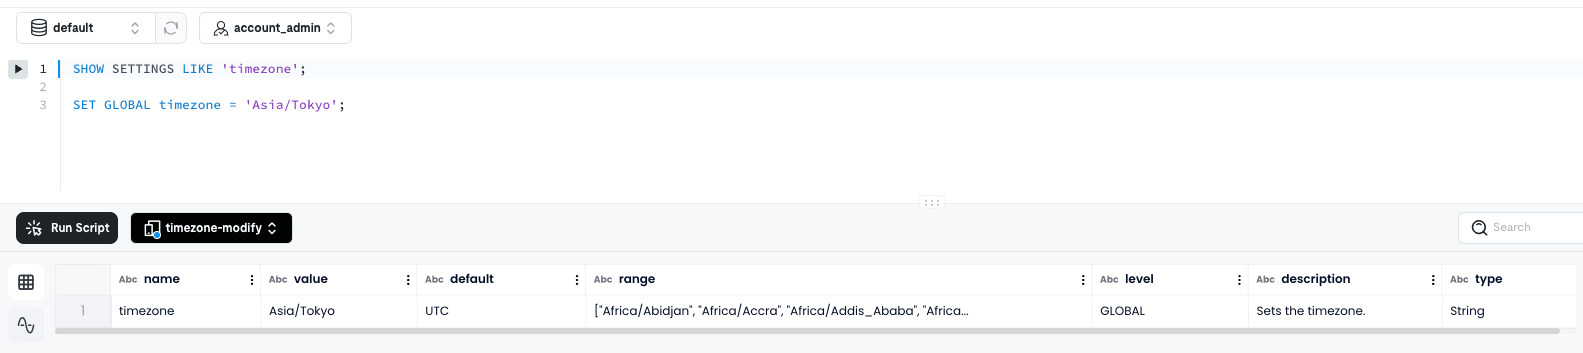
The value changed to Asia/Tokyo and the level changed to GLOBAL.
Addendum: Queries via MySQL Endpoint Can Be Viewed in SQL History
You can view the history of executed queries in Lake's Monitoring > SQL History.
However, if the User remains set to your currently logged-in self, neither the SQL sent by Grafana nor the queries sent from the mysql client will appear.
Queries via the MySQL Endpoint are executed under a different user from yourself, so switching the User allows you to check them.
Pricing
An XSmall Warehouse costs $1.60/h.
Enabling the MySQL Endpoint locks Auto Suspend to Never, which amounts to $38.4 per day and $1,152 per 30 days.
While the cost is $0 when the Warehouse is stopped, and using an XSmall for just one hour a day would be around $48 per month, this assumption no longer holds once you connect Grafana.
This is because a Warehouse with MySQL Endpoint enabled keeps running even during times when no one is viewing Grafana.
If you plan to keep a BI tool continuously connected, you need to account for the continuous operation of one Warehouse from the start.
If you only want to view dashboards occasionally, the Lake built-in Dashboard, where the Warehouse only runs when you open it, will be cheaper.
After finishing the verification, I deleted the Warehouse.
Closing
This time, I enabled the MySQL Endpoint for TiDB Cloud Lake and tried visualizing logs stored in Lake through Grafana's MySQL data source.
I hope this article proves useful to someone.