
I investigated whether the Trace indexing rate of Transaction Search has any impact on CloudWatch Application Signals
This page has been translated by machine translation. View original
Wondering About How Transaction Search's Trace Indexing Rate Affects Application Signals
Hello, I'm nonpi (@non____97).
Have you ever wondered how the Trace indexing rate in Transaction Search affects CloudWatch Application Signals (hereafter, Application Signals)? I have.
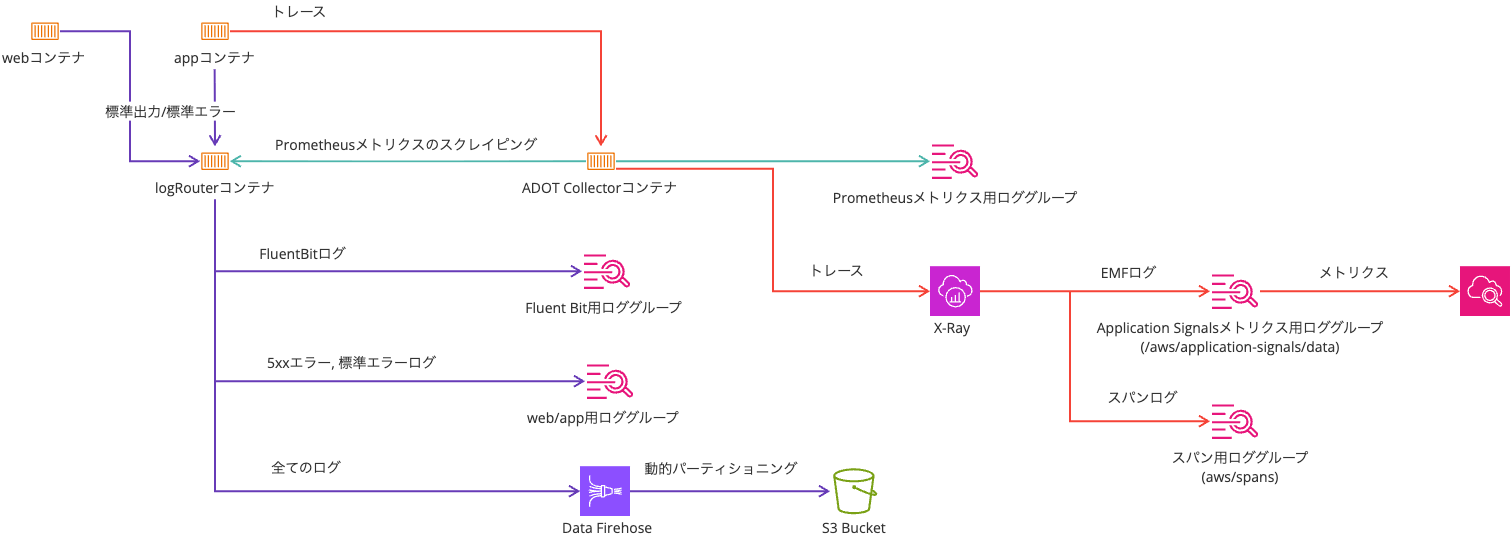
When using Application Signals, you'll often stream traces to X-Ray's OTLP endpoint.
As mentioned in the article above, you need to enable Transaction Search to use the OTLP endpoint.
When enabling Transaction Search, there's also a setting for Trace indexing rate.
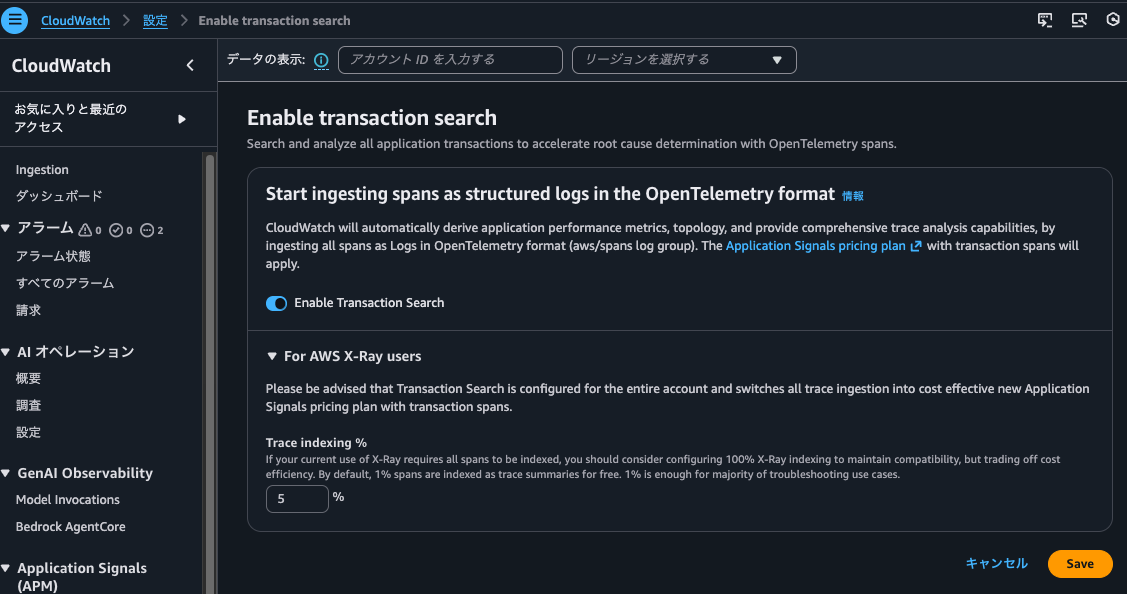
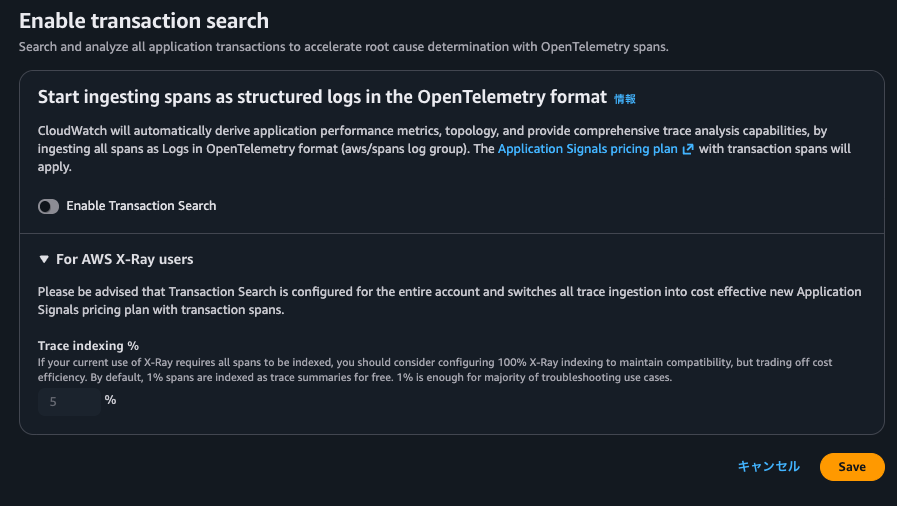
The Trace indexing rate cannot be specified if Transaction Search is disabled.
From this, it seems there's a strong relationship between Transaction Search and Trace indexing rate.
As the name suggests, Trace indexing rate is the rate at which traces are indexed. We want to avoid situations where Application Signals metrics calculations use fewer traces or where spans don't appear in correlated spans due to the Trace indexing rate.
The following image contains information about Trace indexing rate.
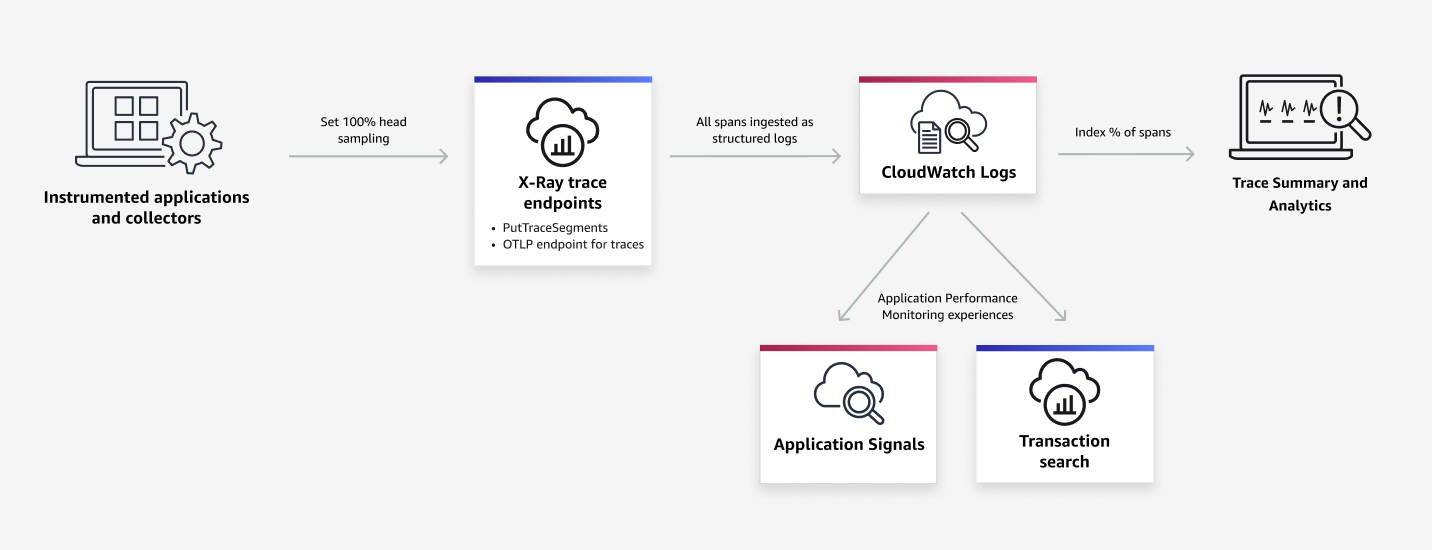
Excerpt from: Transaction Search - Amazon CloudWatch
Based on this, I'm guessing that it's an index for trace summaries and analysis of spans output to CloudWatch Logs (probably aws/spans), and it doesn't directly affect Application Signals or Transaction Search itself.
I decided to check how changing the Trace indexing rate value actually affects Application Signals.
Summary First
- Transaction Search's Trace indexing rate does not directly affect Application Signals
- Even without indexing, metrics are generated from traces
- It's still possible to check the original traces (correlated spans) from the metrics
- Traces are indexed according to the percentage specified in Trace indexing rate, and for indexed traces, the following is possible:
- Trace summary search
- Display on Trace Map
- Dashboard display
- Trace analysis in the analytics console
- Even non-indexed traces can be searched in Transaction Search
- Transaction Search is essentially Logs Insights
- Create field indexes for
aws/spansto reduce query costs and time
- Even with 0% Trace indexing rate, traces recorded by Step Functions' X-Ray tracing feature are searchable
- When clicking on metric graphs in Application Signals service
overvieworservice operationsto display correlated spans, queries are executed againstaws/spans, and when displaying correlated spans from thedependenciestab, queries are executed against/aws/application-signals/data - Since charges are incurred based on the number of indexed spans, it's best to check traces using Application Signals and Transaction Search, and if a small percentage of traces is sufficient for trace summaries, reflect that percentage in the Trace indexing rate
Testing It Out
Test Environment
The test environment is as follows:
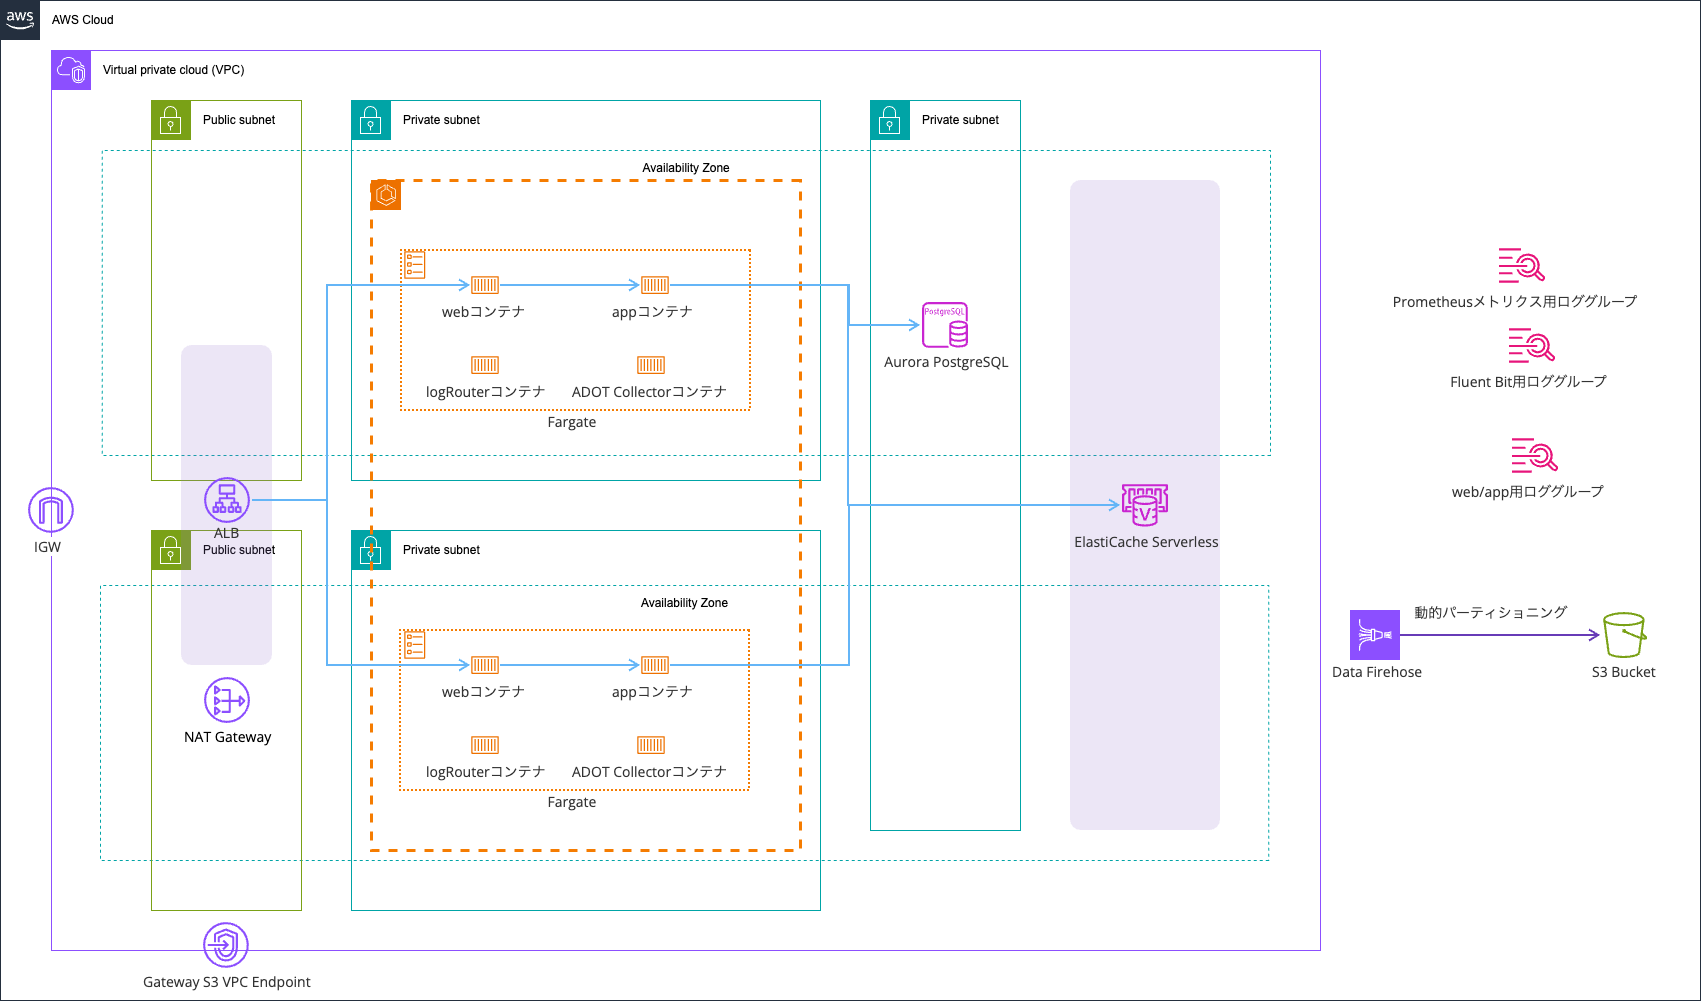
I'm using the setup from the following article:
In the article's setup, the trace sampler is set to X-Ray, which means if there are multiple accesses within one second, the second and subsequent accesses are sampled with a 5% probability.
Sampling rules tell AWS Distro for OpenTelemetry (ADOT) or the X-Ray SDK how many requests to record for a set of criteria. By default, the SDK records the first request each second, and 5% of any additional requests. One request per second is the reservoir. This ensures that at least one trace is recorded each second while your service is serving requests. 5% is the rate at which additional requests beyond the reservoir size are sampled.
In this test, I don't anticipate multiple accesses per second, but since I wanted to record traces for all accesses, I've set it to always_on.
The environment variables for Application Signals and OTel are as follows:
| Environment Variable | Value |
|---|---|
| OTEL_AWS_APPLICATION_SIGNALS_ENABLED | false |
| OTEL_EXPORTER_OTLP_ENDPOINT | http://localhost:4318 |
| OTEL_EXPORTER_OTLP_PROTOCOL | http/protobuf |
| OTEL_LOGS_EXPORTER | none |
| OTEL_METRICS_EXPORTER | none |
| OTEL_PROPAGATORS | tracecontext,baggage,xray |
| OTEL_RESOURCE_ATTRIBUTES | service.name=ecs-express-app,deployment.environment=ecs:EcsNativeBlueGreenStack-EcsConstructCluster14AE103B-GxDEV566XVyC |
| OTEL_TRACES_EXPORTER | otlp |
| OTEL_TRACES_SAMPLER | always_on |
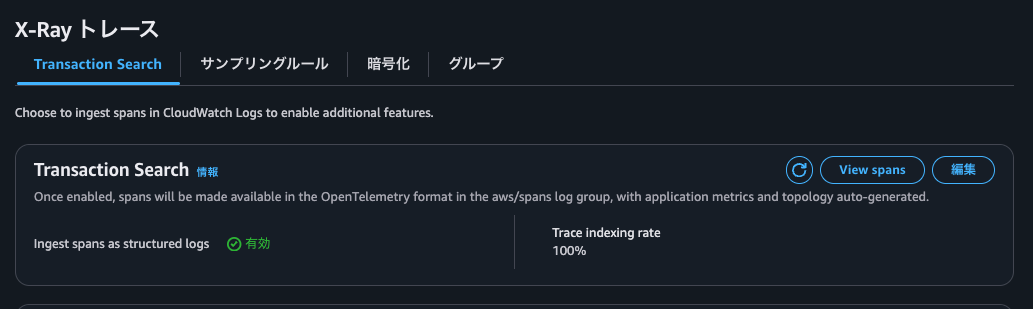
With Trace Indexing Rate at 0%
First, let's look at the case where Trace indexing rate is 0%.
Checking in the management console, it looks like this:
I also checked with the AWS CLI:
> aws xray get-trace-segment-destination
{
    "Destination": "CloudWatchLogs",
    "Status": "ACTIVE"
}

> aws xray get-indexing-rules
{
    "IndexingRules": [
        {
            "Name": "Default",
            "ModifiedAt": "2026-02-06T18:07:26+09:00",
            "Rule": {
                "Probabilistic": {
                    "DesiredSamplingPercentage": 0.0
                }
            }
        }
    ]
}
Now, let's run the following command and continue accessing for a while:
> while true; do
  curl -c cookie.txt -b cookie.txt http://EcsNat-AlbCo-cqUiql4hqrPT-641057317.us-east-1.elb.amazonaws.com/app/ --get -s
  echo ""
  sleep $((RANDOM % 10 + 1))
  done
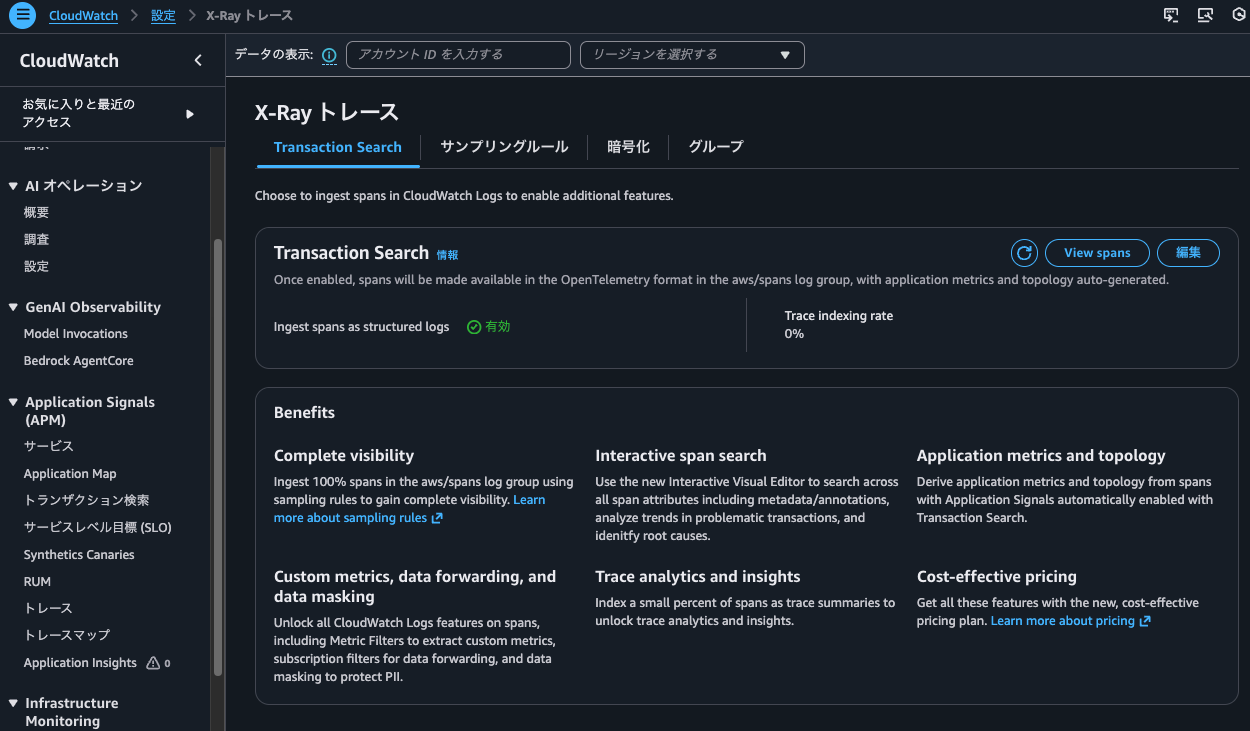
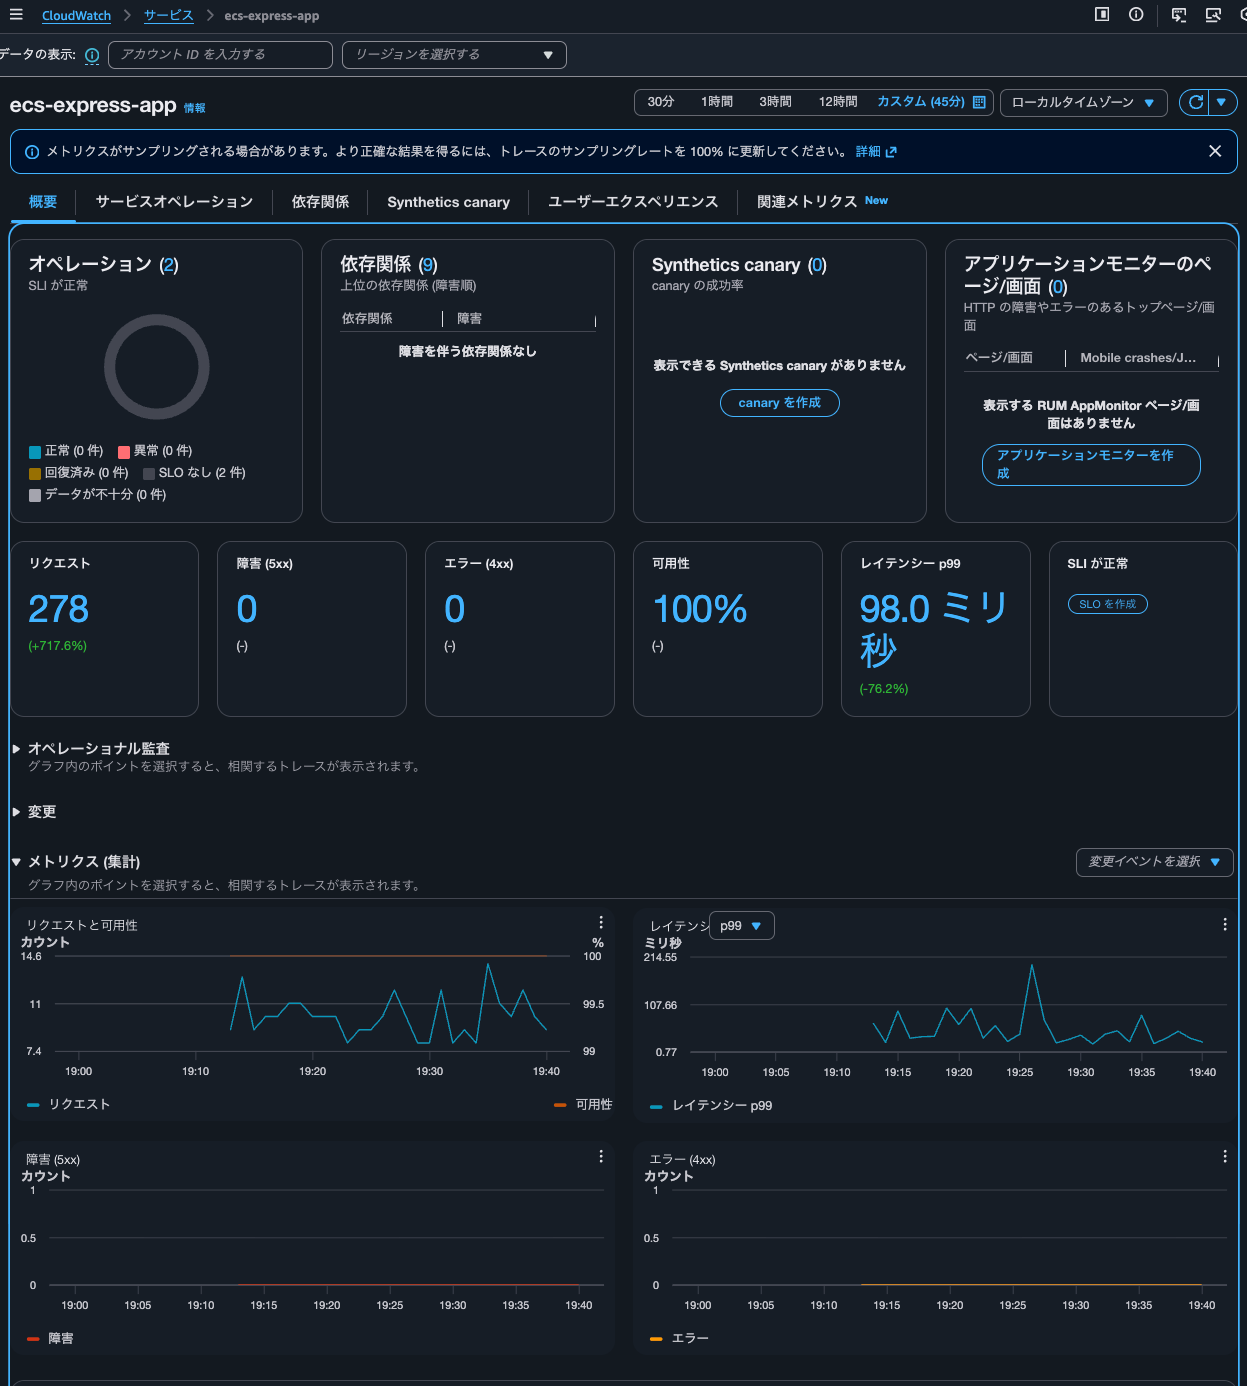
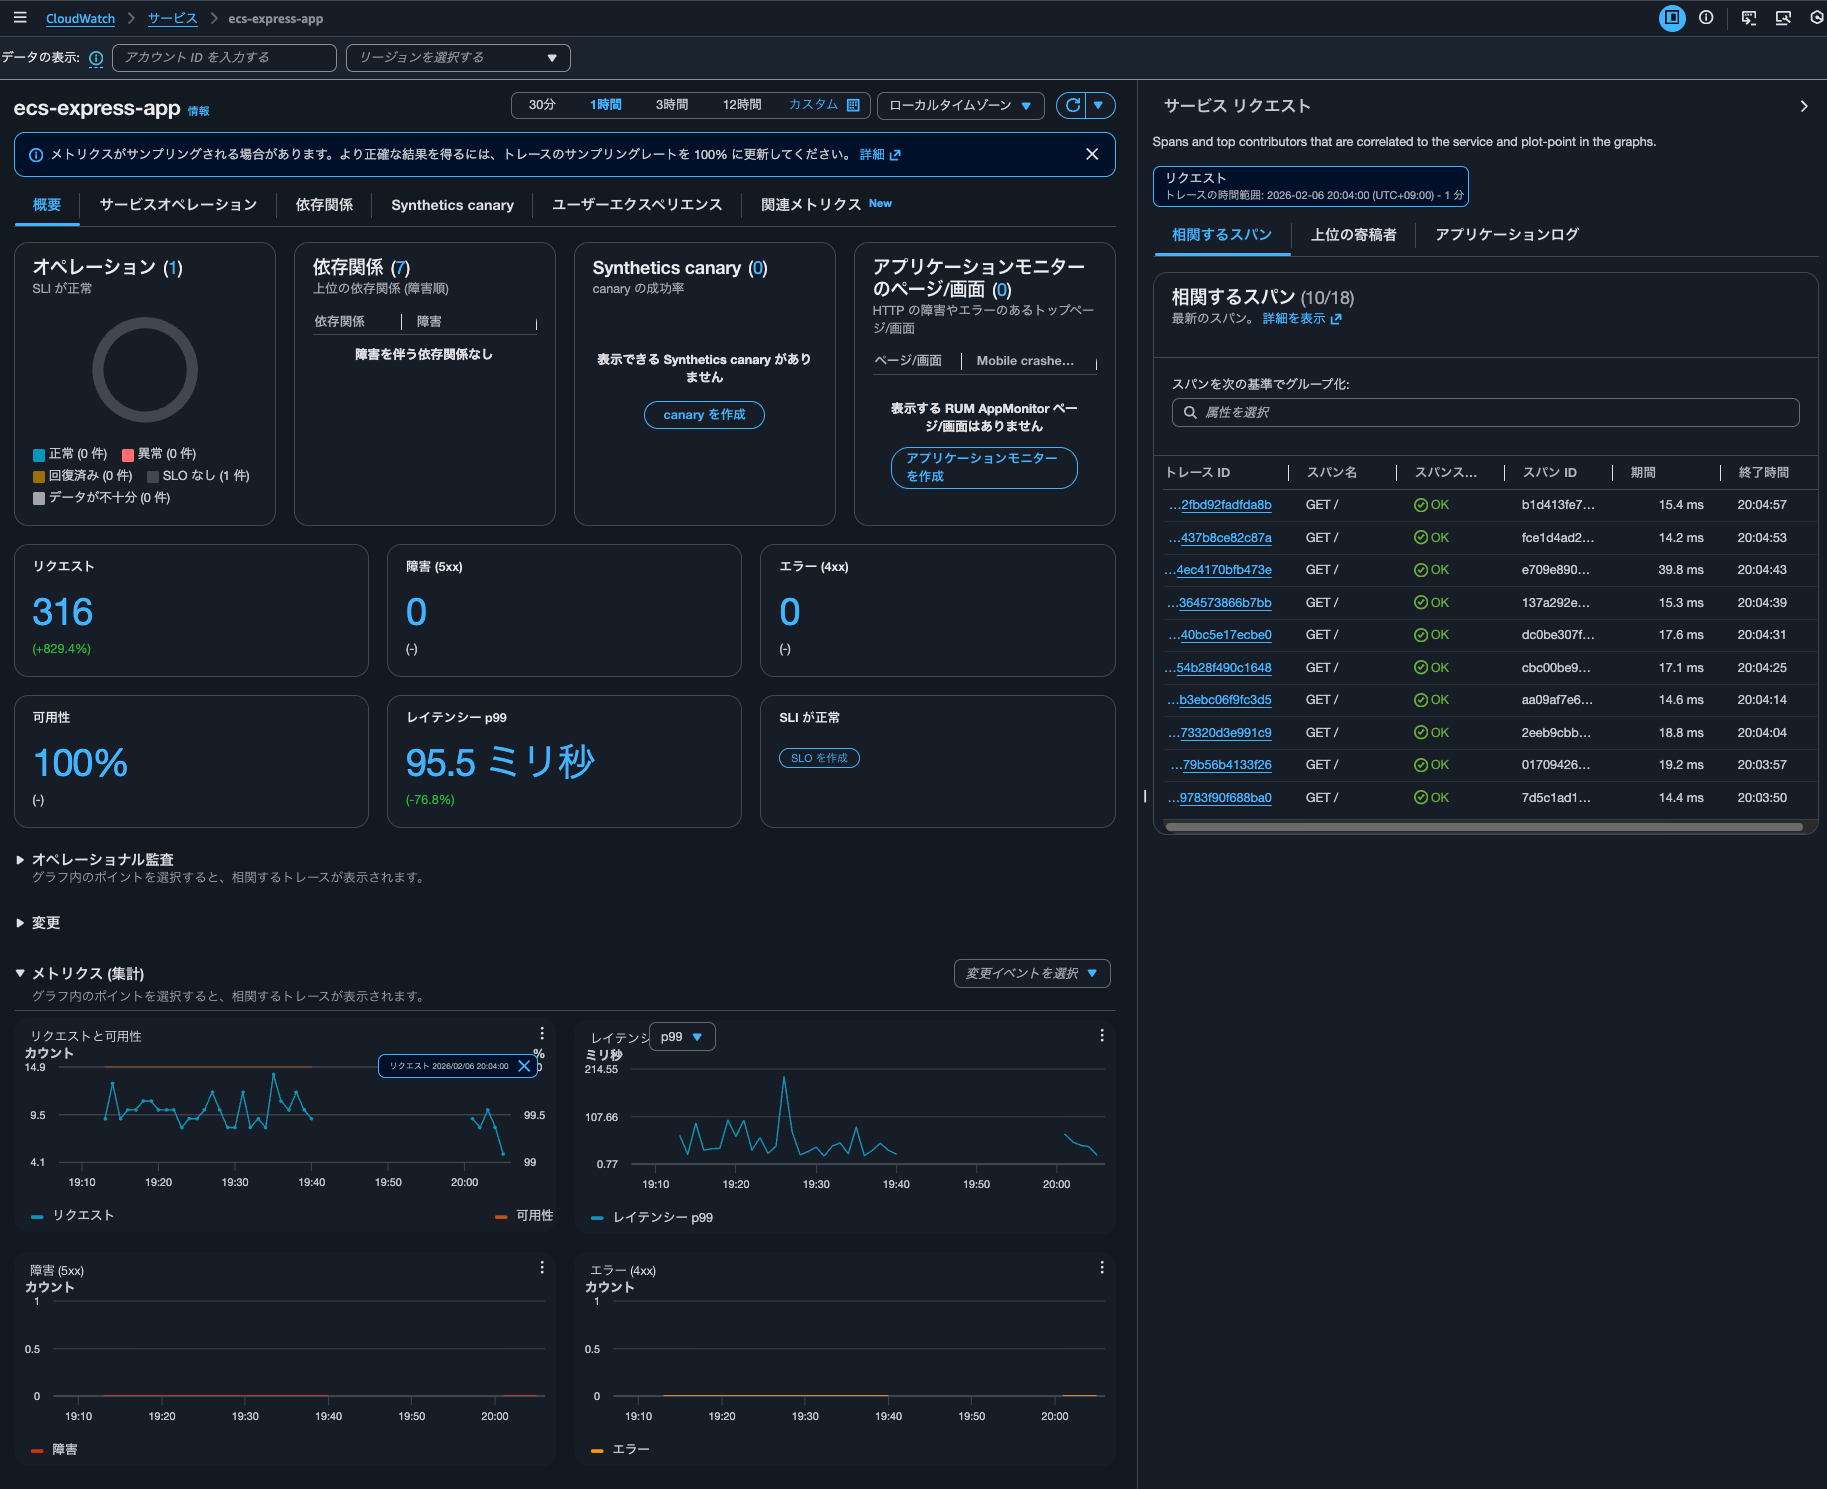
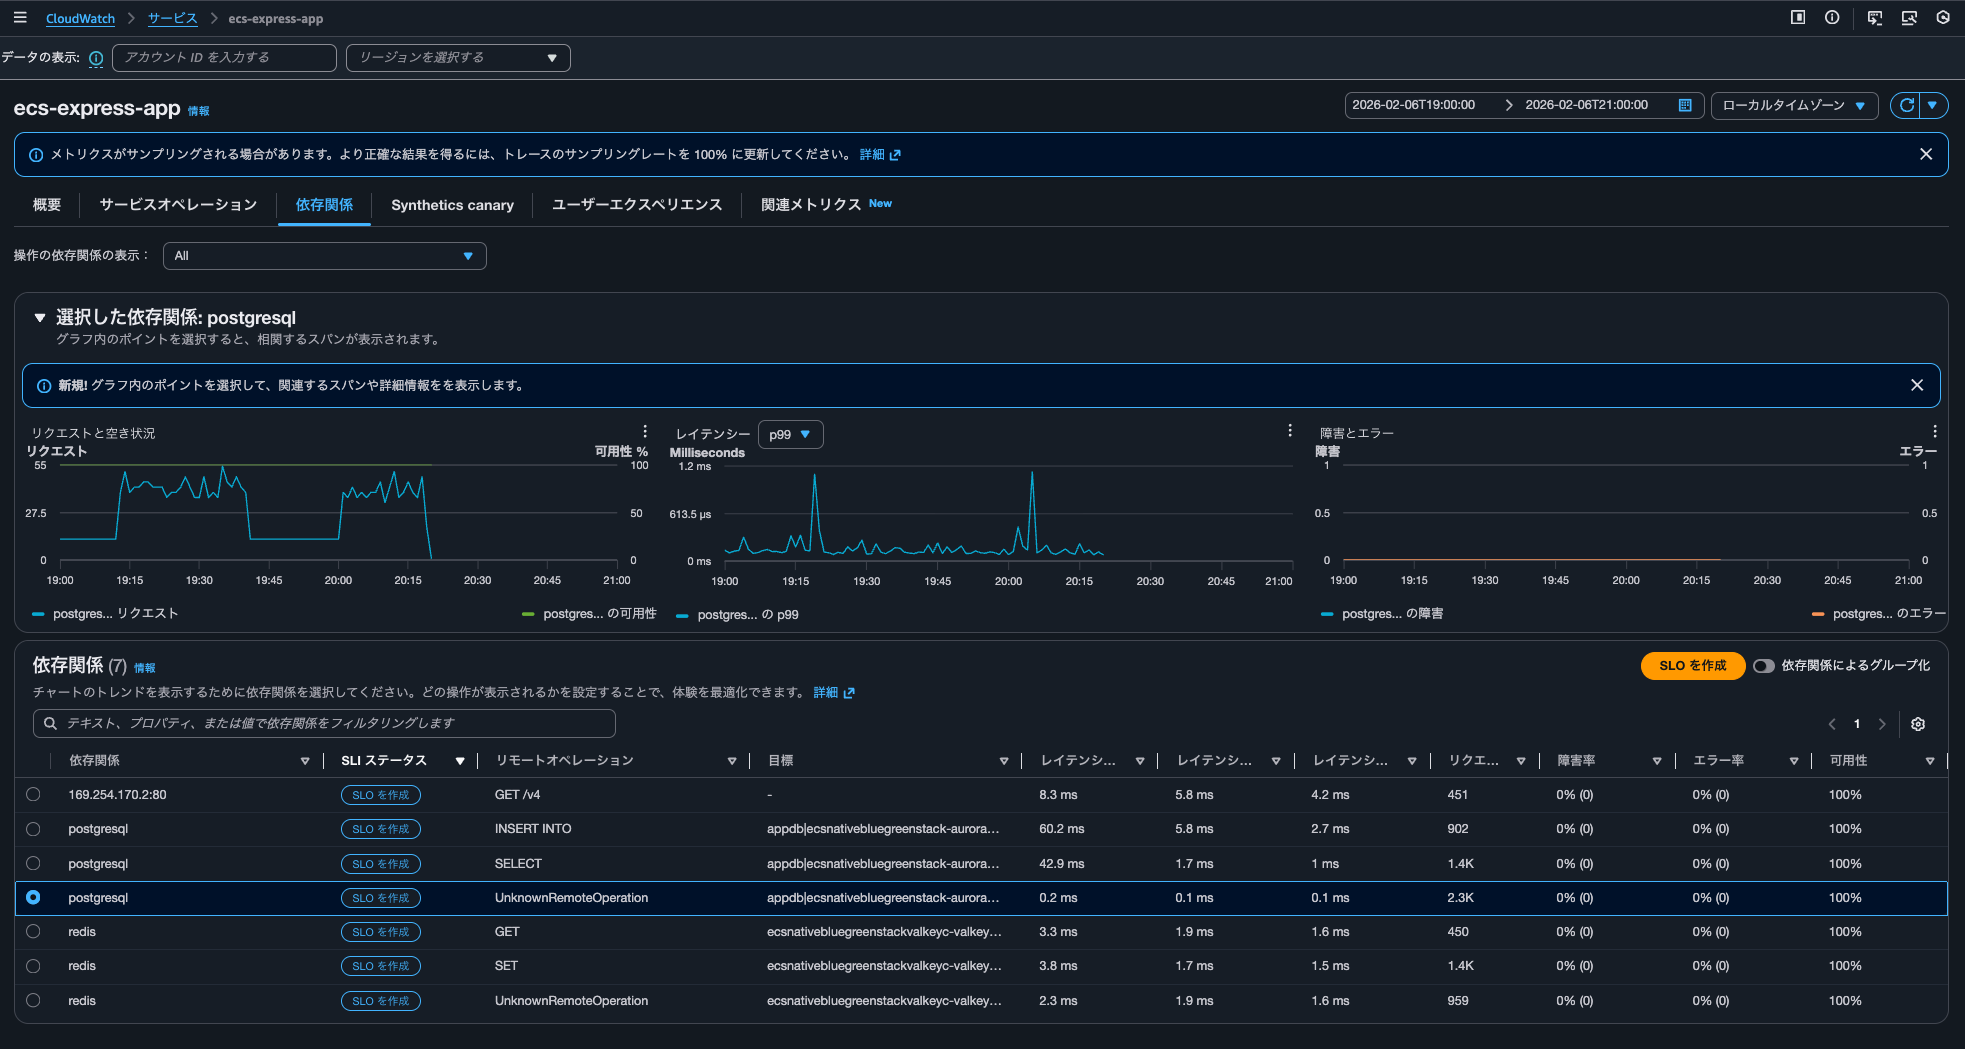
After waiting about 15 minutes, I check the service metrics in Application Signals:
It's counting correctly.
The response during access records the number of accesses as follows, and it matched:
{"message":"Hello from Express App with Session!","version":"2.0.0","timestamp":"2026-02-06T10:13:05.848Z","taskId":"d66493dfc651492fbff67623020a0600","session":{"sessionId":"aX7rWfB1xPBLsaWzLDrawnC1ojmkm11P","views":1,"firstVisit":"2026-02-06T10:13:05.793Z","lastVisit":"2026-02-06T10:13:05.793Z"},"database":{"totalSiteVisits":10,"currentVisitId":10,"recentVisits":[{"id":10,"path":"/","createdAt":"2026-02-06T10:13:05.794Z"}]}}
So it seems that the Trace indexing rate setting doesn't affect Application Signals metric calculations.
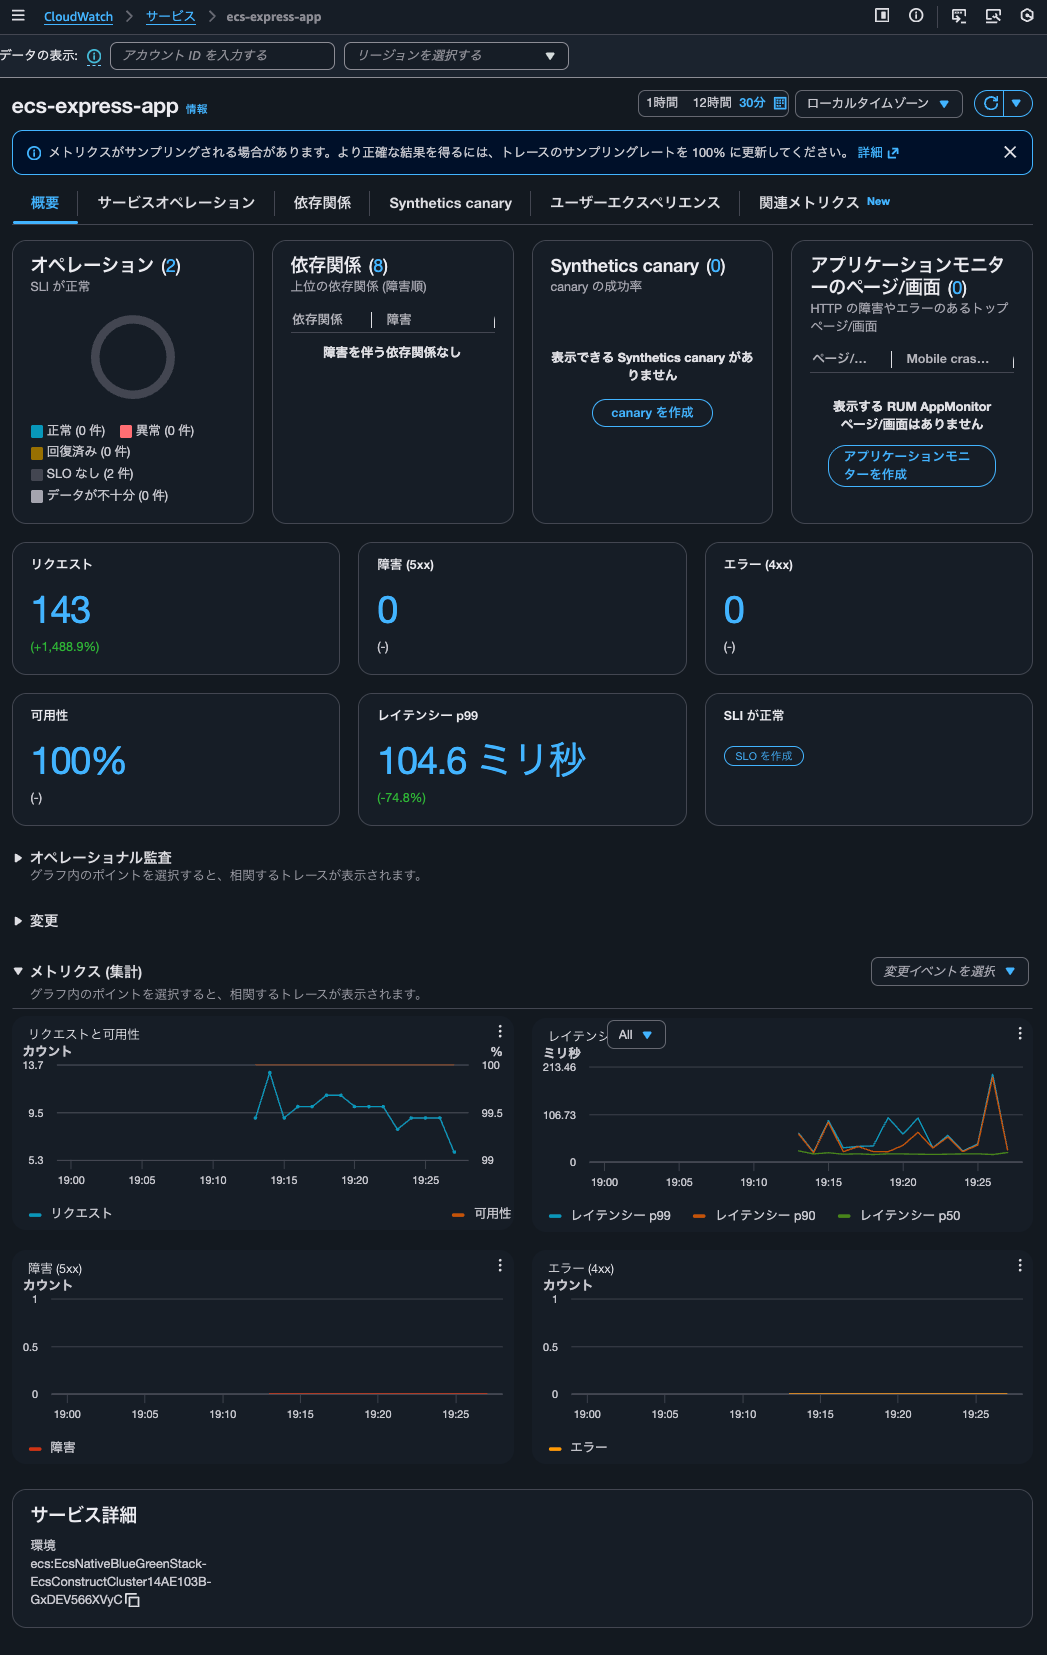
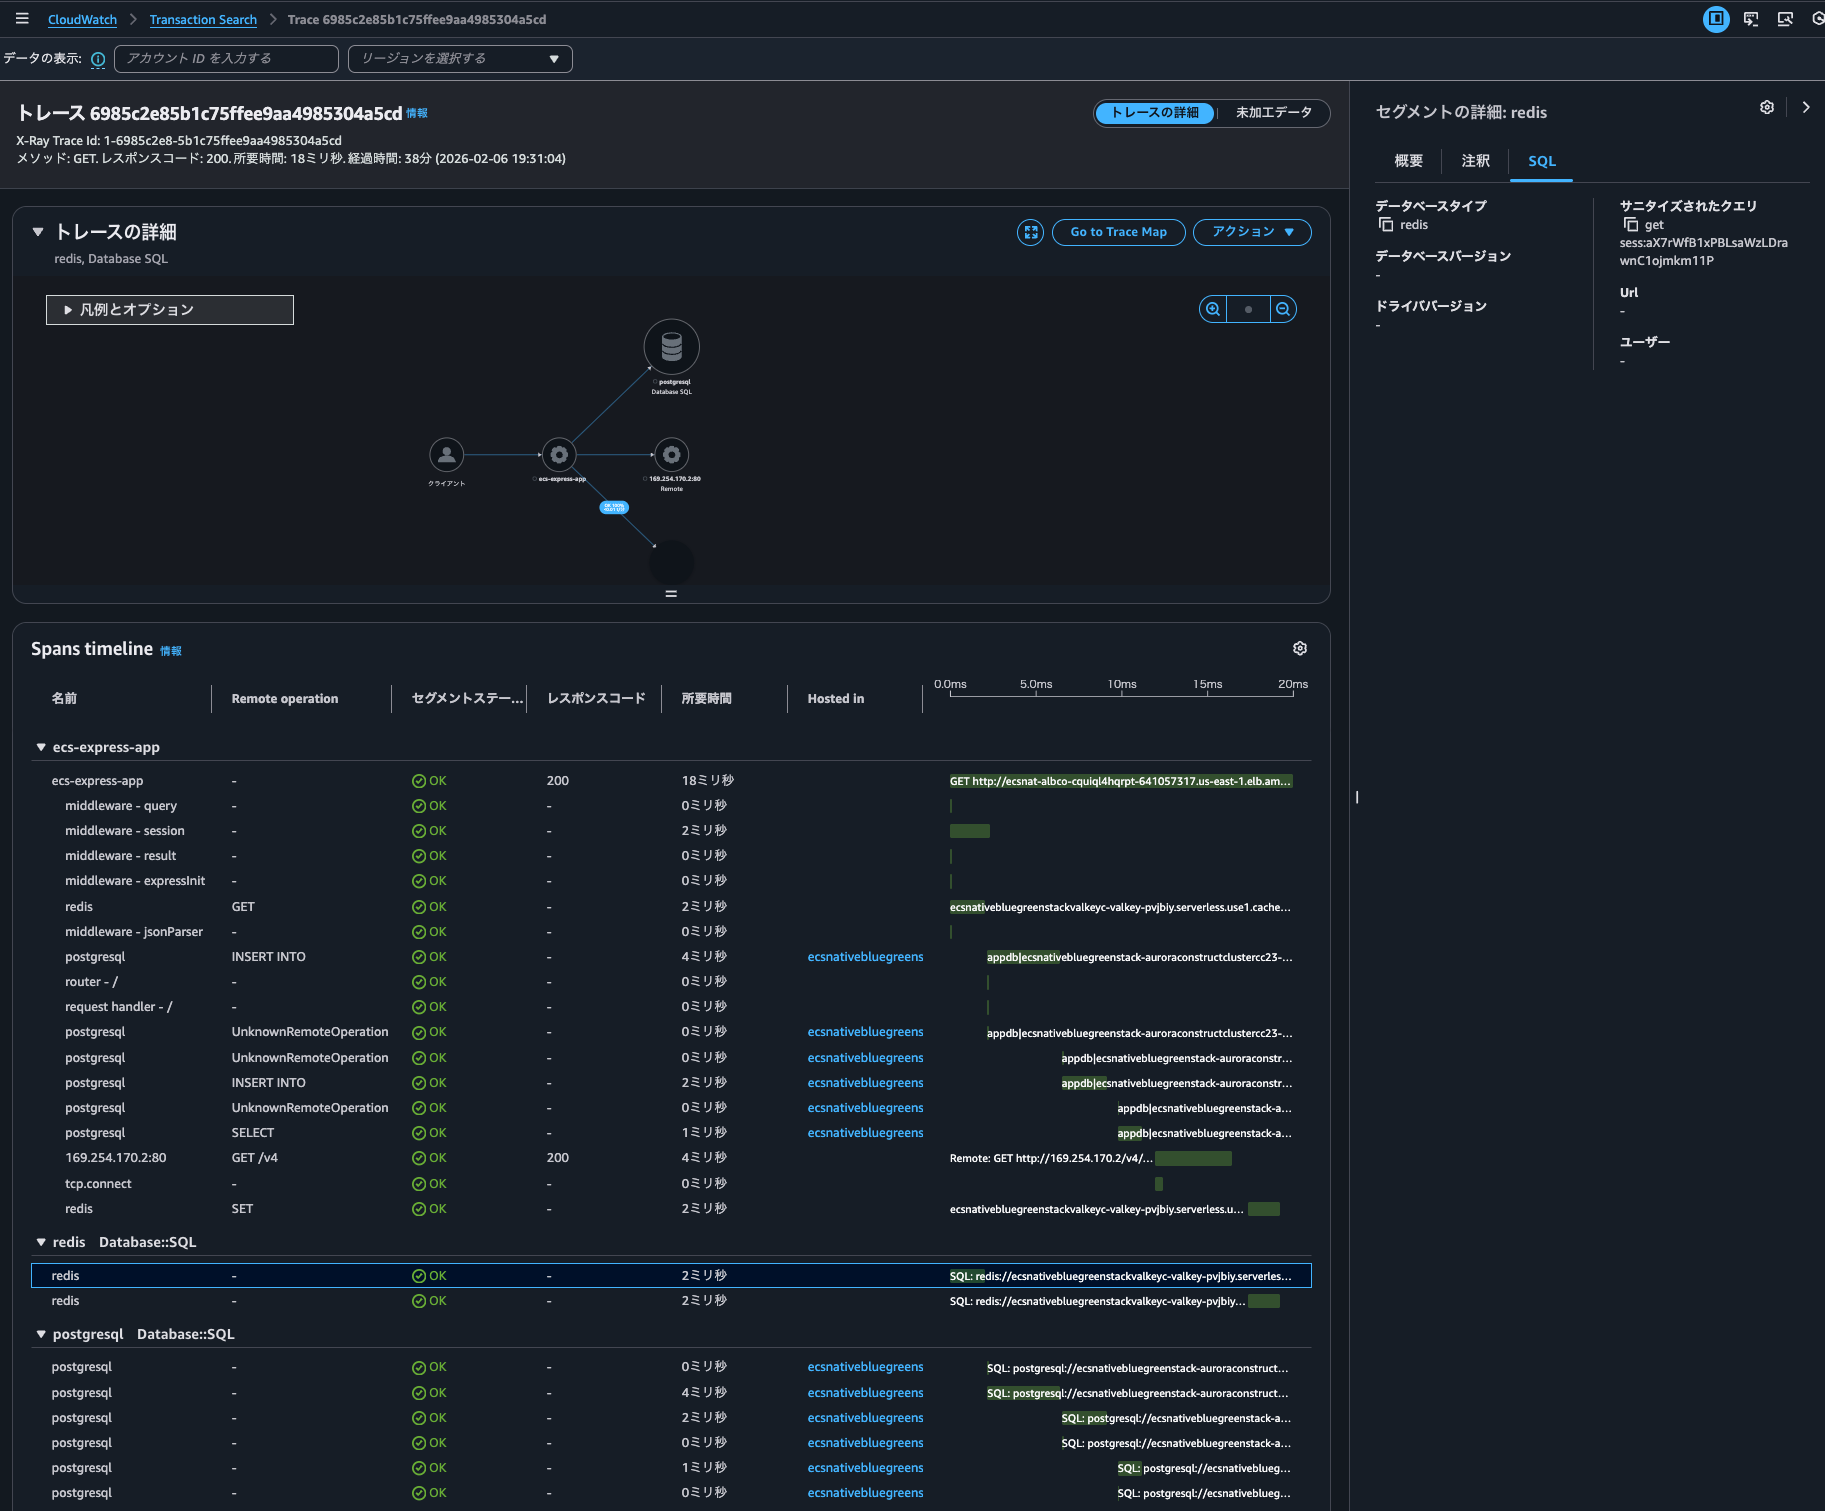
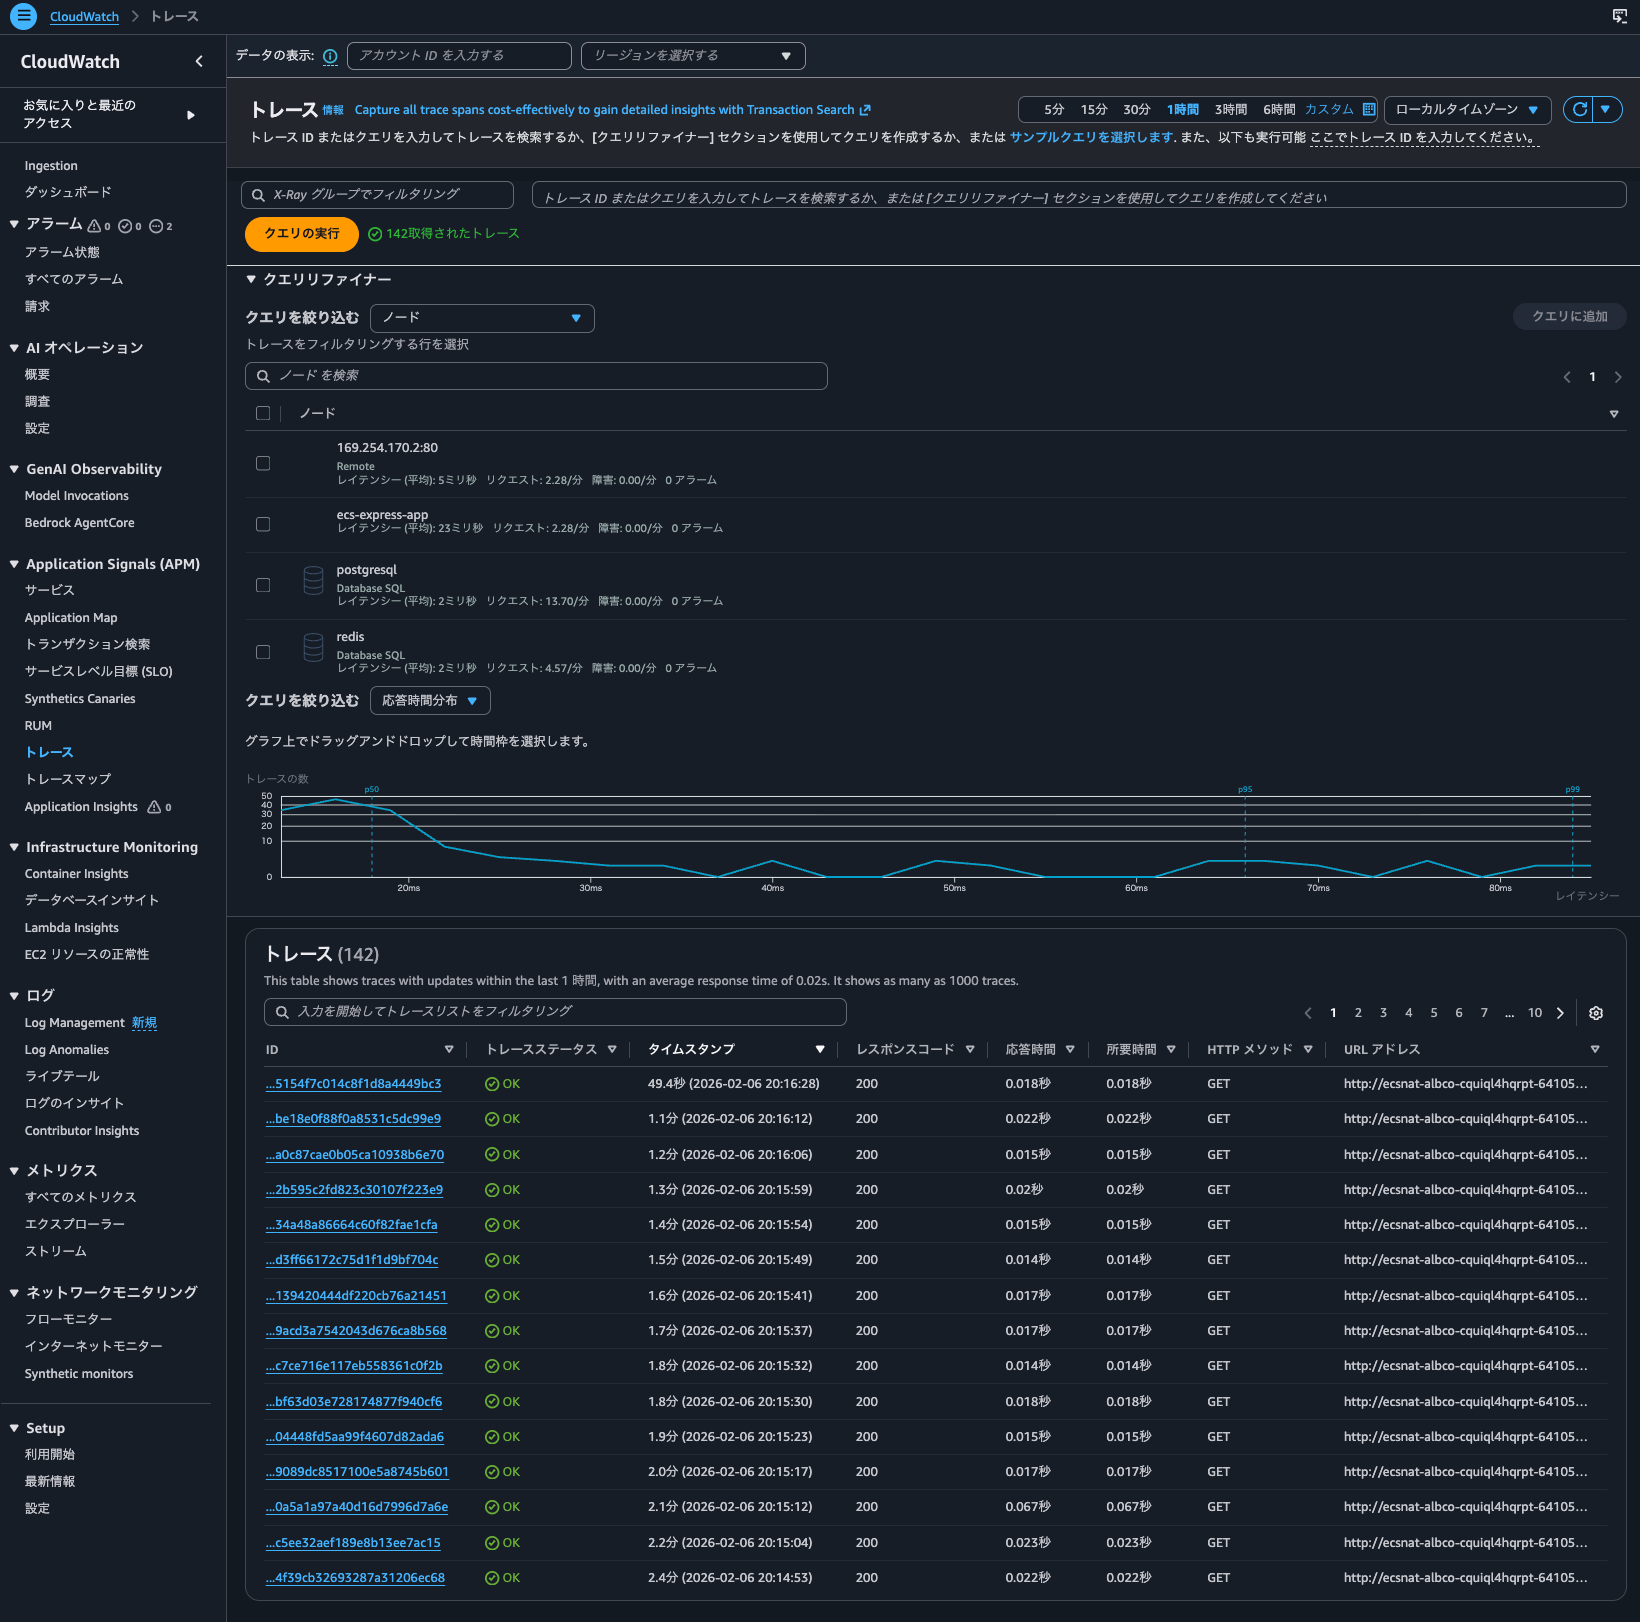
When I click on the graph, the corresponding trace for that time is also displayed:
I can also check the trace details. Behind the scenes, it seems to be using Transaction Search (CloudWatch > Transaction Search).
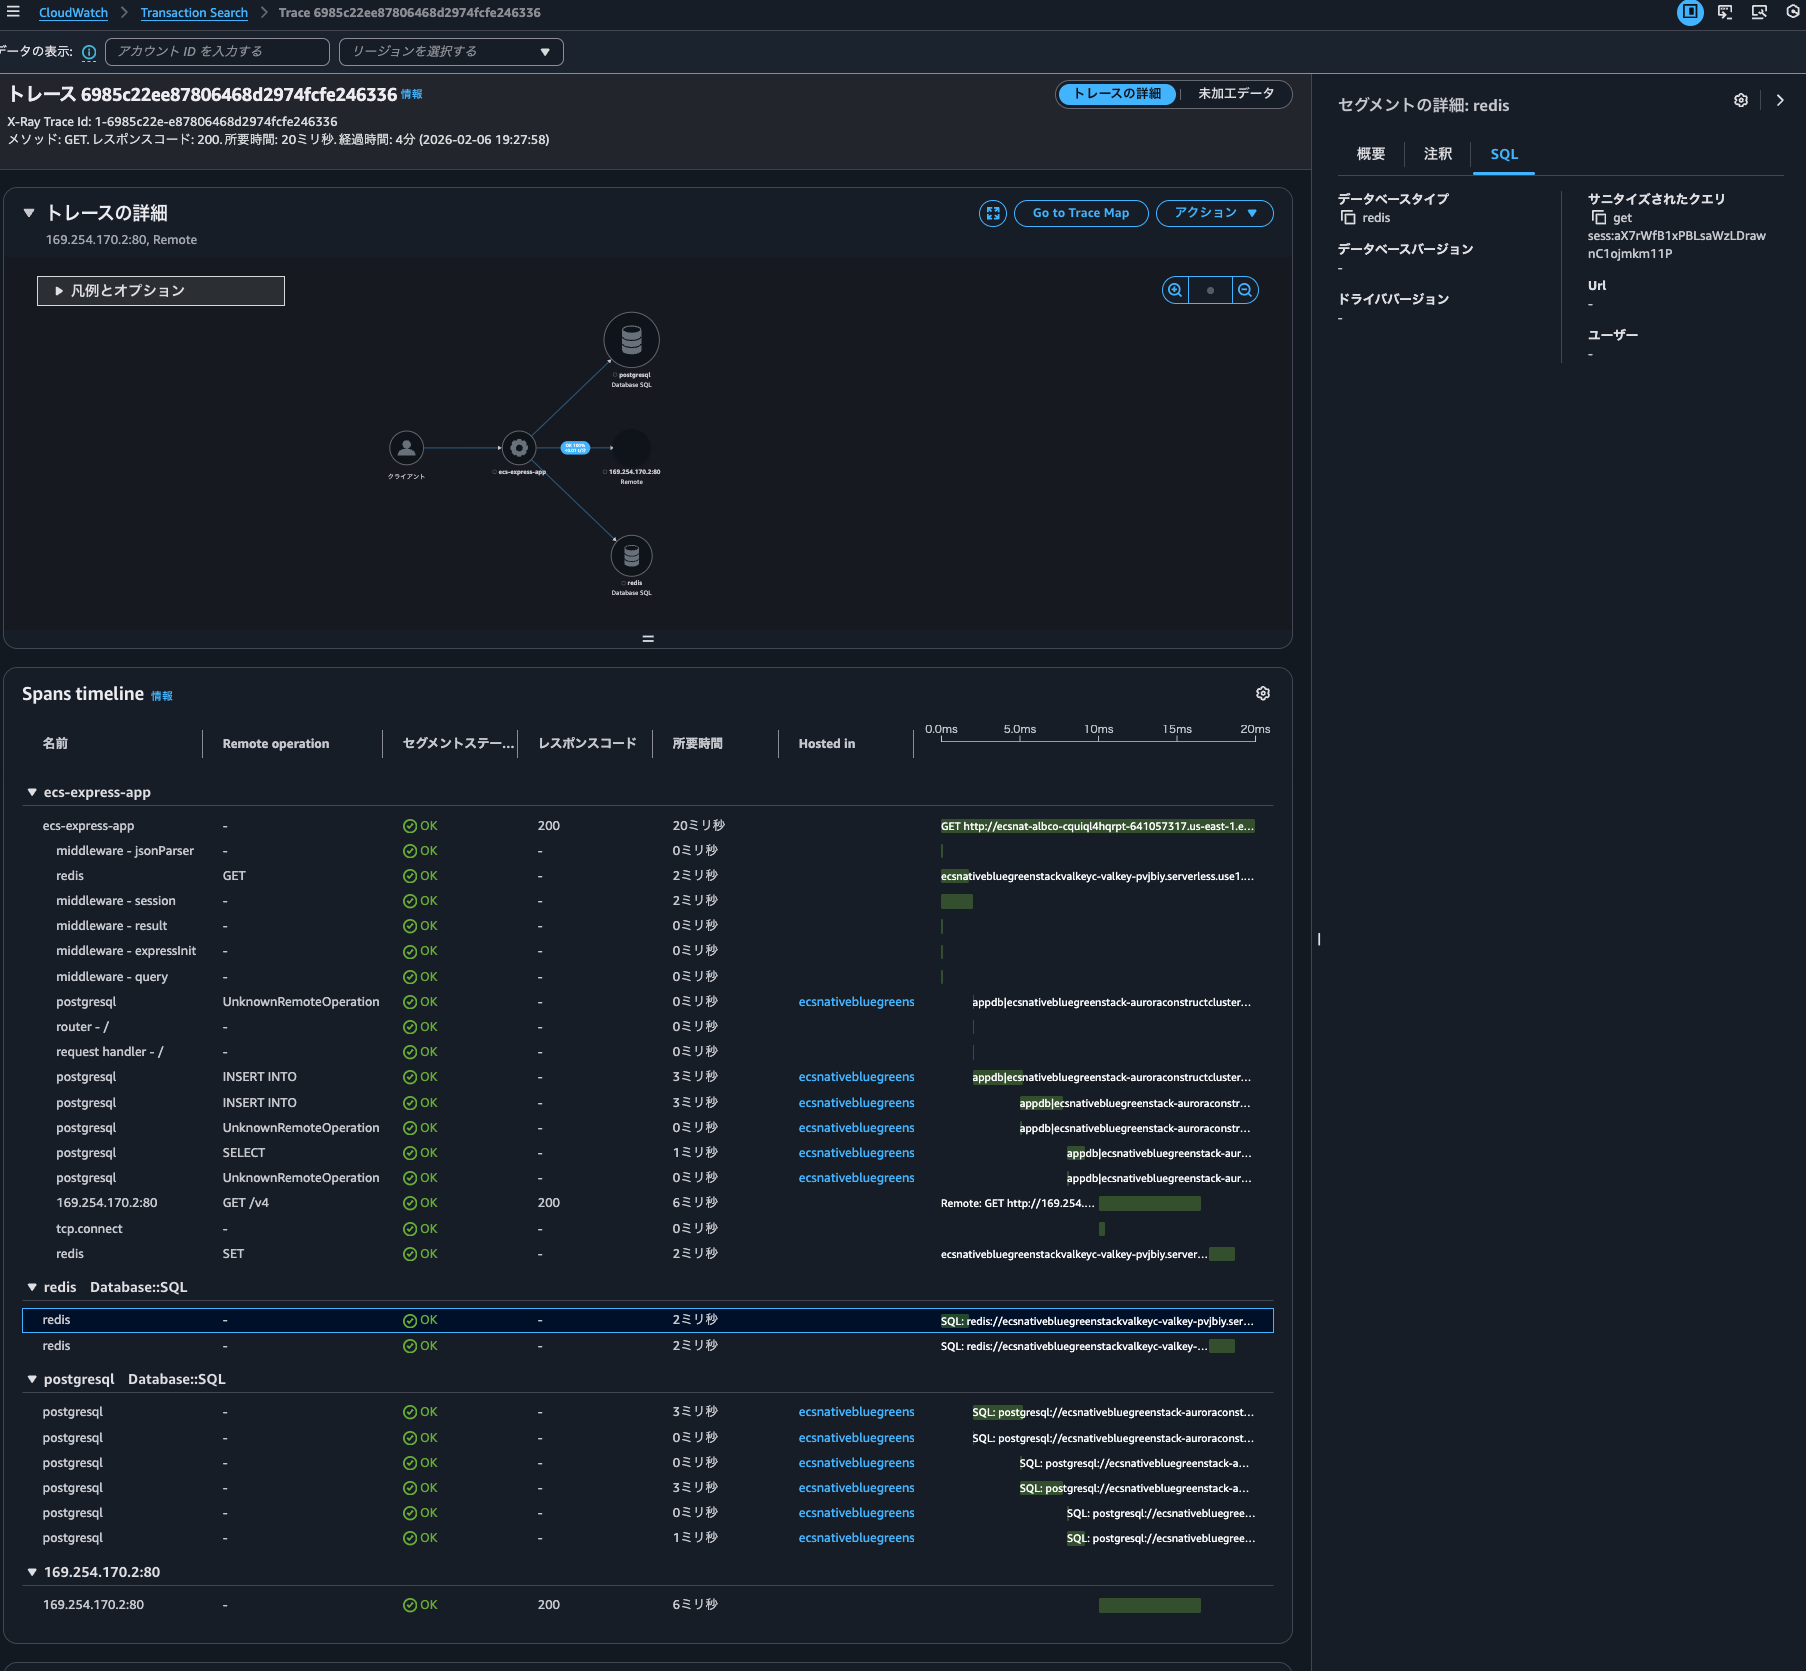
Does this mean trace indexing isn't necessary to use Transaction Search features? By the way, I checked the JSON displayed in the "raw data," but there were no fields indicating whether it was indexed or not.
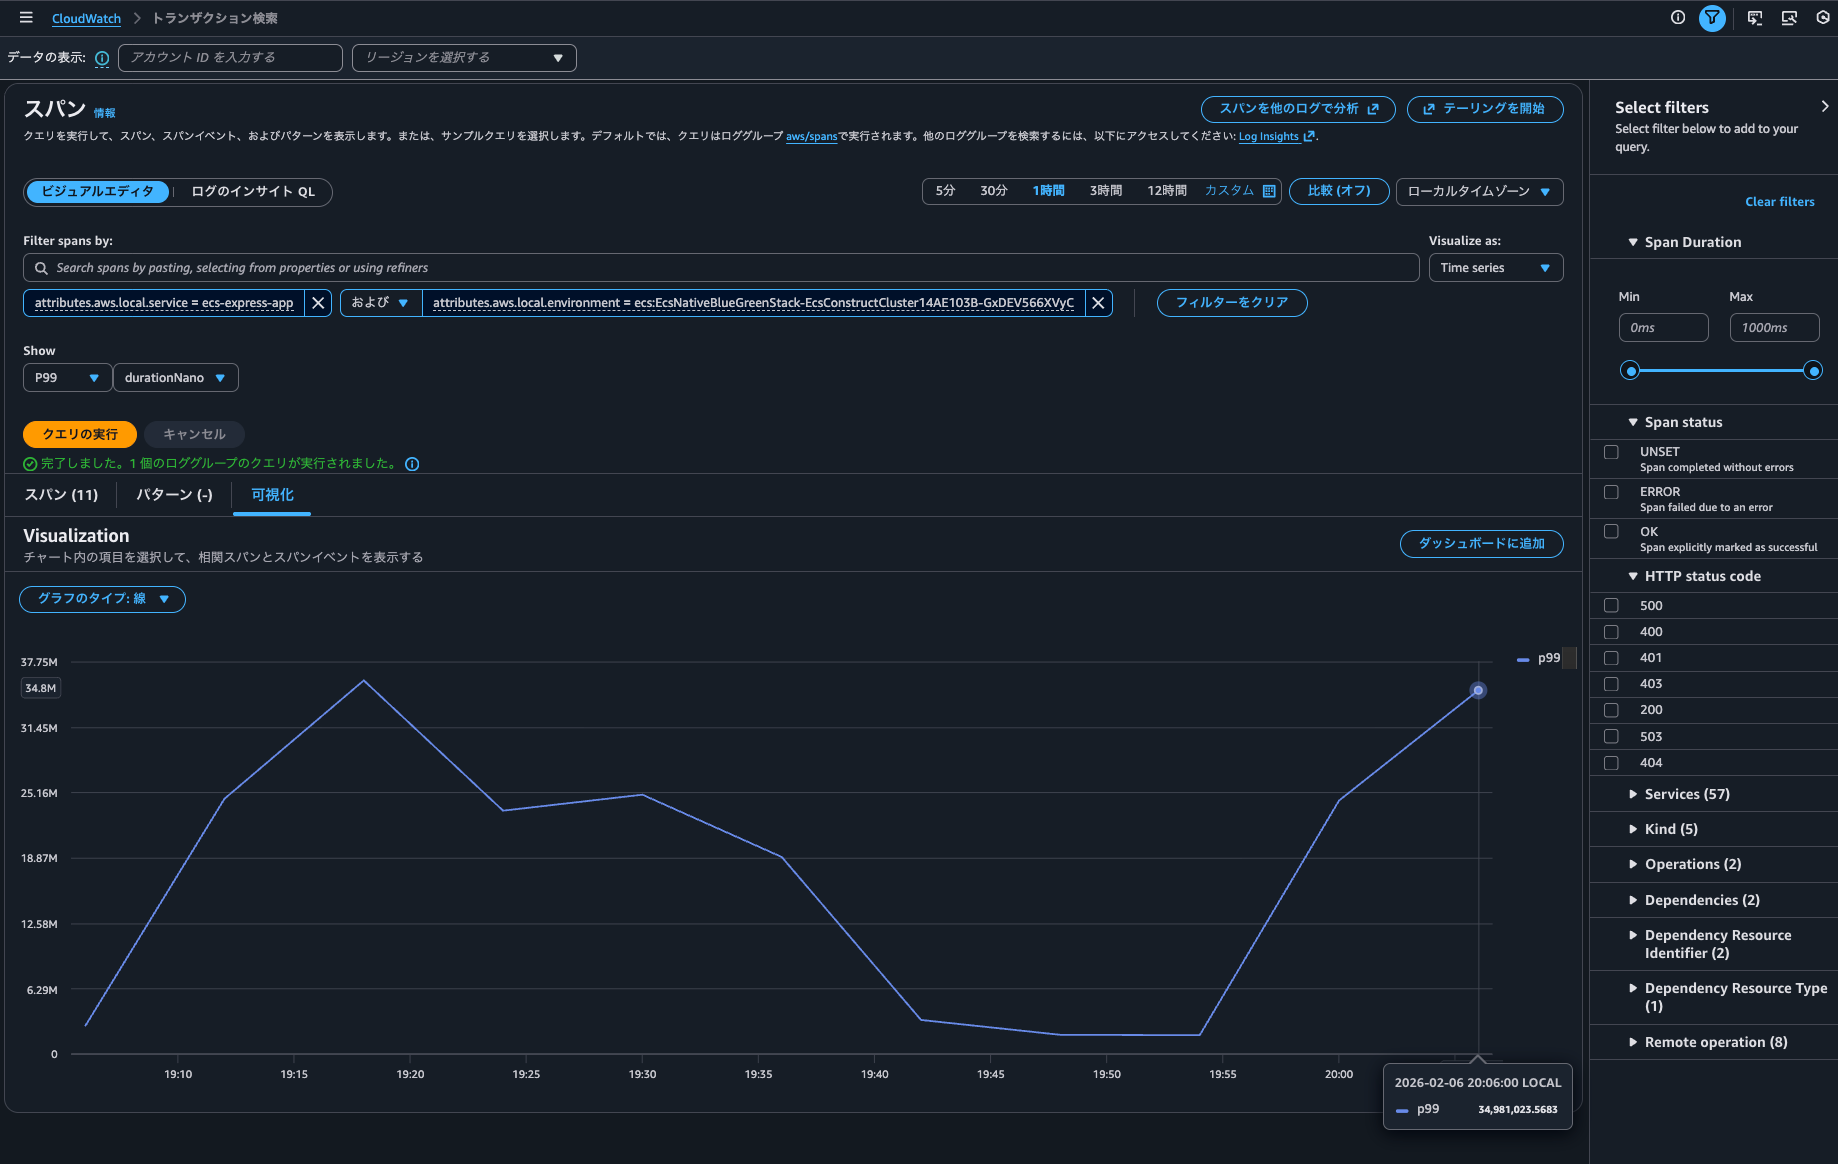
Let's search for spans from the ecs-express-app service in Transaction Search:
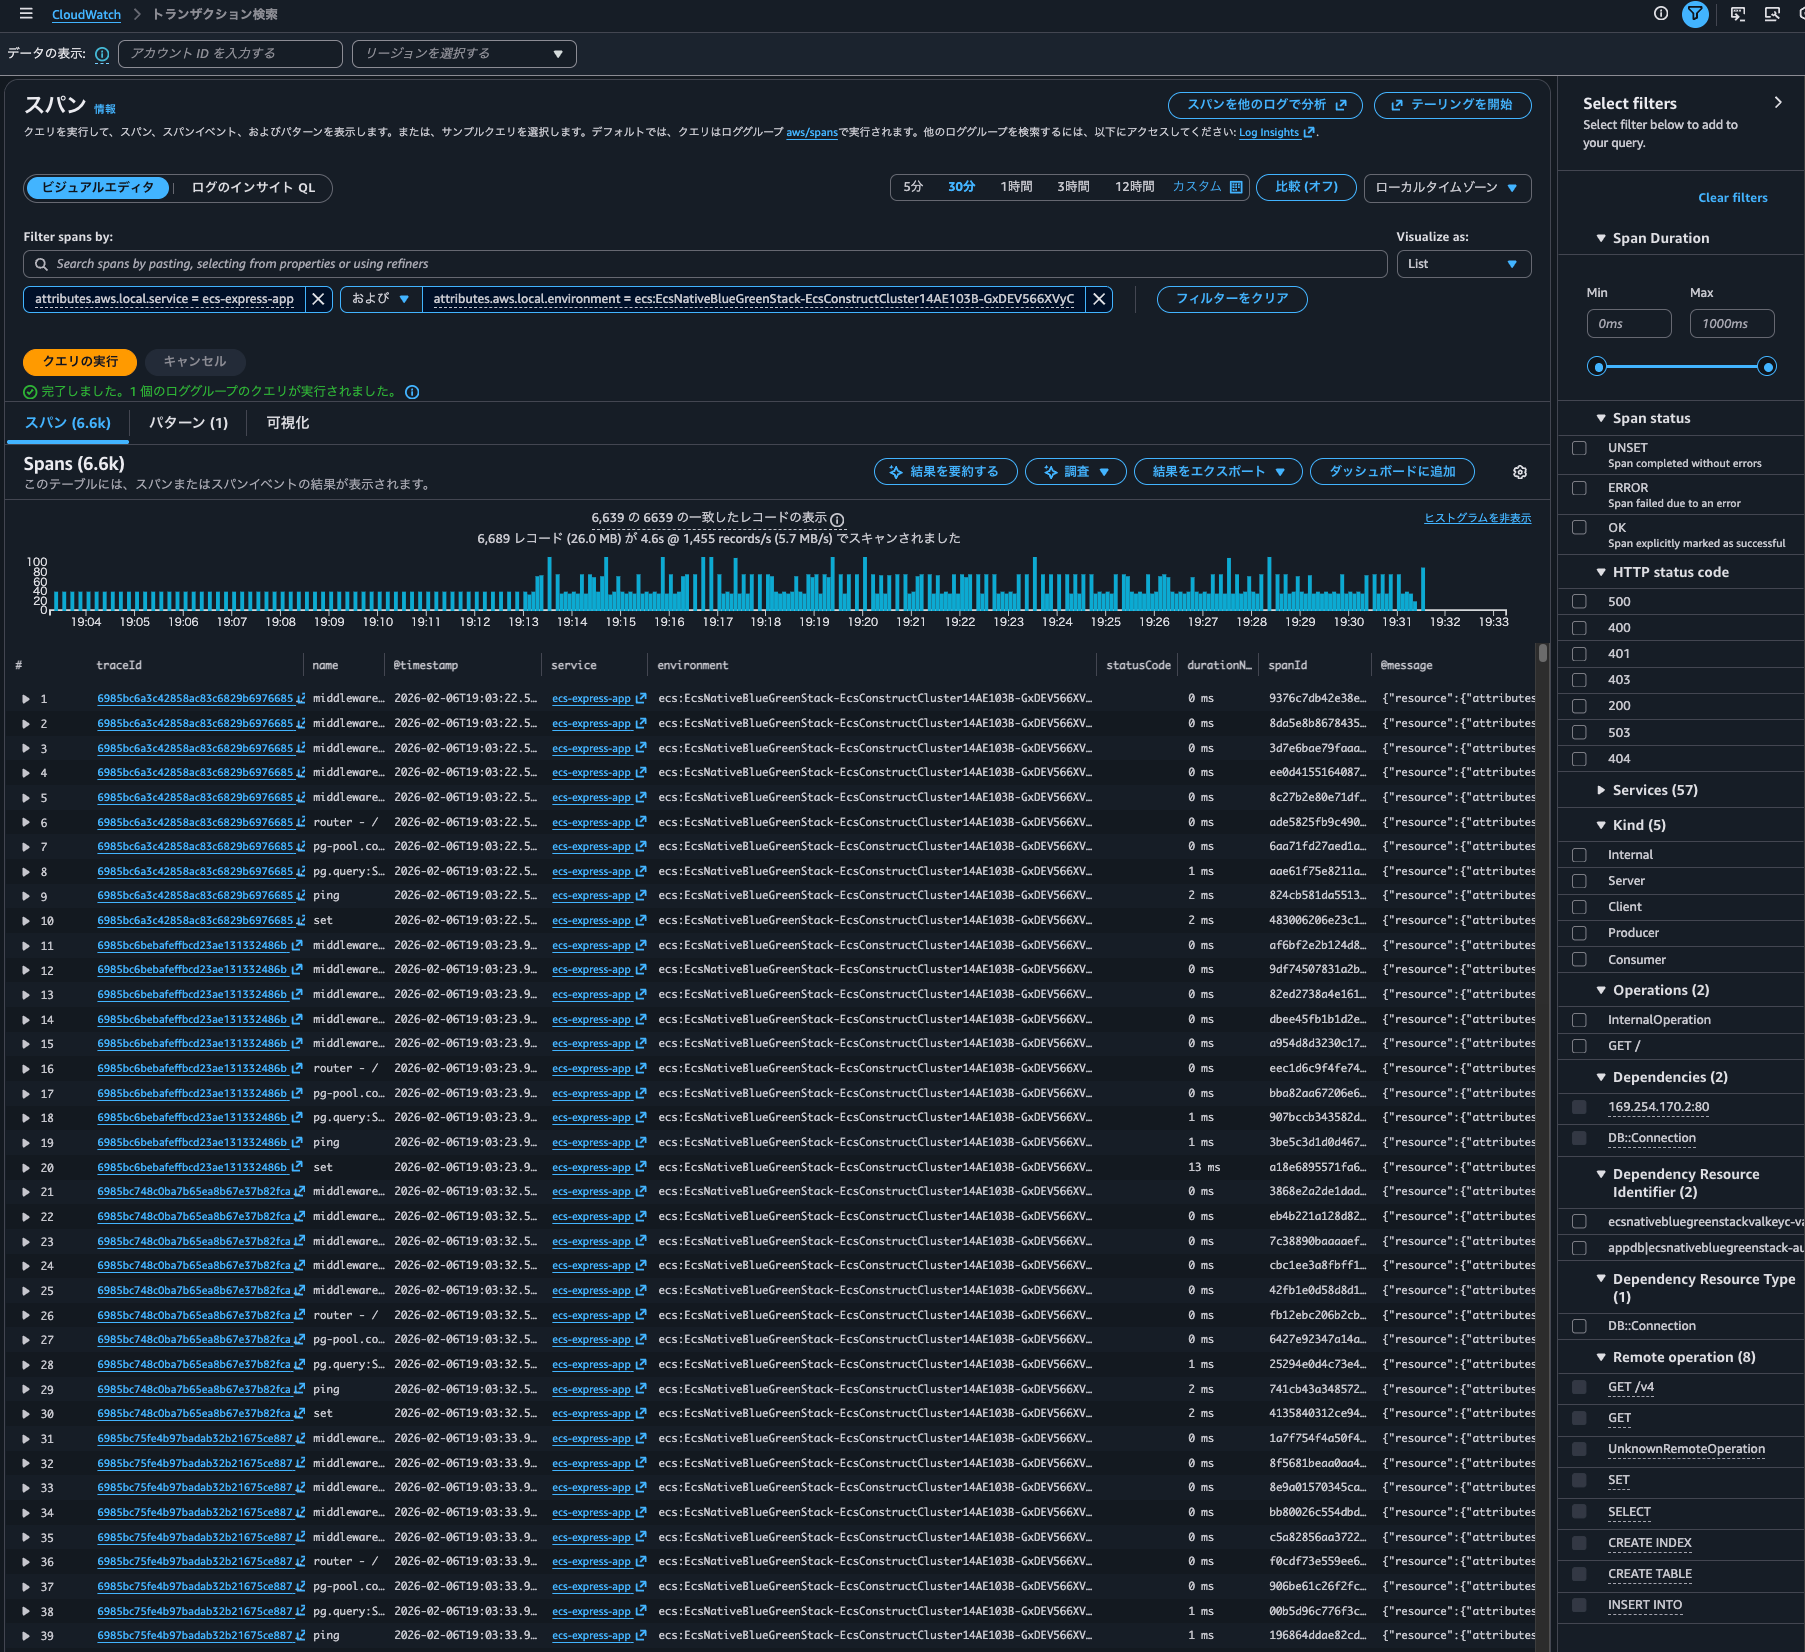
It displays without issue.
Time series can also be displayed:
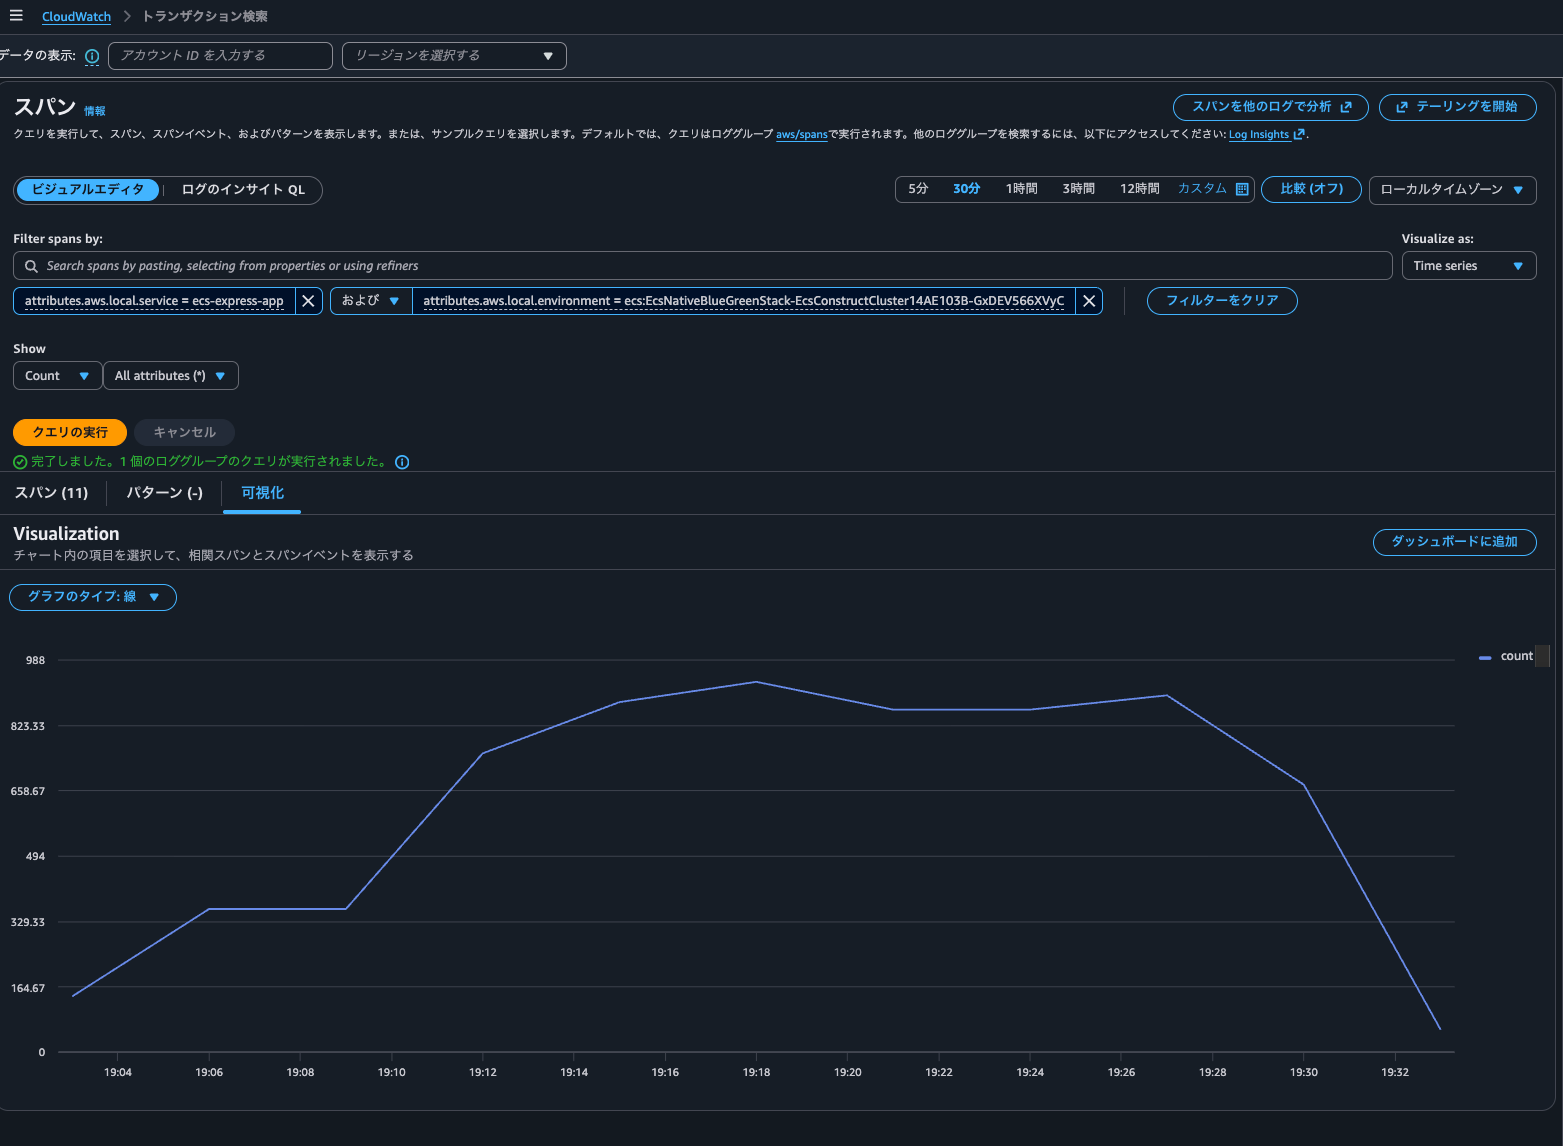
It seems that Trace indexing rate doesn't particularly affect Transaction Search queries.
When checking what API was called when executing a query in the Transaction Search console, I found that CloudWatch Logs' StartQuery API (Logs Insights) was executed against the aws/spans log group:
{
    "eventVersion": "1.11",
    "userIdentity": {
        "type": "AssumedRole",
        "principalId": "<Principal ID>",
        "arn": "arn:aws:sts::<AWS Account ID>:assumed-role/<IAM Role>/<Session Name>",
        "accountId": "<AWS Account ID>",
        "accessKeyId": "<Access Key>",
        "sessionContext": {
            "sessionIssuer": {
                "type": "Role",
                "principalId": "<Principal ID>",
                "arn": "arn:aws:iam::<AWS Account ID>:role/<IAM Role>",
                "accountId": "<AWS Account ID>",
                "userName": "<IAM User>"
            },
            "attributes": {
                "creationDate": "2026-02-07T08:32:00Z",
                "mfaAuthenticated": "true"
            }
        }
    },
    "eventTime": "2026-02-07T08:56:34Z",
    "eventSource": "logs.amazonaws.com",
    "eventName": "StartQuery",
    "awsRegion": "us-east-1",
    "sourceIPAddress": "<Source IP Address>",
    "userAgent": "Mozilla/5.0 (Macintosh; Intel Mac OS X 10_15_7) AppleWebKit/537.36 (KHTML, like Gecko) Chrome/144.0.0.0 Safari/537.36",
    "requestParameters": {
        "startTime": 1770450993,
        "endTime": 1770454593,
        "queryString": "SOURCE logGroups(namePrefix: [\"aws/spans\"], class: \"STANDARD\") START=-3600s END=0s |\nFIELDS traceId,name,@timestamp,attributes.aws.local.service as service,attributes.aws.local.environment as environment,attributes.http.response.status_code as statusCode,durationNano,spanId,@message,@log as accountId\n| SORT @timestamp ASC\n| LIMIT 10000",
        "dryRun": false
    },
    "responseElements": null,
    "additionalEventData": {
        "queryId": "a3ef5ee4-41a9-41ab-9fc8-b90ba5670ea9"
    },
    "requestID": "1182ee24-5b75-468d-b154-ecc35a60e624",
    "eventID": "d24010f9-1525-4296-83e2-076a49baa4a3",
    "readOnly": true,
    "eventType": "AwsApiCall",
    "apiVersion": "20140328",
    "managementEvent": true,
    "recipientAccountId": "<AWS Account ID>",
    "eventCategory": "Management",
    "tlsDetails": {
        "tlsVersion": "TLSv1.3",
        "cipherSuite": "TLS_AES_128_GCM_SHA256",
        "clientProvidedHostHeader": "logs.us-east-1.amazonaws.com"
    },
    "sessionCredentialFromConsole": "true"
}
Since Logs Insights is working, it seems we can extract correlated spans even without indexing.
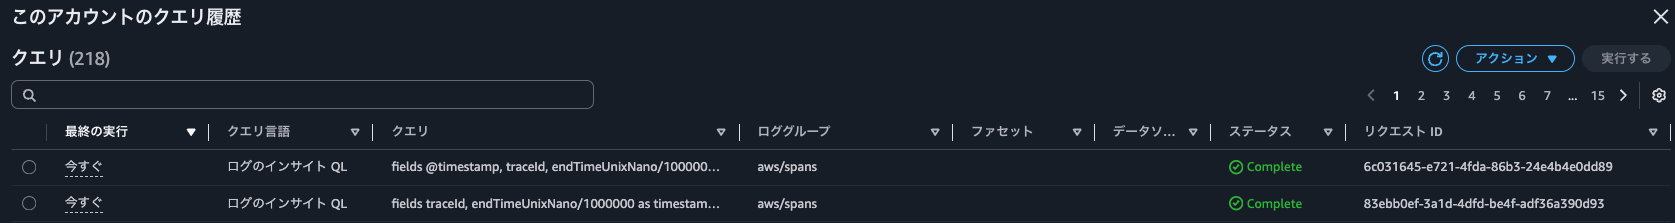
After clicking on a graph in a service and displaying correlated spans, I checked the Logs Insights query execution history and found the following two queries:
fields traceId, endTimeUnixNano/1000000 as timestamp, spanId, name, coalesce(attributes.http.response.status_code, attributes.http.status_code, status.code) as statusCode, durationNano/1000000 as duration
| filter attributes.aws.local.service="ecs-express-app" and attributes.aws.local.environment = "ecs:EcsNativeBlueGreenStack-EcsConstructCluster14AE103B-GxDEV566XVyC"  and not ispresent(attributes.aws.remote.service) and (attributes.aws.span.kind = "LOCAL_ROOT" or kind = "SERVER")  #no-attribute-selected
| stats count(*) as count
fields @timestamp, traceId, endTimeUnixNano/1000000 as timestamp, spanId, name, coalesce(attributes.http.response.status_code, attributes.http.status_code, status.code) as statusCode, durationNano/1000000 as duration
| filter attributes.aws.local.service="ecs-express-app" and attributes.aws.local.environment = "ecs:EcsNativeBlueGreenStack-EcsConstructCluster14AE103B-GxDEV566XVyC"  and not ispresent(attributes.aws.remote.service) and (attributes.aws.span.kind = "LOCAL_ROOT" or kind = "SERVER")
| limit 10
To reduce costs and shorten search times, it's a good idea to create field indexes. The following article is helpful regarding field indexes:
Checking the AWS official documentation, I found the following mention about features available with indexing:
Configure span indexing with trace summaries
Trace summaries are helpful for debugging transactions and are valuable for asynchronous processes. You need to index only a small fraction of spans as trace summaries.
Configure span indexing when you enable transaction search in the console or with the API. To enable transaction search, see Getting started with transaction search.
Features unlocked with trace summaries
The main features of X-Ray trace summaries are as follows:
- Trace summary search — Search and find traces from trace summaries.
- Trace summary analytics — Interpret your trace data.
- Trace insights — Analyze your trace data to identify issues with your application.
Let's try it out.
Trace summary search can be done from the management console under CloudWatch > Traces:
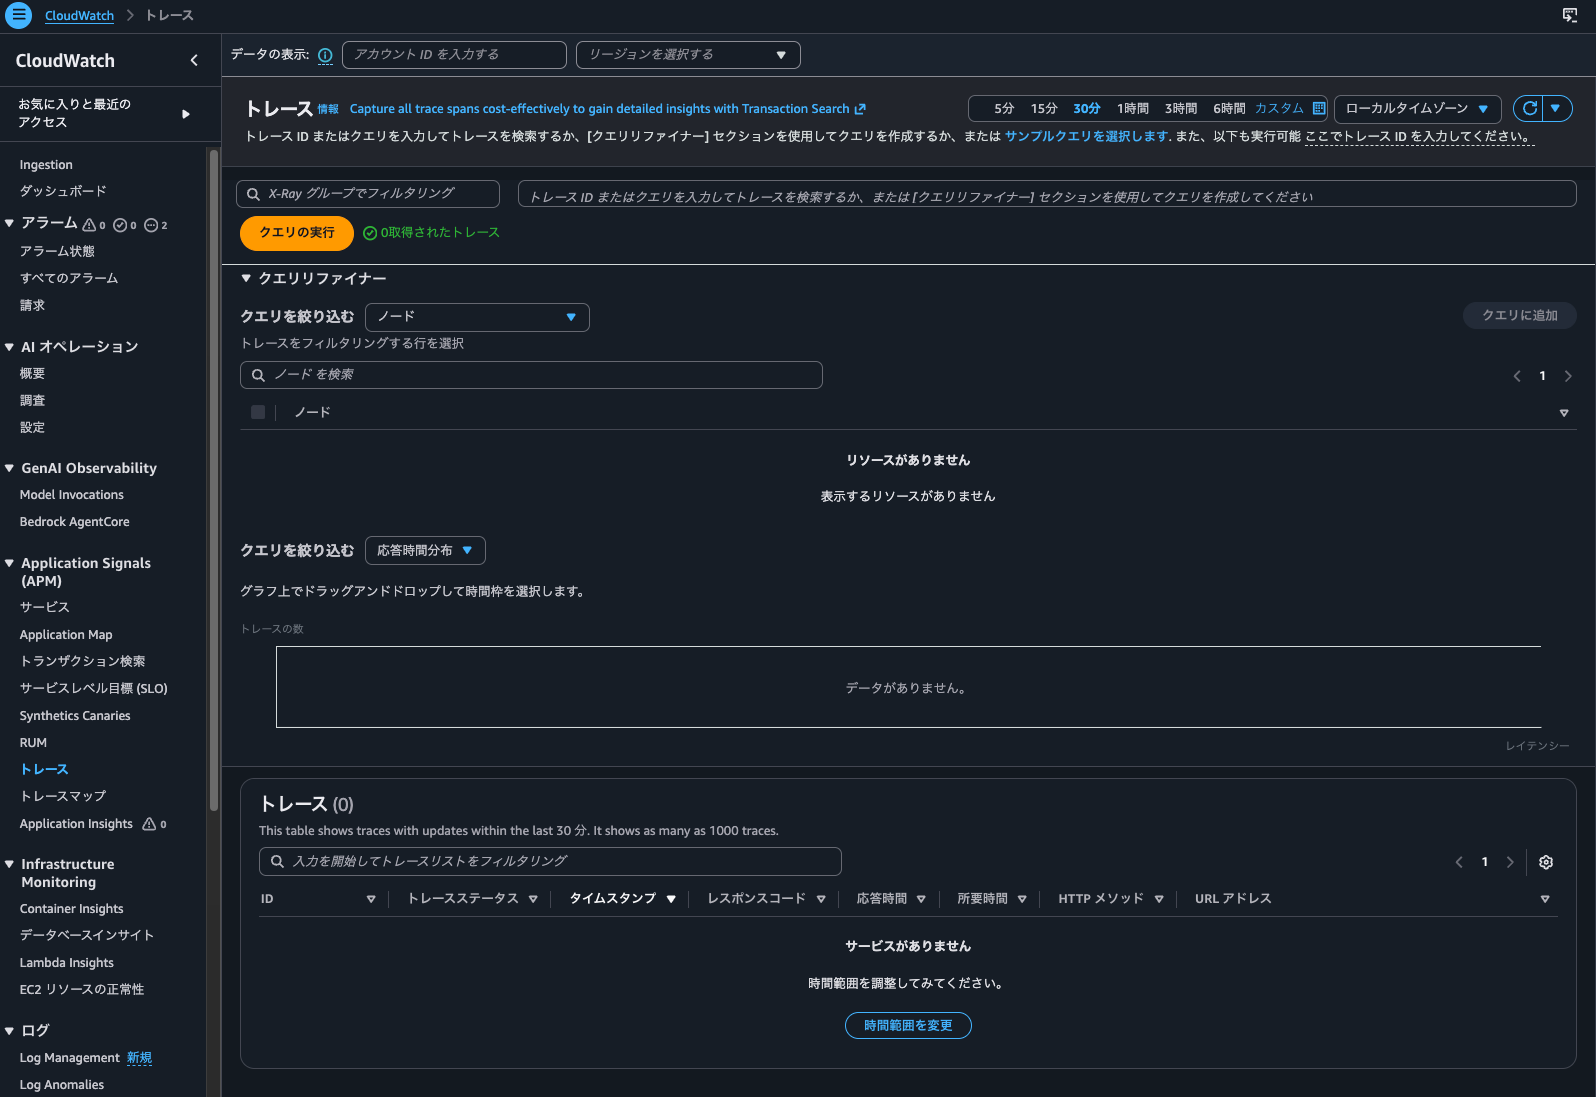
Yes, nothing is displayed.
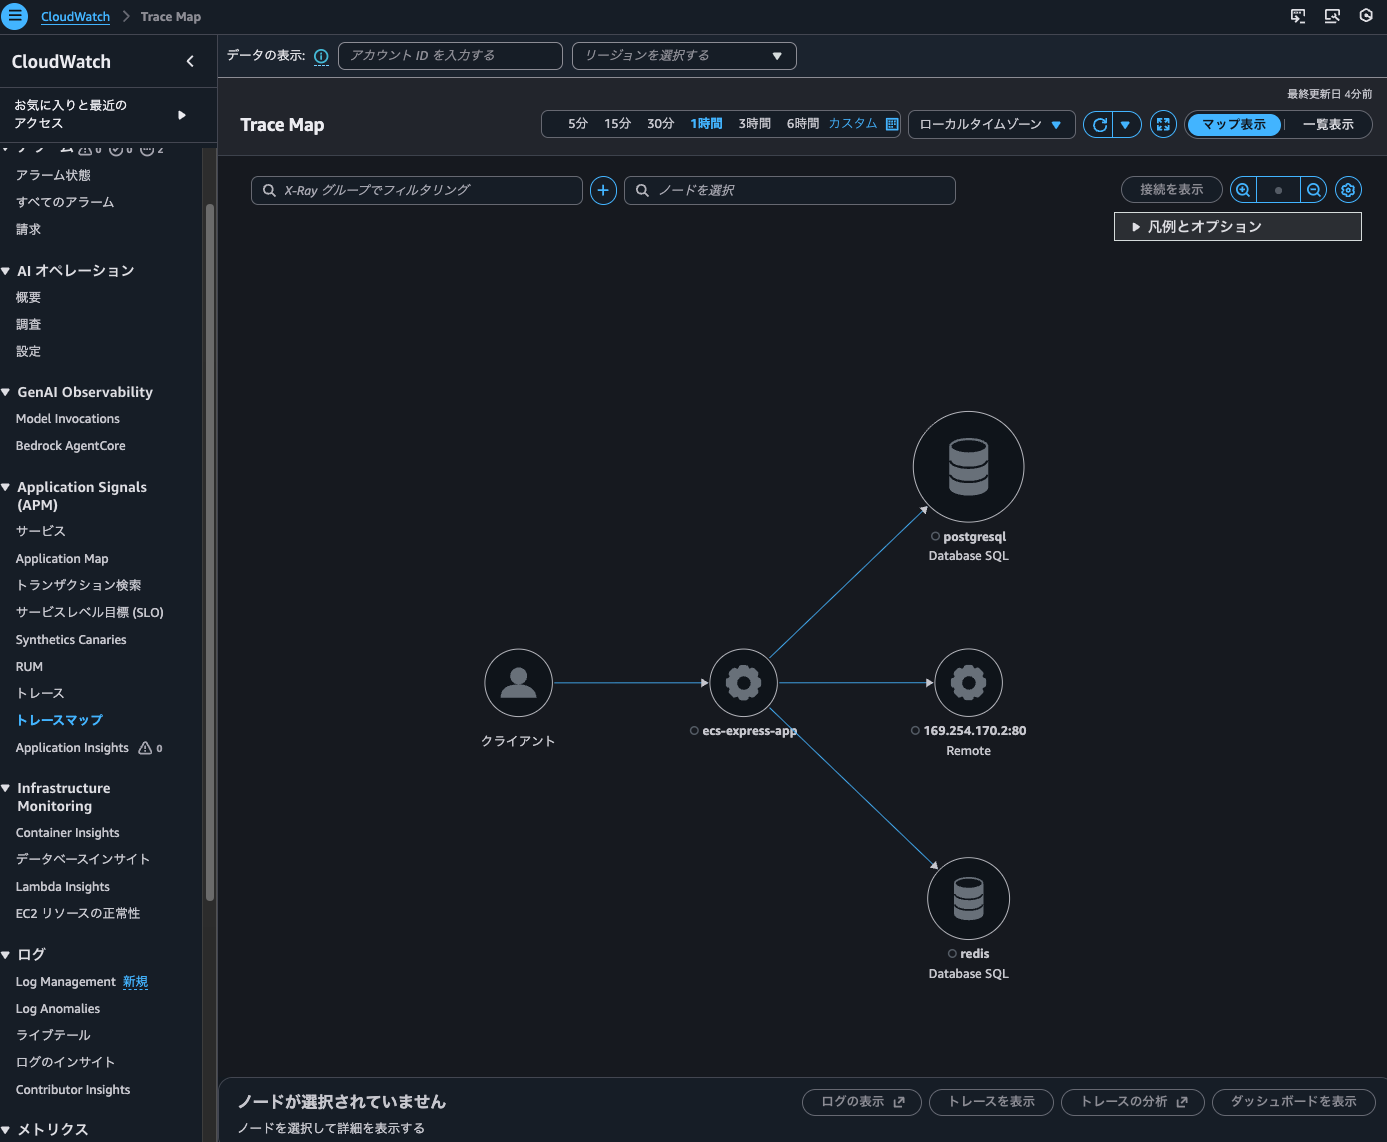
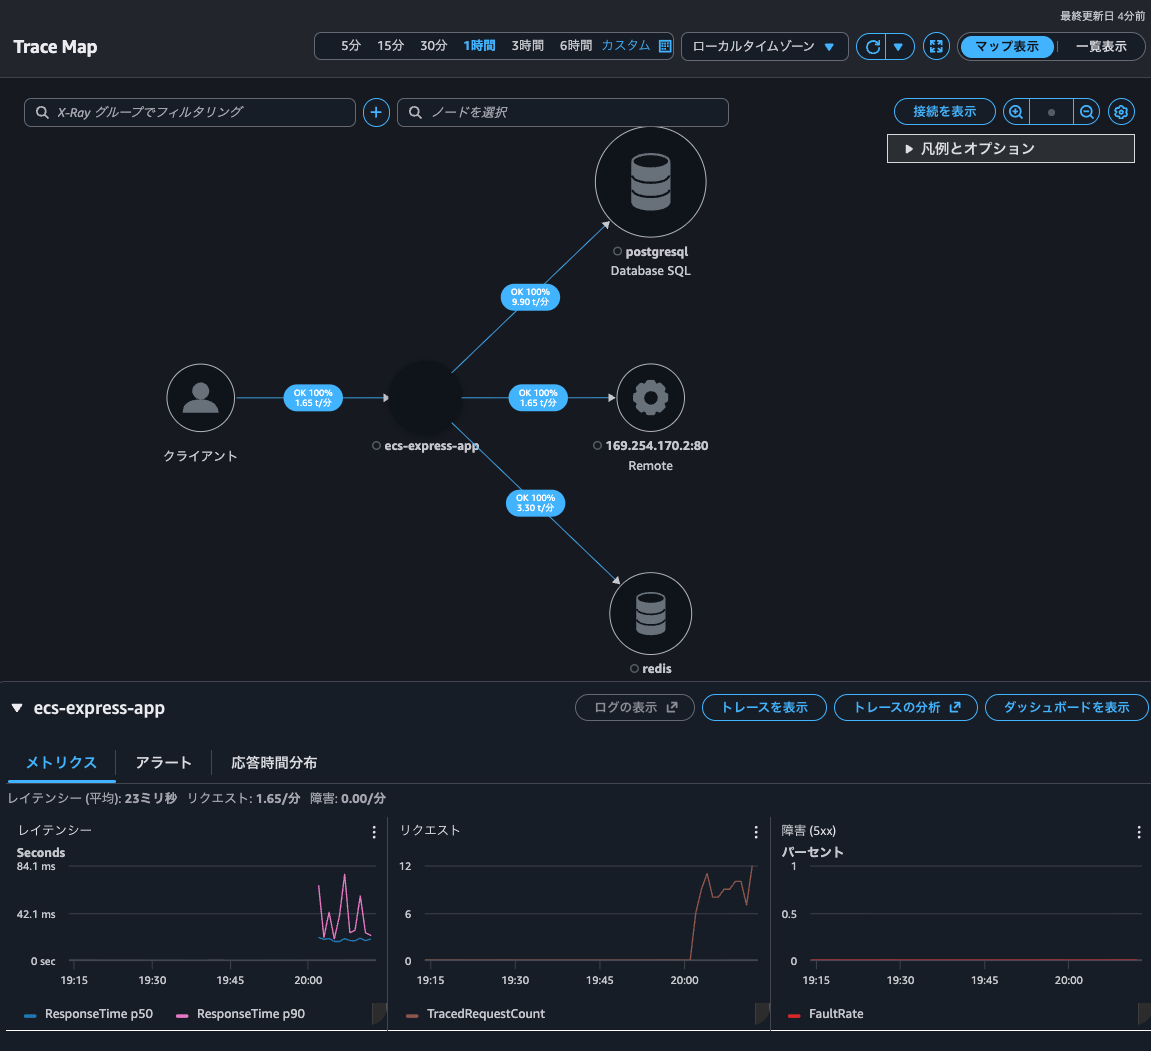
Next, let's check the Trace Map:
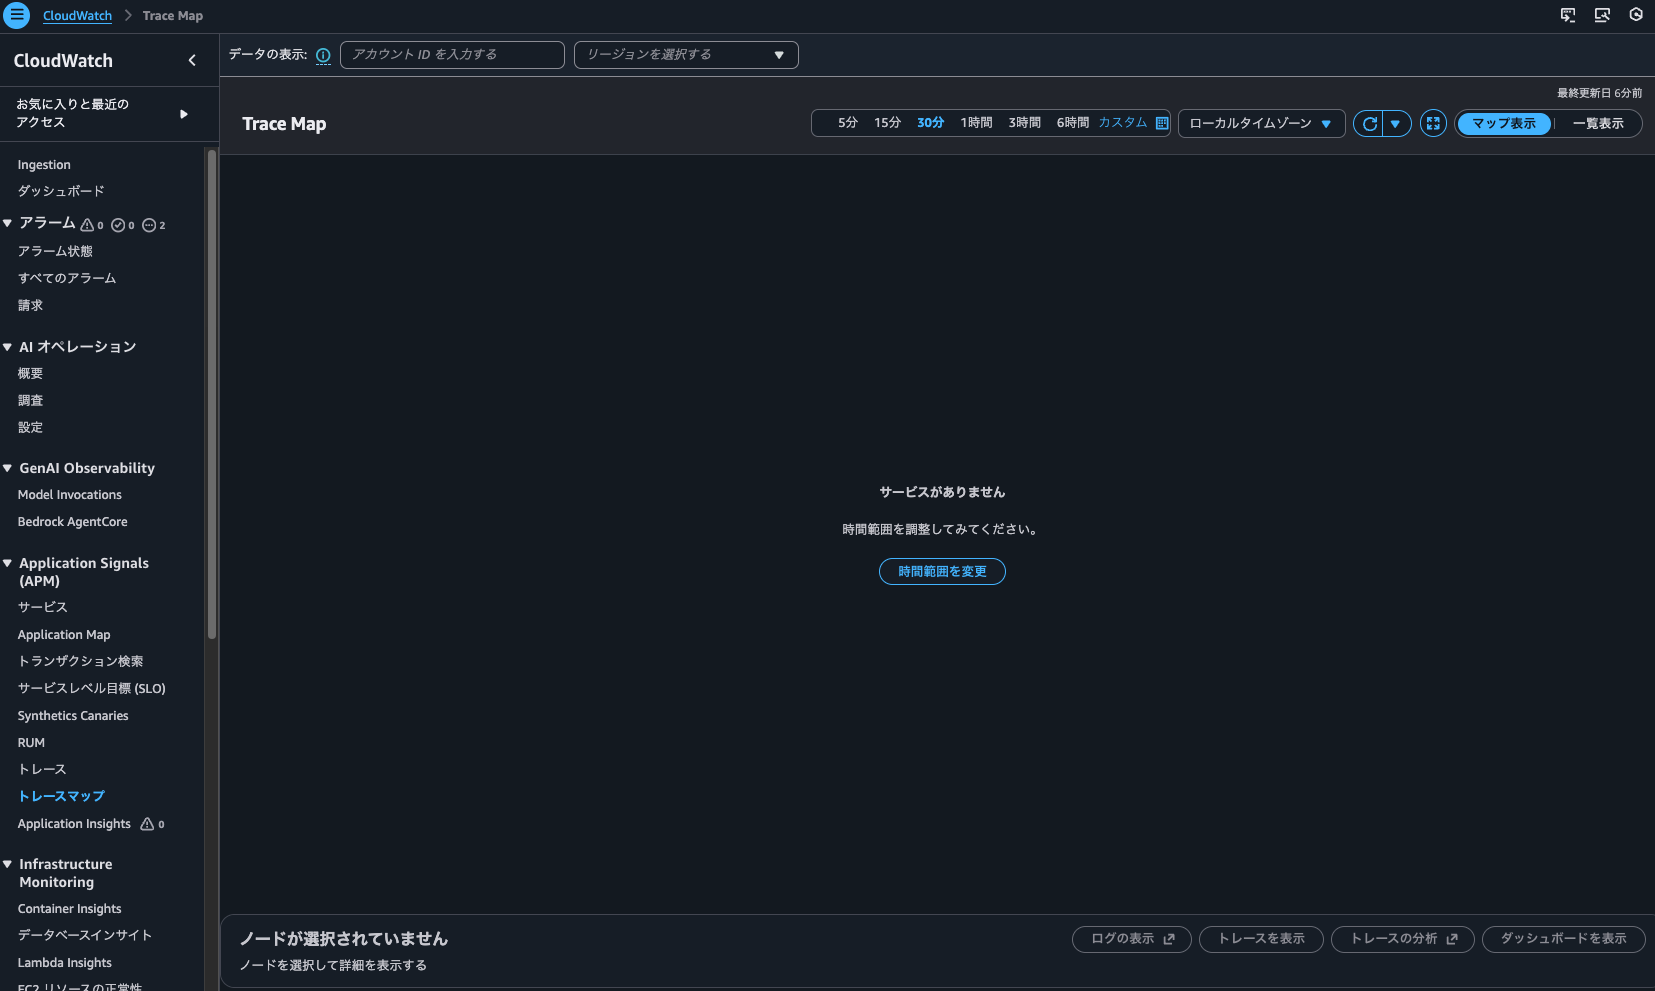
Nothing is displayed here either.
I also tried searching with get-trace-summaries, but the result was empty:
> aws xray get-trace-summaries \
    --start-time 2026-02-06T10:00:00Z \
    --end-time 2026-02-06T11:00:00Z \
    --filter-expression 'service("ecs-express-app")' \
    --region us-east-1
{
    "TraceSummaries": [],
    "TracesProcessedCount": 0,
    "ApproximateTime": "2026-02-06T20:00:00+09:00"
}
So it seems that traces without indexing can't be searched using Trace Map or trace searches that don't use Transaction Search.
By the way, I had accessed the service 278 times in total:
Trace indexing rate at 100%
Next, let's look at the case where Trace indexing rate is 100%.
Let's confirm with AWS CLI as well.
> aws xray get-trace-segment-destination
{
    "Destination": "CloudWatchLogs",
    "Status": "ACTIVE"
}

> aws xray get-indexing-rules
{
    "IndexingRules": [
        {
            "Name": "Default",
            "ModifiedAt": "2026-02-06T19:44:58+09:00",
            "Rule": {
                "Probabilistic": {
                    "DesiredSamplingPercentage": 100.0
                }
            }
        }
    ]
}
Just like before, I'll continue sending access requests for several tens of minutes.
After restarting, when checking the service in Application Signals, metrics were also recorded.
I was able to check the traces.
In Transaction Search, I was able to draw the time series of traces.
The Trace Map was now visible as well. When the Trace indexing rate was 0%, this wasn't displayed, so it seems only indexed traces are shown.
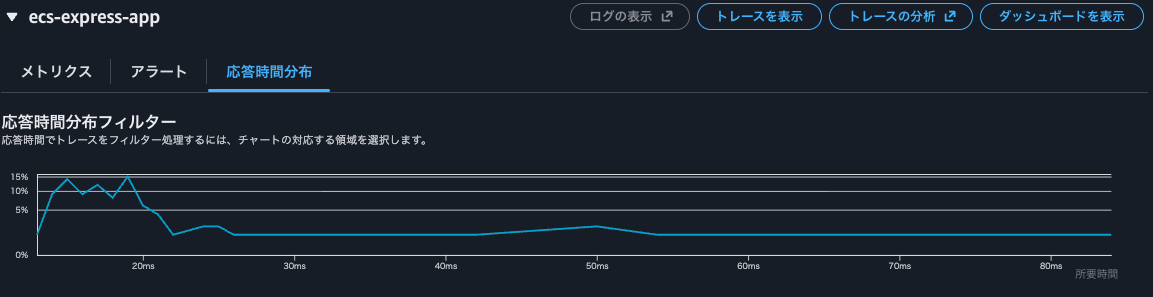
From the Trace Map, I could also check metrics and response time distribution.
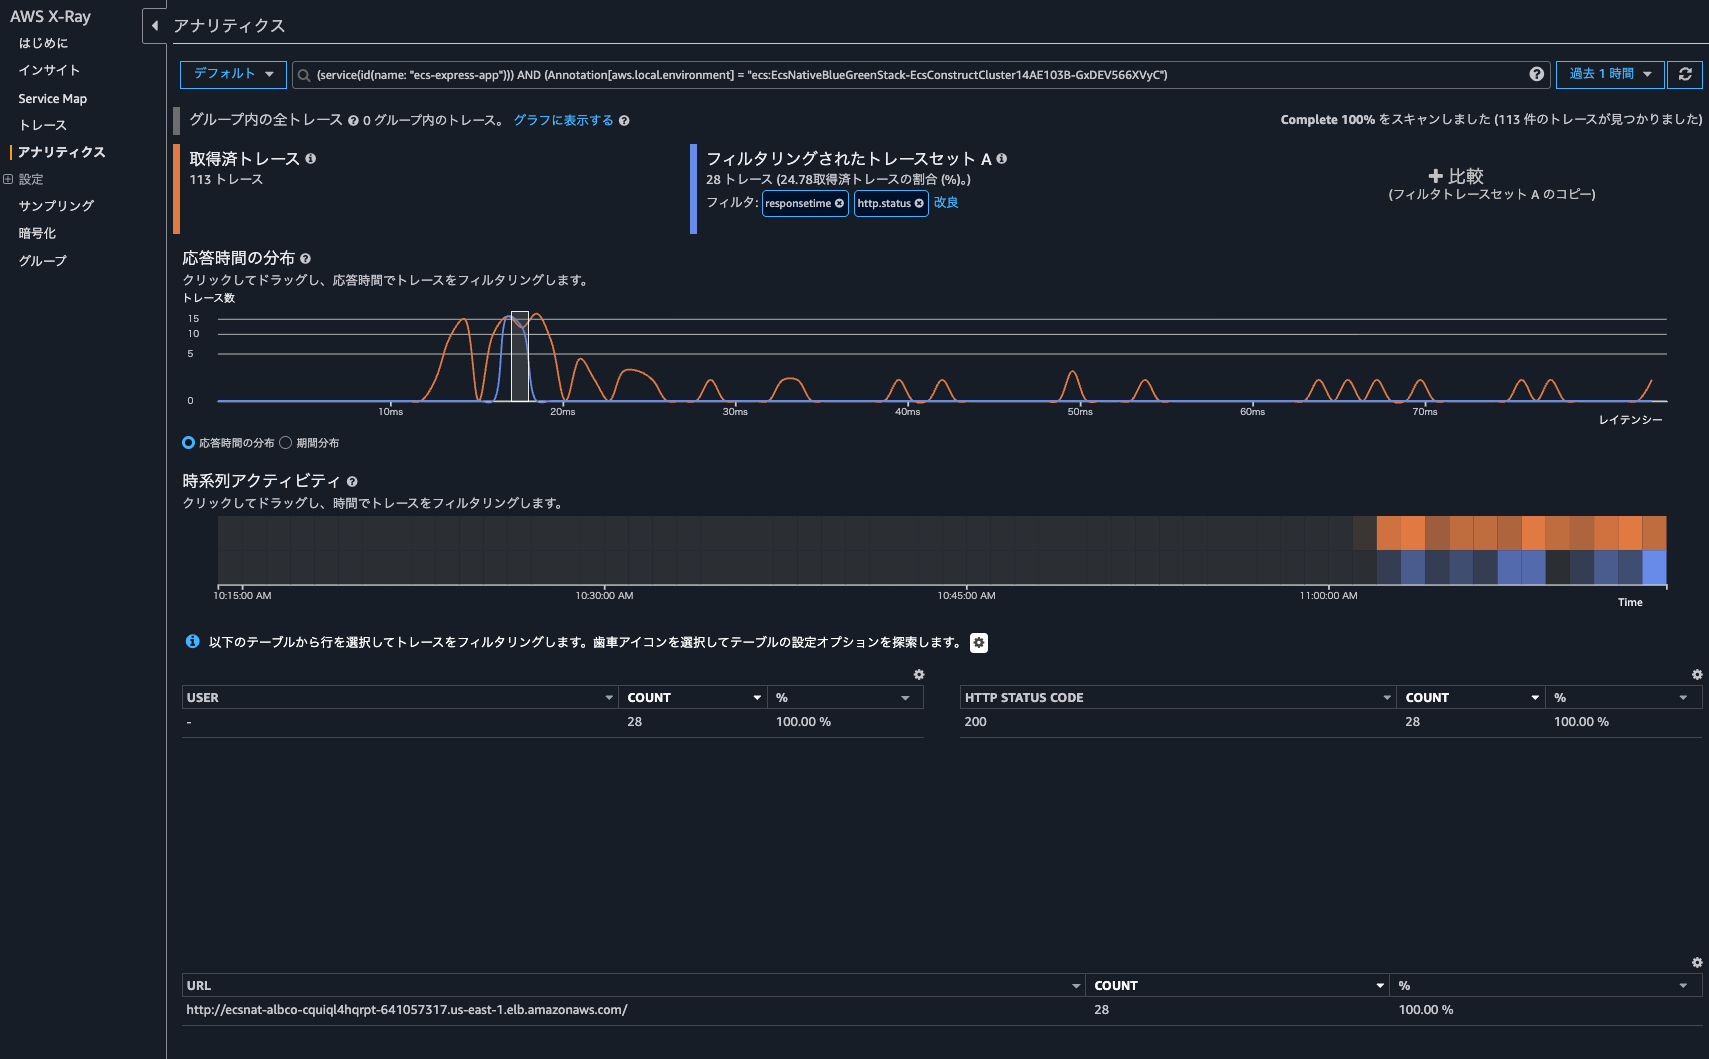
Clicking on "Analyze traces" opened the X-Ray analytics console rather than the CloudWatch console, allowing me to check more detailed information.
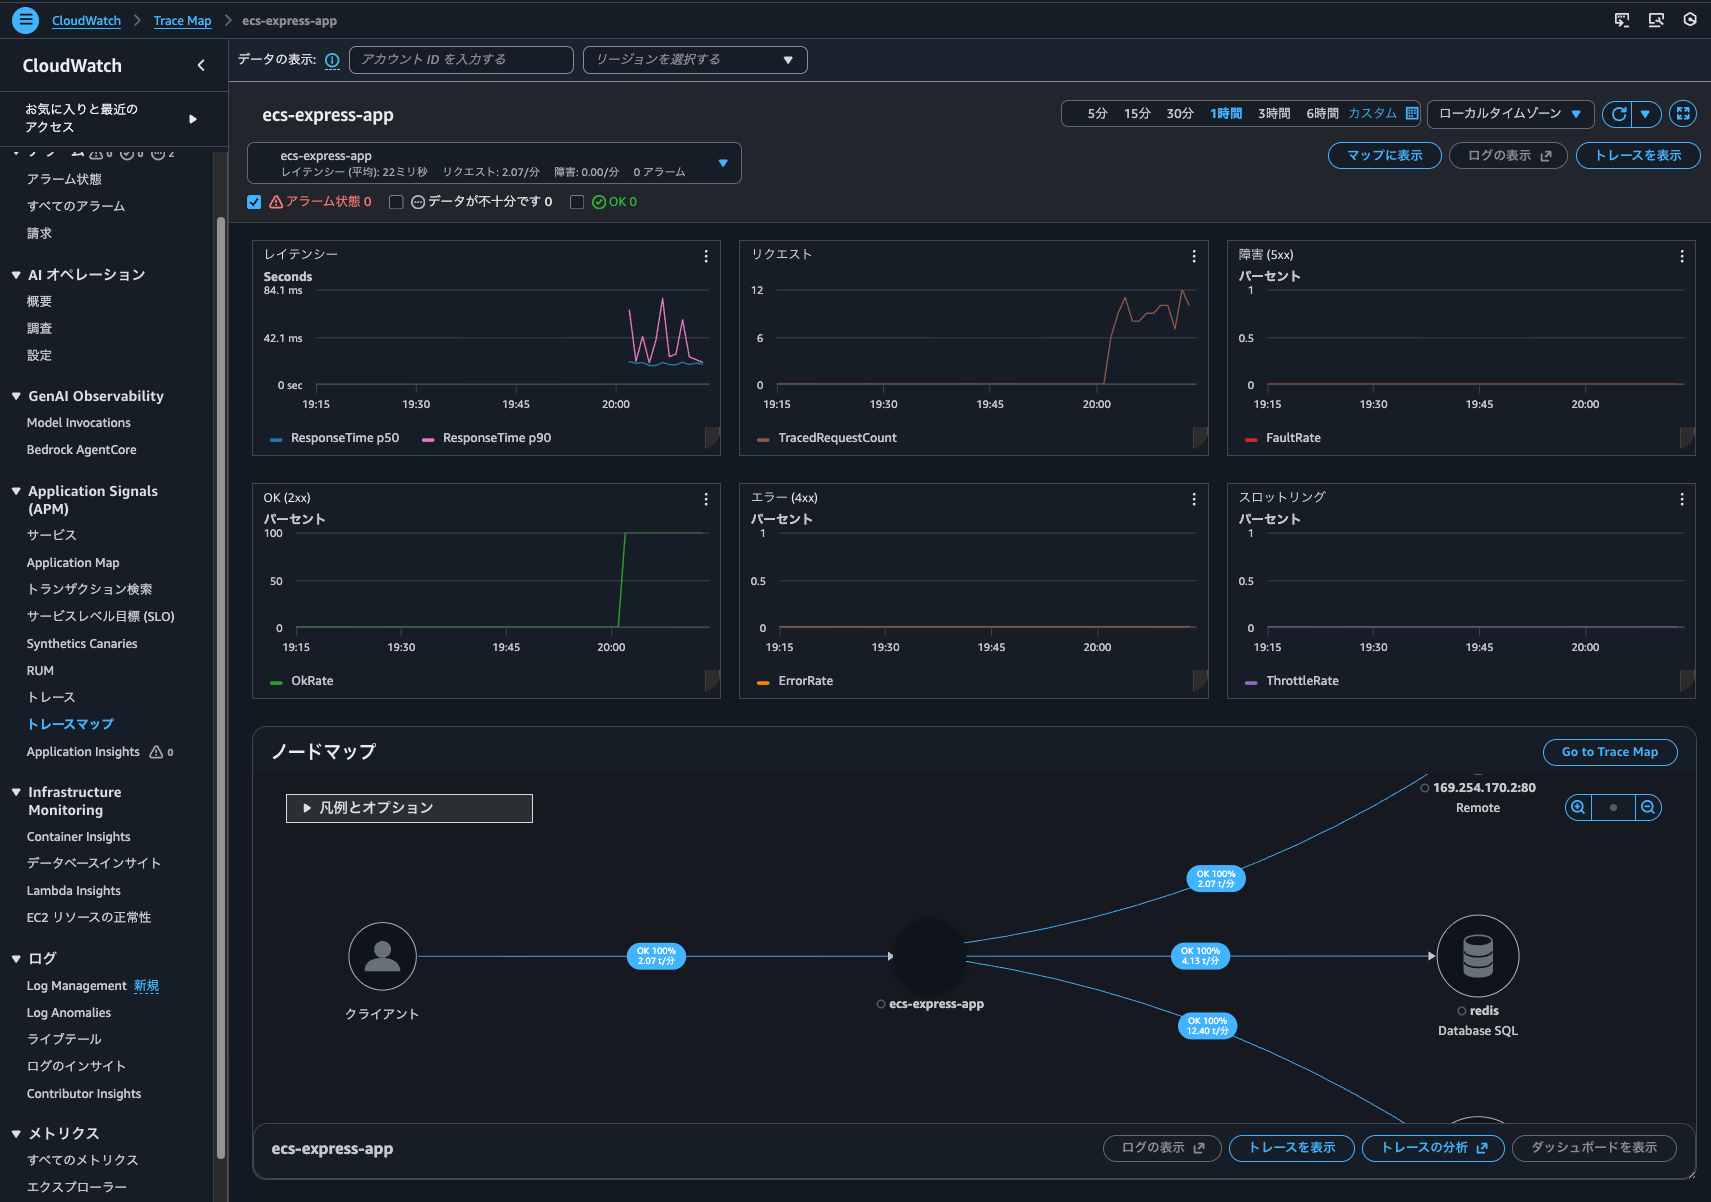
Going back to the Trace Map screen and clicking "View dashboard", I could see a dashboard with various metrics and node maps.
I could also check the trace list from "CloudWatch > Traces".
Although the search range is 1 hour, which includes the access time when Trace indexing rate was 0%, only accesses after the Trace indexing rate was set to 100% are displayed.
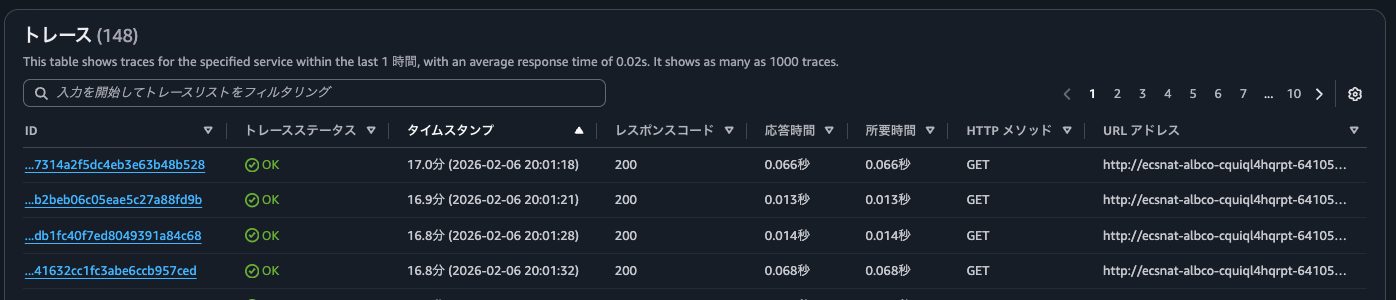
The results of executing get-trace-summaries are as follows. Traces of access after the Trace indexing rate was set to 100% were listed.
> aws xray get-trace-summaries \
--start-time 2026-02-06T11:00:00Z \
--end-time 2026-02-06T12:00:00Z \
--filter-expression 'service("ecs-express-app")' \
--region us-east-1
{
"TraceSummaries": [
{
"Id": "1-6985cbe8-fed5a5a79d14762589878bd4",
"StartTime": "2026-02-06T20:09:28+09:00",
"Duration": 0.016,
"ResponseTime": 0.016,
"HasFault": false,
"HasError": false,
"HasThrottle": false,
"IsPartial": false,
"Http": {
"HttpURL": "http://ecsnat-albco-cquiql4hqrpt-641057317.us-east-1.elb.amazonaws.com/",
"HttpStatus": 200,
"HttpMethod": "GET",
"UserAgent": "curl/8.7.1",
"ClientIp": "104.28.204.107"
},
"Annotations": {
"aws.local.environment": [
{
"AnnotationValue": {
"StringValue": "ecs:EcsNativeBlueGreenStack-EcsConstructCluster14AE103B-GxDEV566XVyC"
}
}
],
"aws.local.operation": [
{
"AnnotationValue": {
"StringValue": "SET"
}
},
{
"AnnotationValue": {
"StringValue": "GET"
}
},
{
"AnnotationValue": {
"StringValue": "GET /v4"
}
},
{
"AnnotationValue": {
"StringValue": "INSERT INTO"
}
},
{
"AnnotationValue": {
"StringValue": "UnknownRemoteOperation"
}
},
{
"AnnotationValue": {
"StringValue": "UnmappedOperation"
}
},
{
"AnnotationValue": {
"StringValue": "SELECT"
}
},
{
"AnnotationValue": {
"StringValue": "GET /"
}
}
],
"aws.local.resource.identifier": [
{
"AnnotationValue": {
"StringValue": "appdb|ecsnativebluegreenstack-auroraconstructclustercc23-nubx1xlfqgbp.cluster-cicjym7lykmq.us-east-1.rds.amazonaws.com|5432"
}
},
{
"AnnotationValue": {
"StringValue": "ecsnativebluegreenstackvalkeyc-valkey-pvjbiy.serverless.use1.cache.amazonaws.com|6379"
}
}
],
"aws.local.resource.type": [
{
"AnnotationValue": {
"StringValue": "DB::Connection"
}
}
],
"aws.local.service": [
{
"AnnotationValue": {
"StringValue": "169.254.170.2:80"
}
},
{
"AnnotationValue": {
"StringValue": "postgresql"
}
},
{
"AnnotationValue": {
"StringValue": "ecs-express-app"
}
},
{
"AnnotationValue": {
"StringValue": "redis"
}
}
],
"aws.remote.operation": [
{
"AnnotationValue": {
"StringValue": "SET"
}
},
{
"AnnotationValue": {
"StringValue": "GET"
}
},
{
"AnnotationValue": {
"StringValue": "GET /v4"
}
},
{
"AnnotationValue": {
"StringValue": "INSERT INTO"
}
},
{
"AnnotationValue": {
"StringValue": "UnknownRemoteOperation"
}
},
{
"AnnotationValue": {
"StringValue": "SELECT"
}
}
],
"aws.remote.resource.identifier": [
{
"AnnotationValue": {
"StringValue": "appdb|ecsnativebluegreenstack-auroraconstructclustercc23-nubx1xlfqgbp.cluster-cicjym7lykmq.us-east-1.rds.amazonaws.com|5432"
}
},
{
"AnnotationValue": {
"StringValue": "ecsnativebluegreenstackvalkeyc-valkey-pvjbiy.serverless.use1.cache.amazonaws.com|6379"
}
}
],
"aws.remote.resource.type": [
{
"AnnotationValue": {
"StringValue": "DB::Connection"
}
}
],
"aws.remote.service": [
{
"AnnotationValue": {
"StringValue": "169.254.170.2:80"
}
},
{
"AnnotationValue": {
"StringValue": "postgresql"
}
},
{
"AnnotationValue": {
"StringValue": "redis"
}
}
],
"span.kind": [
{
"AnnotationValue": {
"StringValue": "SERVER"
}
},
{
"AnnotationValue": {
"StringValue": "INTERNAL"
}
},
{
"AnnotationValue": {
"StringValue": "CLIENT"
}
}
],
"span.name": [
{
"AnnotationValue": {
"StringValue": "set"
}
},
{
"AnnotationValue": {
"StringValue": "middleware - session"
}
},
{
"AnnotationValue": {
"StringValue": "router - /"
}
},
{
"AnnotationValue": {
"StringValue": "pg-pool.connect"
}
},
{
"AnnotationValue": {
"StringValue": "GET /"
}
},
{
"AnnotationValue": {
"StringValue": "middleware - jsonParser"
}
},
{
"AnnotationValue": {
"StringValue": "middleware - expressInit"
}
},
{
"AnnotationValue": {
"StringValue": "middleware - query"
}
},
{
"AnnotationValue": {
"StringValue": "pg.query:SELECT appdb"
}
},
{
"AnnotationValue": {
"StringValue": "GET"
}
},
{
"AnnotationValue": {
"StringValue": "get"
}
},
{
"AnnotationValue": {
"StringValue": "middleware - result"
}
},
{
"AnnotationValue": {
"StringValue": "request handler - /"
}
},
{
"AnnotationValue": {
"StringValue": "pg.query:INSERT appdb"
}
},
{
"AnnotationValue": {
"StringValue": "tcp.connect"
}
}
]
},
"Users": [],
"ServiceIds": [
{
"Name": "169.254.170.2:80",
"Names": [
"169.254.170.2:80"
],
"Type": "remote"
},
{
"Name": "postgresql",
"Names": [
"postgresql"
],
"Type": "Database::SQL"
},
{
"Name": "ecs-express-app",
"Names": [
"ecs-express-app"
],
"Type": "client"
},
{
"Name": "redis",
"Names": [
"redis"
],
"Type": "Database::SQL"
},
{
"Name": "ecs-express-app",
"Names": [
"ecs-express-app"
]
}
],
"ResourceARNs": [],
"InstanceIds": [],
"AvailabilityZones": [],
"EntryPoint": {
"Name": "ecs-express-app",
"Names": [
"ecs-express-app"
]
},
"FaultRootCauses": [],
"ErrorRootCauses": [],
"ResponseTimeRootCauses": [],
"Revision": 1
},
{
"Id": "1-6985cba7-178c1d301bd6768860d8f4d9",
"StartTime": "2026-02-06T20:08:23+09:00",
"Duration": 0.014,
"ResponseTime": 0.014,
.
.
(omitted)
.
.
"ResourceARNs": [],
"InstanceIds": [],
"AvailabilityZones": [],
"EntryPoint": {
"Name": "ecs-express-app",
"Names": [
"ecs-express-app"
]
},
"FaultRootCauses": [],
"ErrorRootCauses": [],
"ResponseTimeRootCauses": [],
"Revision": 1
}
],
"TracesProcessedCount": 0,
"ApproximateTime": "2026-02-06T21:00:00+09:00"
}
> aws xray get-trace-summaries \
--start-time 2026-02-06T11:00:00Z \
--end-time 2026-02-06T12:00:00Z \
--filter-expression 'service("ecs-express-app")' \
--query 'sort_by(TraceSummaries, &StartTime)[].{Id:Id,StartTime:StartTime}' \
--output table \
--region us-east-1
----------------------------------------------------------------------
| GetTraceSummaries |
+--------------------------------------+-----------------------------+
| Id | StartTime |
+--------------------------------------+-----------------------------+
| 1-6985c9fe-7314a2f5dc4eb3e63b48b528 | 2026-02-06T20:01:18+09:00 |
| 1-6985ca01-b2beb06c05eae5c27a88fd9b | 2026-02-06T20:01:21+09:00 |
| 1-6985ca08-db1fc40f7ed8049391a84c68 | 2026-02-06T20:01:28+09:00 |
.
.
(omitted)
.
.
| 1-6985ce26-f0197a153b3c9a49f69eae7b | 2026-02-06T20:19:02+09:00 |
| 1-6985ce27-09c6ff1f9d0743cee241daed | 2026-02-06T20:19:03+09:00 |
| 1-6985ce2c-9f6a71140164f8c2d704a692 | 2026-02-06T20:19:08+09:00 |
+--------------------------------------+-----------------------------+
> aws xray get-trace-summaries \
--start-time 2026-02-06T11:00:00Z \
--end-time 2026-02-06T12:00:00Z \
--filter-expression 'service("ecs-express-app")' \
--query 'length(TraceSummaries)' \
--region us-east-1
171
It seems that having traces indexed allows you to search for traces without using Trace Map or Transaction Search. If you want to use these features, it's a good idea to adjust the Trace indexing rate to ensure traces are indexed.
Can traces recorded by X-Ray tracing be searched even when Trace indexing rate is 0%?
I became curious about whether traces recorded by X-Ray tracing can be searched even when Trace indexing rate is 0%.
Trace indexing rate is a region-level setting. Even if we're planning to check traces using Application Signals or Transaction Search (which is actually Logs Insights), we wouldn't want to lose the ability to search for Step Functions traces by setting the Trace indexing rate to a small value like 1%.
Let's check if traces recorded by X-Ray tracing can be searched even when Trace indexing rate is 0%.
First, for comparison, when Trace indexing rate is 100%. As shown below, X-Ray tracing is enabled for the Step Functions state machine.
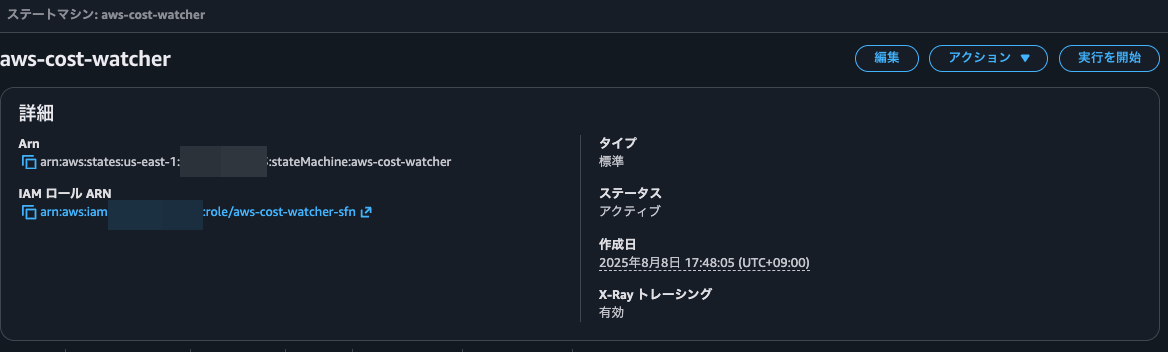
When executing the state machine, I could see a link to the trace map.
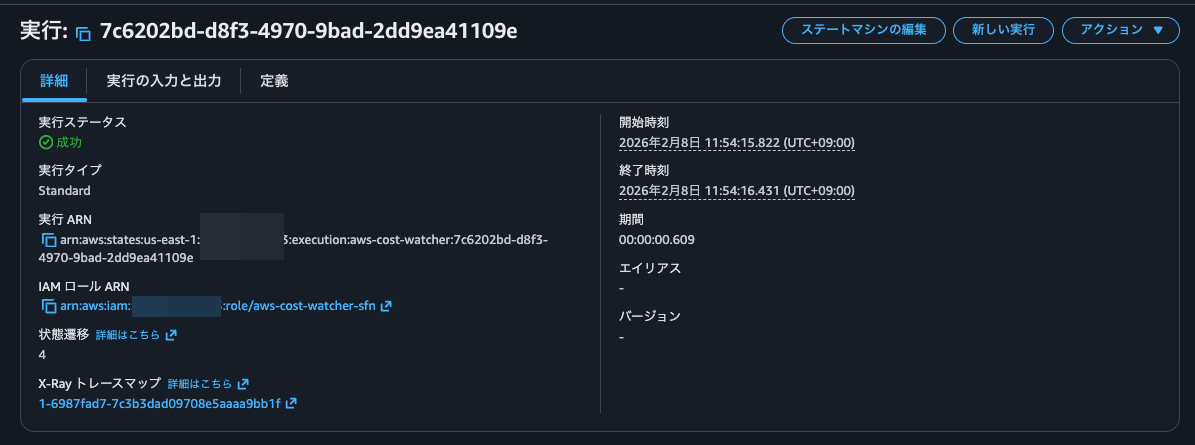
Clicking on it, I could see the trace details.
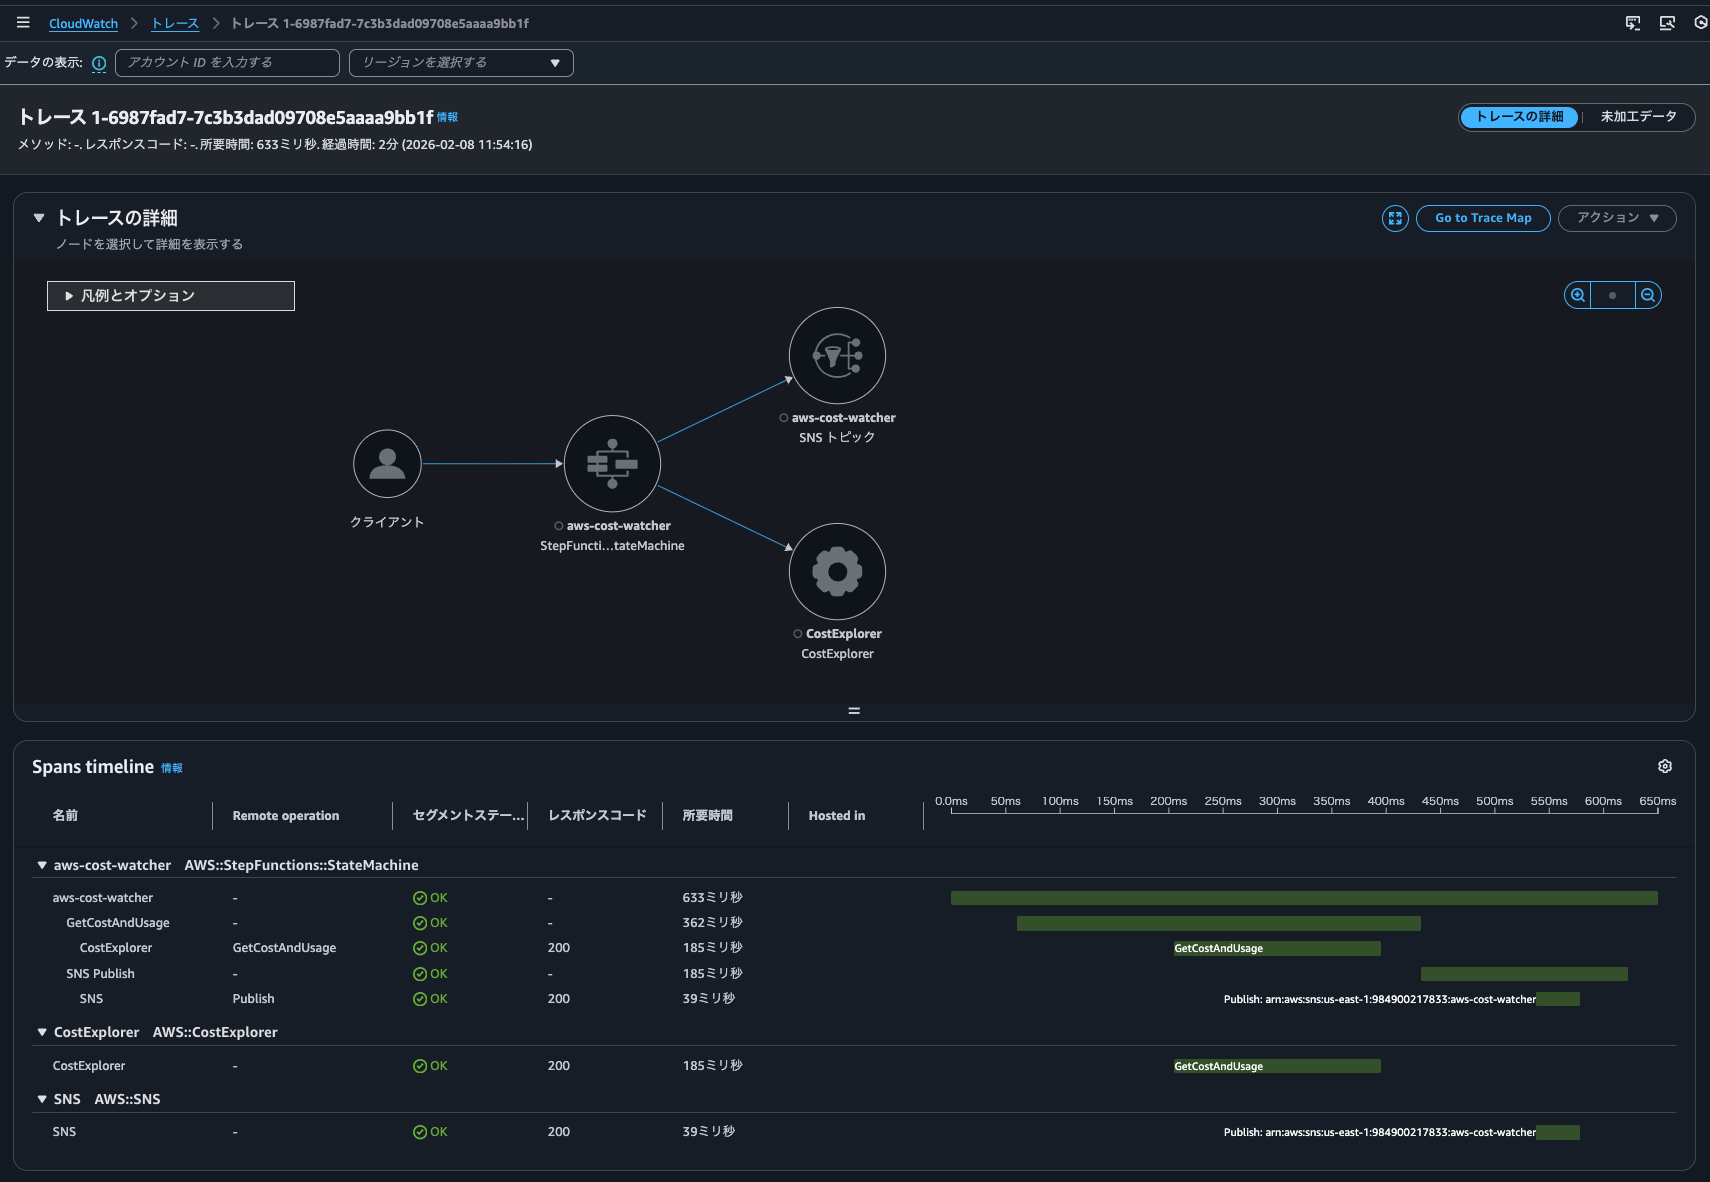
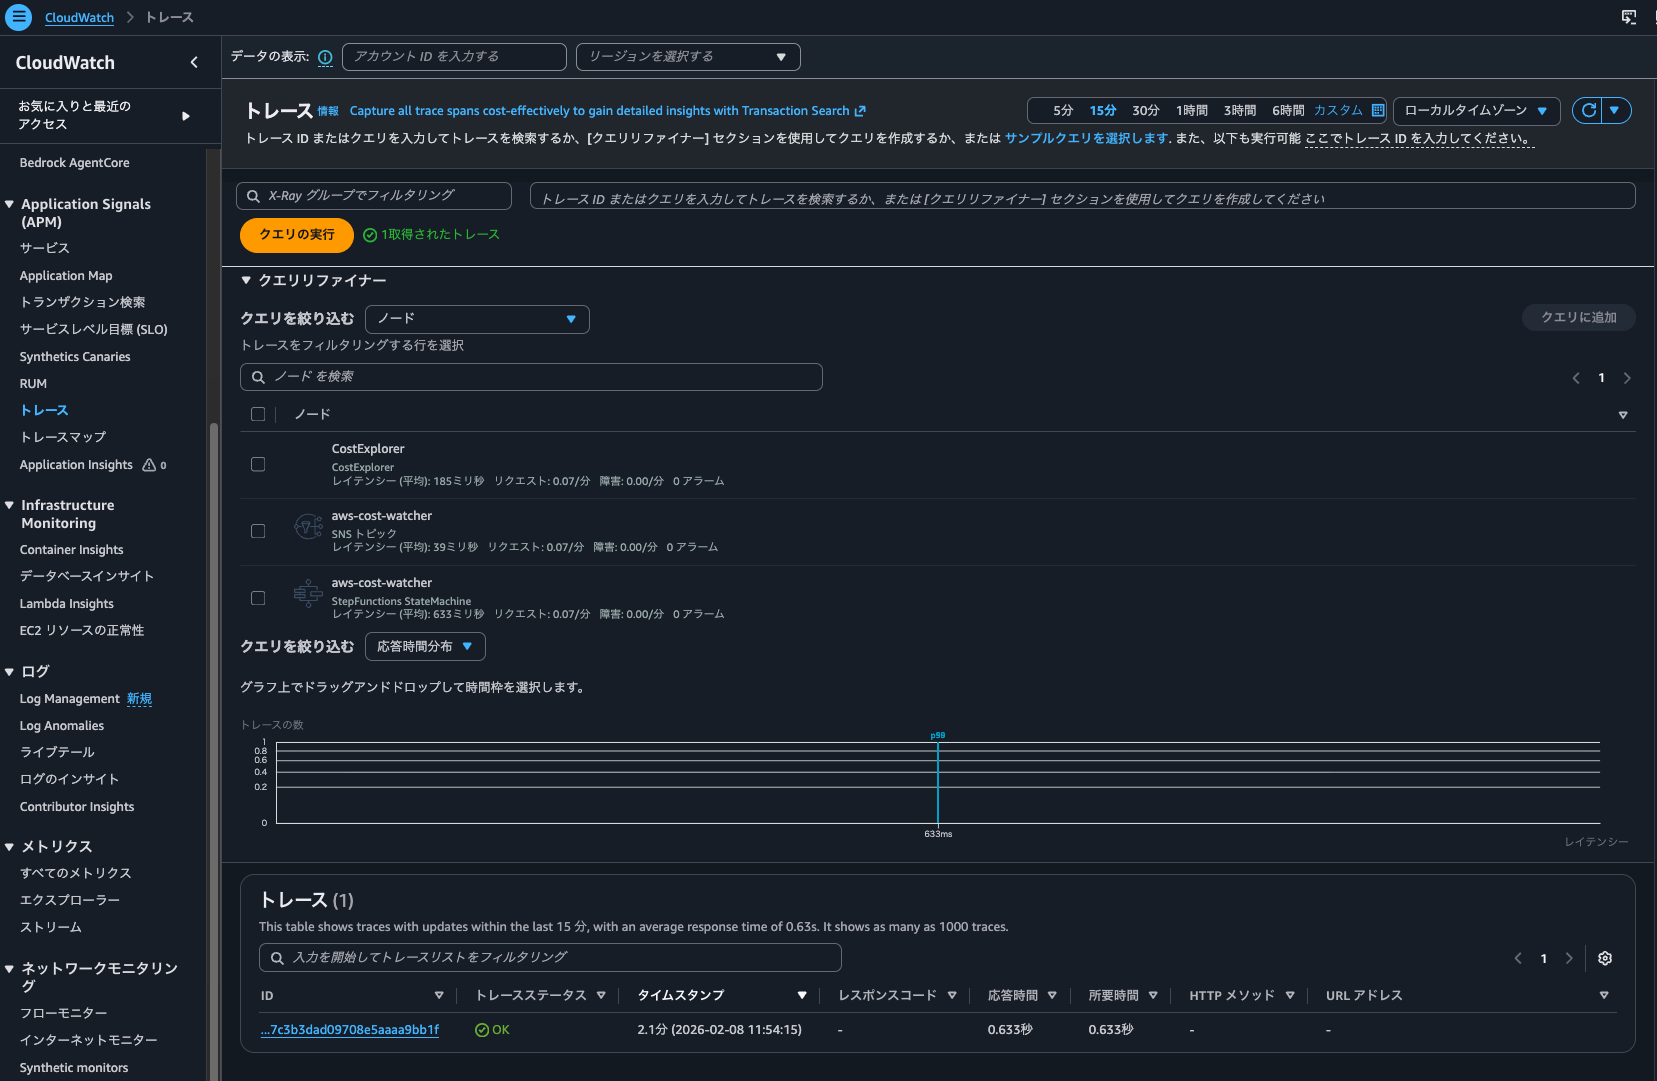
I could also check the trace list from "CloudWatch > Traces".
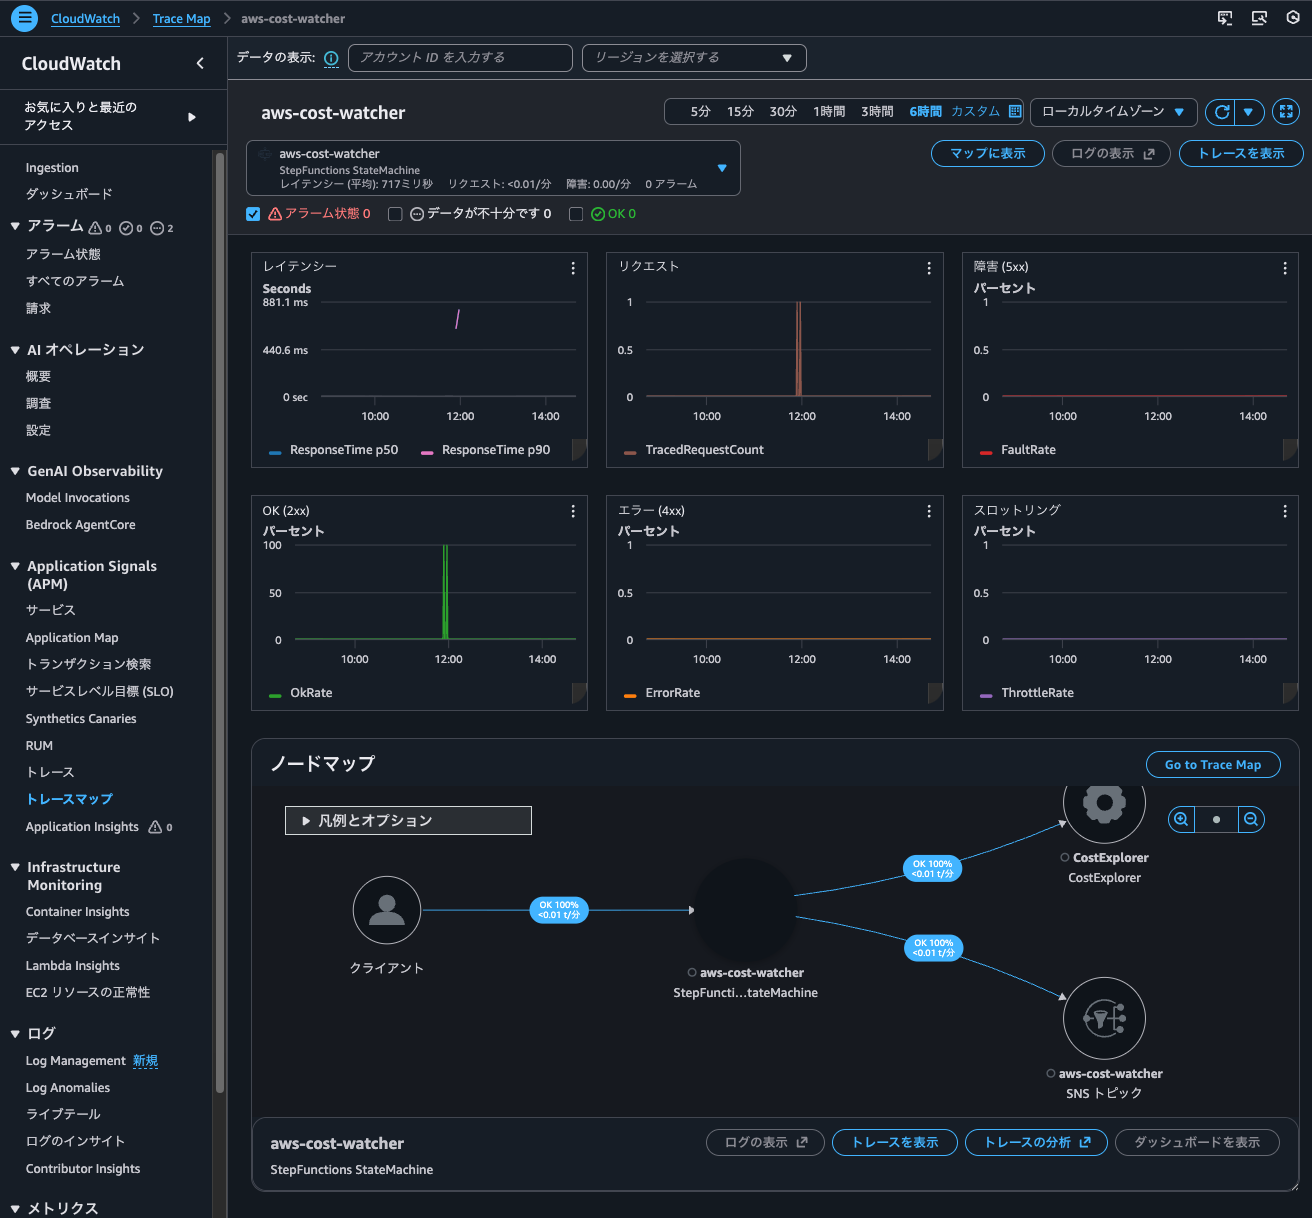
Next, when Trace indexing rate is 0%.
I executed the state machine again, and I could still check the trace list from "CloudWatch > Traces".
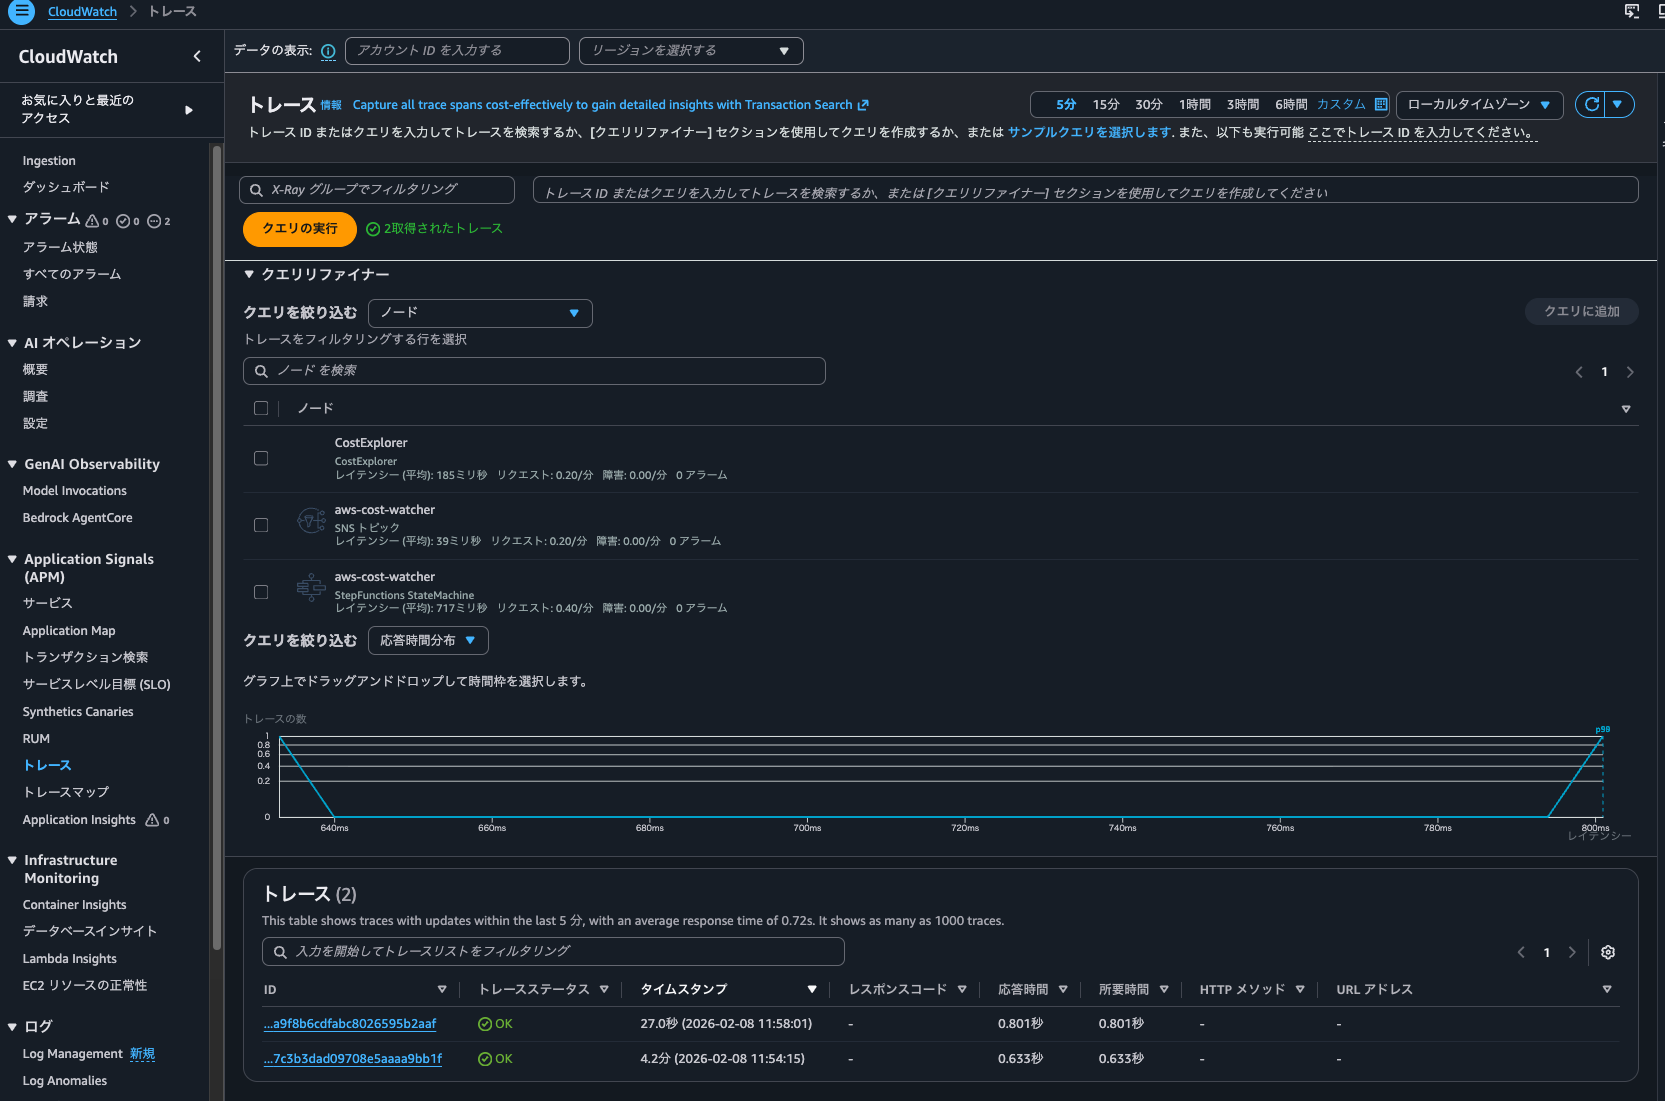
I could also check metrics from the dashboard for executions that occurred when the Trace indexing rate was 0%.
So, traces recorded by X-Ray integration can be searched even when the Trace indexing rate is 0%.
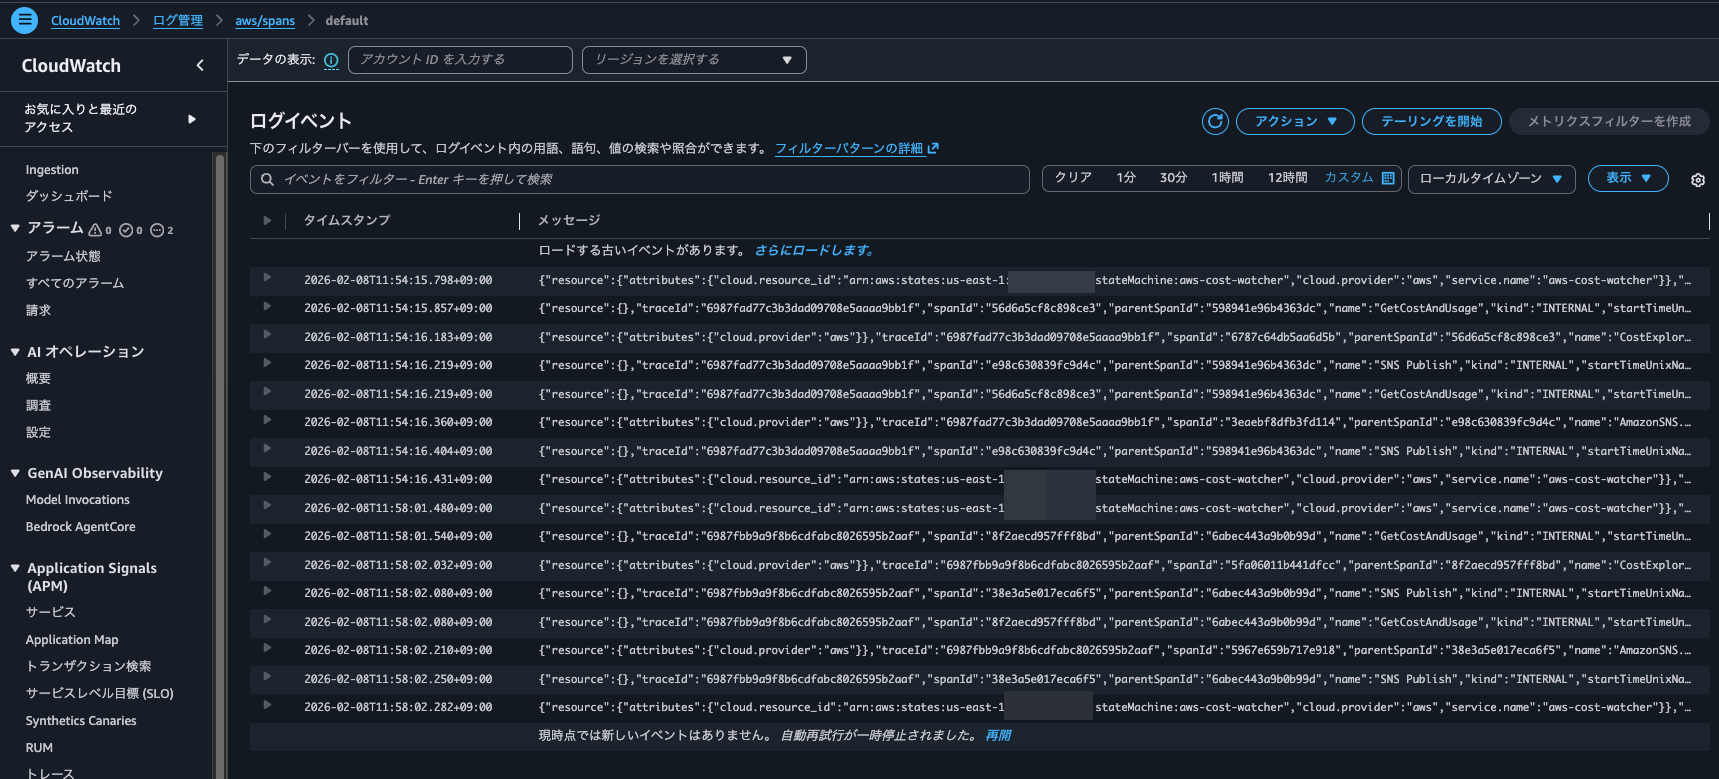
By the way, checking the aws/spans log group, I found spans recorded during both 0% and 100% Trace indexing rate executions.
Checking Logs Insights queries during Application Signals operations
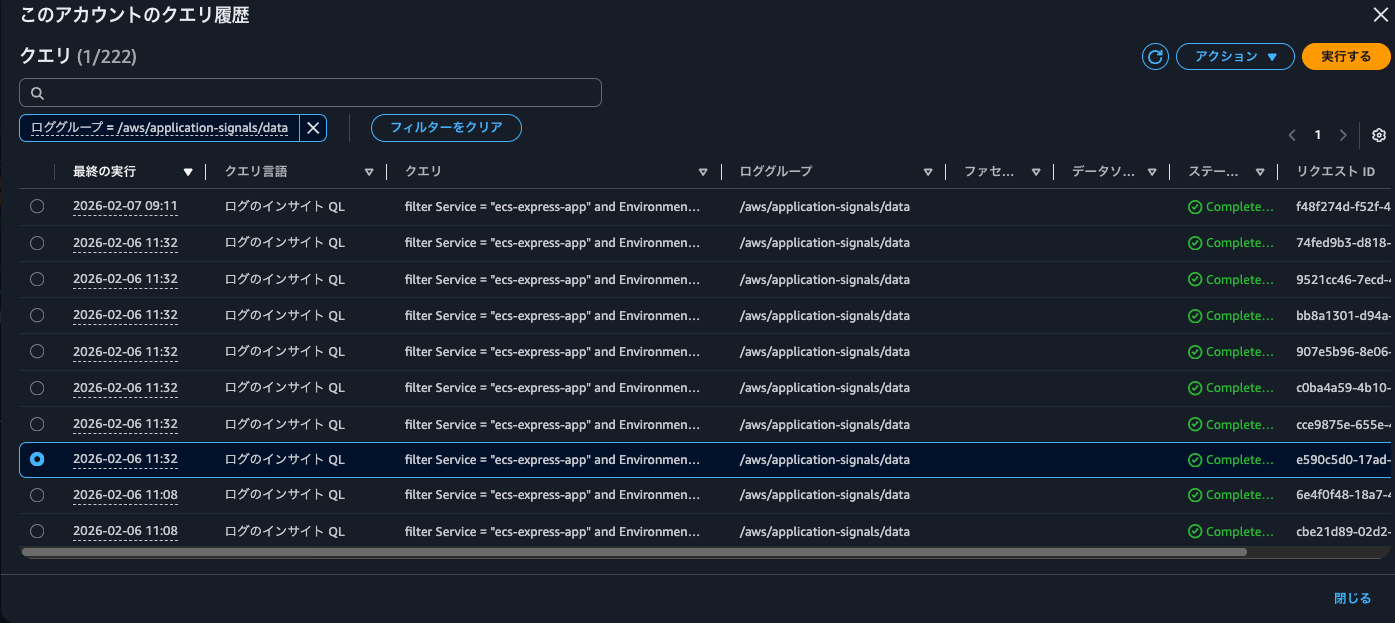
When checking the Logs Insights query execution results, at 20:32 the following query was executed 7 times on the /aws/application-signals/data log group.
filter Service = "ecs-express-app" and Environment = "ecs:EcsNativeBlueGreenStack-EcsConstructCluster14AE103B-GxDEV566XVyC" and RemoteService = "postgresql" and RemoteOperation = "SELECT" and RemoteResourceIdentifier = "appdb|ecsnativebluegreenstack-auroraconstructclustercc23-nubx1xlfqgbp.cluster-cicjym7lykmq.us-east-1.rds.amazonaws.com|5432"| fields jsonparse(@message) as js| filter ispresent(js.Exemplars.Latency)
| unnest js.Exemplars.Latency into exemplars
| fields @timestamp, exemplars.traceId as traceId, exemplars.spanId as spanId, exemplars.filteredAttributes.name as name, exemplars.filteredAttributes.status as exemplarStatusCode, exemplars.filteredAttributes.durationNano/1000000 as duration, exemplars.filteredAttributes.endTimeUnixNano/1000000 as timestamp, exemplars.filteredAttributes.cloudResourceId as resourceId, exemplars.filteredAttributes.sessionId as sessionId
| limit 10
The events recorded in CloudTrail at this time were as follows:
{
    "eventVersion": "1.11",
    "userIdentity": {
        "type": "AssumedRole",
        "principalId": "<Principal ID>",
        "arn": "arn:aws:sts::<AWS Account ID>:assumed-role/<IAM Role Name>/<Session Name>",
        "accountId": "<AWS Account ID>",
        "accessKeyId": "<Access Key>",
        "sessionContext": {
            "sessionIssuer": {
                "type": "Role",
                "principalId": "<Principal ID>",
                "arn": "arn:aws:iam::<AWS Account ID>:role/<IAM Role Name>",
                "accountId": "<AWS Account ID>",
                "userName": "<IAM User Name>"
            },
            "attributes": {
                "creationDate": "2026-02-06T08:10:35Z",
                "mfaAuthenticated": "true"
            }
        }
    },
    "eventTime": "2026-02-06T11:32:26Z",
    "eventSource": "logs.amazonaws.com",
    "eventName": "StartQuery",
    "awsRegion": "us-east-1",
    "sourceIPAddress": "<Source IP Address>",
    "userAgent": "Mozilla/5.0 (Macintosh; Intel Mac OS X 10_15_7) AppleWebKit/537.36 (KHTML, like Gecko) Chrome/144.0.0.0 Safari/537.36",
    "requestParameters": {
        "queryLanguage": "CWLI",
        "logGroupIdentifiers": [
            "/aws/application-signals/data"
        ],
        "startTime": 1770373860,
        "endTime": 1770373919,
        "queryString": "filter Service = \"ecs-express-app\" and Environment = \"ecs:EcsNativeBlueGreenStack-EcsConstructCluster14AE103B-GxDEV566XVyC\" and RemoteService = \"postgresql\" and RemoteOperation = \"SELECT\" and RemoteResourceIdentifier = \"appdb|ecsnativebluegreenstack-auroraconstructclustercc23-nubx1xlfqgbp.cluster-cicjym7lykmq.us-east-1.rds.amazonaws.com|5432\"| fields jsonparse(@message) as js| filter ispresent(js.Exemplars.Latency) \n| unnest js.Exemplars.Latency into exemplars\n| fields @timestamp, exemplars.traceId as traceId, exemplars.spanId as spanId, exemplars.filteredAttributes.name as name, exemplars.filteredAttributes.status as exemplarStatusCode, exemplars.filteredAttributes.durationNano/1000000 as duration, exemplars.filteredAttributes.endTimeUnixNano/1000000 as timestamp, exemplars.filteredAttributes.cloudResourceId as resourceId, exemplars.filteredAttributes.sessionId as sessionId\n| limit 10",
        "dryRun": false,
        "forceAnalyticsTier": false
    },
    "responseElements": null,
    "additionalEventData": {
        "queryId": "bb8a1301-d94a-46fa-9796-a8ac9aa74326"
    },
    "requestID": "6be934c1-a3cd-4847-9618-a9aa1a5cd99b",
    "eventID": "6da95dad-f312-4c1d-bddf-71fa18846c1c",
    "readOnly": true,
    "resources": [
        {
            "accountId": "<AWS Account ID>",
            "type": "AWS::Logs::LogGroup",
            "ARN": "arn:aws:logs:us-east-1:<AWS Account ID>:log-group:/aws/application-signals/data"
        }
    ],
    "eventType": "AwsApiCall",
    "apiVersion": "20140328",
    "managementEvent": true,
    "recipientAccountId": "<AWS Account ID>",
    "eventCategory": "Management",
    "tlsDetails": {
        "tlsVersion": "TLSv1.3",
        "cipherSuite": "TLS_AES_128_GCM_SHA256",
        "clientProvidedHostHeader": "logs.us-east-1.amazonaws.com"
    },
    "sessionCredentialFromConsole": "true"
}
/aws/application-signals/data contains EMF format logs used by Application Signals.
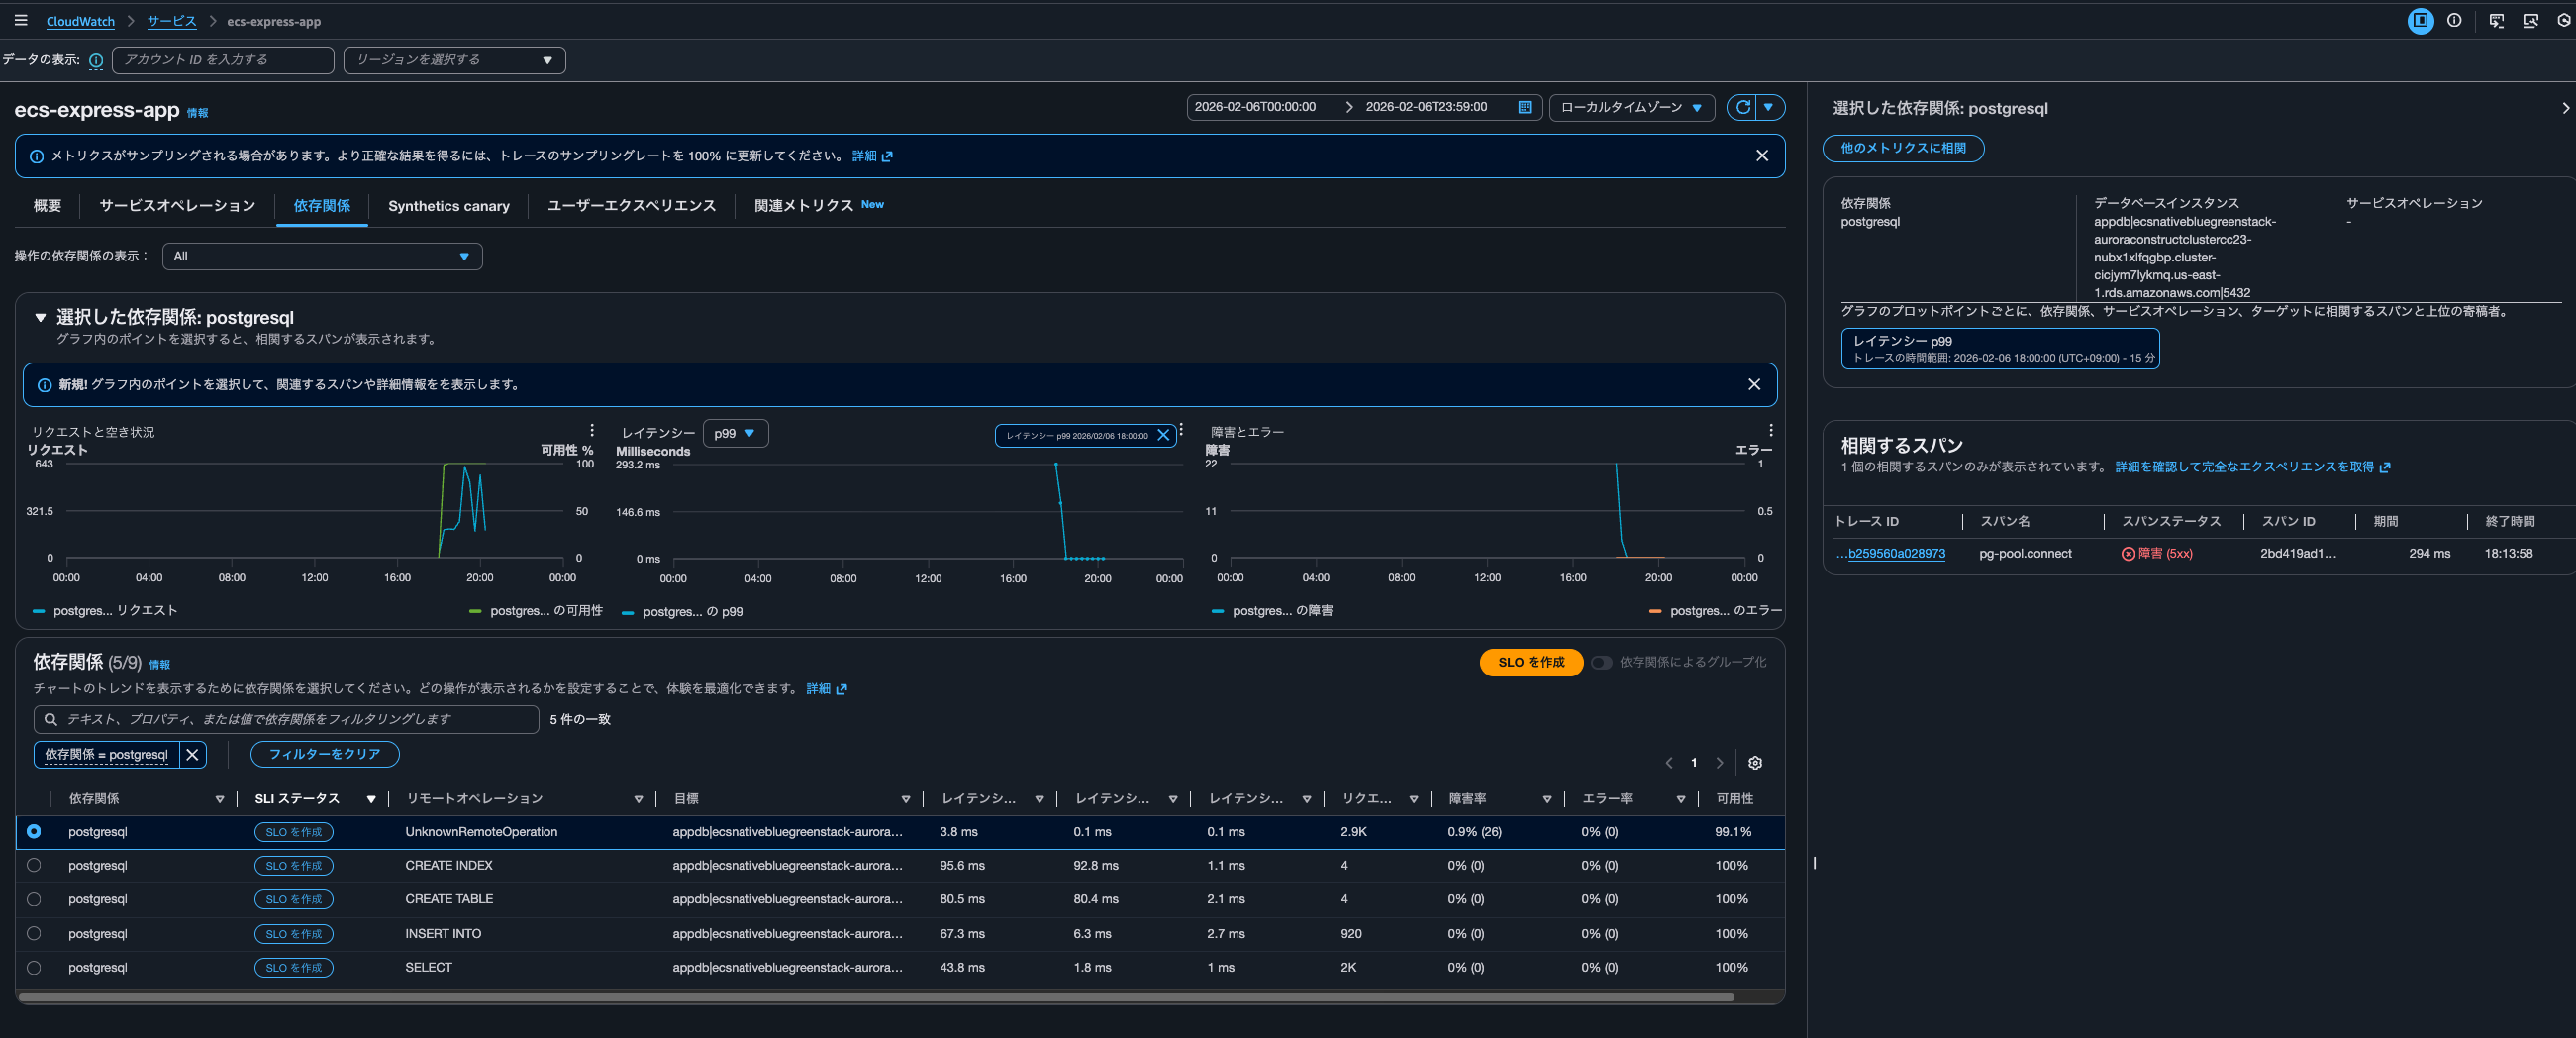
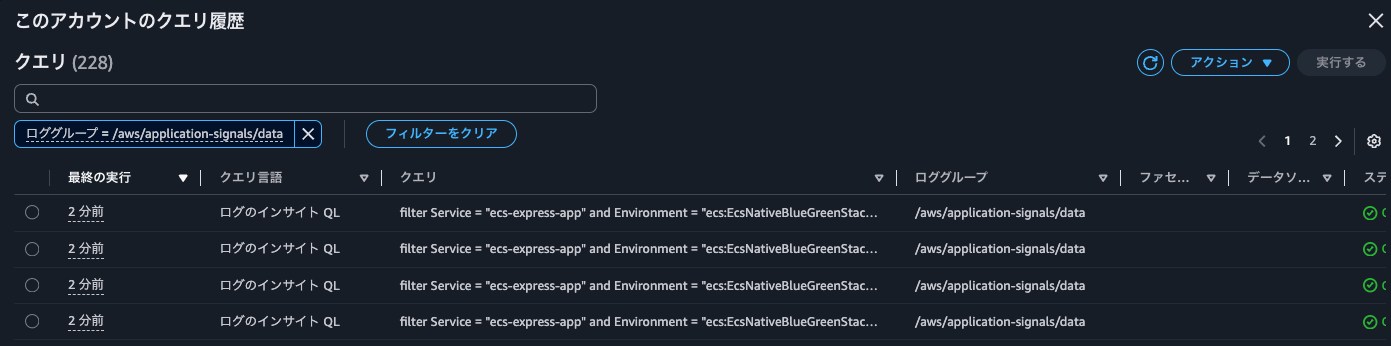
After operating Application Signals in various ways and checking when these queries are executed, I found that they were run when filtering dependencies in Application Signals or when clicking on a metrics graph.
The specific query is as follows:
filter Service = "ecs-express-app" and Environment = "ecs:EcsNativeBlueGreenStack-EcsConstructCluster14AE103B-GxDEV566XVyC" and RemoteService = "postgresql" and RemoteOperation = "UnknownRemoteOperation" and RemoteResourceIdentifier = "appdb|ecsnativebluegreenstack-auroraconstructclustercc23-nubx1xlfqgbp.cluster-cicjym7lykmq.us-east-1.rds.amazonaws.com|5432"| fields jsonparse(@message) as js| unnest js.Exemplars.Latency into exemplars
| filter exemplars.value>=293
| sort by exemplars.value asc
| fields @timestamp, exemplars.traceId as traceId, exemplars.spanId as spanId, exemplars.filteredAttributes.name as name, exemplars.filteredAttributes.status as exemplarStatusCode, exemplars.filteredAttributes.durationNano/1000000 as duration, exemplars.filteredAttributes.endTimeUnixNano/1000000 as timestamp, exemplars.filteredAttributes.cloudResourceId as resourceId, exemplars.filteredAttributes.sessionId as sessionId
| limit 10
This query retrieves up to 10 UnknownRemoteOperation calls to Aurora PostgreSQL appdb with Exemplar latency of 293ms or higher, sorted by lowest latency first.
At the time this query was executed, only postgresql was filtered as a dependency. When displaying all dependencies, the following query was executed 4 times:
filter Service = "ecs-express-app" and Environment = "ecs:EcsNativeBlueGreenStack-EcsConstructCluster14AE103B-GxDEV566XVyC" and RemoteService = "postgresql" and RemoteOperation = "INSERT INTO" and RemoteResourceIdentifier = "appdb|ecsnativebluegreenstack-auroraconstructclustercc23-nubx1xlfqgbp.cluster-cicjym7lykmq.us-east-1.rds.amazonaws.com|5432"| fields jsonparse(@message) as js| unnest js.Exemplars.Latency into exemplars
| filter exemplars.value>=76
| sort by exemplars.value asc
| fields @timestamp, exemplars.traceId as traceId, exemplars.spanId as spanId, exemplars.filteredAttributes.name as name, exemplars.filteredAttributes.status as exemplarStatusCode, exemplars.filteredAttributes.durationNano/1000000 as duration, exemplars.filteredAttributes.endTimeUnixNano/1000000 as timestamp, exemplars.filteredAttributes.cloudResourceId as resourceId, exemplars.filteredAttributes.sessionId as sessionId
| limit 10
It seems that when clicking on metric graphs in the Overview or Service Operations to display correlated spans, queries are executed against aws/spans, while when displaying correlated spans from the Dependencies tab, queries are executed against /aws/application-signals/data.
Transaction Search's Trace indexing rate does not directly affect Application Signals
I tested whether the Trace indexing rate in Transaction Search has any impact on CloudWatch Application Signals.
The conclusion is that it does not have a direct impact.
If you plan to use traces with Application Signals and Transaction Search (which is actually Logs Insights), and if a few percent of traces is sufficient for trace summaries, you should reflect that percentage in the Trace indexing rate.
Charges are incurred according to the number of indexed spans. If you're concerned about costs, you should reduce this.
Application Signals and transaction search (includes "golden metrics" and complete visibility into application transaction spans)
You are billed based on 1/ per GB of application metrics and spans ingested in CloudWatch, and 2/ per million spans indexed as X-Ray trace summaries, after the first 1% of spans indexed at no charge. This simplified bundled price is designed to capture all transactions records in a cost efficient manner. You also gain complete visibility into application transaction spans, automatic discovery and grouping of all your instrumented and un-instrumented services, automatic operational audits for application performance issues, and recent changes to your application.
See example 13 below to understand your potential charges.
Region: Asia Pacific (Tokyo)
Item Price First 10 TB of data ingested per month $0.35 per GB Next 20 TB of data ingested per month $0.20 per GB Over 30 TB of data ingested per month $0.15 per GB Spans indexed as X-Ray traces summaries $0.75 per million spans indexed after the first 1% of spans indexed at no charge
A pricing example is also provided. While unrelated to indexing, it's good to know that spans ingested as logs do not incur CloudWatch Logs ingestion charges.
Example 13 - Application observability: Application Signals and Transaction Search (includes "golden metrics" and complete visibility into application transaction spans)
This example assumes that you are not using the first time free trial (learn more about free trail in AWS Free Tier above).
If you monitor an application that generates 72 TB of spans per month, and index 2% of spans ingested.
.
.
(omitted)
.
.
Monthly Indexed chargesAssuming 1 span = ~1kB, 72 TB translates to 72B spans per month. Since you are indexing only 2%, this translates to 1.44B spans. Since 1% of spans indexed are included in the monthly ingested charges, you only pay for 1% of 720M spans per month, instead of full 2% of 1.44B spans.
720M @$0.75 per million spans indexed = 720M * $0.75 = $540 per month
.
.
(omitted)
.
.
Monthly Indexed spans chargesNo charges for indexed spans since 1% of spans indexed are included in the pricing model.
Note: Spans ingested as logs will not incur log ingestion pricing
Incidentally, when I checked Application Signals-related charges from the Classmethod Members Portal, they were as follows:
| Type | Description | Quantity | Cost |
|---|---|---|---|
| USE1-Application-Signals-Bytes | $0.35 per GB of Application Signals data ingested for the first 10TB - US East (N. Virginia) | 0.21 | $0.0 |
| USE1-XRay-Spans-Indexed | $0.00000075 per spans indexed for USE1-XRay-Spans-Indexed in US East (N. Virginia) | 41,114.00 | $0.03 |
I hope this article has been helpful to someone.
This was nonpi (@non____97) from the Cloud Business Division Consulting Department!