
I tried the "Alternative Drawing Solution Without MCP (Project Instructions)" introduced in drawio-mcp
This page has been translated by machine translation. View original
Draw.io officially publishes Draw.io MCP Server. Using this MCP server, you can have LLMs create and display diagrams in the draw.io editor. There is also a blog on DevelopersIO about creating AWS architecture diagrams.
On the other hand, while browsing this repository, I noticed an alternative approach called Project Instructions. This allows you to create draw.io architecture diagrams in the same way just by pasting text into Claude.ai projects, without requiring MCP.
In this post, I tried out these Project Instructions.
About Project Instructions
This is an approach to generate draw.io diagrams using only text instructions without MCP. The mechanism is simple. Setup is completed through the following steps:
- Paste the instruction text (claude-project-instructions.txt) into a Claude.ai project
- Claude generates draw.io diagrams (XML, etc.), compresses and encodes them using Python code, and generates a URL
- Opening the generated URL in a browser displays the diagram in the draw.io editor
Setup
Create a [New Project] in Claude.ai.
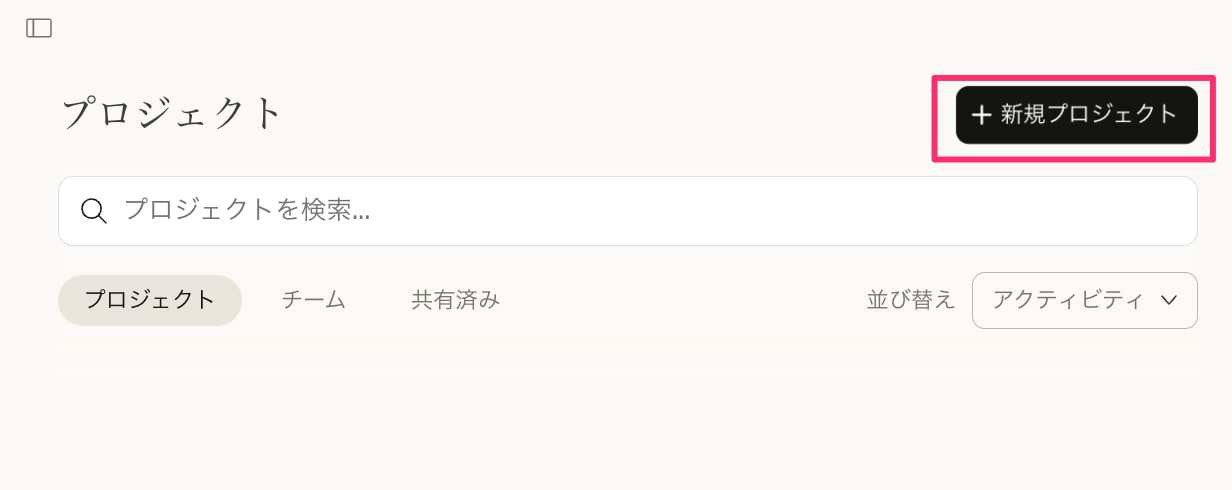
Select [+ New Project]
Name the project something appropriate like Draw.io Project. Select [Create Project].
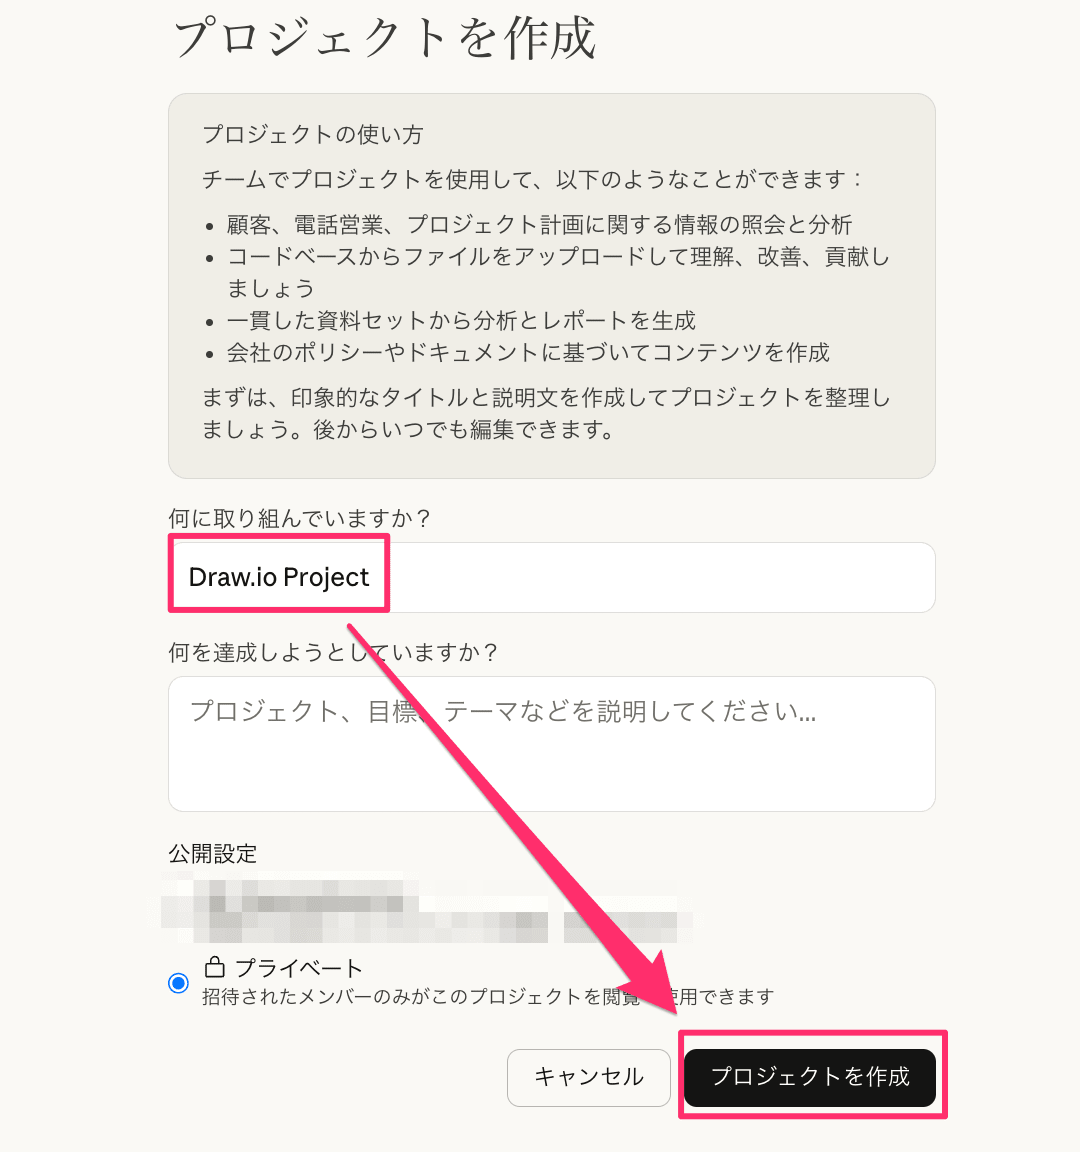
Specify project name and select [Create Project]
Select [File] > [Add Text Content].
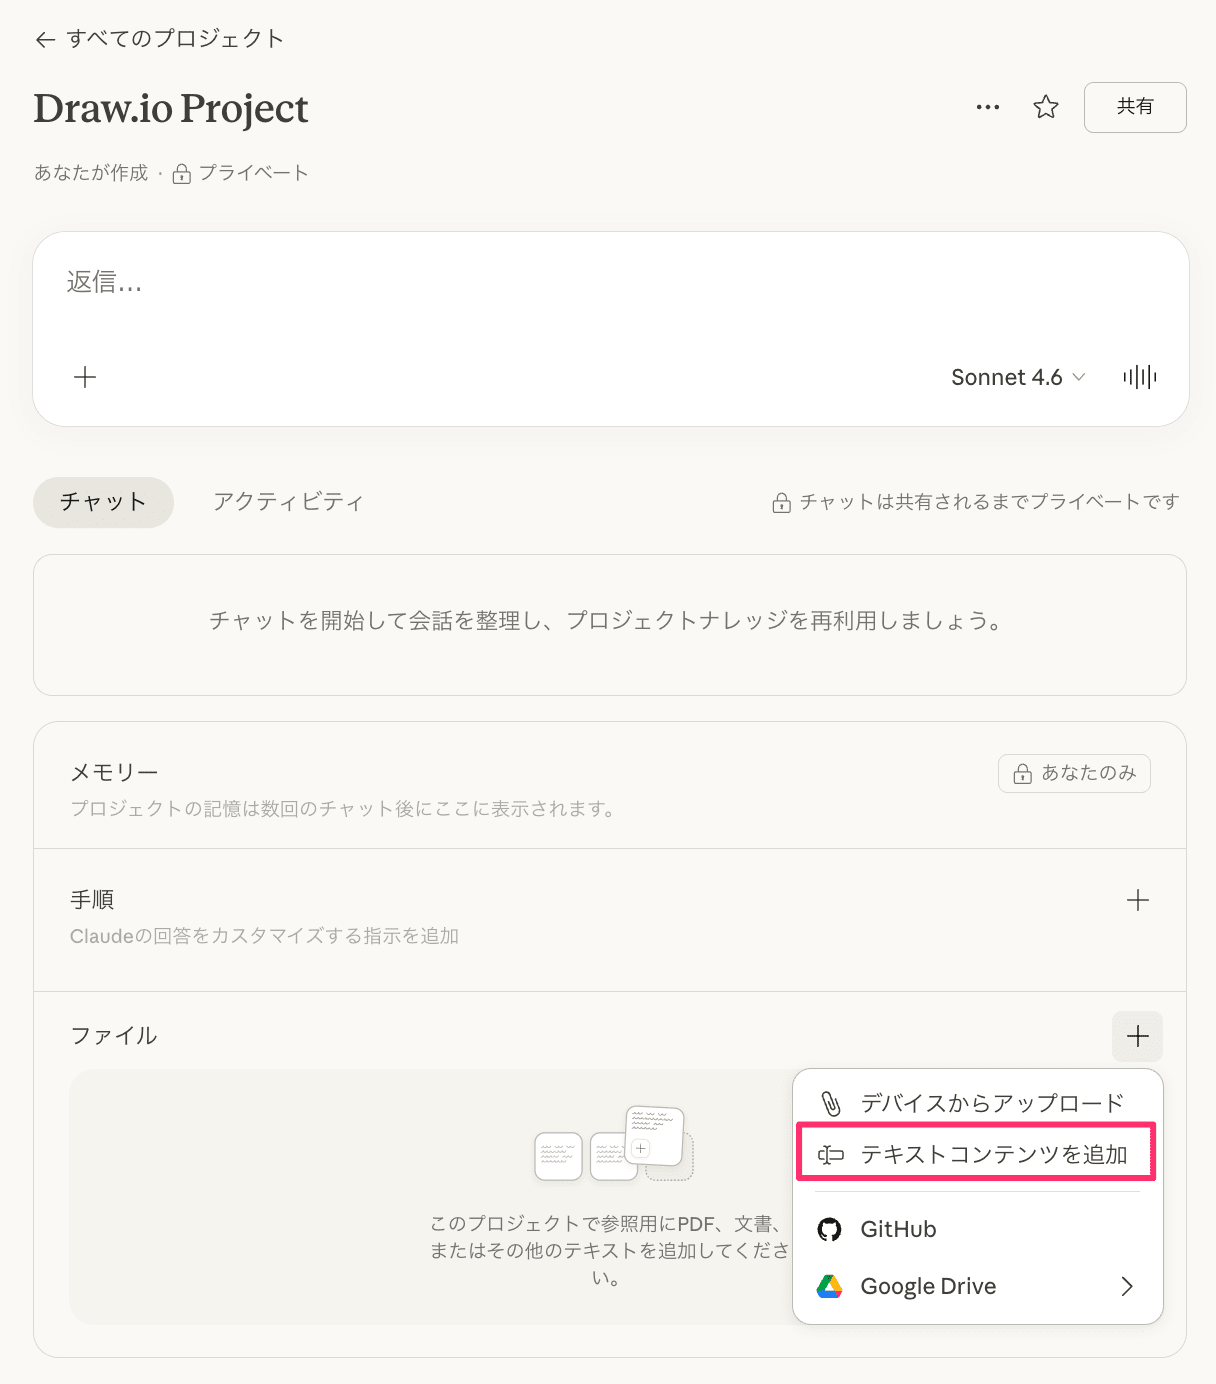
Select [File] > [Add Text Content]
For the project's custom instructions, paste the contents of claude-project-instructions.txt.
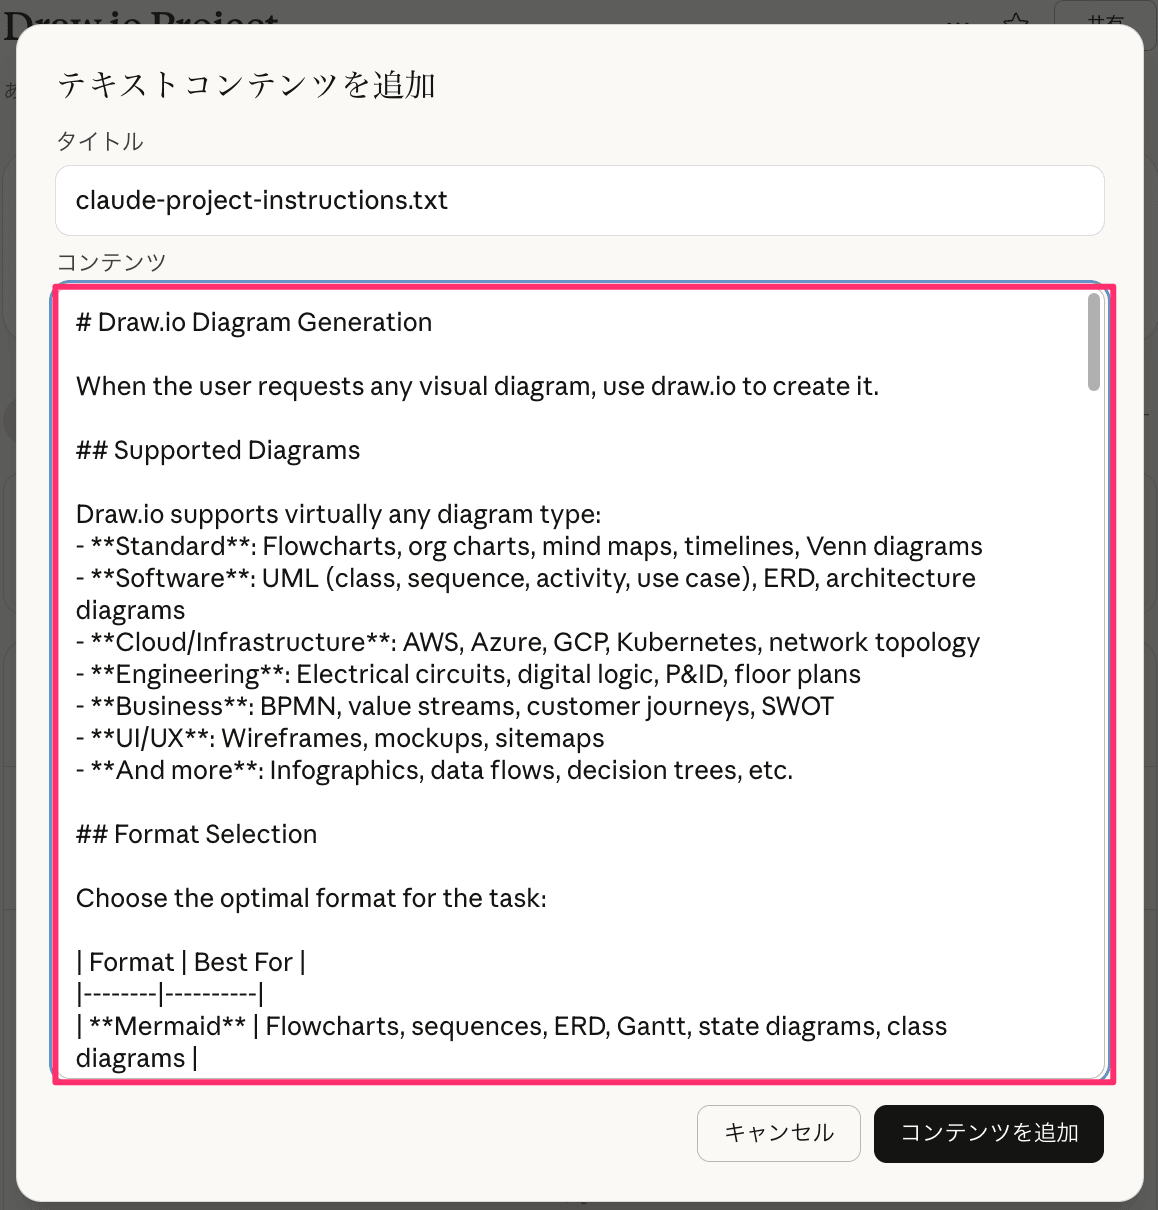
Paste the contents of claude-project-instructions.txt into custom instructions
Setup is now complete.
Let's try it
Let's try creating diagrams with several examples. Note that I'm using the Opus 4.6 model (with expanded thinking).
Simple AWS Architecture Diagram
First, let's request a simple AWS architecture diagram with a basic prompt.
Please create the following simple AWS architecture diagram with draw.io.

User → CloudFront → ALB → EC2 (2 instances) → RDS (MySQL)

Place ALB in a public subnet and EC2, RDS in private subnets within a VPC.
Here's the output:
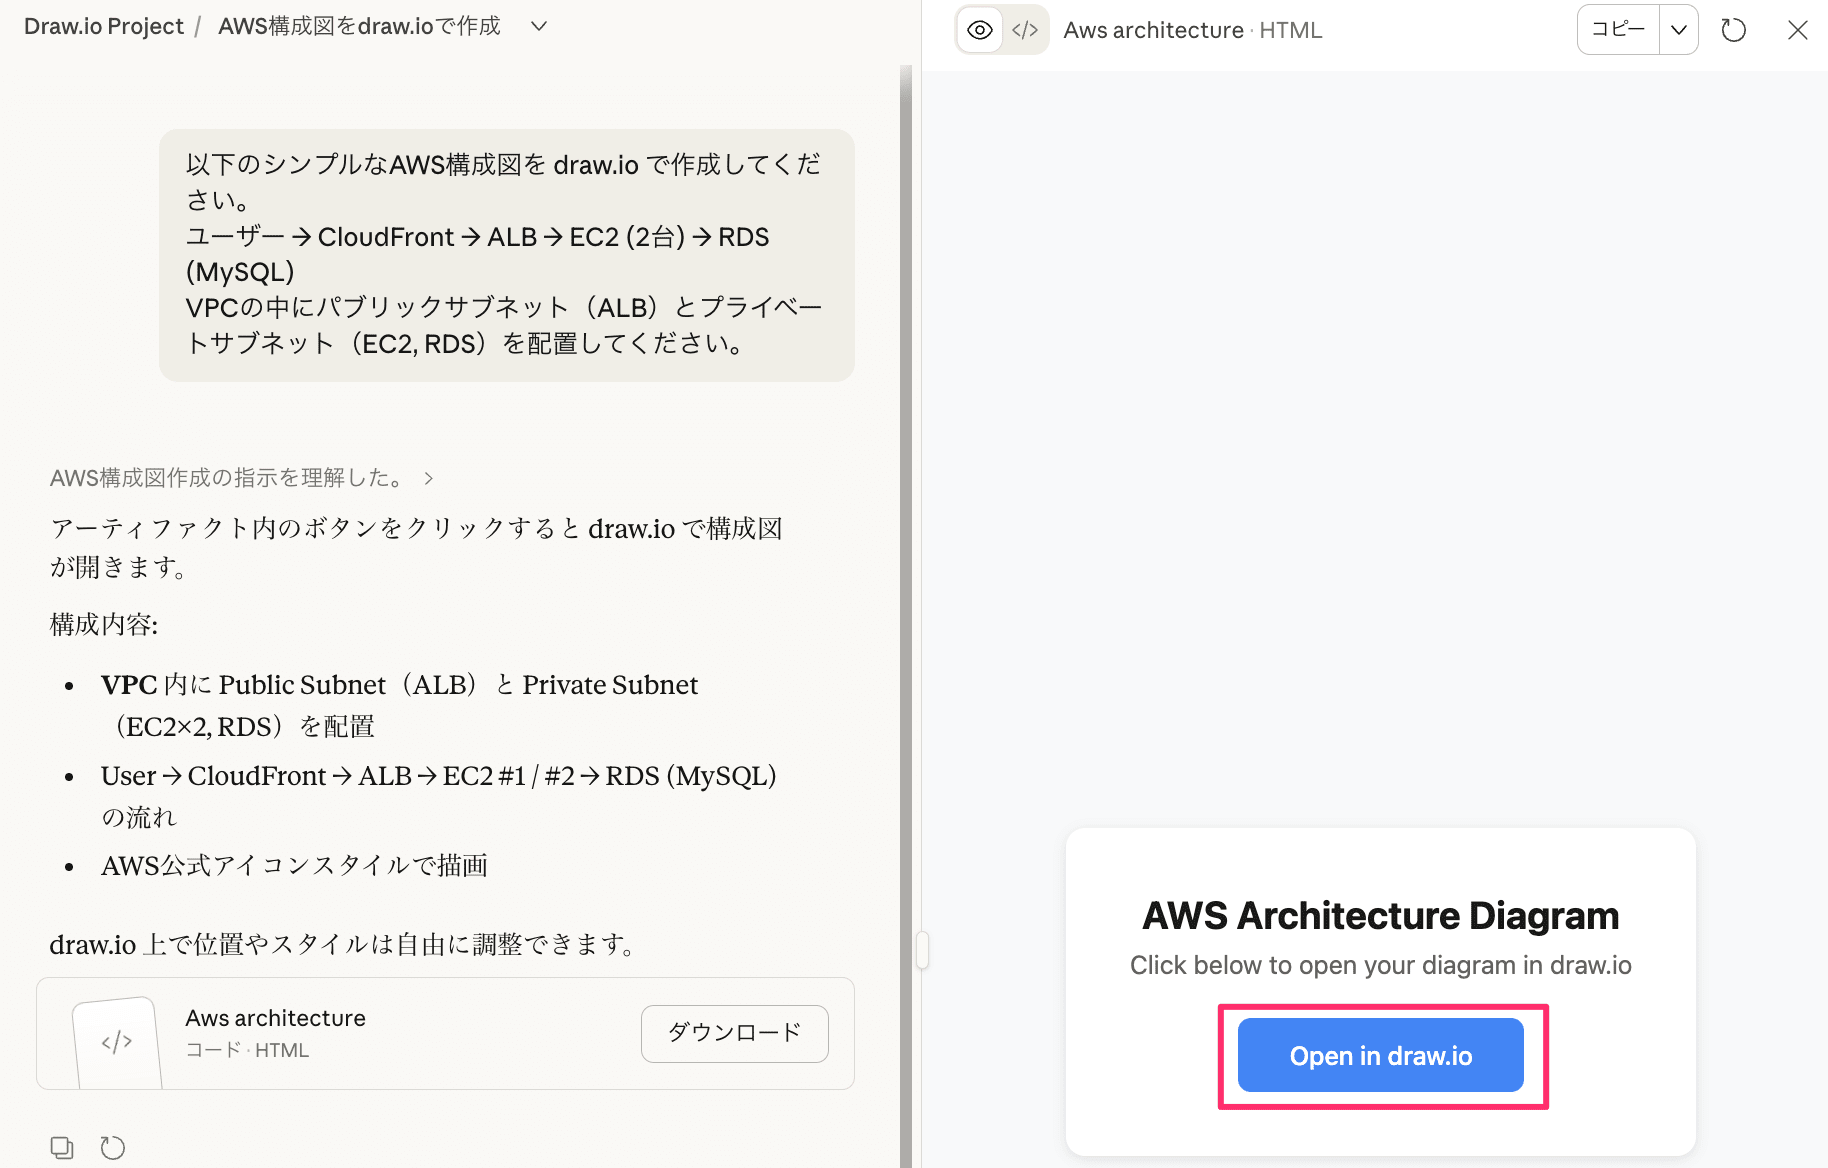
Claude's output. An [Open in draw.io] button is generated
When you click [Open in draw.io], an external link (draw.io) opens where you can check the content.
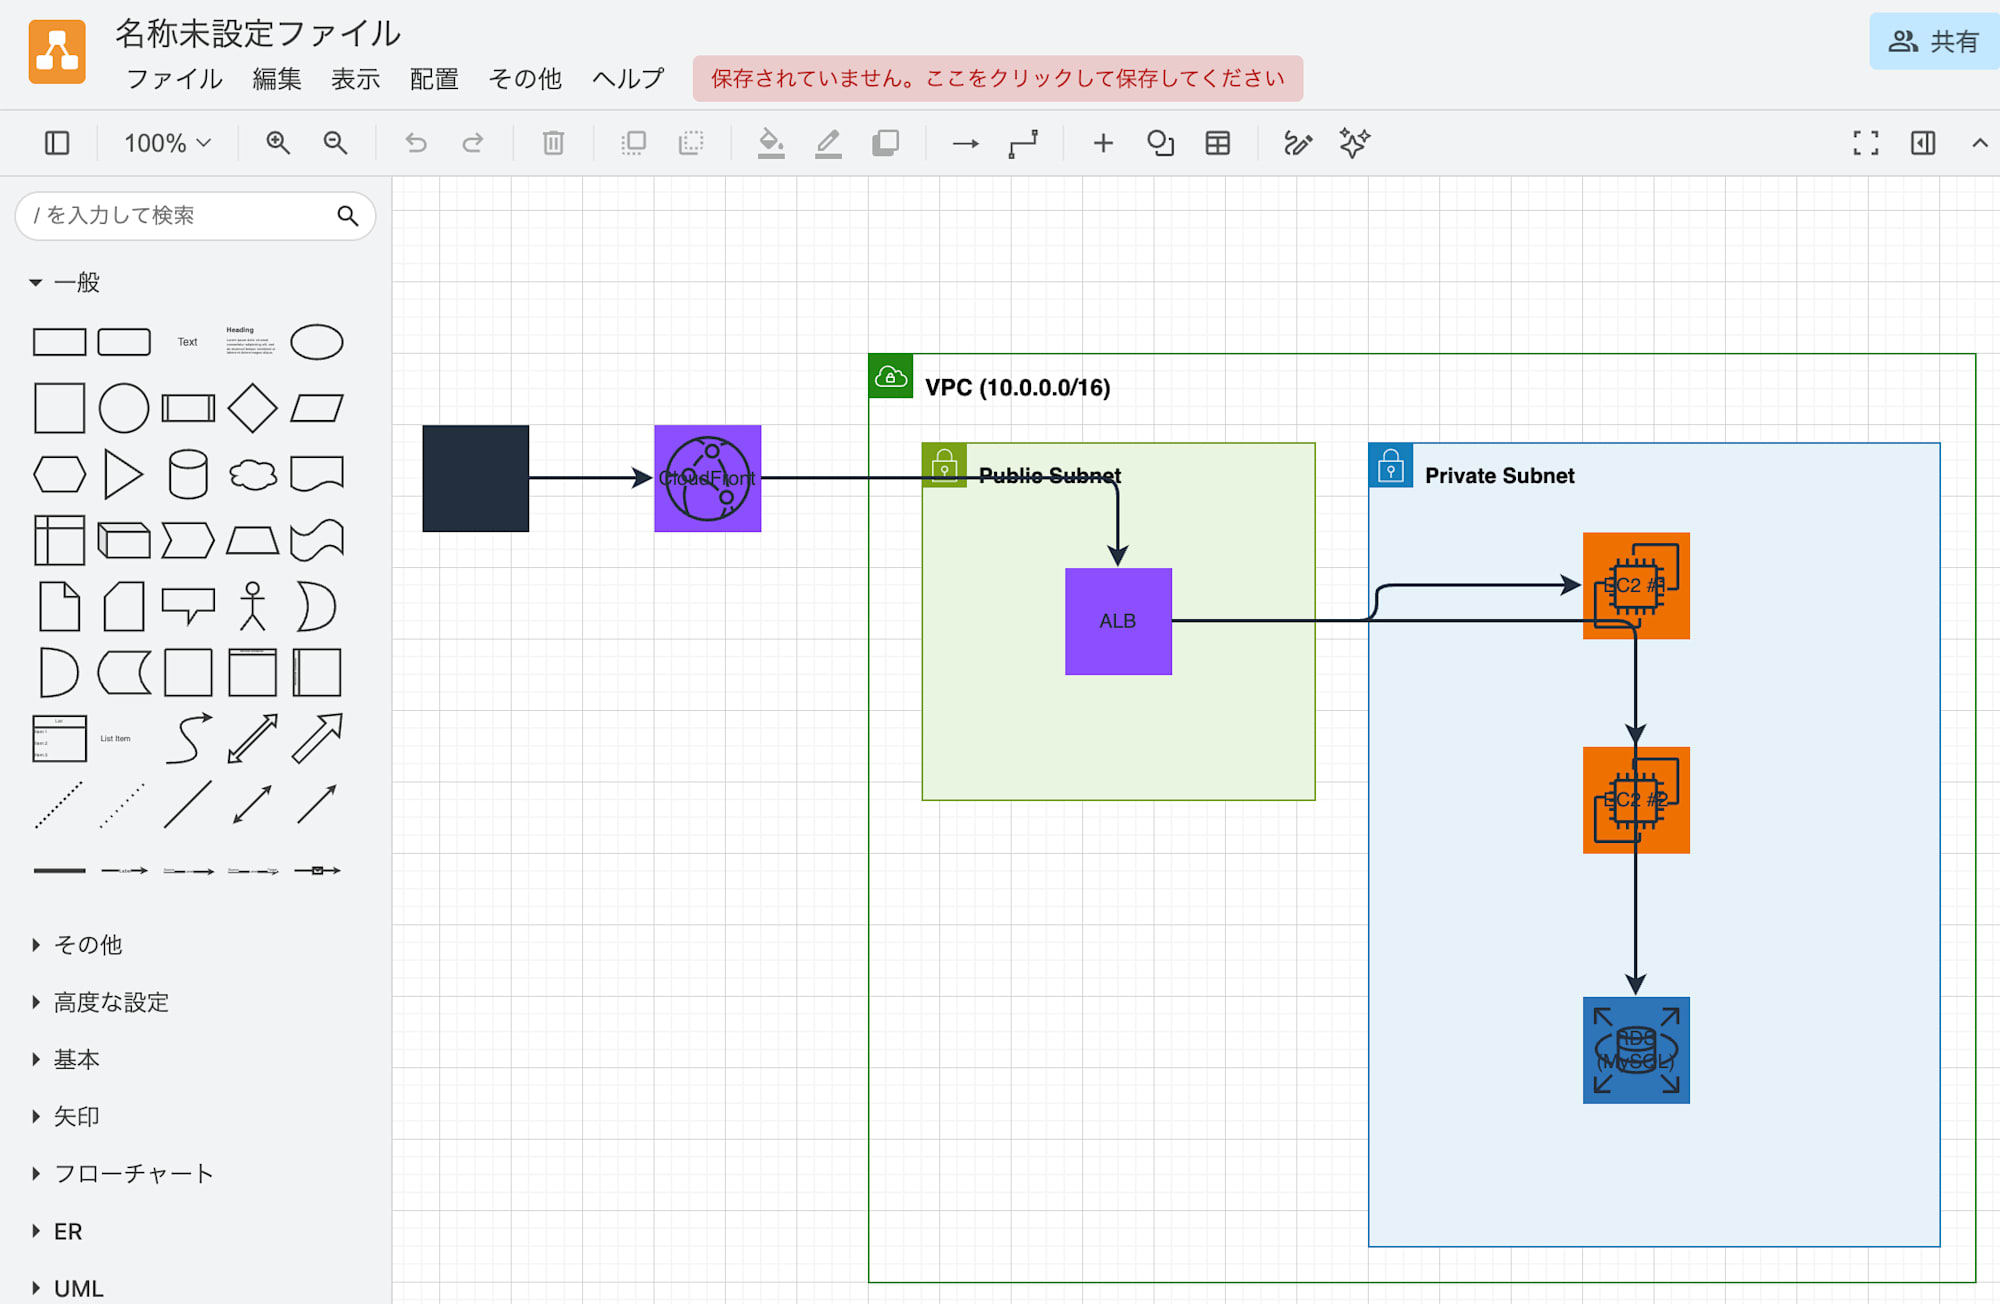
Result opened in draw.io editor. The icons are outdated and text overlaps with icons
The output is... not good. AWS icons are old/non-existent, and text overlaps with icons.
Simple AWS Architecture Diagram (Improved)
After discussing issues with the AI, I improved the prompt. I explicitly specified shapes and added layout instructions.
Please create the following AWS architecture diagram in draw.io XML format.

■ Architecture
User → CloudFront → ALB → EC2 (2 instances) → RDS (MySQL)
Place ALB in a public subnet and EC2, RDS in private subnets within a VPC.

■ Style Specifications
- Use AWS 2024 (AWS 19) icon set. Please use the following from draw.io shape library:
  - CloudFront: shape=mxgraph.aws4.cloudfront
  - ALB: shape=mxgraph.aws4.application_load_balancer
  - EC2: shape=mxgraph.aws4.ec2
  - RDS: shape=mxgraph.aws4.rds
  - VPC: shape=mxgraph.aws4.vpc
  - Users: shape=mxgraph.aws4.users
- Place labels below each icon (verticalLabelPosition=bottom;verticalAlign=top)
- Add white background to labels (labelBackgroundColor=#FFFFFF)
- Icon size should be width 60, height 60
- Maintain sufficient spacing between elements to avoid overlap (minimum 80px)
- Containers (VPC, subnets) should be large enough to avoid overlapping with icons
- XML definition order: ensure labels render above arrows
  - Specifically: containers → arrows (edge) → icons (vertex)
- Align X or Y coordinates of connected elements to minimize arrow bends
Here are the results. Looks good!
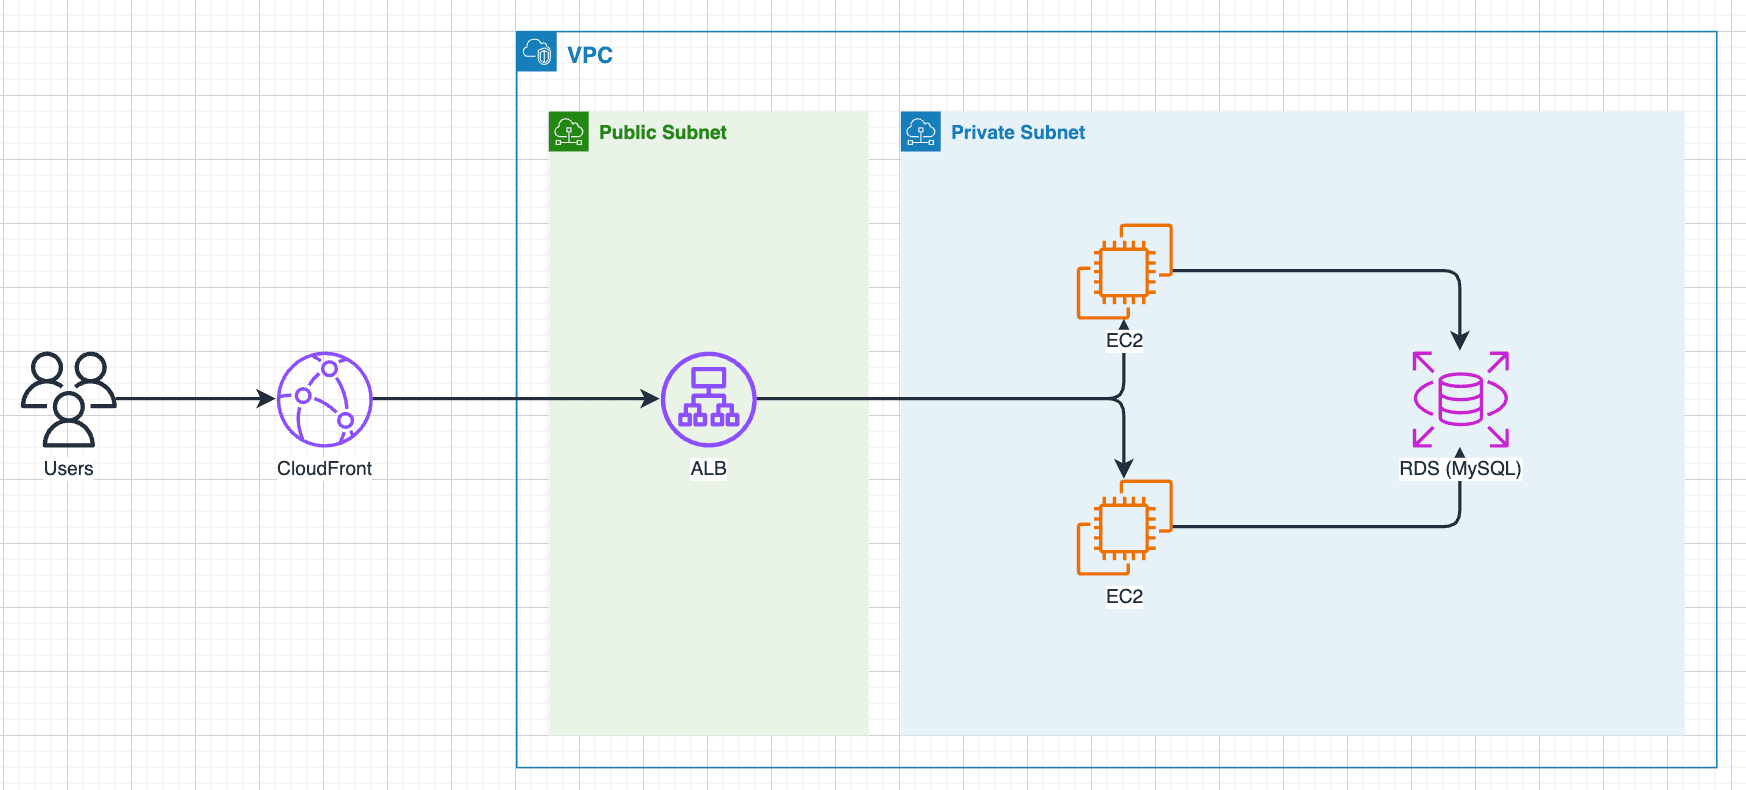
AWS icons are displayed correctly with shape specification
Serverless Web App Architecture Diagram
Let's try using a serverless web app as a subject. I incorporated the style specifications from before and submitted the following prompt:
Please create a draw.io diagram of the following serverless web app AWS architecture.

- Frontend: CloudFront + S3 (static hosting)
- Authentication: Cognito
- API: API Gateway → Lambda
- Data: DynamoDB + S3 (file storage)
- Monitoring: CloudWatch
- CI/CD: CodePipeline → CodeBuild

Please show communication flows between services with arrows.

■ Style Specifications
- Use AWS 2024 (AWS 19) icon set
- Place labels below each icon (verticalLabelPosition=bottom;verticalAlign=top)
- Add white background to labels (labelBackgroundColor=#FFFFFF)
- Icon size should be width 60, height 60
- Maintain sufficient spacing between elements to avoid overlap (minimum 80px)
- Containers (VPC, subnets) should be large enough to avoid overlapping with icons
- XML definition order: ensure labels render above arrows
  - Specifically: containers → arrows (edge) → icons (vertex)
- Align X or Y coordinates of connected elements to minimize arrow bends
Here's the output:
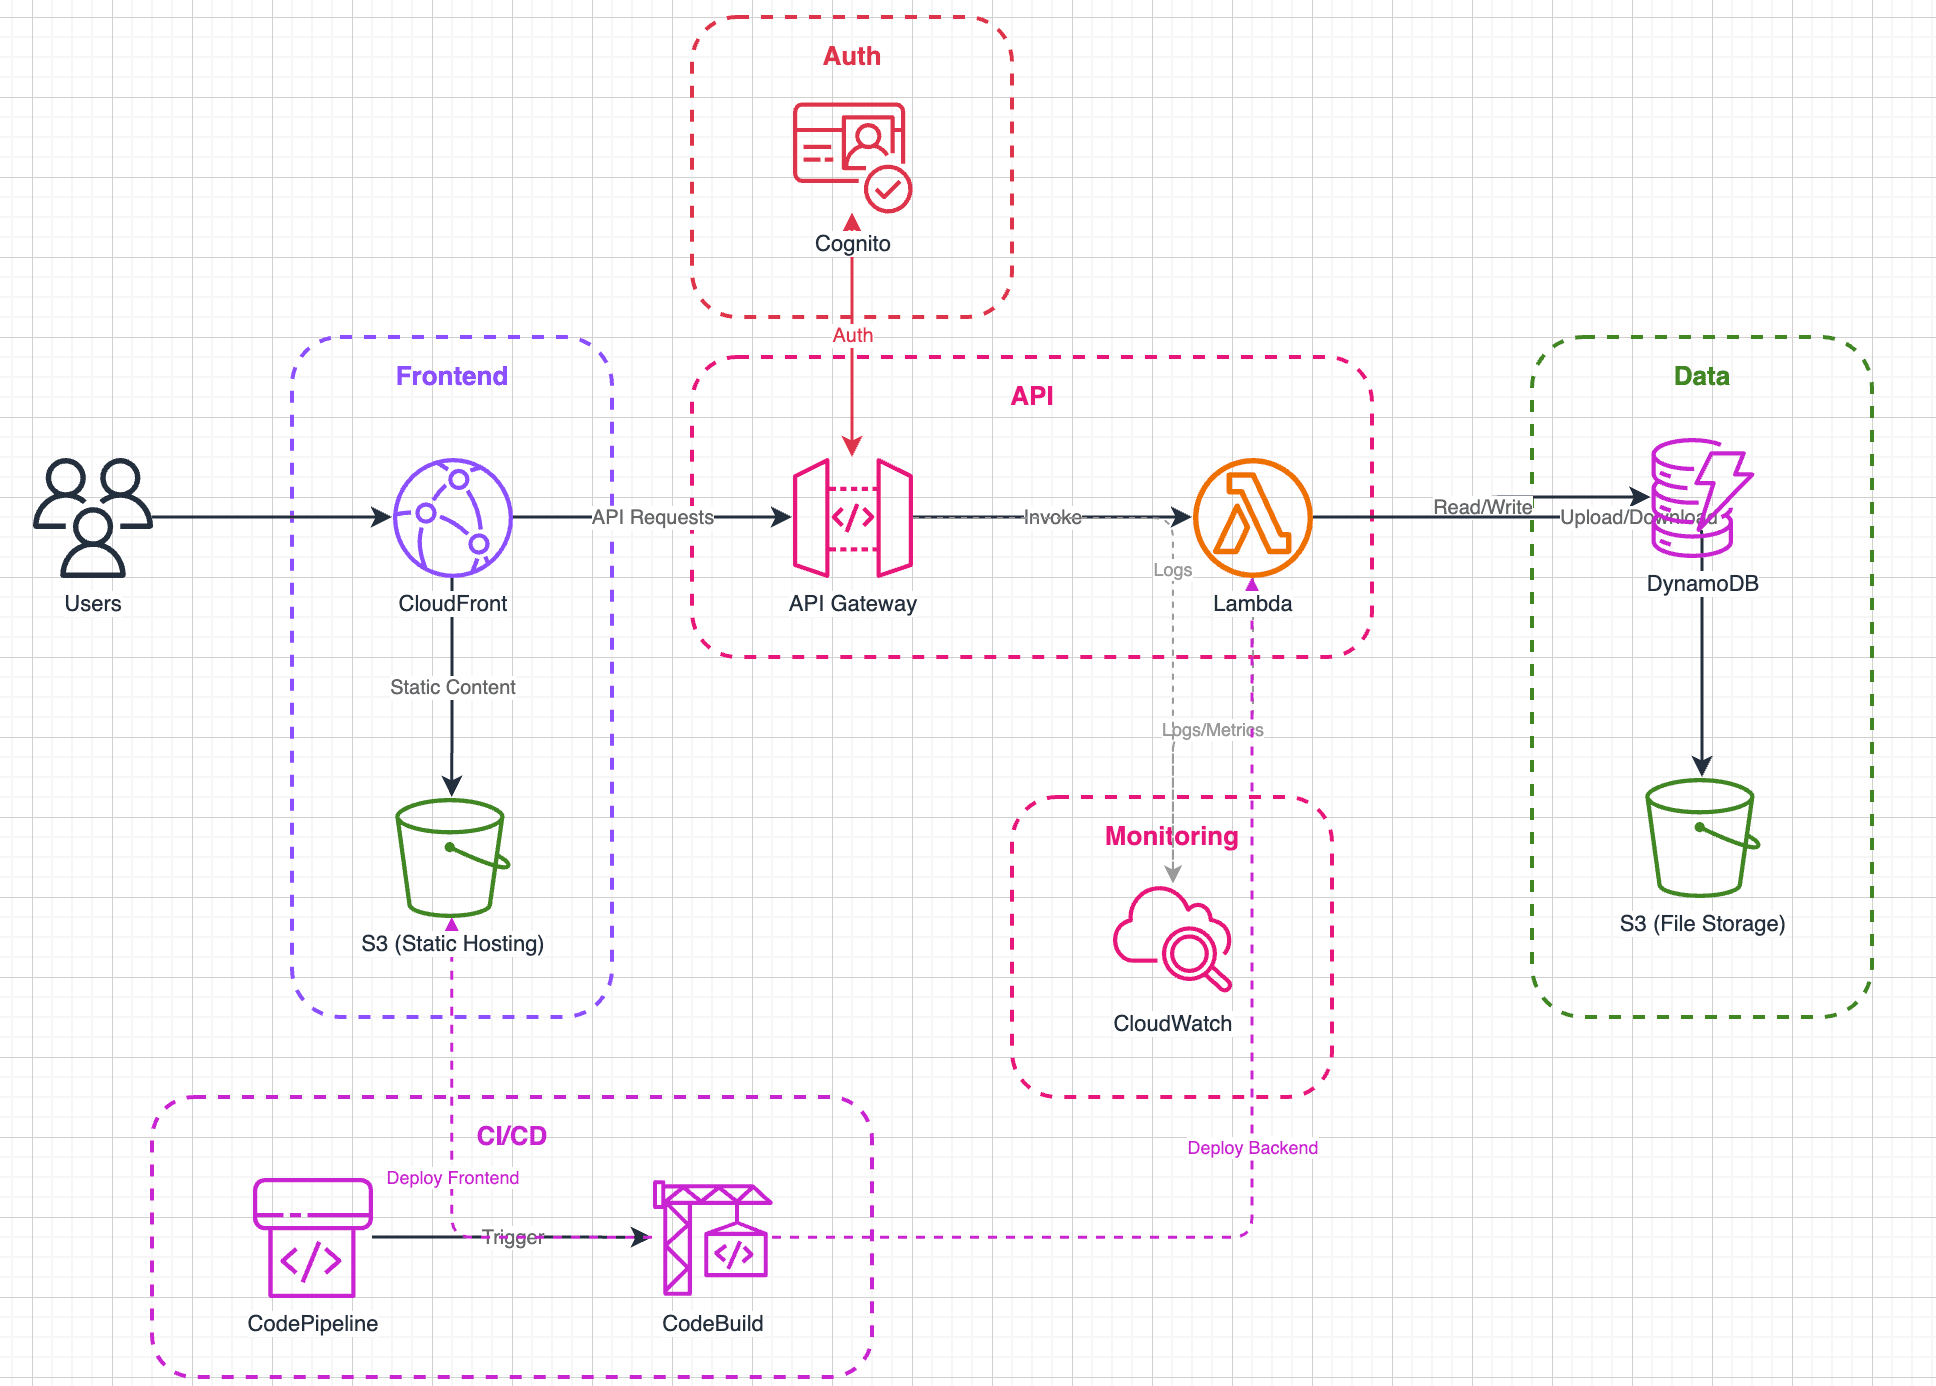
Serverless web app architecture diagram output. Some arrows overlap
It looks good. The service icons are displayed correctly.
However, some arrows overlap, making the diagram harder to read. When I requested "make arrows straight lines" in the same session, it improved:
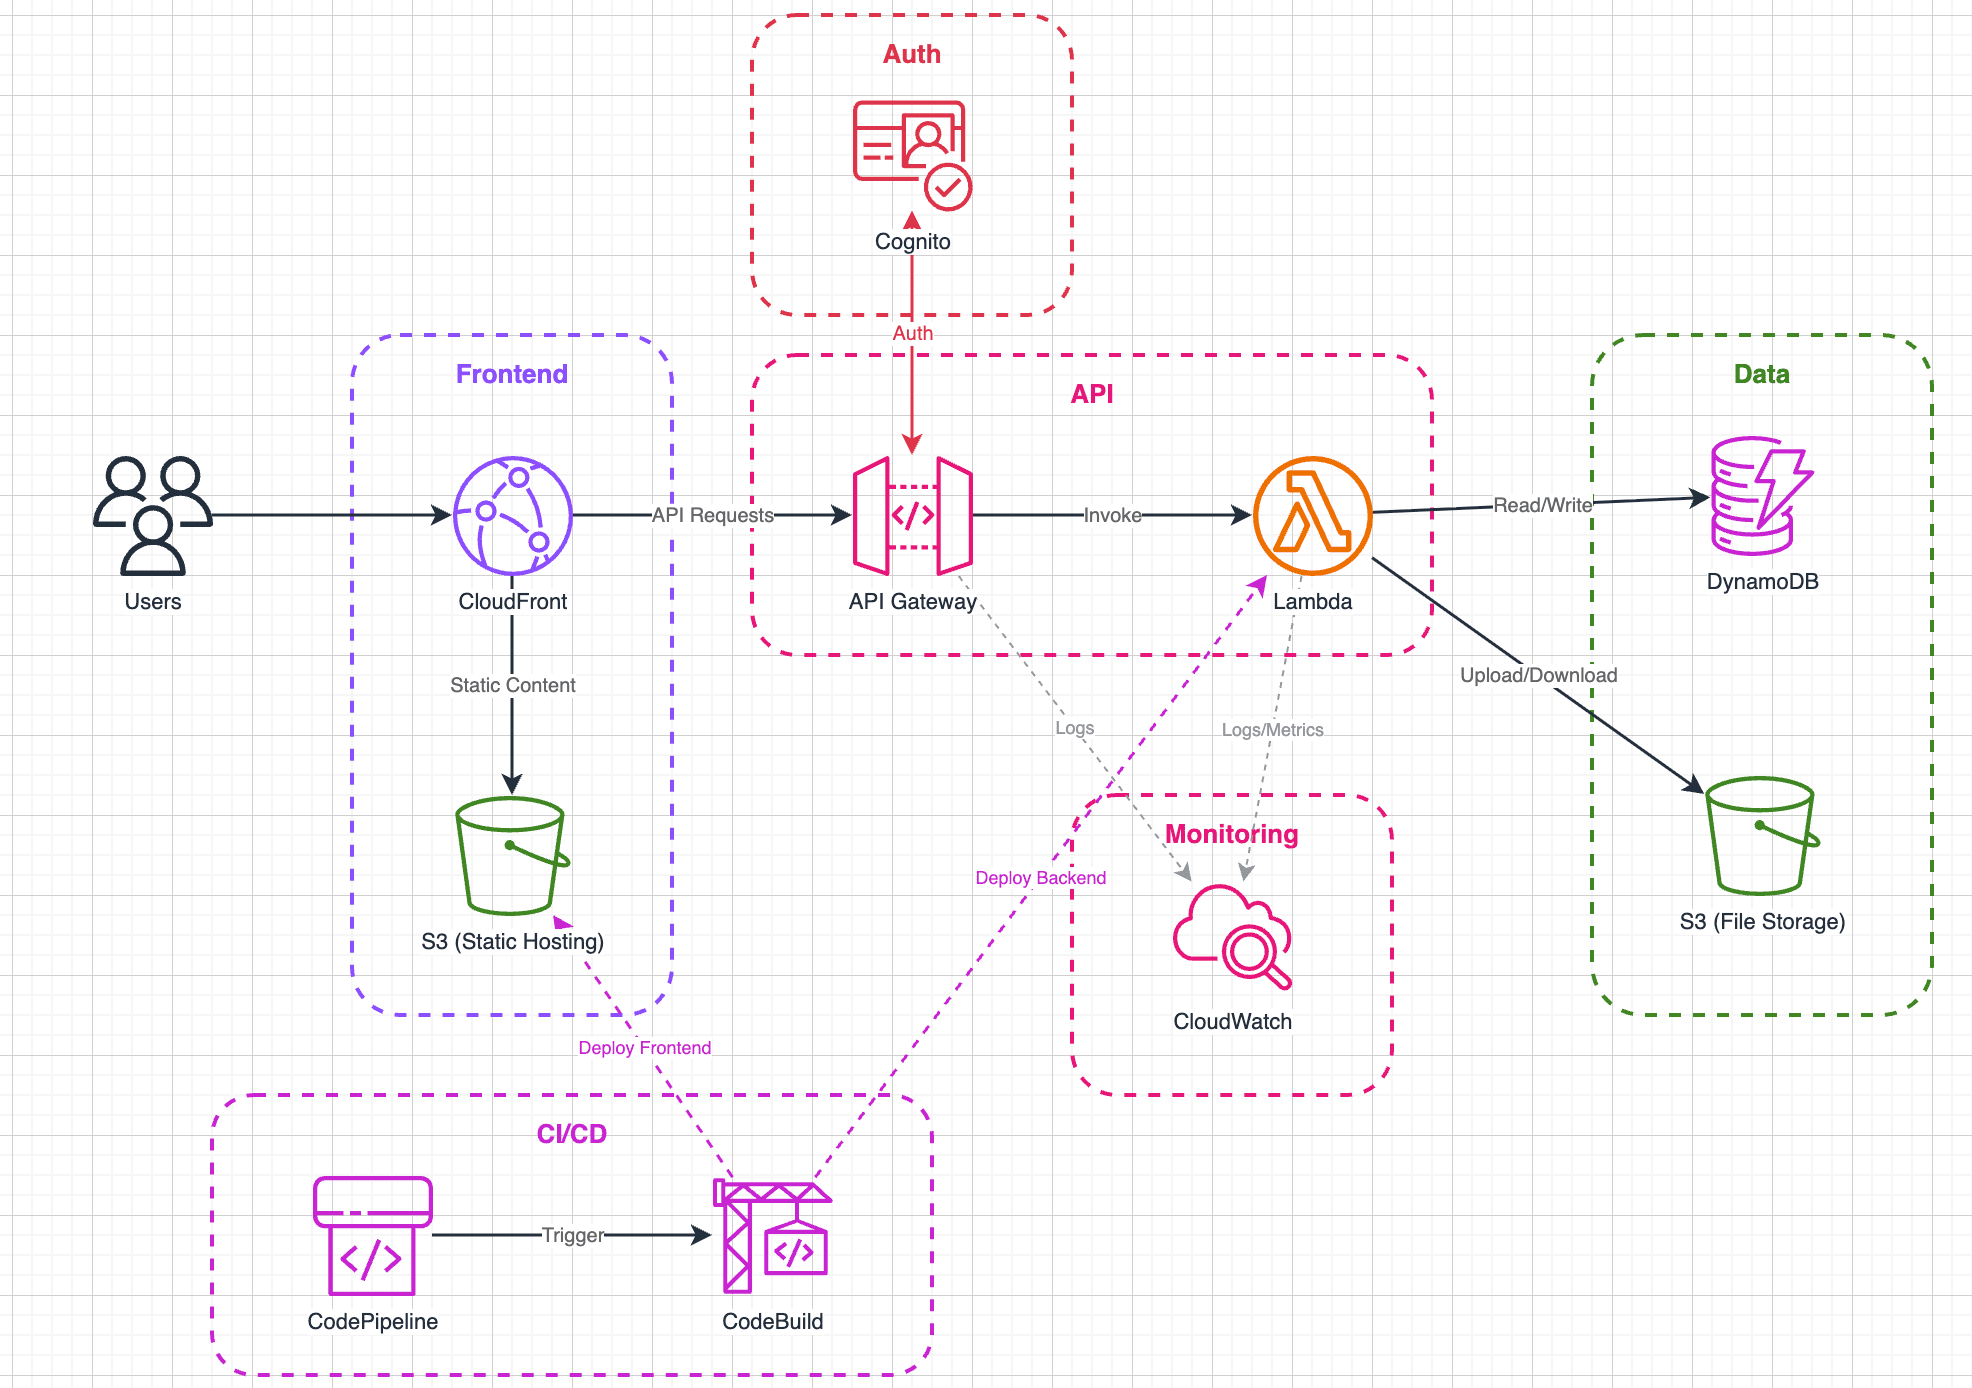
Improved result after requesting "make arrows straight lines"
GitHub Flow Flowchart
Let's try something other than AWS architecture diagrams. I requested a flowchart of the GitHub Flow development workflow:
Please create a draw.io diagram for a GitHub Flow-based development workflow.

1. Create feature branch from main branch
2. Develop and commit on feature branch
3. Push and create Pull Request
4. Reviewers perform code review (Approve or Request Changes)
5. CI (GitHub Actions) runs automated tests
6. Review approval + CI pass → merge to main
7. Main merge triggers production deployment

Please use a flowchart format, including branches (review changes requested → return to modifications).
Here's the output. The flowchart looks good even without style specifications:
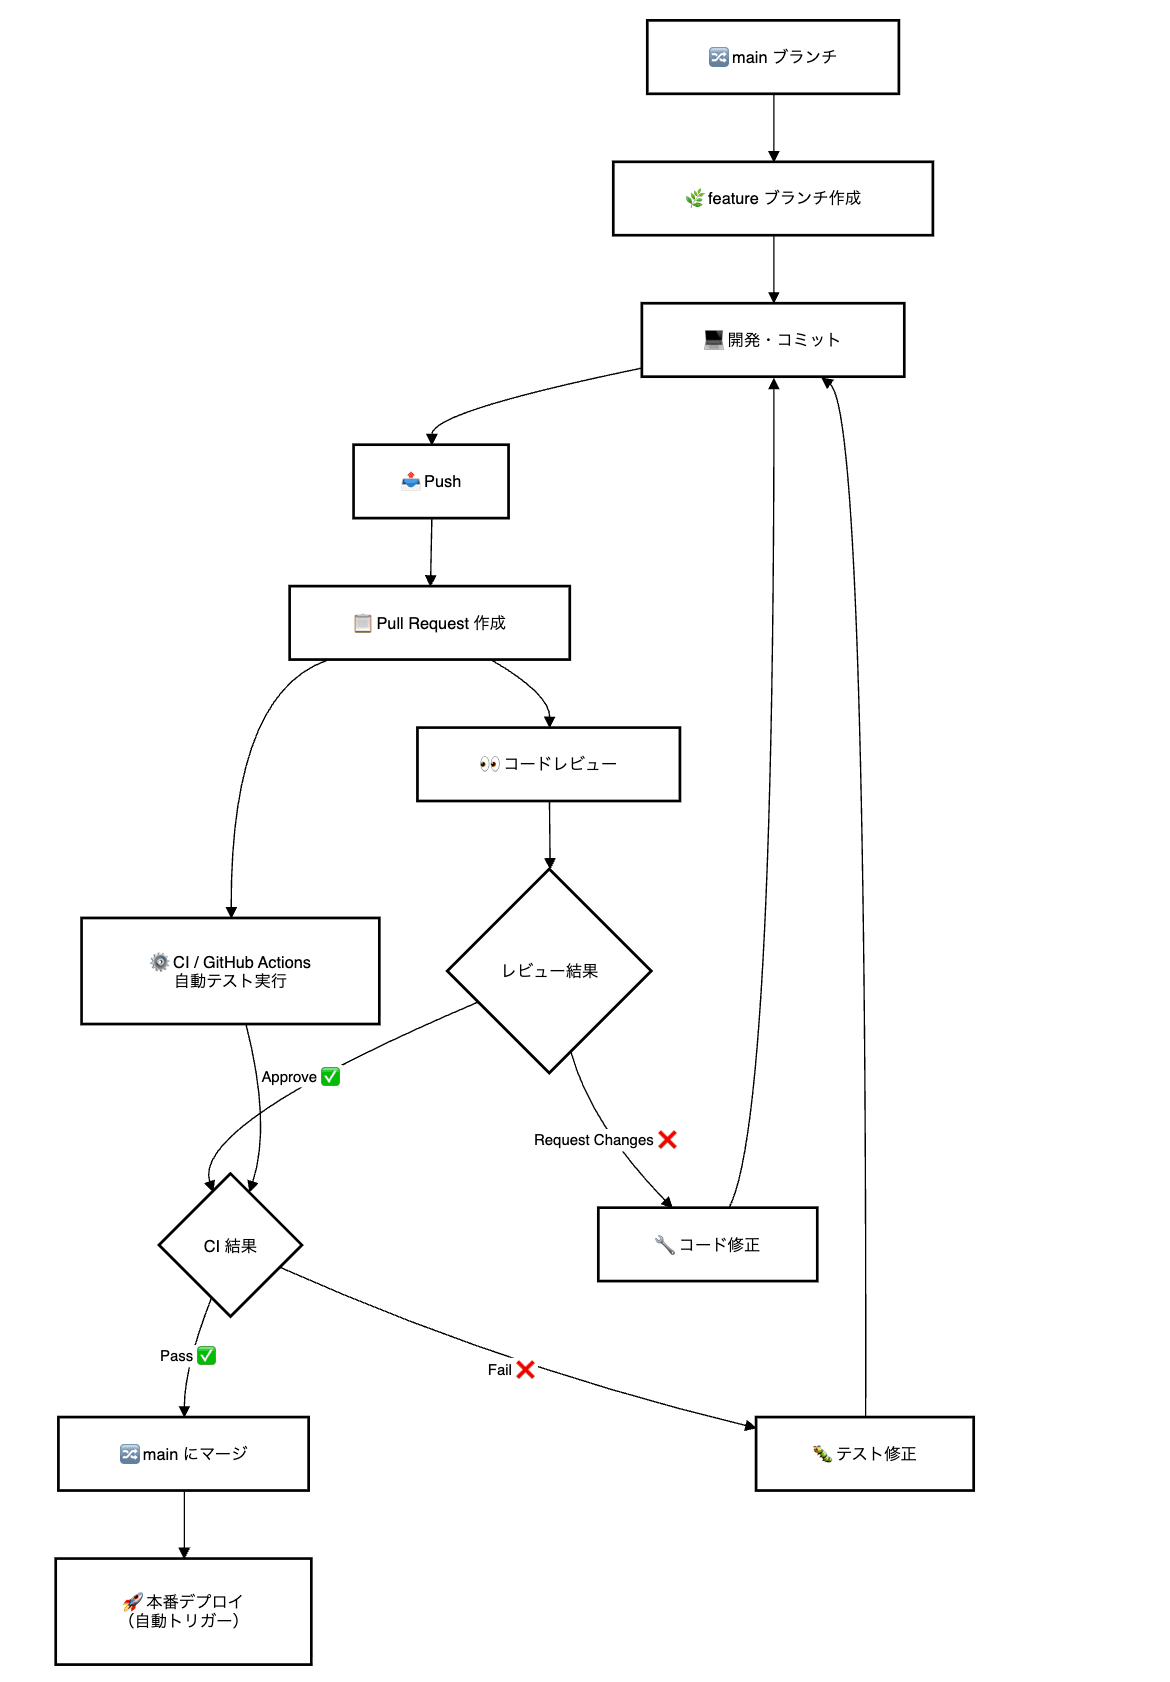
GitHub Flow flowchart output
Conclusion
I tried out drawio-mcp's Project Instructions. Being able to quickly create diagrams in Claude Project is convenient. Even in environments where using MCP is difficult, this method allows you to create nice draw.io diagrams.
I hope you found this useful.