AI Automatically Generates Reports! Alteryx Auto Insights' Reports Feature

Hello, I'm Ikumi from the Business Efficiency Solutions Department.
In this post, I will summarize how to utilize the Reports function available in Alteryx Auto Insights.
What is Auto Insights
Auto Insights is one of the features available in Alteryx One, a tool that automatically creates reports and generates insights. Not only does it automate report creation, but it also uses generative AI to automate deeper insight analysis, enabling users to enhance their data utilization capabilities and accelerate decision-making across the entire organization.
About Auto Insights Reports
Auto Insights Reports is an AI-powered report creation solution. In addition to AI creating most of the report, it allows human adjustment of layouts and display items.
Auto Insights also has an earlier feature called Missions, which similarly creates reports through AI guidance but lacks layout adjustment capabilities. However, Missions is designed to analyze a single metric from multiple angles, and personally, I find it easier to perform deep-dive analysis with Missions.
Conversely, the Reports feature allows you to customize reports focused on specific analytical perspectives or metrics you want to highlight. In my personal opinion, I feel this may be more user-friendly when regularly distributing specific numerical data.
Let's try it
-
Let's try out the Reports feature right away
-
Note that to use Auto Insight, you need a Professional Edition license or higher### Automatic Generation of Reports
-
For this demonstration, we'll assume that the data has already been uploaded to Auto Insights
-
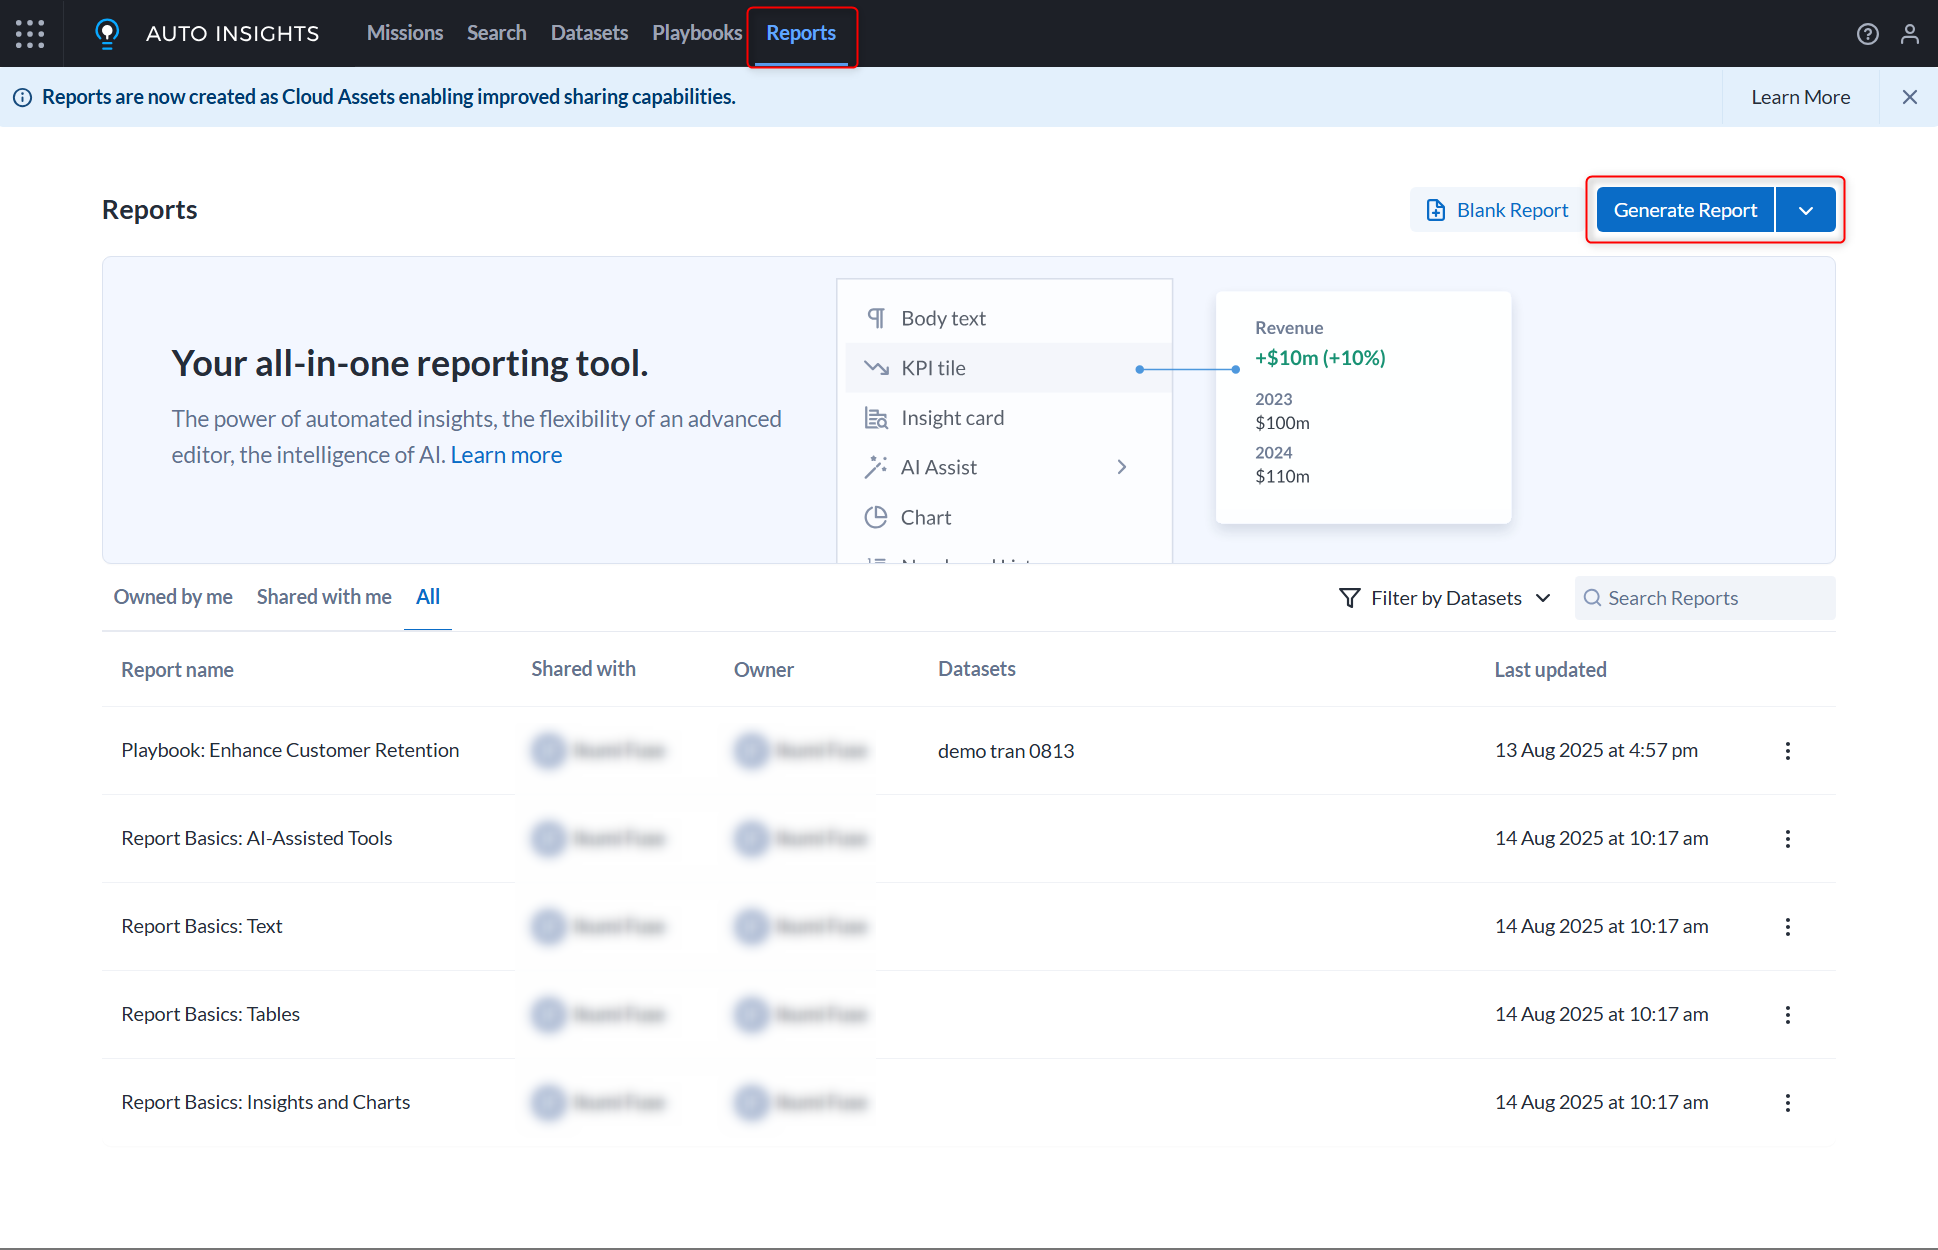
First, launch Auto Insights and open the Reports screen
-
Click
Generate Reportto create a new report
-
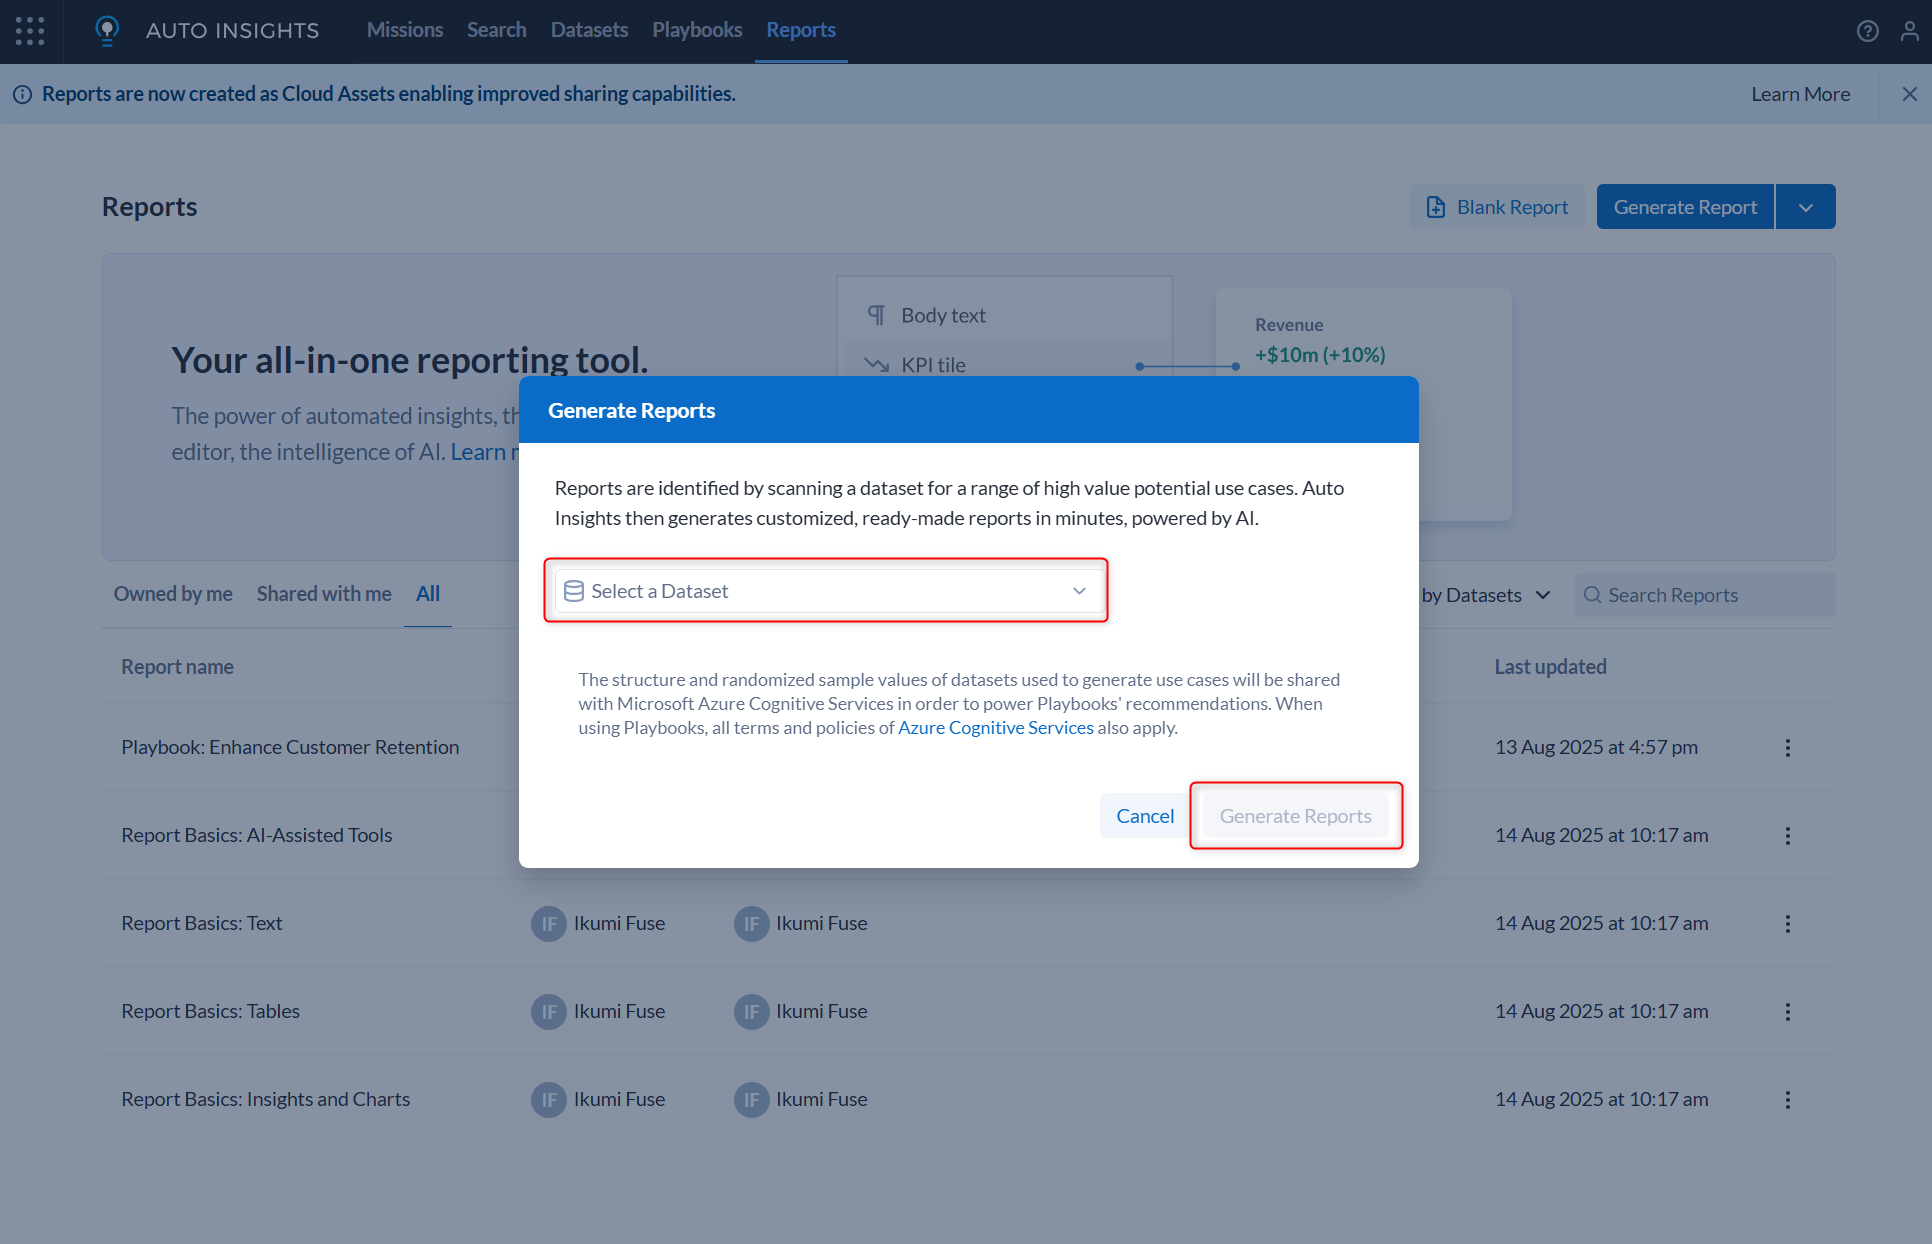
Select the data source you want to use, then click
Generate Reportagain
-
The AI will then examine your data to prepare for automatic report creation
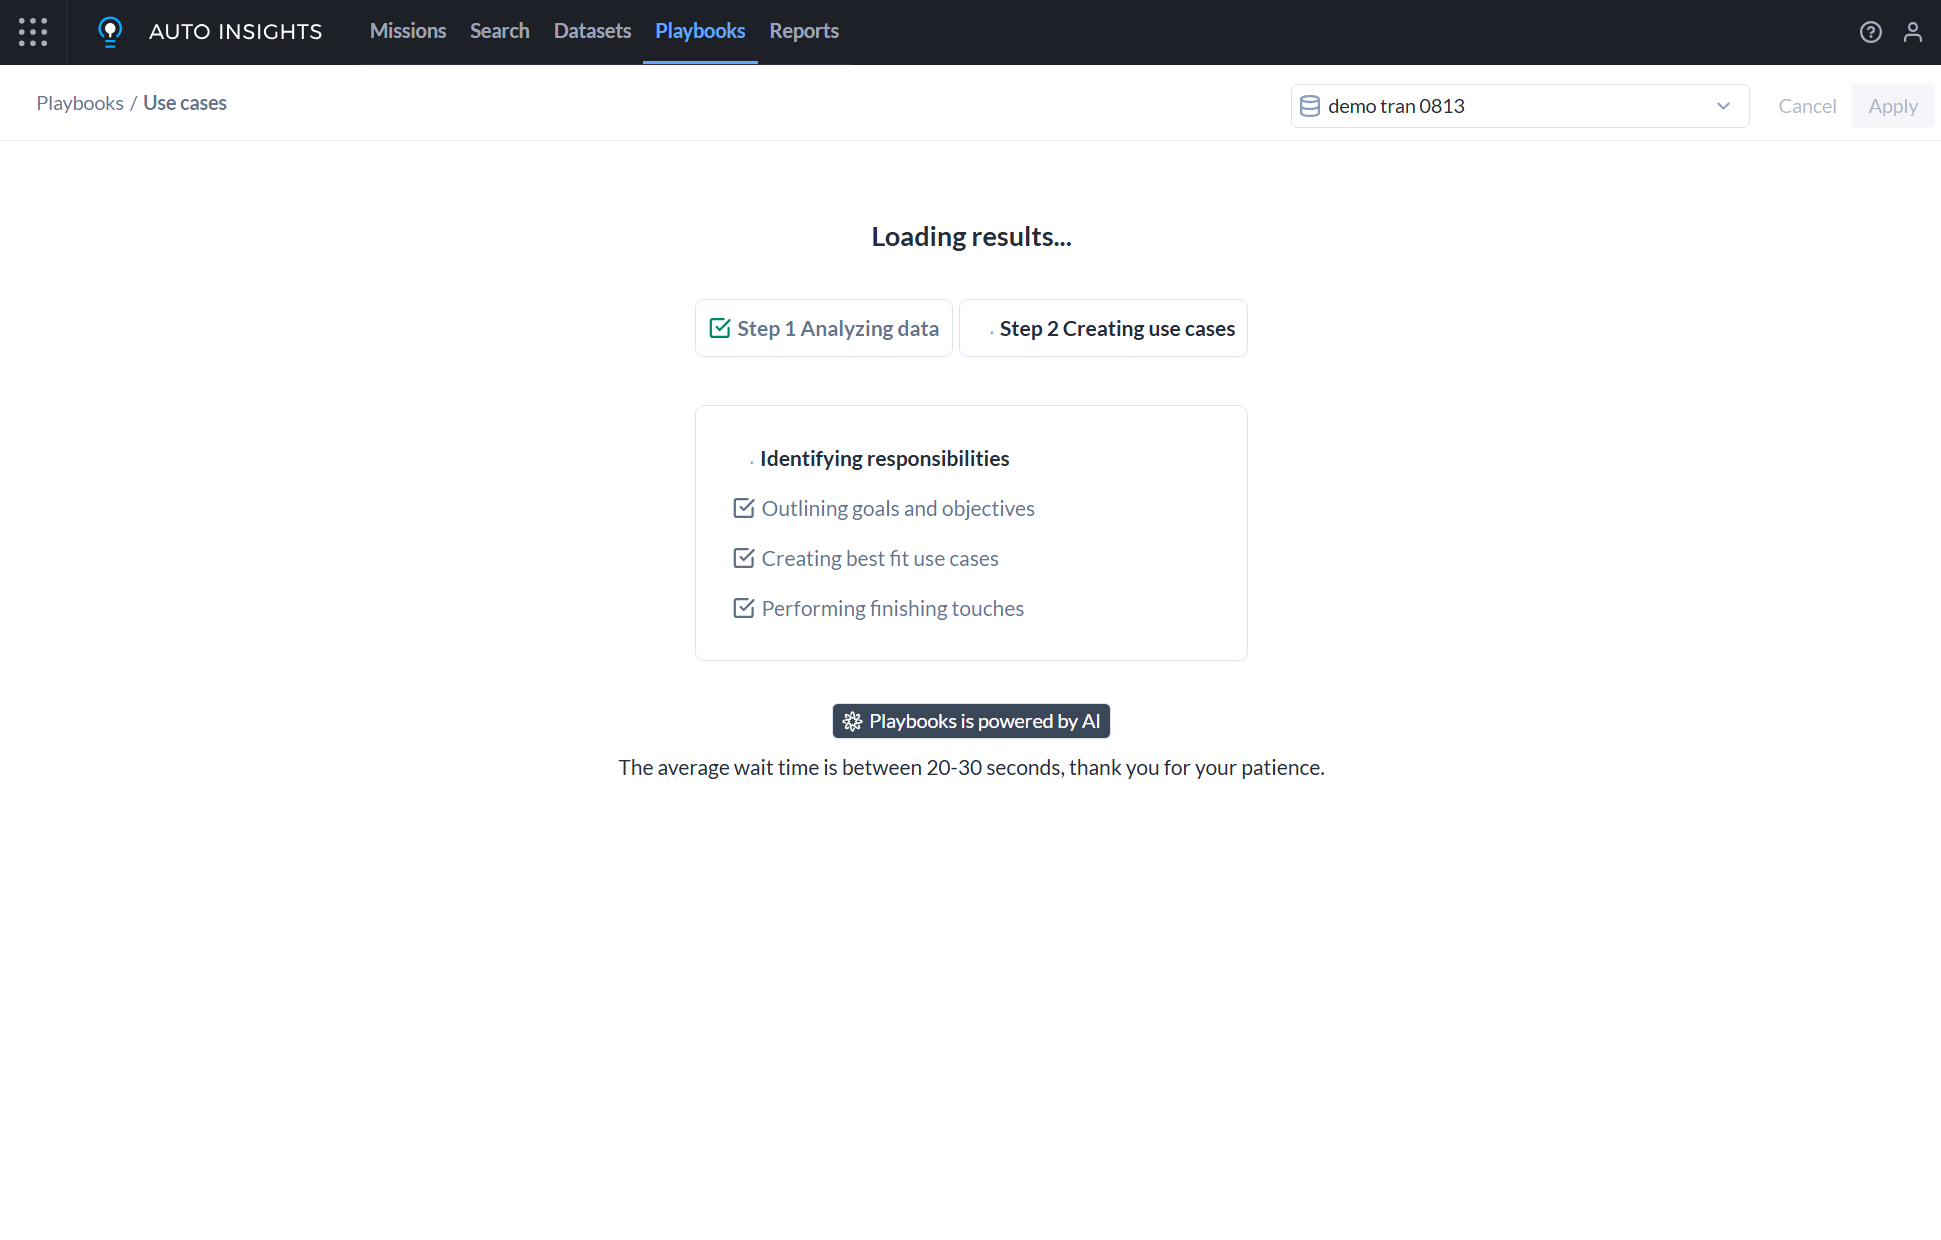
-
Based on this examination, you'll be presented with use case options for your report
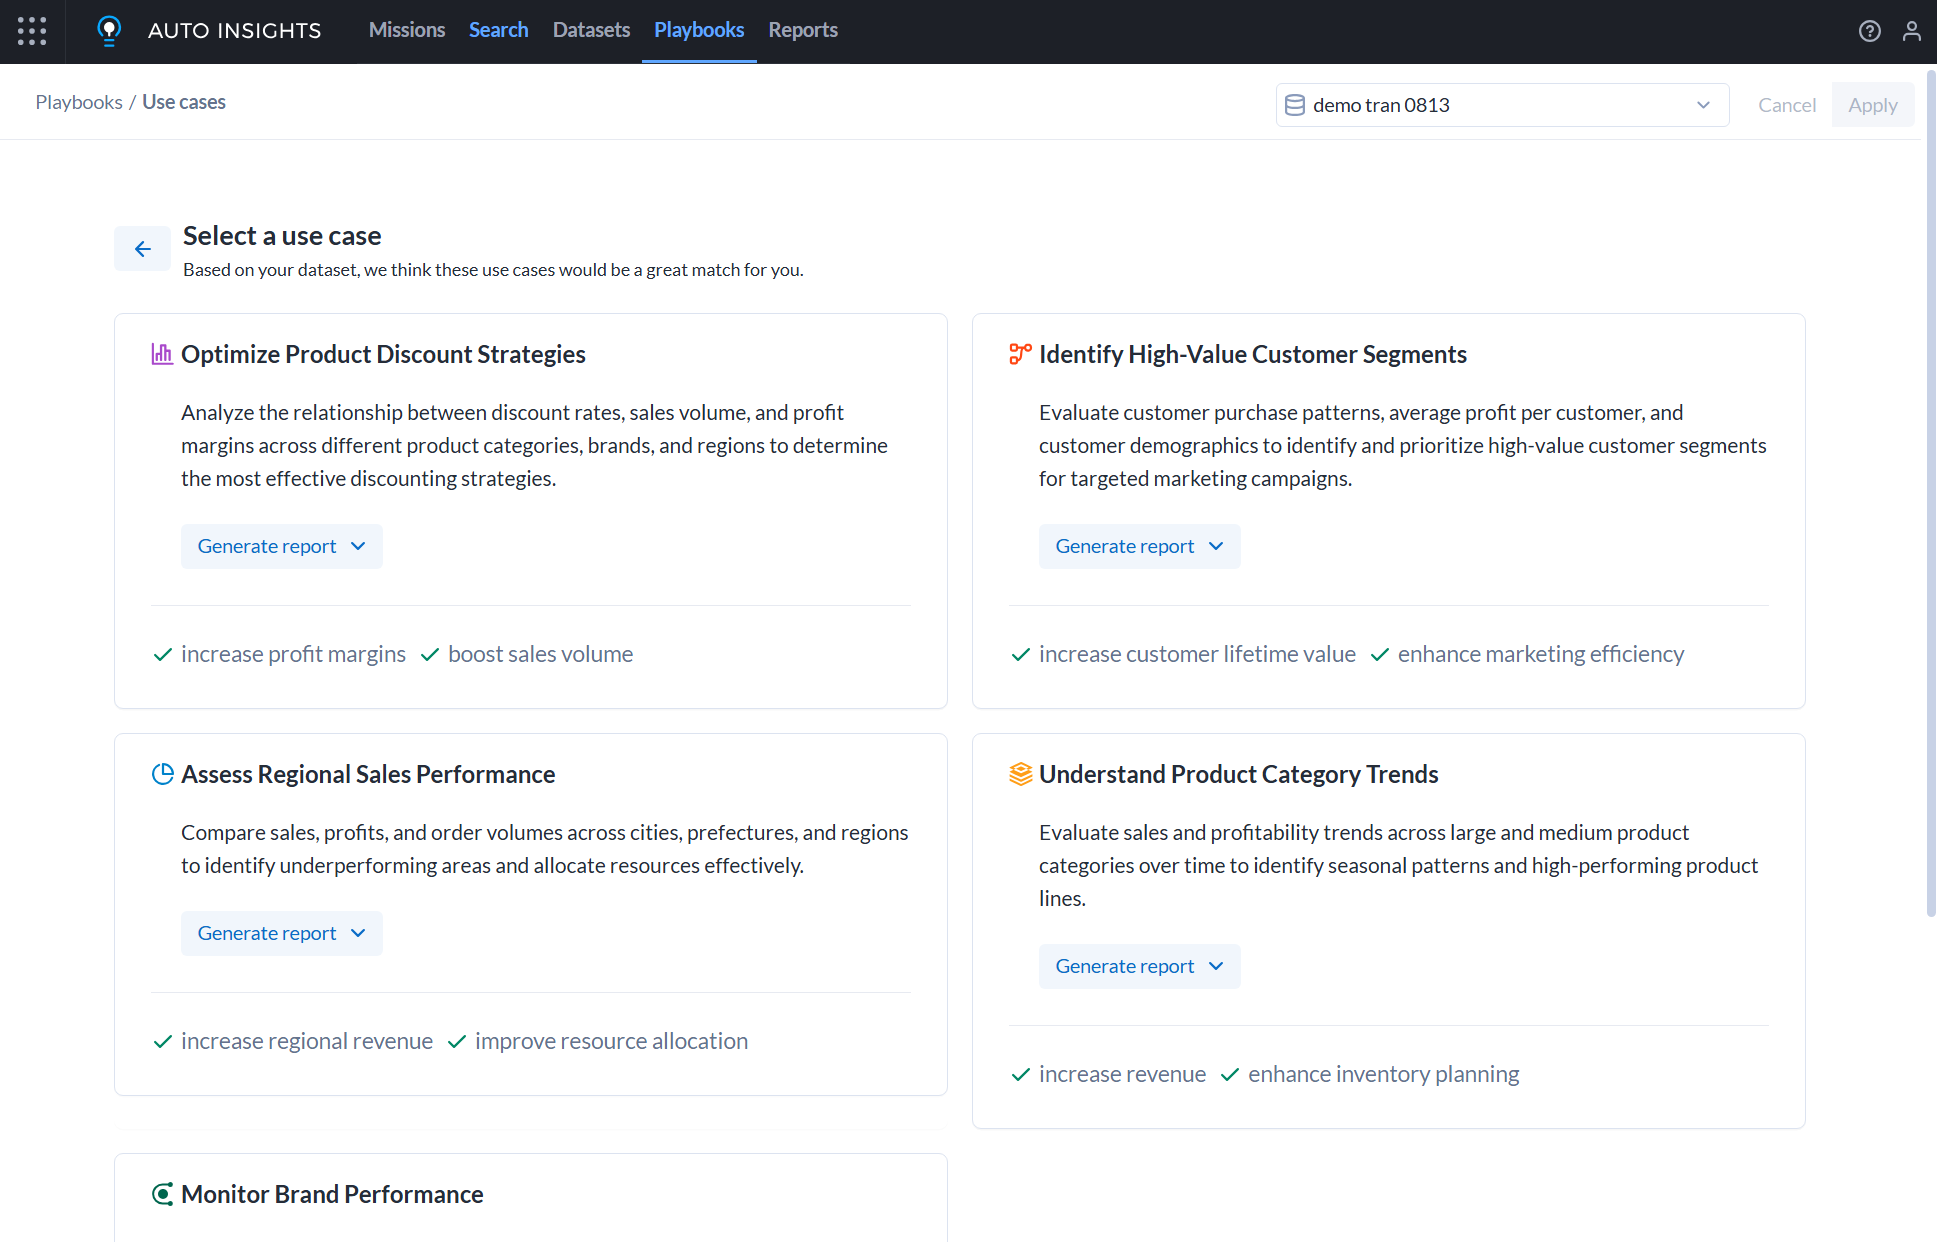
-
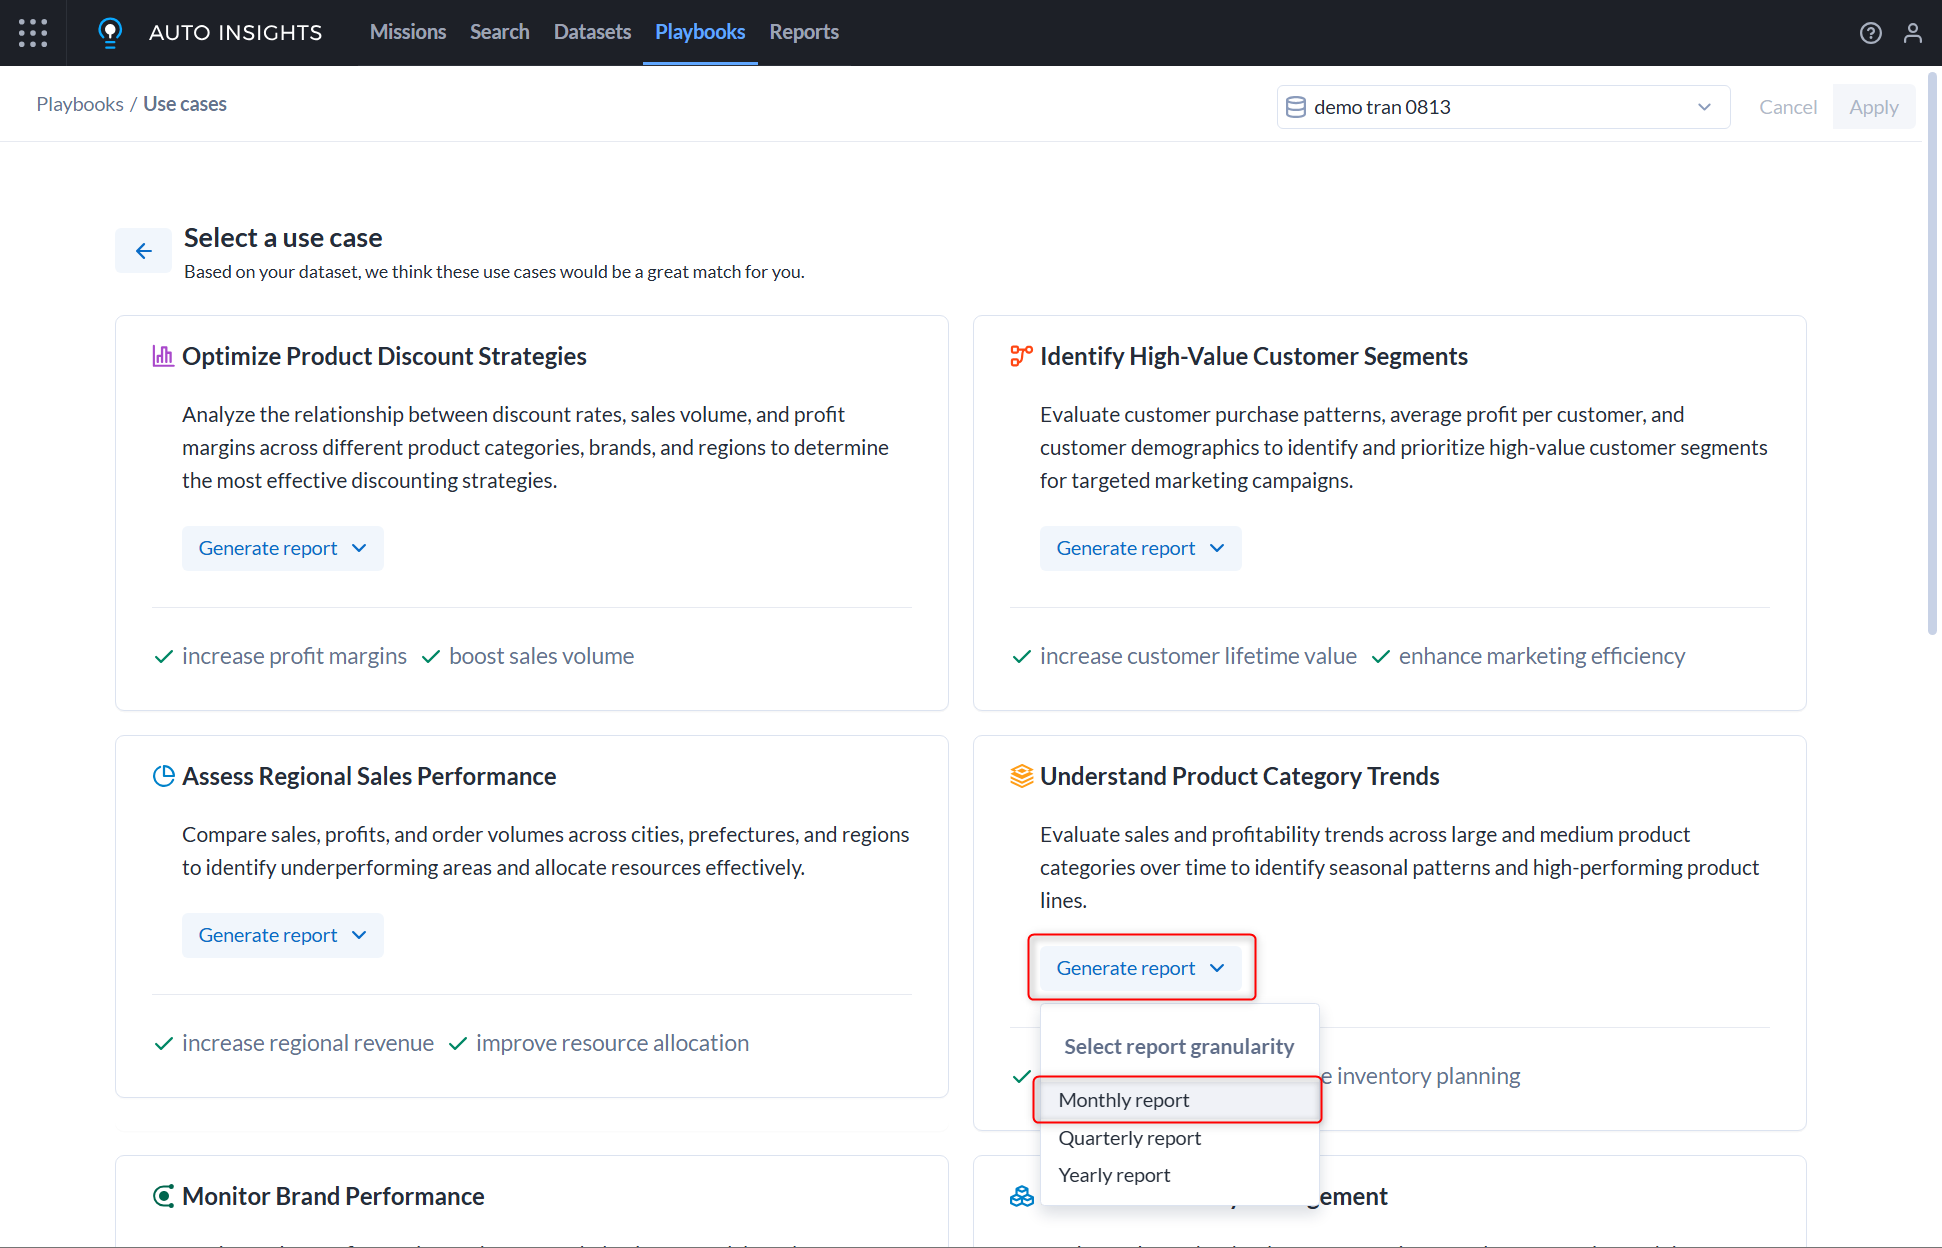
Select your desired use case, then choose
Generate Reportand select the time period granularity
-
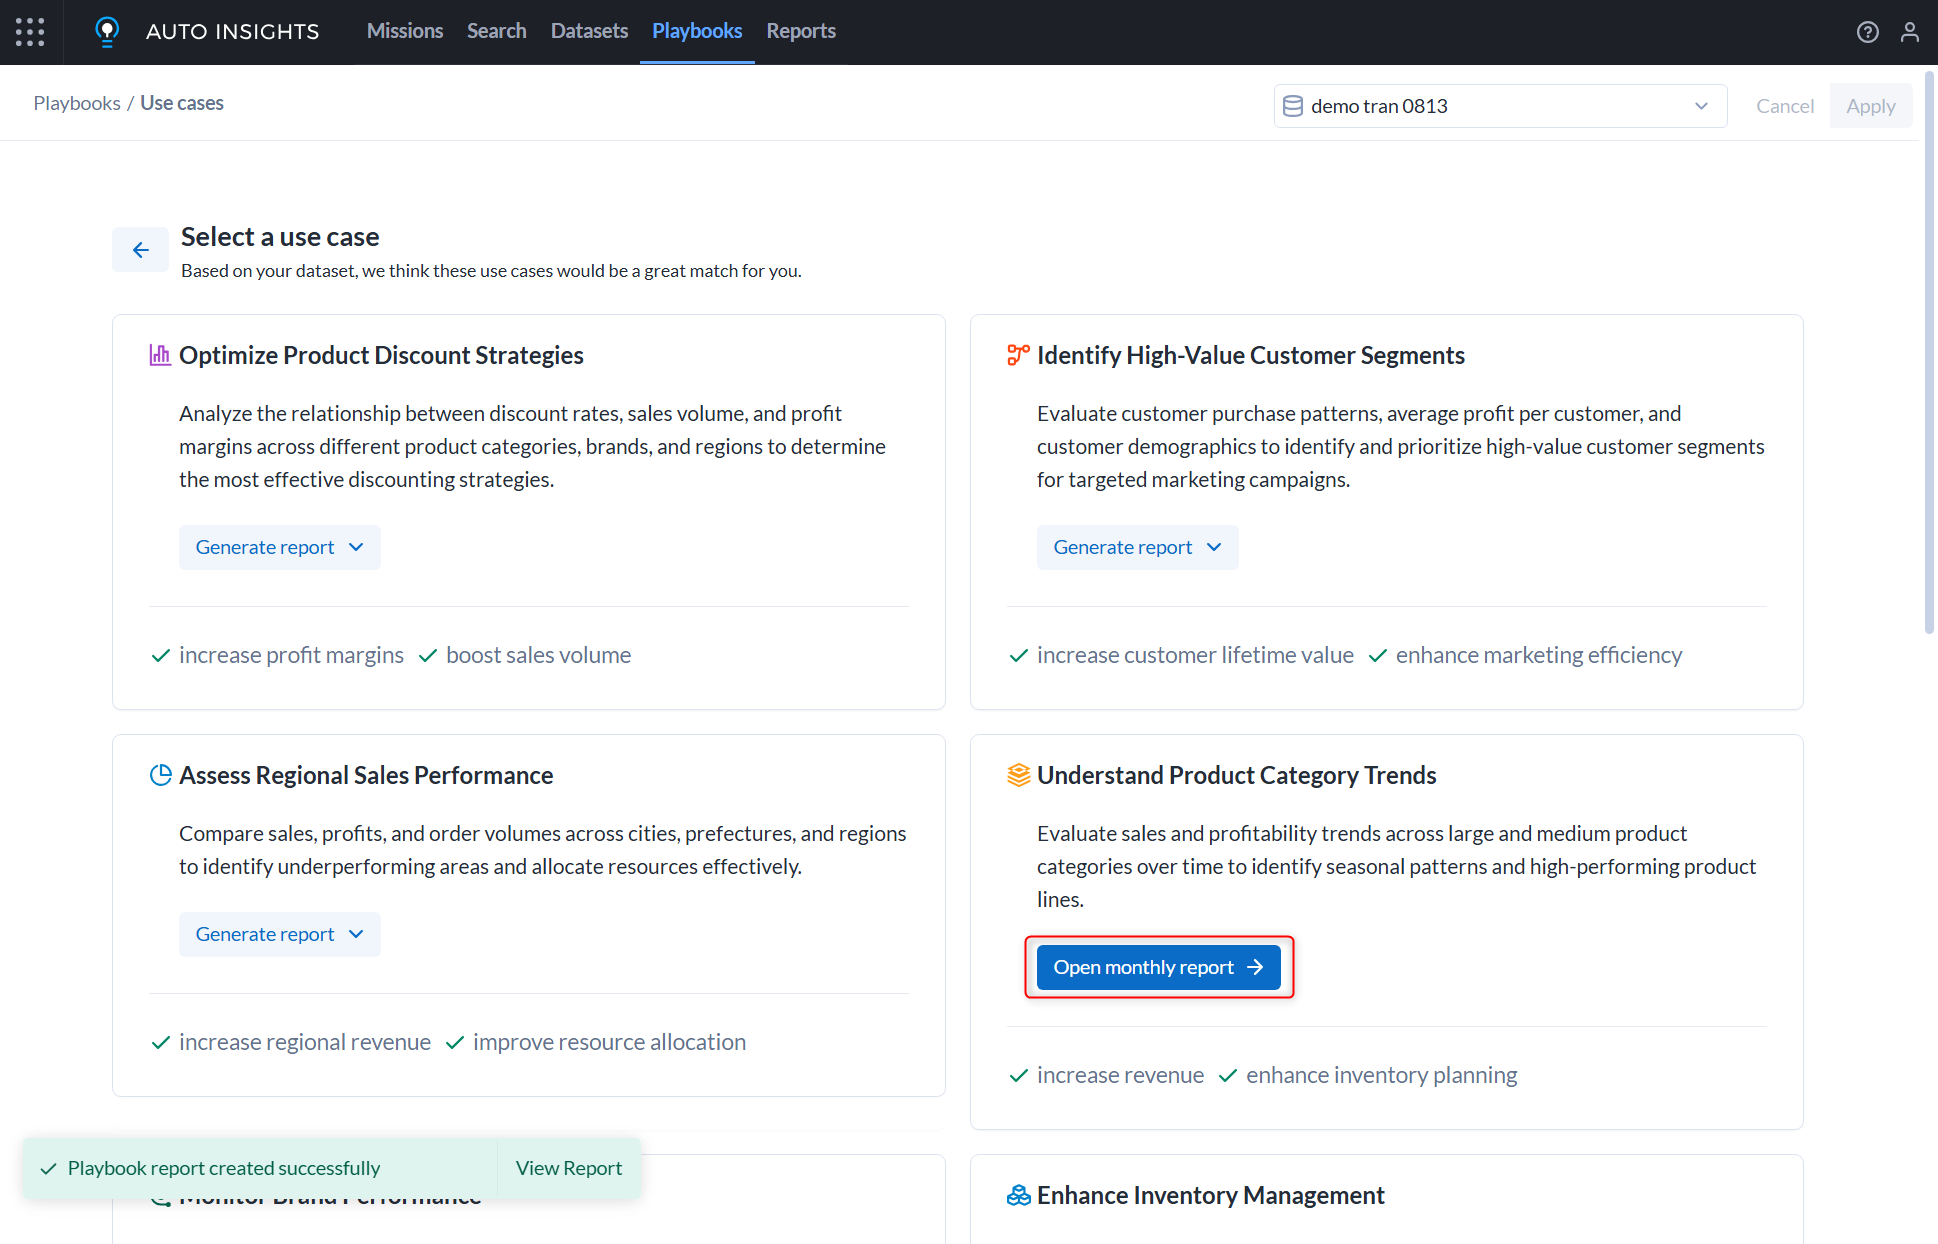
Click
Open Monthly Reportto view the report
-
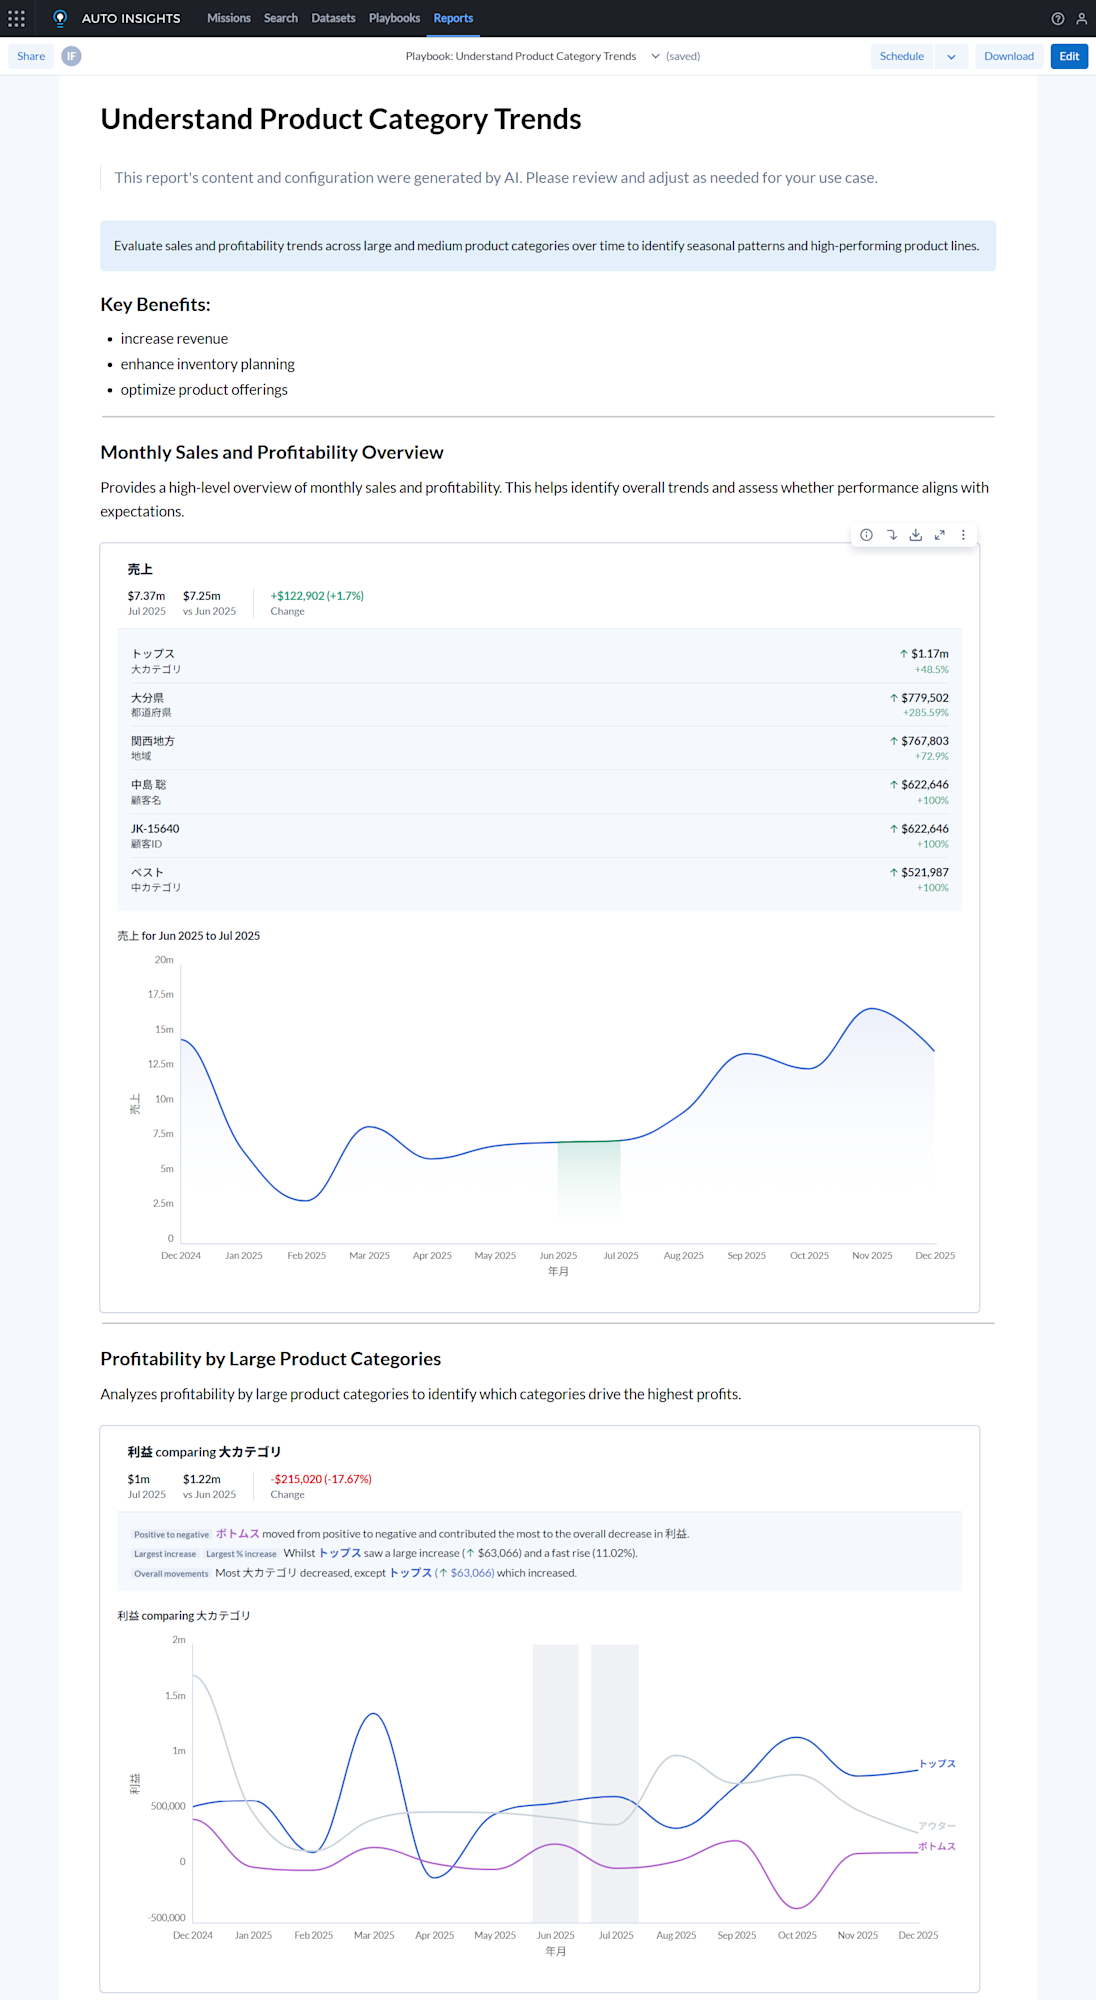
Below is a portion of the created report. With just a few clicks, a very well-organized report has been created!
 ### Editing Reports
 -
Clicking the
Editbutton on the Report will take you to the report editing mode -
In this screen, you can freely layout text and data to insert into the report using the following elements
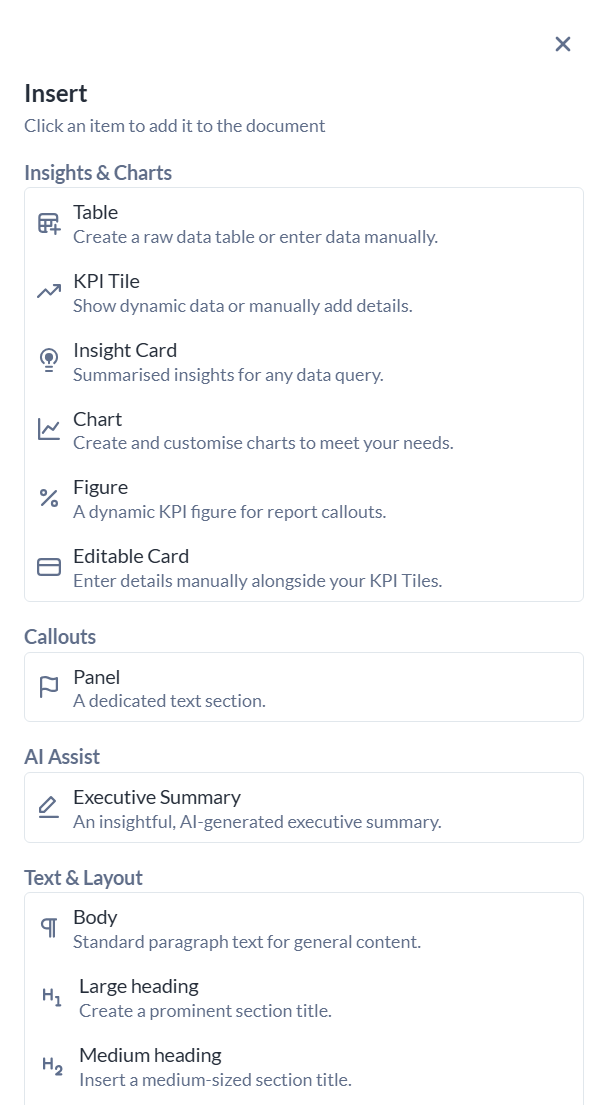
-
Here, we'll introduce the data display elements that can be used
-
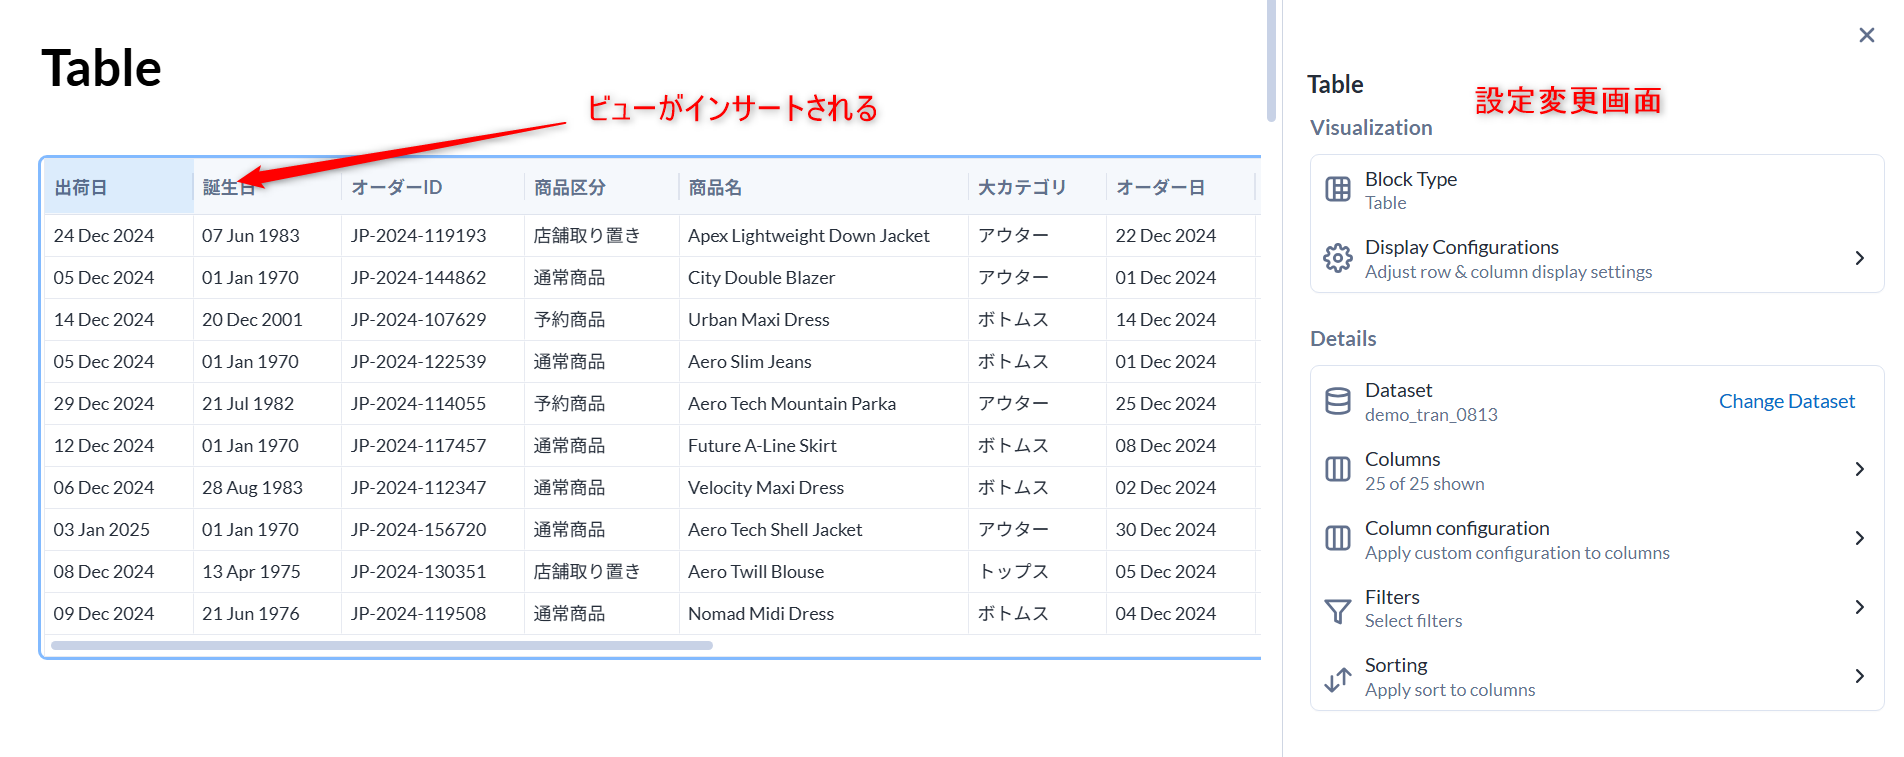
Table Format (Table)
- Can display the contents of a dataset in table format
- It's also possible to control which columns to display and apply filters to the entire table
-
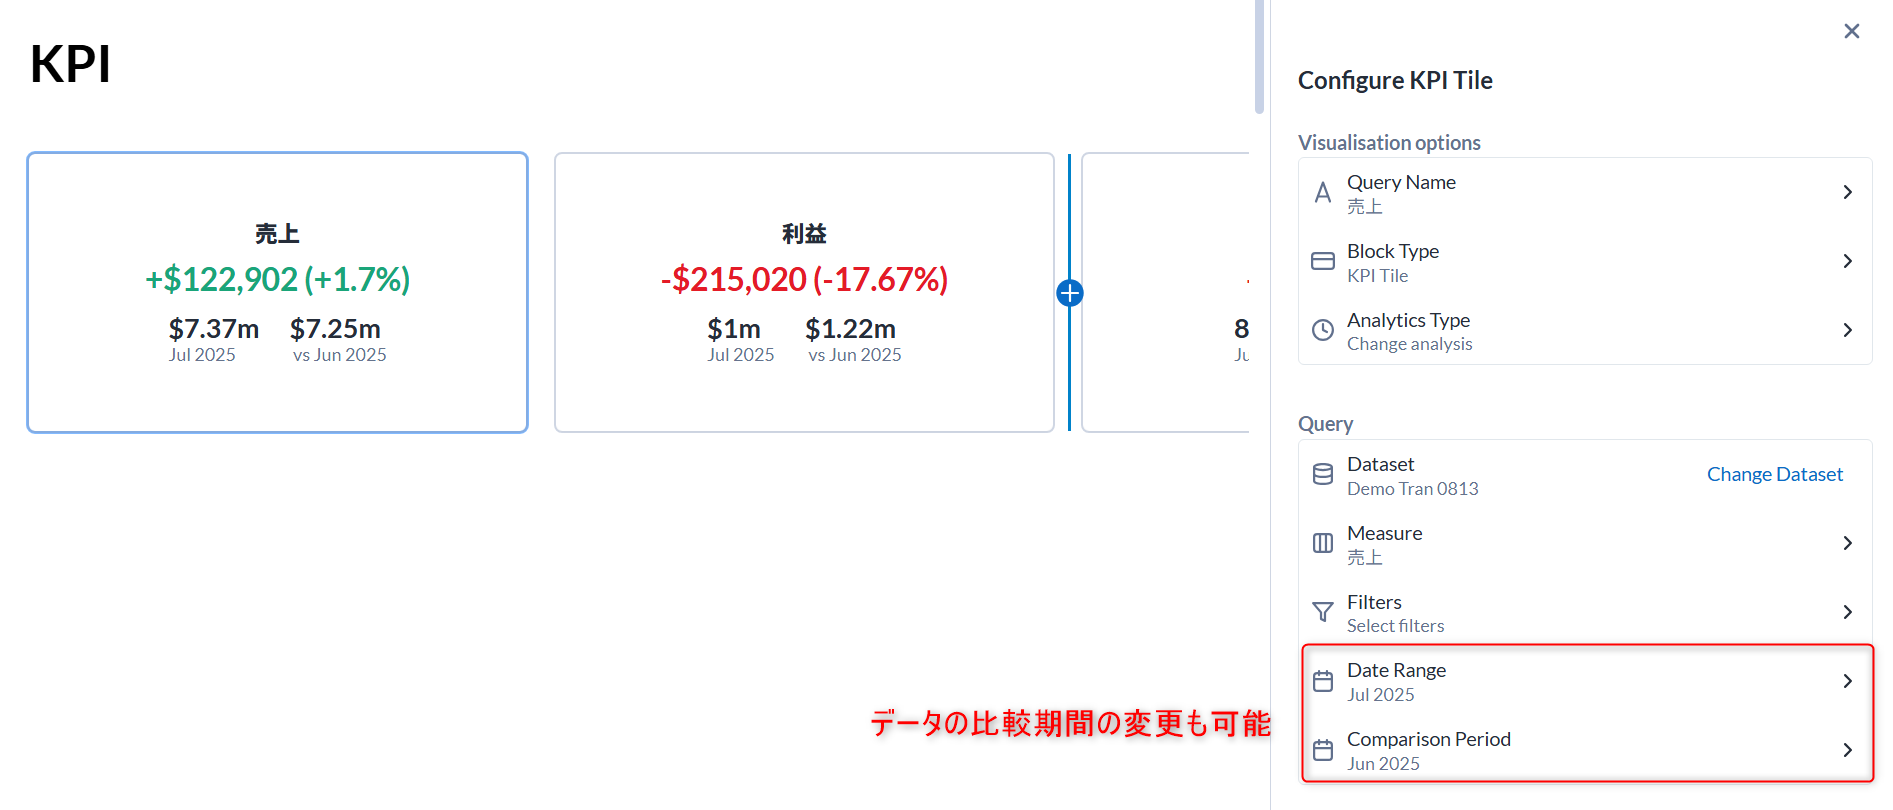
KPI Format (KPI Tile)
- Can display actual values and changes of a single metric in summary format
- You can display only the actual values or change the comparison period
-
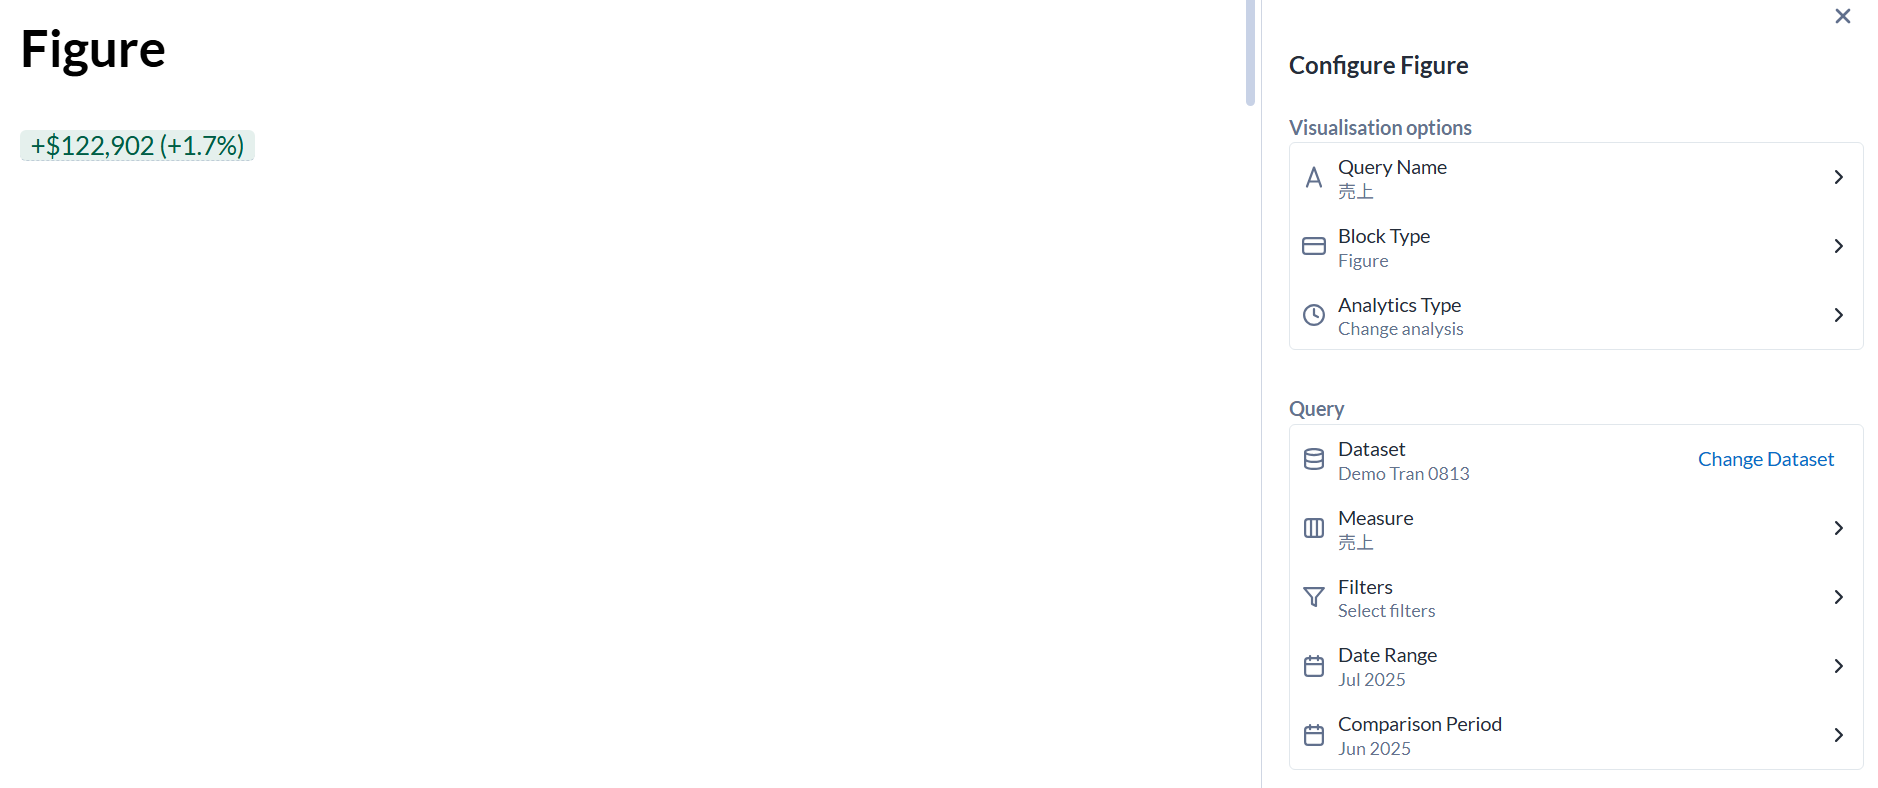
Figure Format (Figure)
- Displays a single metric as a number only
- You can select either total value or change value, useful for inserting into text
-
Chart Format (Chart)
- Displays metric changes in chart format
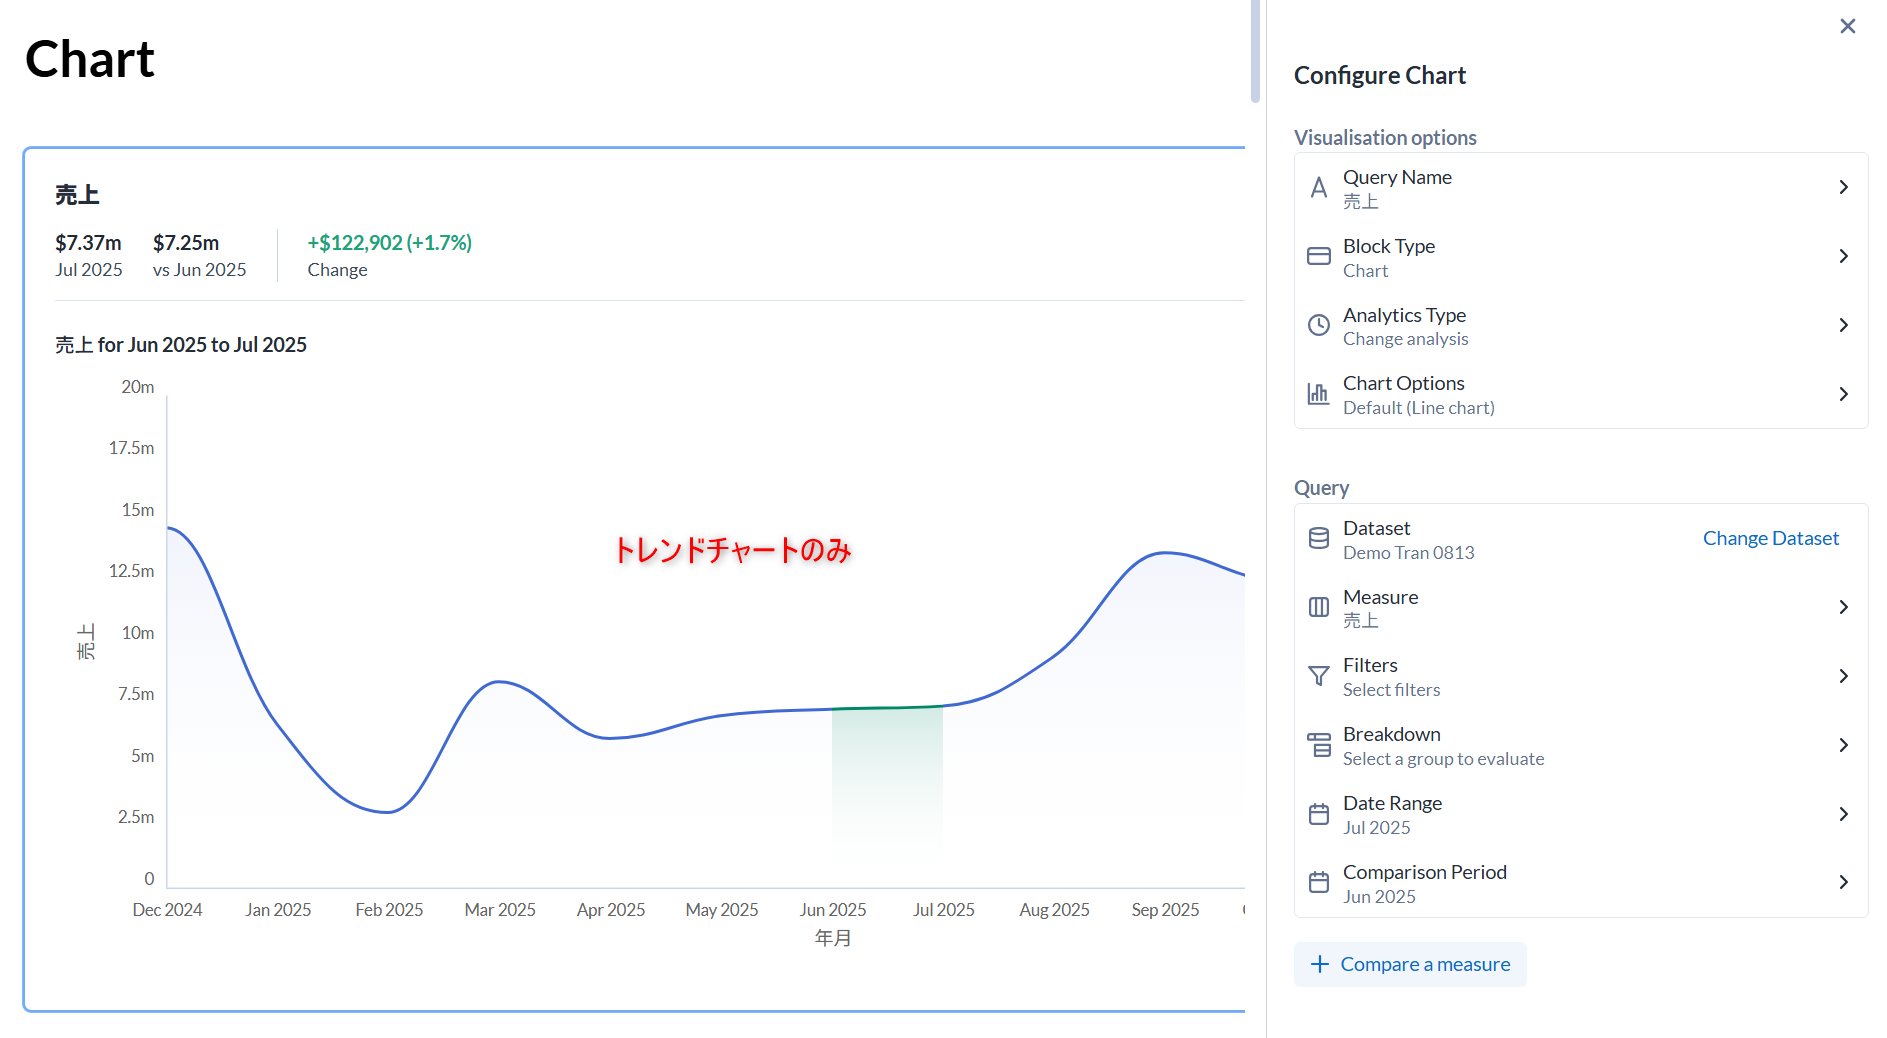
- Displays metric changes in chart format
-
Insight (Insight Card)
- In addition to the above chart, displays items that are factors in numerical changes
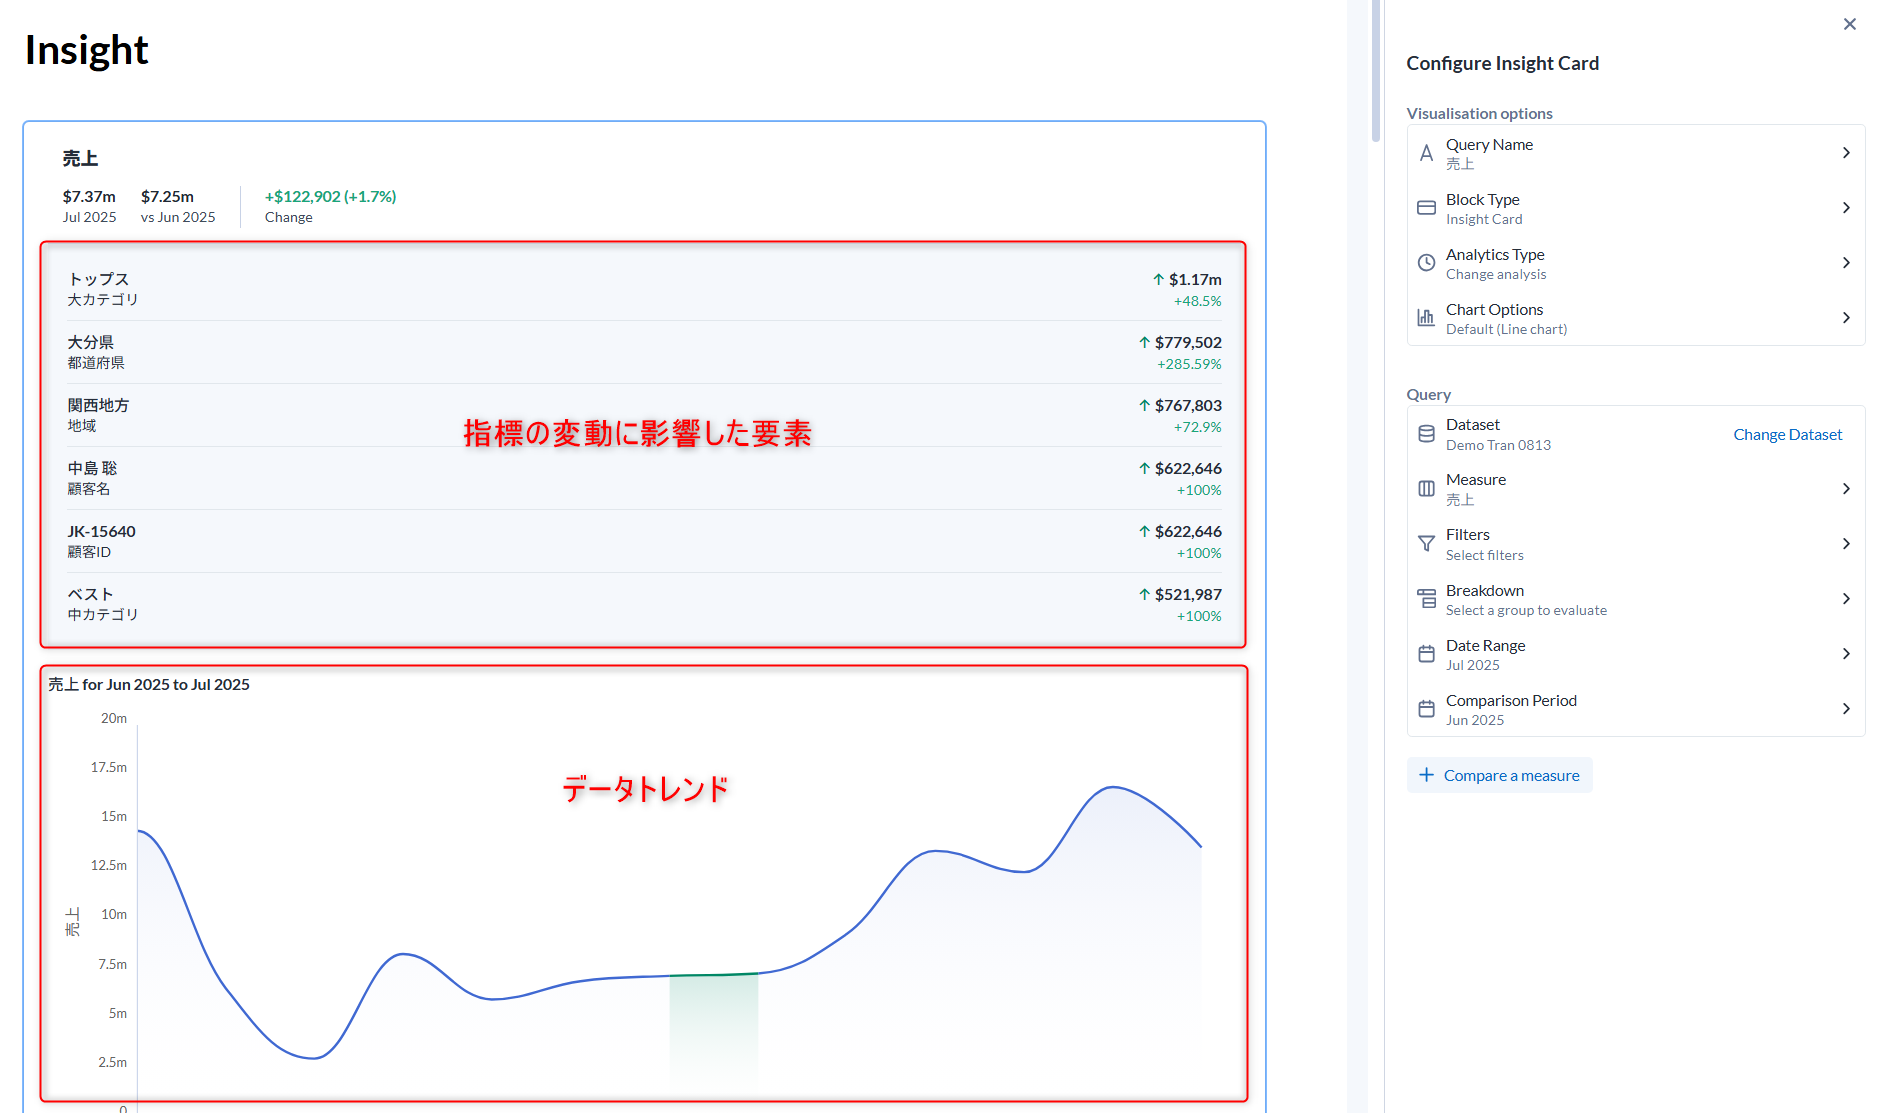
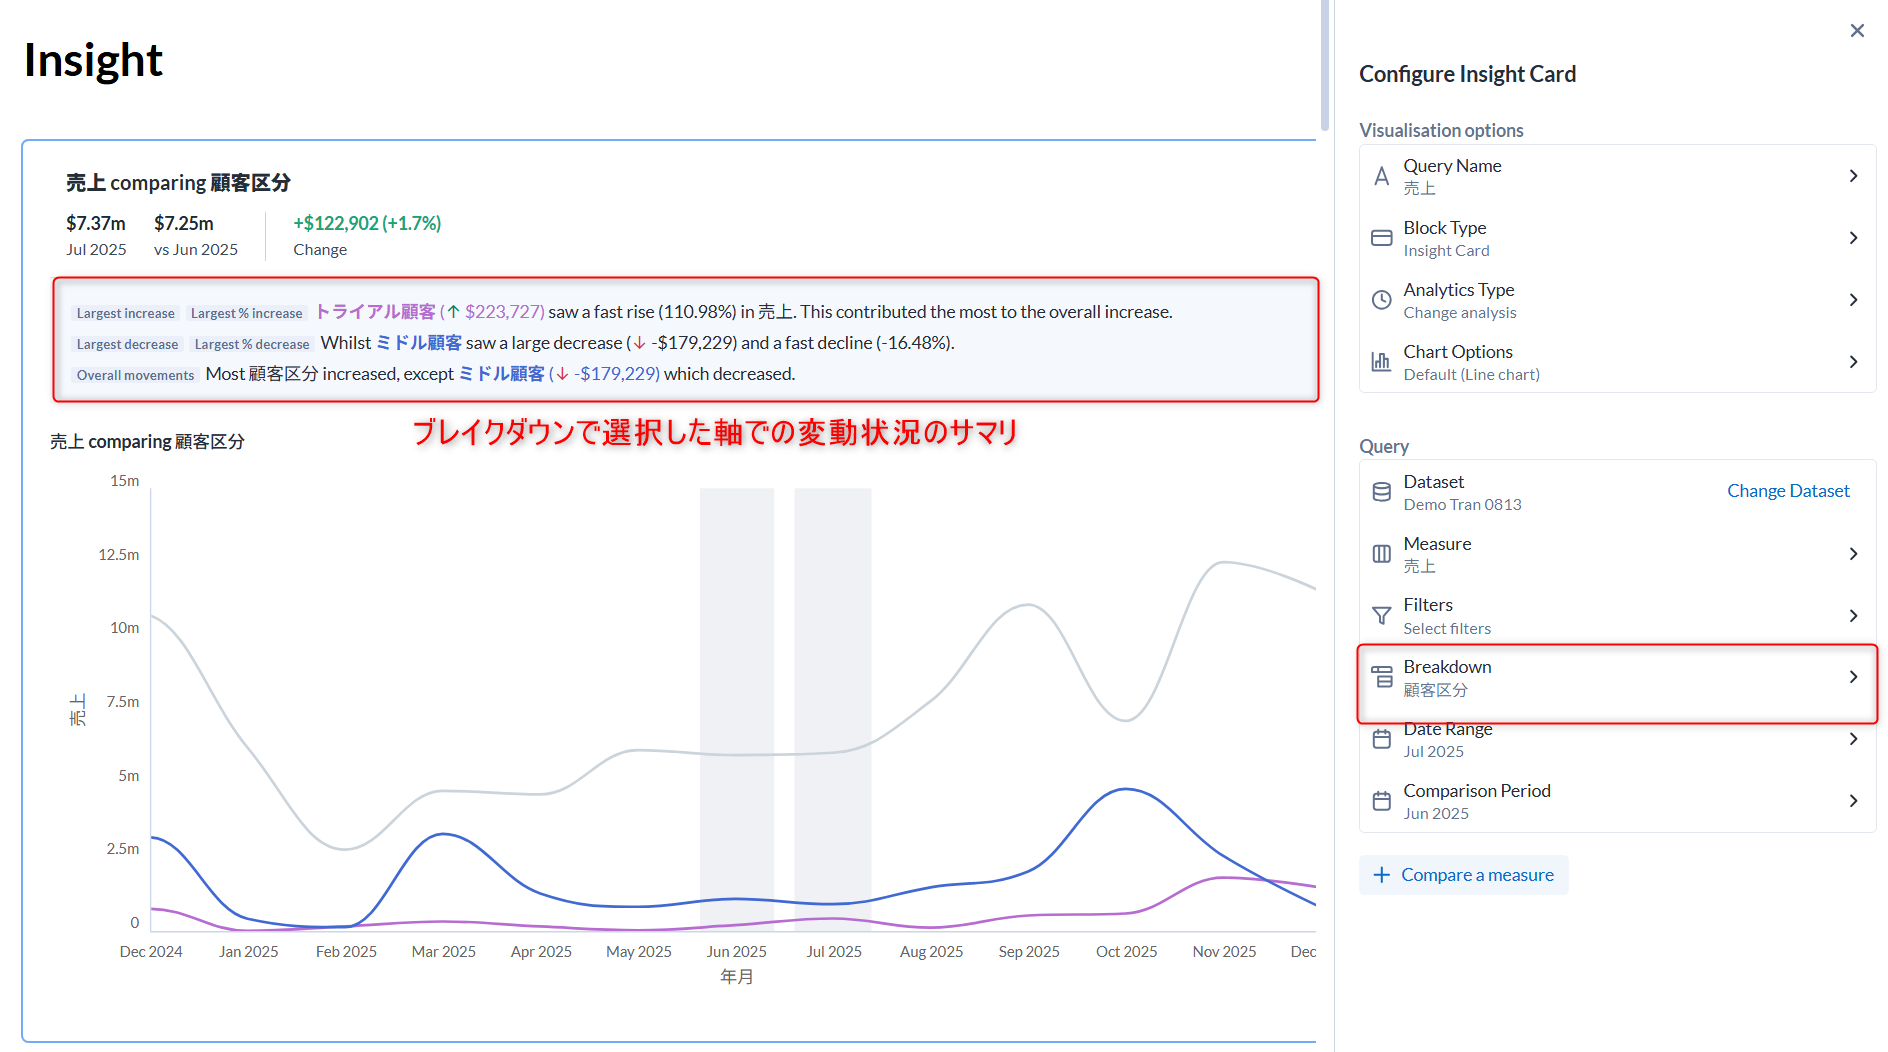
- Selecting a drill-down item displays an overview of numerical changes related to that item
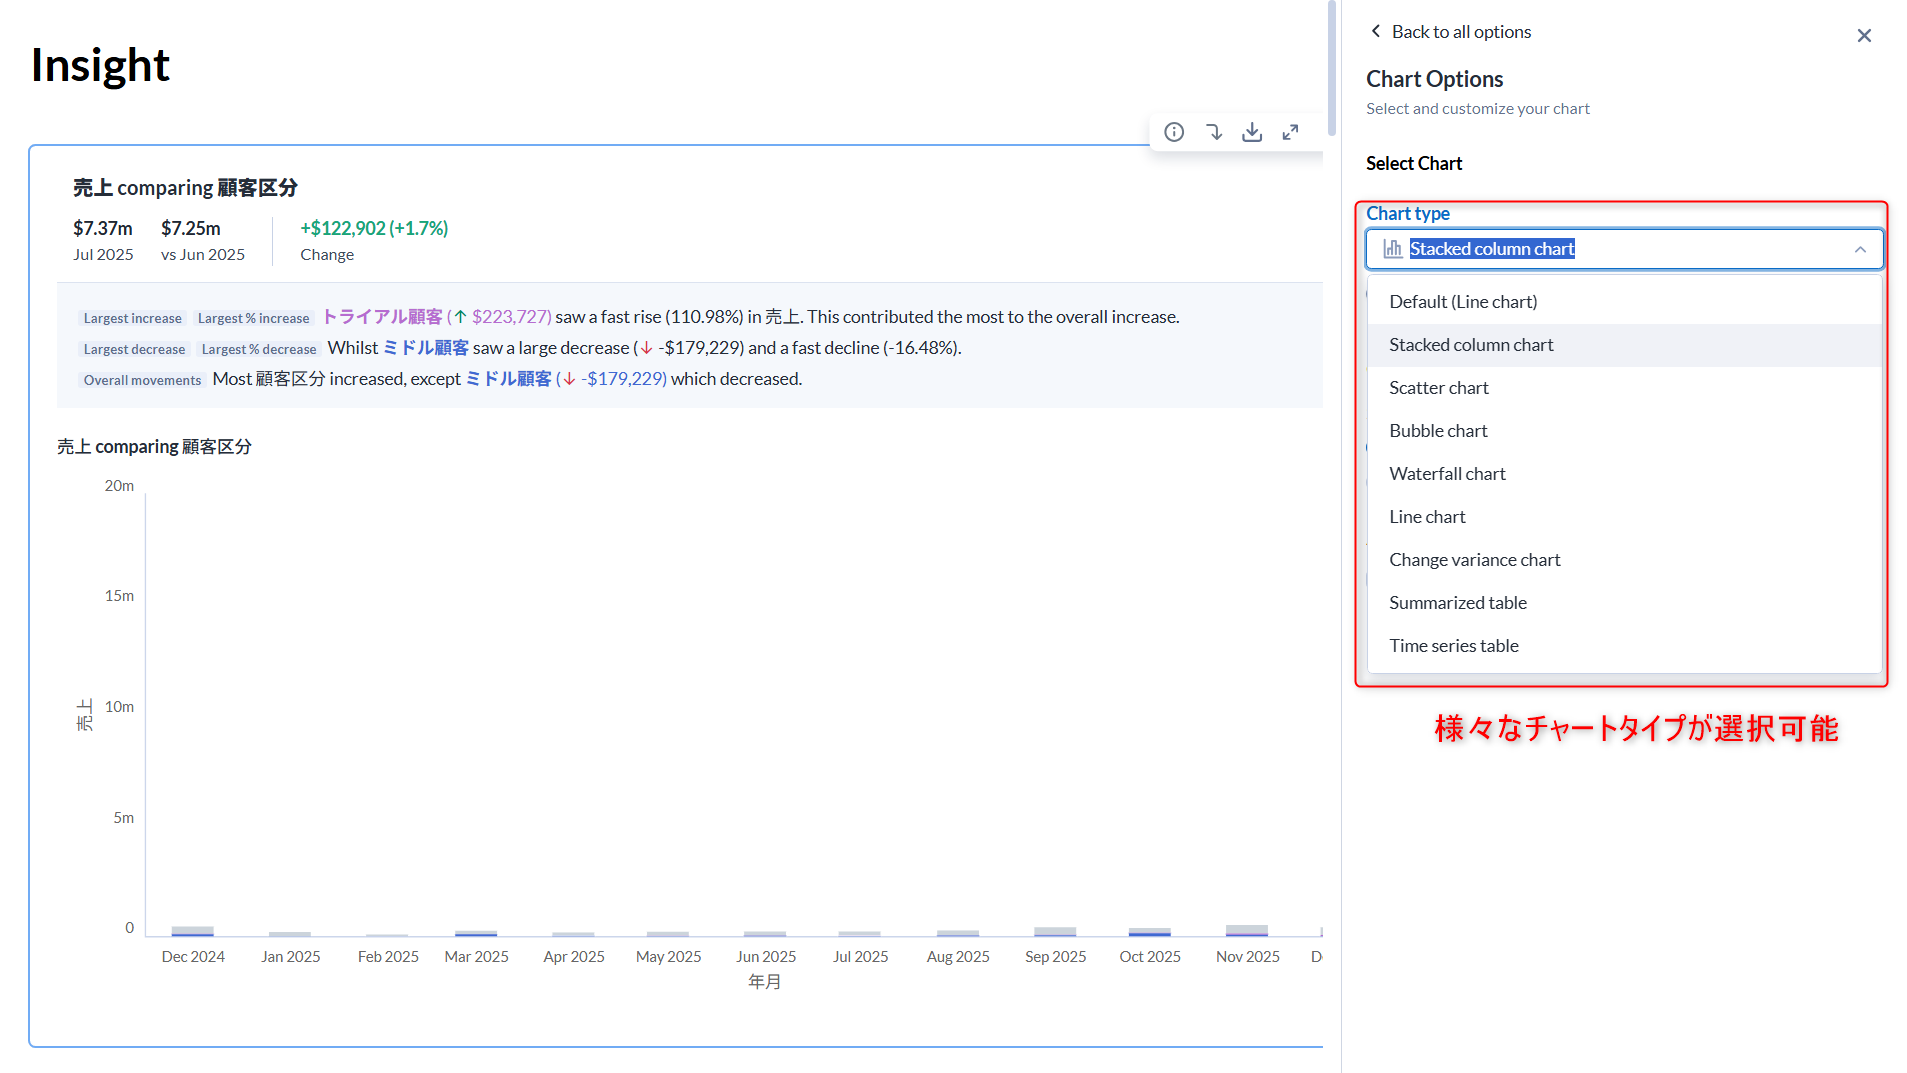
- Note that the chart type can be changed for all of these graphs
- In addition to the above chart, displays items that are factors in numerical changes
-
Next, let's try the AI assist function
-
When sending instructions to summarize the report content, we received content according to the request
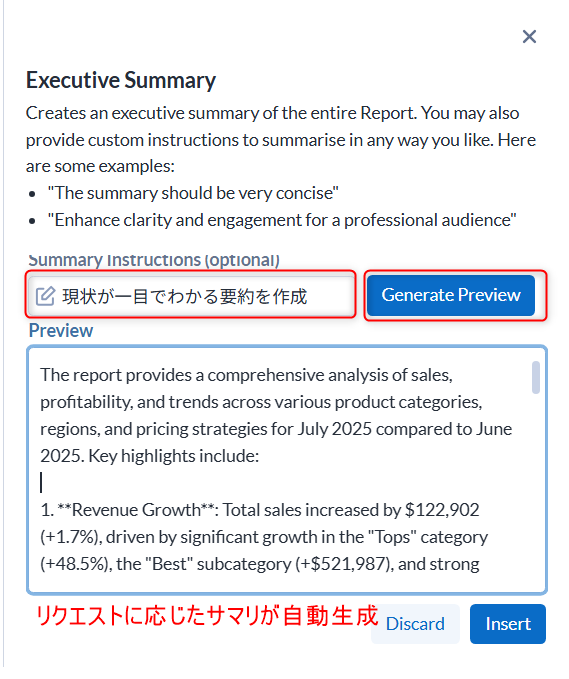
-
After incorporating it into the report, we can also request translation to Japanese using the same AI assist feature
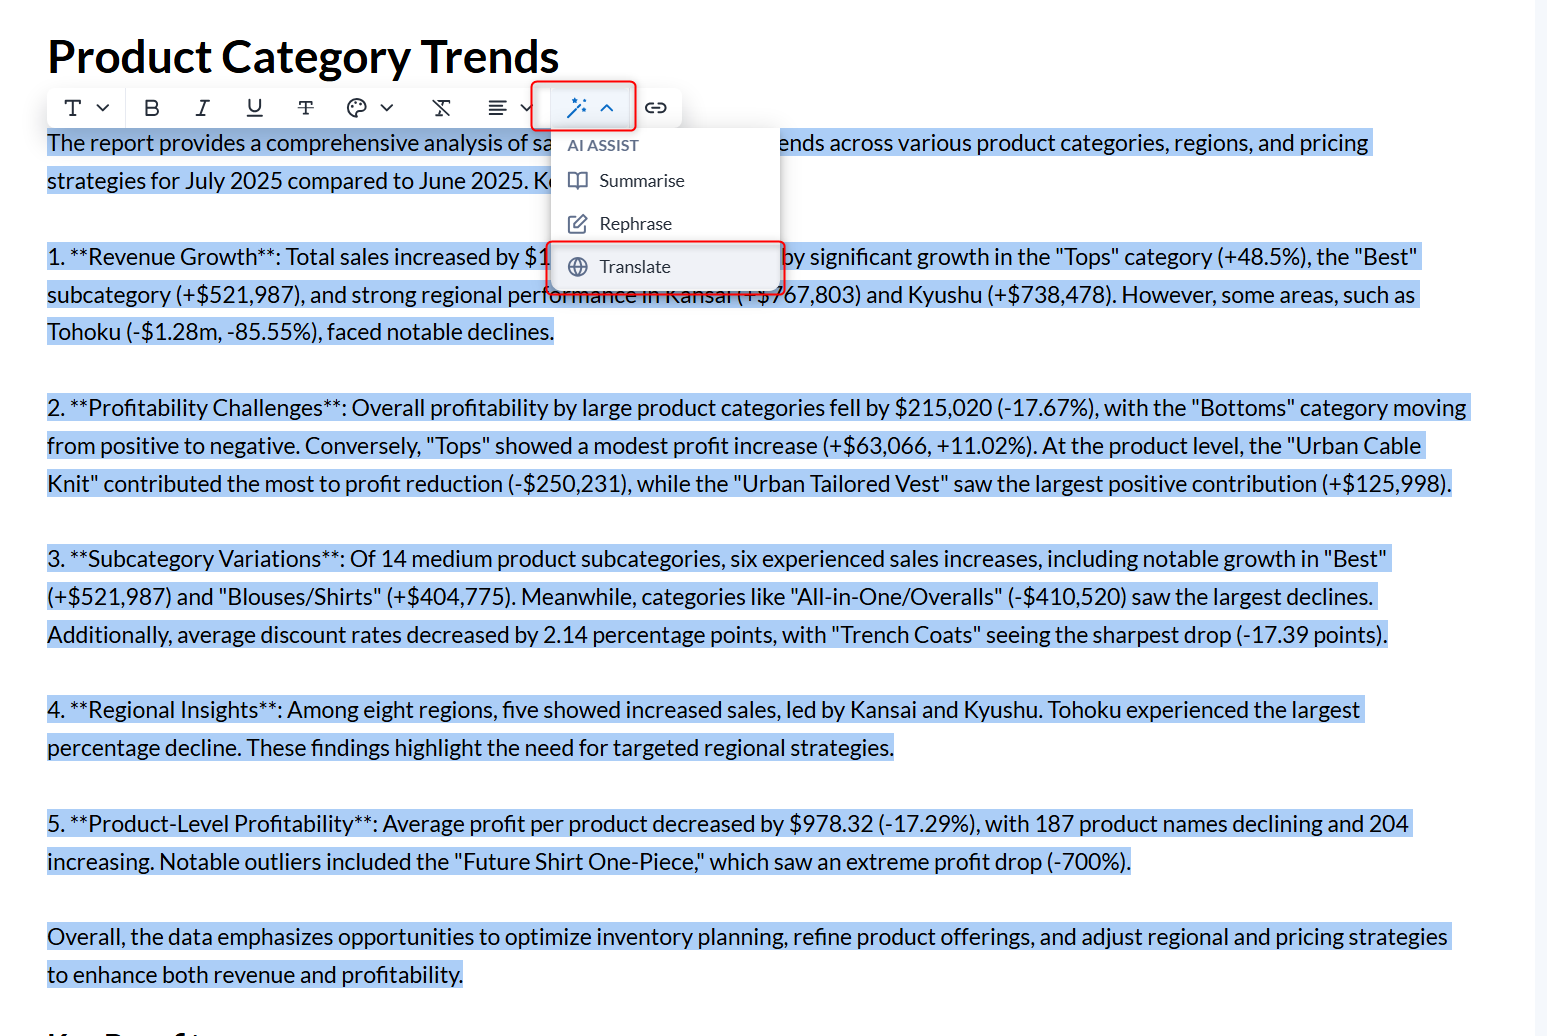
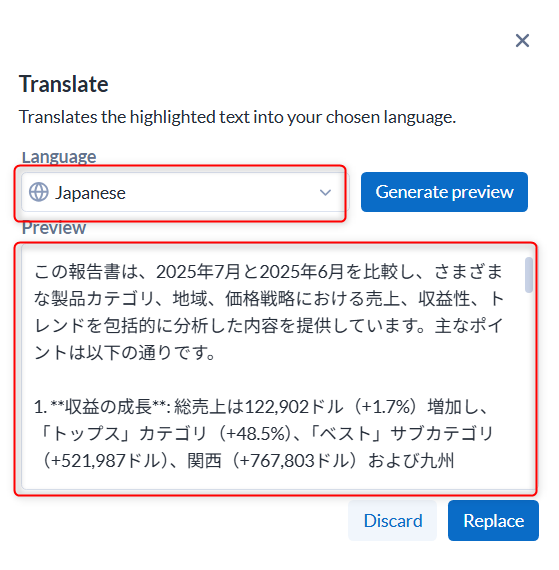
-
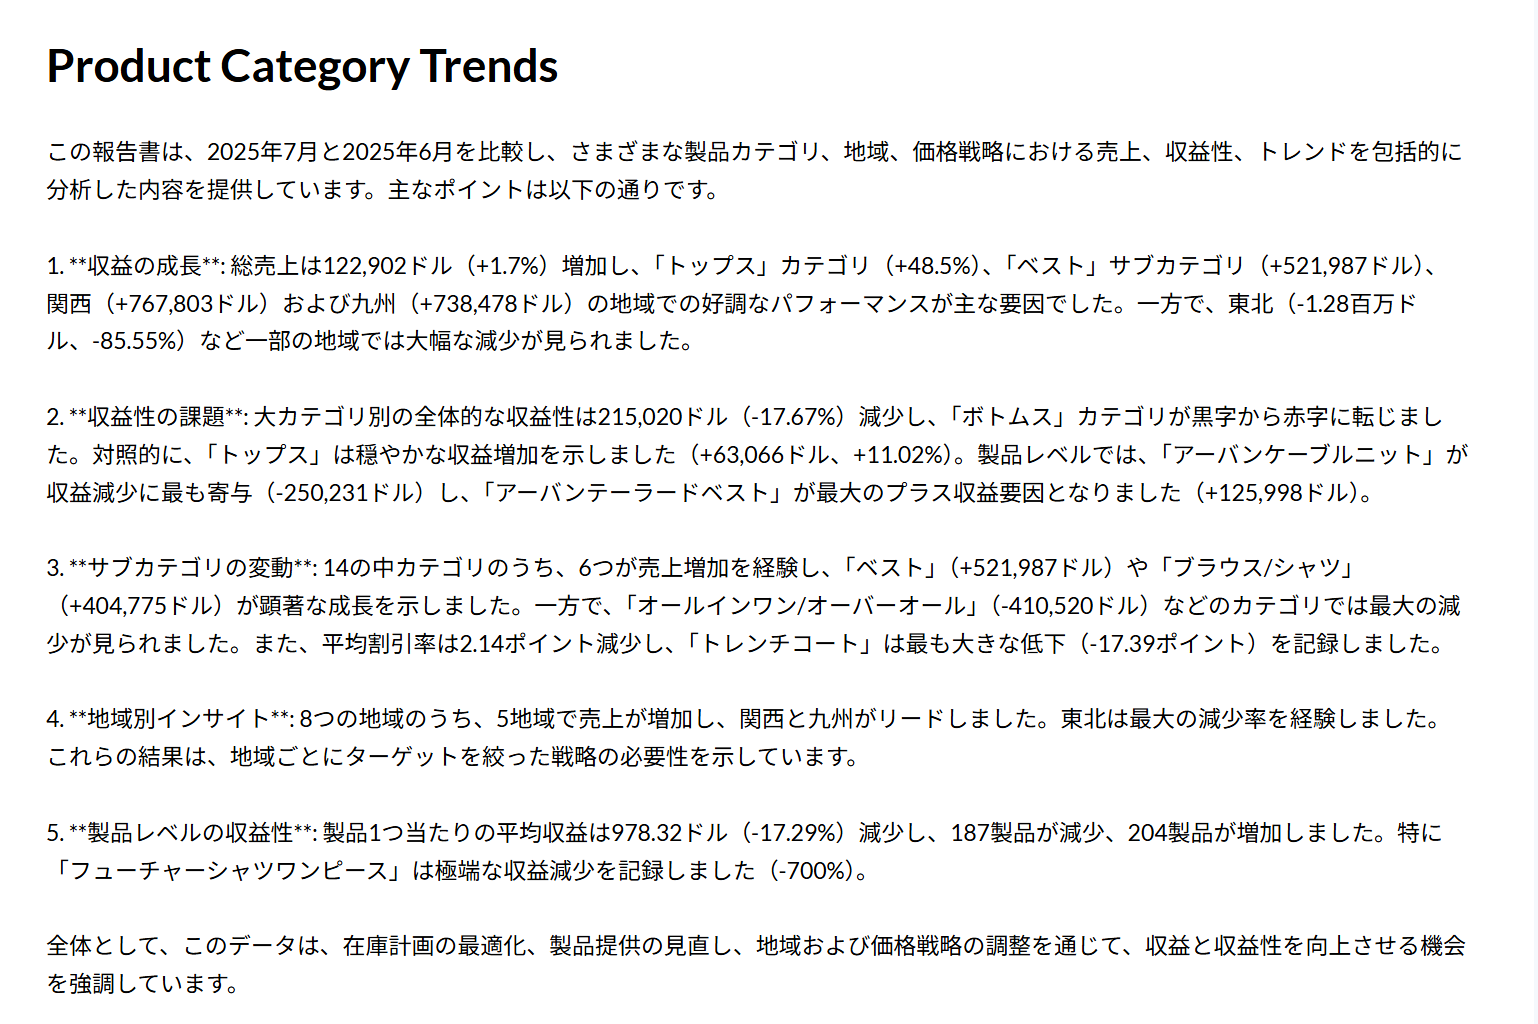
This allowed us to insert the previous summary in Japanese
In Conclusion
What do you think? I felt that the Auto Insights feature's ability to automatically generate reports, combined with the ability to customize it yourself to some extent (unlike the Missions feature), is a major advantage.
You can also set up scheduled delivery, so please try it out!