
I Enabled SQL Statement Statistics for Amazon Aurora DSQL and Checked Them with Database Insights and PromQL

This page has been translated by machine translation. View original
Introduction
On November 17, 2026, SQL statement statistics for Aurora DSQL were announced.
This feature records the number of executions, duration, rows, and DPU for each SQL statement the cluster has executed, and outputs them as CloudWatch OpenTelemetry (OTel) metrics. This time, I enabled the feature on a running cluster (us-west-2), ran SQL against a test table, and checked the results with PromQL, Database Insights, and CloudWatch Logs.
Enabling and Applying
Configuration and Verification
The feature is enabled by specifying STATEMENT_STATISTICS in --metric-groups of update-cluster.
aws dsql update-cluster --identifier <クラスターID> --metric-groups '[{"metricGroup":"STATEMENT_STATISTICS"}]' --region us-west-2 --output json
{
    "status": "UPDATING"
}
You can verify the setting with metricGroups in get-cluster.
aws dsql get-cluster --identifier <クラスターID> --region us-west-2 --query '{status:status,metricGroups:metricGroups}' --output json
{
    "status": "ACTIVE",
    "metricGroups": [
        {
            "metricGroup": "STATEMENT_STATISTICS"
        }
    ]
}
Time Until It Takes Effect
A few minutes after the setting, the log group /aws/dsql/normalized-sql-text, where normalized SQL text is written, was created, and writes to it were confirmed at the same time. Because I ran SQL right after the setting, the creation and the writing happened at the same timing.
Retrieving Statistics
The tables and screens below show only the test statements whose table names contain stmtstat_.
I loaded 9,000 rows into the test table stmtstat_orders. Because there is an upper limit on the number of rows that can be handled in one transaction, I split it into three batches of 3,000 rows.
Creating the test table (01-setup.sql)
CREATE TABLE stmtstat_orders (id bigint PRIMARY KEY, customer_id int NOT NULL, status text NOT NULL, amount int NOT NULL);
INSERT INTO stmtstat_orders SELECT g, (g % 1000) + 1, CASE WHEN g % 10 = 0 THEN 'cancelled' ELSE 'paid' END, (g * 7) % 5000 FROM generate_series(1, 3000) AS g;
INSERT INTO stmtstat_orders SELECT g, (g % 1000) + 1, CASE WHEN g % 10 = 0 THEN 'cancelled' ELSE 'paid' END, (g * 7) % 5000 FROM generate_series(3001, 6000) AS g;
INSERT INTO stmtstat_orders SELECT g, (g % 1000) + 1, CASE WHEN g % 10 = 0 THEN 'cancelled' ELSE 'paid' END, (g * 7) % 5000 FROM generate_series(6001, 9000) AS g;
SELECT count(*) FROM stmtstat_orders;
PromQL
The PromQL query I used for retrieval is as follows. The value of each data point of a metric is the increment from the previous data point. Instead of rate(), I add up the values within the time range with sum_over_time(), then aggregate by query ID with sum by.
topk(100, sum by ("db.query.id") (sum_over_time({"aws.dsql.query.calls", "@resource.aws.dsql.cluster_id"="<クラスターID>"}[1h])))
By replacing aws.dsql.query.calls in the query above, you can retrieve each of the 10 metrics that start with aws.dsql.query..
The following table joins the results of each metric by query ID and lines them up with the normalized SQL text. It shows 7 of the 10 metrics. Each value is the total for the last hour.
| Normalized SQL | calls | time (s) | rows | scanned_rows | compute_dpu | read_dpu | write_dpu |
|---|---|---|---|---|---|---|---|
| SELECT count(*) FROM stmtstat_orders WHERE customer_id = $0 | 22 | 0.222186 | 22 | 198161 | 0.200141 | 11.8401 | 0 |
| SELECT * FROM stmtstat_orders WHERE id = $0 | 10 | 0.009784 | 10 | 10 | 0.008134 | 0.00234 | 0 |
| UPDATE stmtstat_orders SET amount = amount + $0 WHERE id = $1 | 5 | 0.009116 | 5 | 5 | 0.008783 | 0.004218 | 0.03125 |
| INSERT INTO stmtstat_orders SELECT g, ... | 3 | 0.115042 | 9000 | 15 | 0.114245 | 2.11671 | 56.25 |
| DELETE FROM stmtstat_orders WHERE id = $0 | 3 | 0.004036 | 3 | 3 | 0.003895 | 0.001404 | 0.01875 |
The 22 SELECT statements with customer_id varied from 1 to 22 were grouped into a single query ID, including two statements that differ only in comments or whitespace. The statements I ran are as follows.
SELECT count(*) FROM stmtstat_orders WHERE customer_id = 1;
SELECT count(*) FROM stmtstat_orders WHERE customer_id = 2;
-- customer_id = 3 to 20 have the same form
/* batch-job */ SELECT count(*)   FROM stmtstat_orders WHERE customer_id = 21;
SELECT count(*) FROM stmtstat_orders WHERE customer_id = 22; -- trailing comment
Script to run PromQL (promql-calls.sh)
PromQL can be run not only from Query Studio in the console but also from the HTTP API with signed requests. The following script uses awscurl and runs the query with the metric name as the first argument, the cluster ID as the second argument, and the time range as the third argument (1h if omitted).
#!/usr/bin/env bash
# usage: promql-calls.sh <metric> <cluster-id> [range]  Example: promql-calls.sh aws.dsql.query.calls $CL 1h
set -euo pipefail
M="$1"; CL="$2"; RANGE="${3:-1h}"
Q="topk(100, sum by (\"db.query.id\") (sum_over_time({\"${M}\", \"@resource.aws.dsql.cluster_id\"=\"${CL}\"}[${RANGE}])))"
ENC="$(python3 -c 'import sys,urllib.parse;print("query="+urllib.parse.quote(sys.argv[1]))' "$Q")"
awscurl --service monitoring --region us-west-2 --profile "${AWS_PROFILE:-default}" \
  -X POST 'https://monitoring.us-west-2.amazonaws.com/api/v1/query' \
  -H 'Content-Type: application/x-www-form-urlencoded' \
  -d "$ENC"
Database Insights
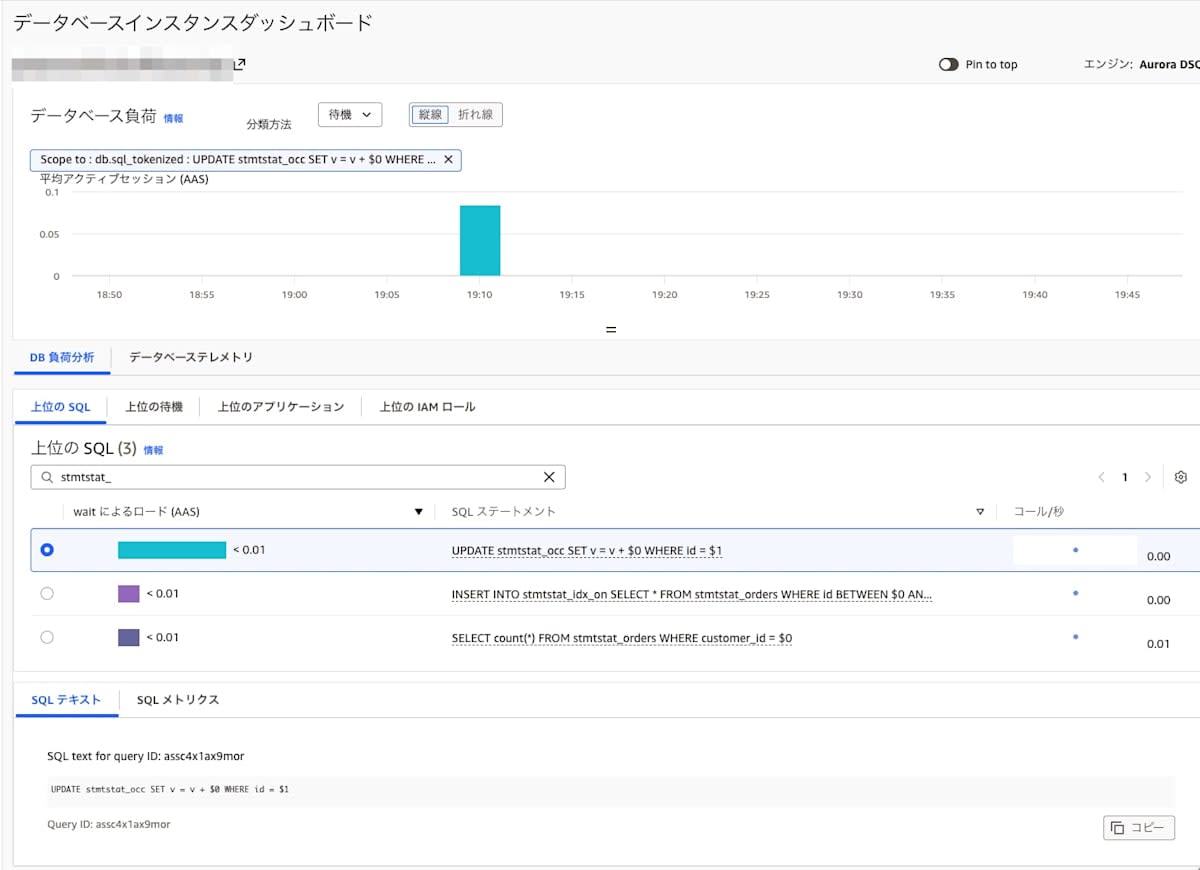
Open the cluster in Database Insights in the CloudWatch console and enter stmtstat_ in the Top SQL search box to narrow down to the test statements. When I selected a statement, the SQL text and Query ID were displayed at the bottom.
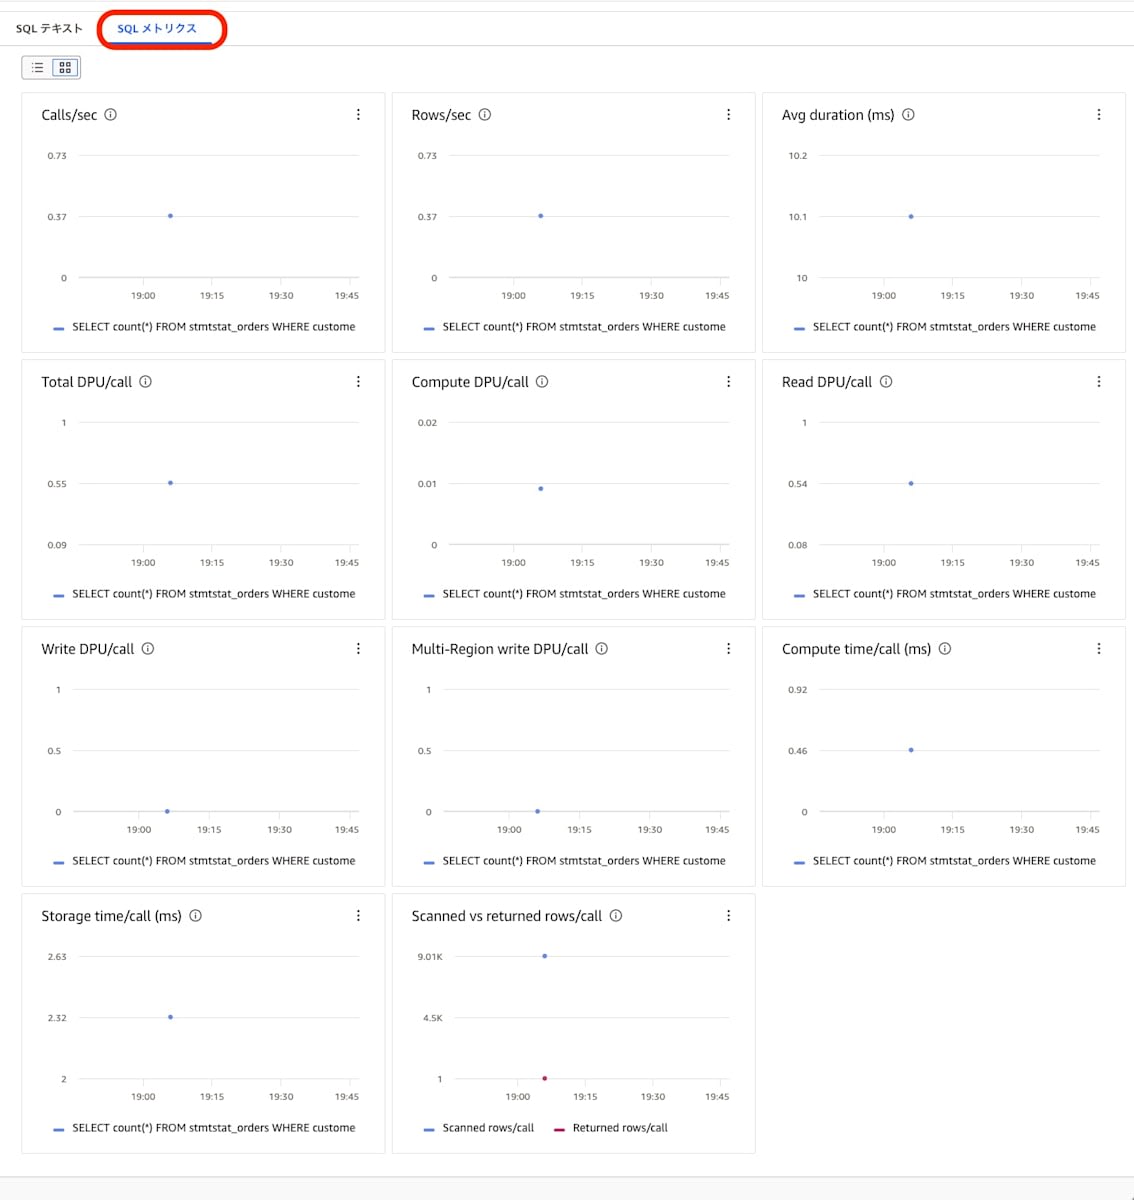
The SQL metrics tab shows 11 charts for the selected statement.
CloudWatch Logs
In the PromQL results, statements are indicated only by query ID. The normalized SQL corresponding to a query ID can be retrieved by searching the log group /aws/dsql/normalized-sql-text with Logs Insights.
fields @timestamp, queryId, normalizedText | filter queryId = '<query ID>' | dedup queryId
For the time range, start 3 hours before the start time of the period you want to investigate. This is because the normalized SQL of a statement that continues to be executed is written again at least every 3 hours. Each log entry is JSON containing queryId, clusterId, and normalizedText.
Scanned Rows and Indexes
I created two tables (stmtstat_idx_off and stmtstat_idx_on) that have the same 9,000 rows as stmtstat_orders. The index was created only on the customer_id column of stmtstat_idx_on.
I created the index on the empty table and loaded the 9,000 rows afterward. Because CREATE INDEX ASYNC creates the index asynchronously, I confirmed completion with the following query before running the searches.
SELECT * FROM sys.jobs ORDER BY 1 DESC LIMIT 3;
For the searches, I ran SELECT count(*) FROM <table name> WHERE customer_id = N against each table 20 times, varying N from 1 to 20. In addition, I ran the search for customer_id = 5 once more with EXPLAIN ANALYZE. The calls for each table is 21.
Creating comparison tables and loading data
CREATE TABLE stmtstat_idx_off (id bigint PRIMARY KEY, customer_id int NOT NULL, status text NOT NULL, amount int NOT NULL);
CREATE TABLE stmtstat_idx_on  (id bigint PRIMARY KEY, customer_id int NOT NULL, status text NOT NULL, amount int NOT NULL);
CREATE INDEX ASYNC stmtstat_idx_on_cust ON stmtstat_idx_on (customer_id);
INSERT INTO stmtstat_idx_off SELECT * FROM stmtstat_orders WHERE id BETWEEN 1 AND 3000;
INSERT INTO stmtstat_idx_off SELECT * FROM stmtstat_orders WHERE id BETWEEN 3001 AND 6000;
INSERT INTO stmtstat_idx_off SELECT * FROM stmtstat_orders WHERE id BETWEEN 6001 AND 9000;
INSERT INTO stmtstat_idx_on SELECT * FROM stmtstat_orders WHERE id BETWEEN 1 AND 3000;
INSERT INTO stmtstat_idx_on SELECT * FROM stmtstat_orders WHERE id BETWEEN 3001 AND 6000;
INSERT INTO stmtstat_idx_on SELECT * FROM stmtstat_orders WHERE id BETWEEN 6001 AND 9000;
| Without index | With index | |
|---|---|---|
| calls | 21 | 21 |
| time total (s) | 0.194082 | 0.028278 |
| scanned_rows total | 189002 | 200 |
| scanned_rows ÷ calls | approx. 9,000.1 | approx. 9.52 |
| read_dpu total | 11.2489 | 0.01871 |
I confirmed that on the table with the index, the totals of both scanned_rows and time decreased compared with the table without it.
Recorded Targets
Recorded Statements
SELECT, INSERT, UPDATE, and DELETE were recorded.
Statements Not Recorded
The following statements appeared in neither the PromQL results nor the normalized SQL text log.
- BEGIN and COMMIT
- CREATE TABLE, CREATE INDEX ASYNC, DROP TABLE
- SHOW application_name
- A SELECT that resulted in an error by referencing a nonexistent column
Summary
SQL statement statistics for Aurora DSQL are enabled by specifying STATEMENT_STATISTICS with update-cluster.
You can identify SQL statements with a large impact in terms of duration, number of executions, and DPU, which helps you find targets for improving SQL and indexes.
Standard CloudWatch metric charges and log charges apply to statement statistics, and there are no additional Aurora DSQL charges. Please give it a try.