I quickly created a reusable QGIS plugin for work using Claude Code and QGIS MCP

This page has been translated by machine translation. View original
Recently, I tried using Claude Code and QGIS MCP to operate QGIS with natural language without writing PyQGIS.
After trying it out, one-off map operations were comfortable. However, in actual work, the same tasks are repeated every time. You go around the site, record the condition at each point, and finally submit an inspection report with a map as a PDF. Having to give the same natural language instructions every time for this entire workflow is, in itself, a hassle.
For this kind of "repetitive work," it seems best to solidify it as a QGIS plugin. If you can prepare a recording layer, input inspection points, and output reports with a single button click, you no longer need to assemble the same steps every time.
That said, writing a plugin from scratch yourself has a high barrier. So this time, I'll try a development approach where I have Claude Code write the plugin implementation itself, and verify operation while reloading with QGIS MCP.
Conclusion First
- I was able to create a QGIS plugin that performs "field survey recording → PDF report output with map" by having Claude Code write the code
- Since the
reload_pluginin QGIS MCP (nkarasiak/qgis-mcp) can hot-reload plugins, I was able to quickly cycle through "fix code → reload → verify operation" without restarting QGIS - Once you've made it a plugin, recording and report output are complete with just button operations from the next time onward. The more you repeat a task in business, the greater the benefit of turning it into a plugin
- On the other hand, the UI layout and PDF formatting didn't come together in one shot, and it was necessary to go back and forth with adjustment instructions after actually running it
What We're Building This Time
What we're building is a QGIS plugin for field survey and inspection work. It will have the following features.
- Inspection layer generation: One-touch generation of an inspection point layer with a defined schema (
name/status/comment/photo/inspected_at) from a toolbar button - Inspection point recording: Add inspection points by clicking on the map, and input facility name, status, comment, and photo via a dialog. Clicking on an existing point allows editing or deletion
- Photo embedding: Register photos via drag & drop, and keep them within the project
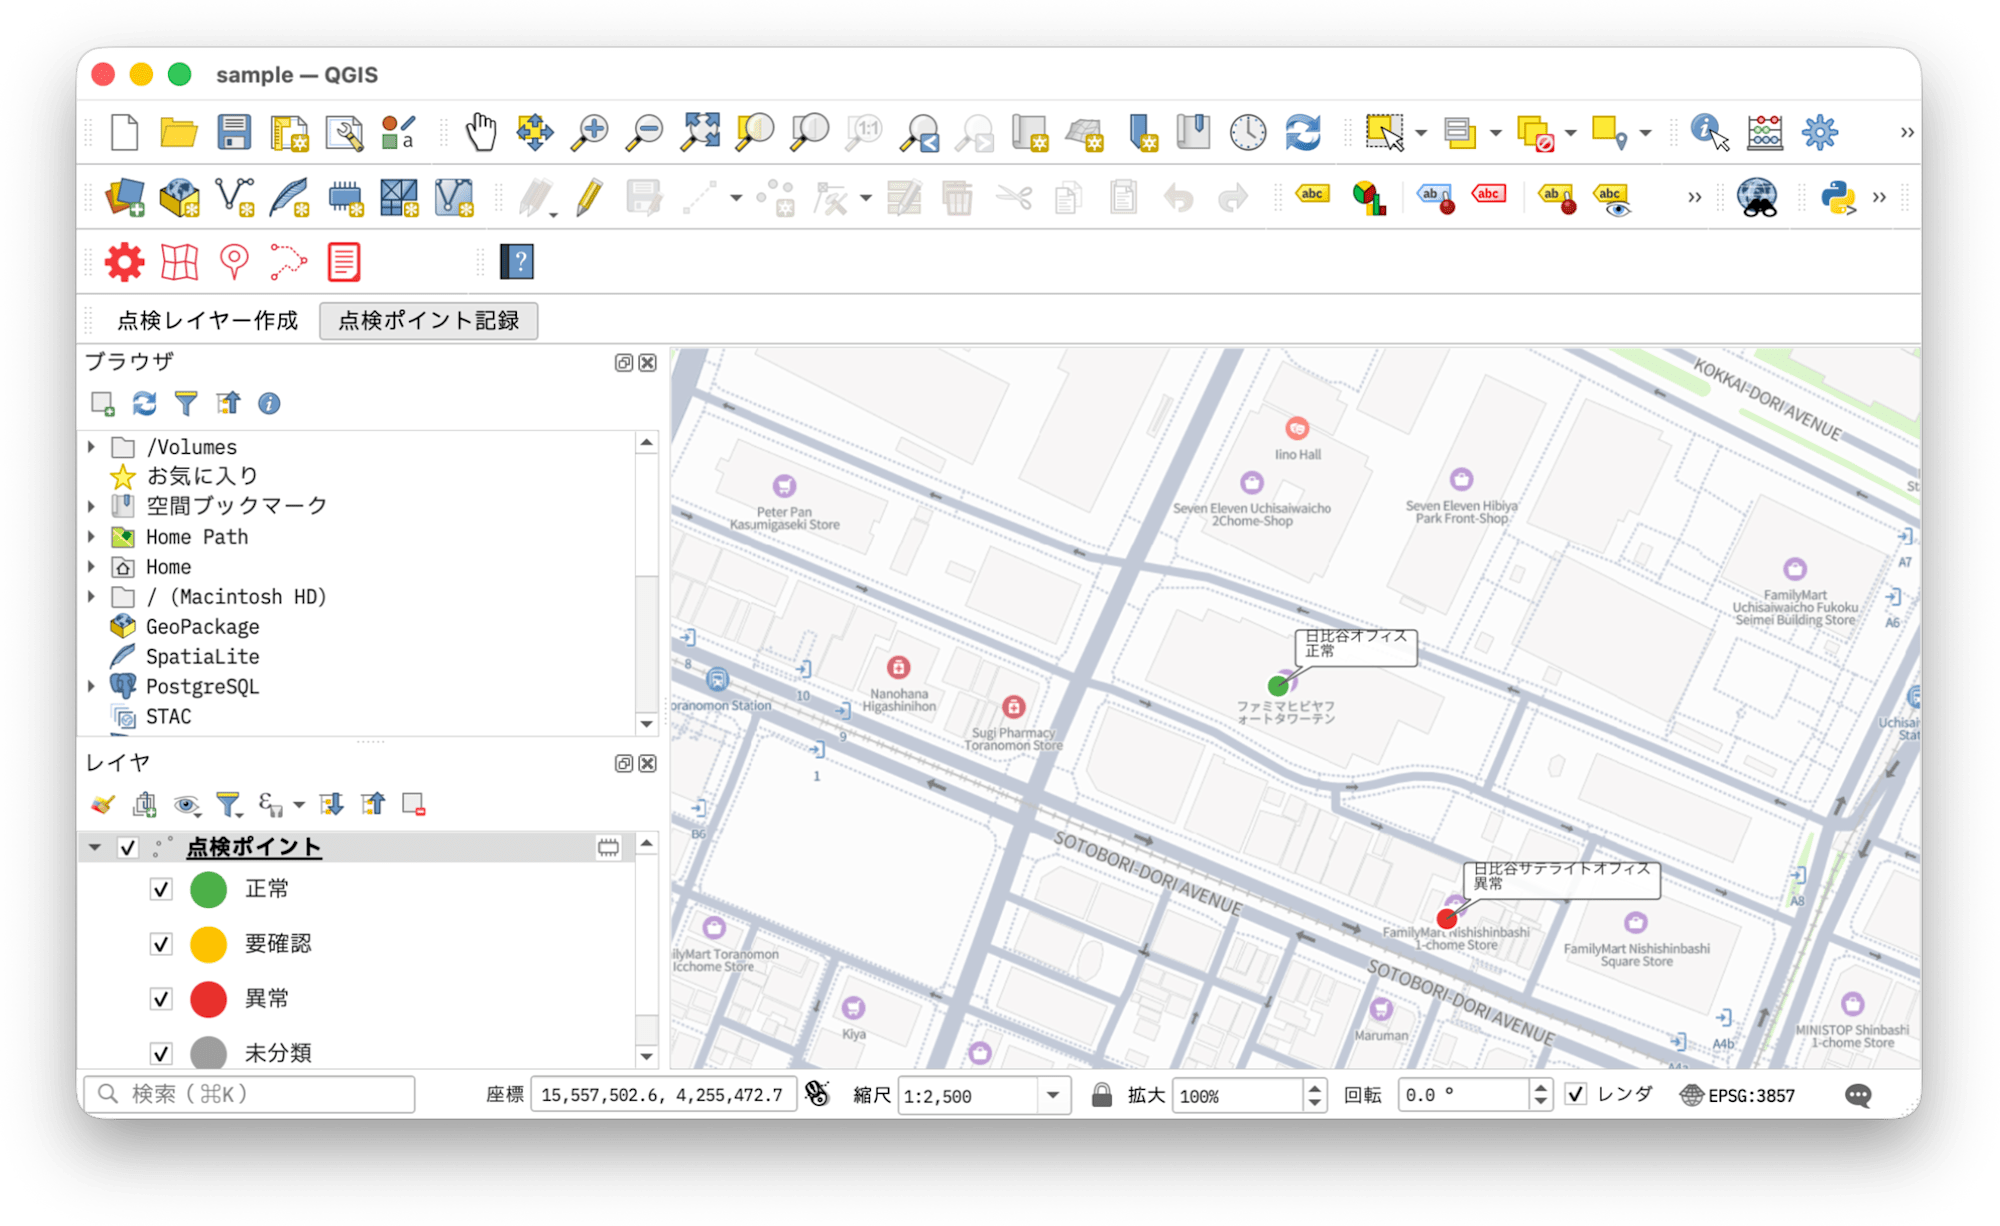
- Status color-coding: Automatic color-coded display based on inspection status (Normal / Needs Review / Abnormal)
- PDF report output: Export inspection results with a defined layout to PDF, including map + legend + photo list
The complete sample code is published on GitHub.
Prerequisites
- macOS
- QGIS 3.28 or higher installed (verified with QGIS 3.44)
- uv installed (used to launch the QGIS MCP server with
uvx) - Claude Code + QGIS MCP (
nkarasiak/qgis-mcp) set up and ping communication confirmed - Amazon Location Service API key configured (used for background map)
For the background map, we'll use Amazon Location Service. It provides commercially usable map data as a managed service with a clear pricing structure, making it suitable for business use as a background map. Since the plugin we're creating this time doesn't add a background map, we'll add it to the project in advance from the Amazon Location Service plugin's "Map," just as in the previous article.
Please refer to this article for obtaining an Amazon Location Service API key and setting up the plugin.
If you're starting with a new project directory, please note the following two points.
- Simply placing
.mcp.jsonwill not load the MCP server. Restart Claude Code after configuration - Enable
qgis_mcp_pluginon the QGIS side and start the server. If this is not done, all tools includingreload_pluginwill fail to communicate
Why QGIS MCP Works for Plugin Development
The nkarasiak/qgis-mcp we're using this time comes with 118 MCP tools.
The key point this time is that among these, tools that assist plugin development are included.
| Tool | Purpose |
|---|---|
list_plugins |
Get a list of installed plugins |
get_plugin_info |
Get status and information of a specific plugin |
reload_plugin |
Hot-reload a plugin (no QGIS restart required) |
execute_code |
Execute arbitrary PyQGIS code within QGIS (for operation verification) |
Normally, you would install the Plugin Reloader plugin and manually reload the modified QGIS plugin, but with reload_plugin, Claude Code can fix the code itself, reload it, and verify operation with execute_code all in one go.
QGIS only loads plugins from under the plugins directory, but developing directly there takes it out of Git management. Create the plugin directory on the repository side and set up a symbolic link from the plugins directory. All subsequent edits are made to files on the repository side, and QGIS reads them via the link.
mkdir -p ~/<<YOUR_DIRECTORY>>/qgis-plugin-sample/qgis_inspection_report
ln -s ~/<<YOUR_DIRECTORY>>/qgis-plugin-sample/qgis_inspection_report \
  ~/Library/Application\ Support/QGIS/QGIS3/profiles/default/python/plugins/qgis_inspection_report
The development loop with this structure looks like the following diagram.
However, 118 tool definitions alone can put pressure on the context. Specifying QGIS_MCP_TOOL_MODE=compound in the env of .mcp.json consolidates the tools by function, reducing them to 27.
"env": {
  "QGIS_MCP_TOOL_MODE": "compound"
}
The tools used in plugin development are plugins (equivalent to list_plugins / get_plugin_info / reload_plugin) and code (equivalent to execute_code), both of which work as-is in compound mode. This is recommended for plugin development, which tends to involve long sessions.
Review of the Minimal QGIS Plugin Structure
A QGIS plugin can be established with a minimum of these 2 files.
qgis_inspection_report/
├── metadata.txt   # Plugin metadata (name, version, supported QGIS version, etc.)
└── __init__.py    # Entry point with classFactory()
The folder name becomes the Python module name as-is. This is also the name passed to reload_plugin.
metadata.txt has 8 items listed as required in the official documentation (PyQGIS Developer Cookbook). Since they are also needed when publishing to the official plugin repository, it's good to have them all from the start.
# ※ Only required items are shown here
[general]
name=Inspection Report
qgisMinimumVersion=3.28
description=A plugin that records inspection points from field surveys and outputs PDF reports with maps
about=Performs inspection point layer generation, inspection recording by clicking on the map, status color-coding, and PDF report output via print layouts.
version=0.1.0
author=rednes
email=528249+rednes@users.noreply.github.com
repository=https://github.com/rednes/qgis-plugin-sample
The classFactory() in __init__.py returns the main plugin class. The main class implements initGui() (registering menus and toolbars) and unload() (cleanup).
- Reference: wonder-sk/qgis-minimal-plugin
Since this time we have many features, I had Claude Code write the main code in main_plugin.py, the dialog UI in dialogs.py, and the report output in report.py.
Step 1: Have Claude Code Create the Plugin Skeleton
First, have Claude Code create a "working empty plugin." It's just a skeleton with one button in the toolbar.
> I want to create a QGIS plugin. Please create a skeleton that just works first.
The plugin name is "Inspection Report" and it supports QGIS 3.28 and above.
Just put one button in the QGIS toolbar, and when pressed, display a message saying
"Inspection Report" — that's all that's needed.
The destination is qgis_inspection_report directly under the repository,
and I'll leave the necessary file structure up to you.
Just by conveying what you want to do, the plugin conventions — metadata.txt required items, classFactory() definition, toolbar registration in initGui(), and cleanup in unload() — are filled in without any specific instructions. The generated code was as follows.
from qgis.PyQt.QtWidgets import QAction, QMessageBox

def classFactory(iface):
    return InspectionReportPlugin(iface)

class InspectionReportPlugin:
    def __init__(self, iface):
        self.iface = iface

    def initGui(self):
        self.action = QAction("Inspection Report", self.iface.mainWindow())
        self.action.triggered.connect(self.run)
        self.iface.addToolBarIcon(self.action)

    def unload(self):
        self.iface.removeToolBarIcon(self.action)
        del self.action

    def run(self):
        QMessageBox.information(None, "Inspection Report", "Inspection Report")
Enabling it in QGIS's plugin manager displays a button in the toolbar. From here, we add features while reloading with reload_plugin.
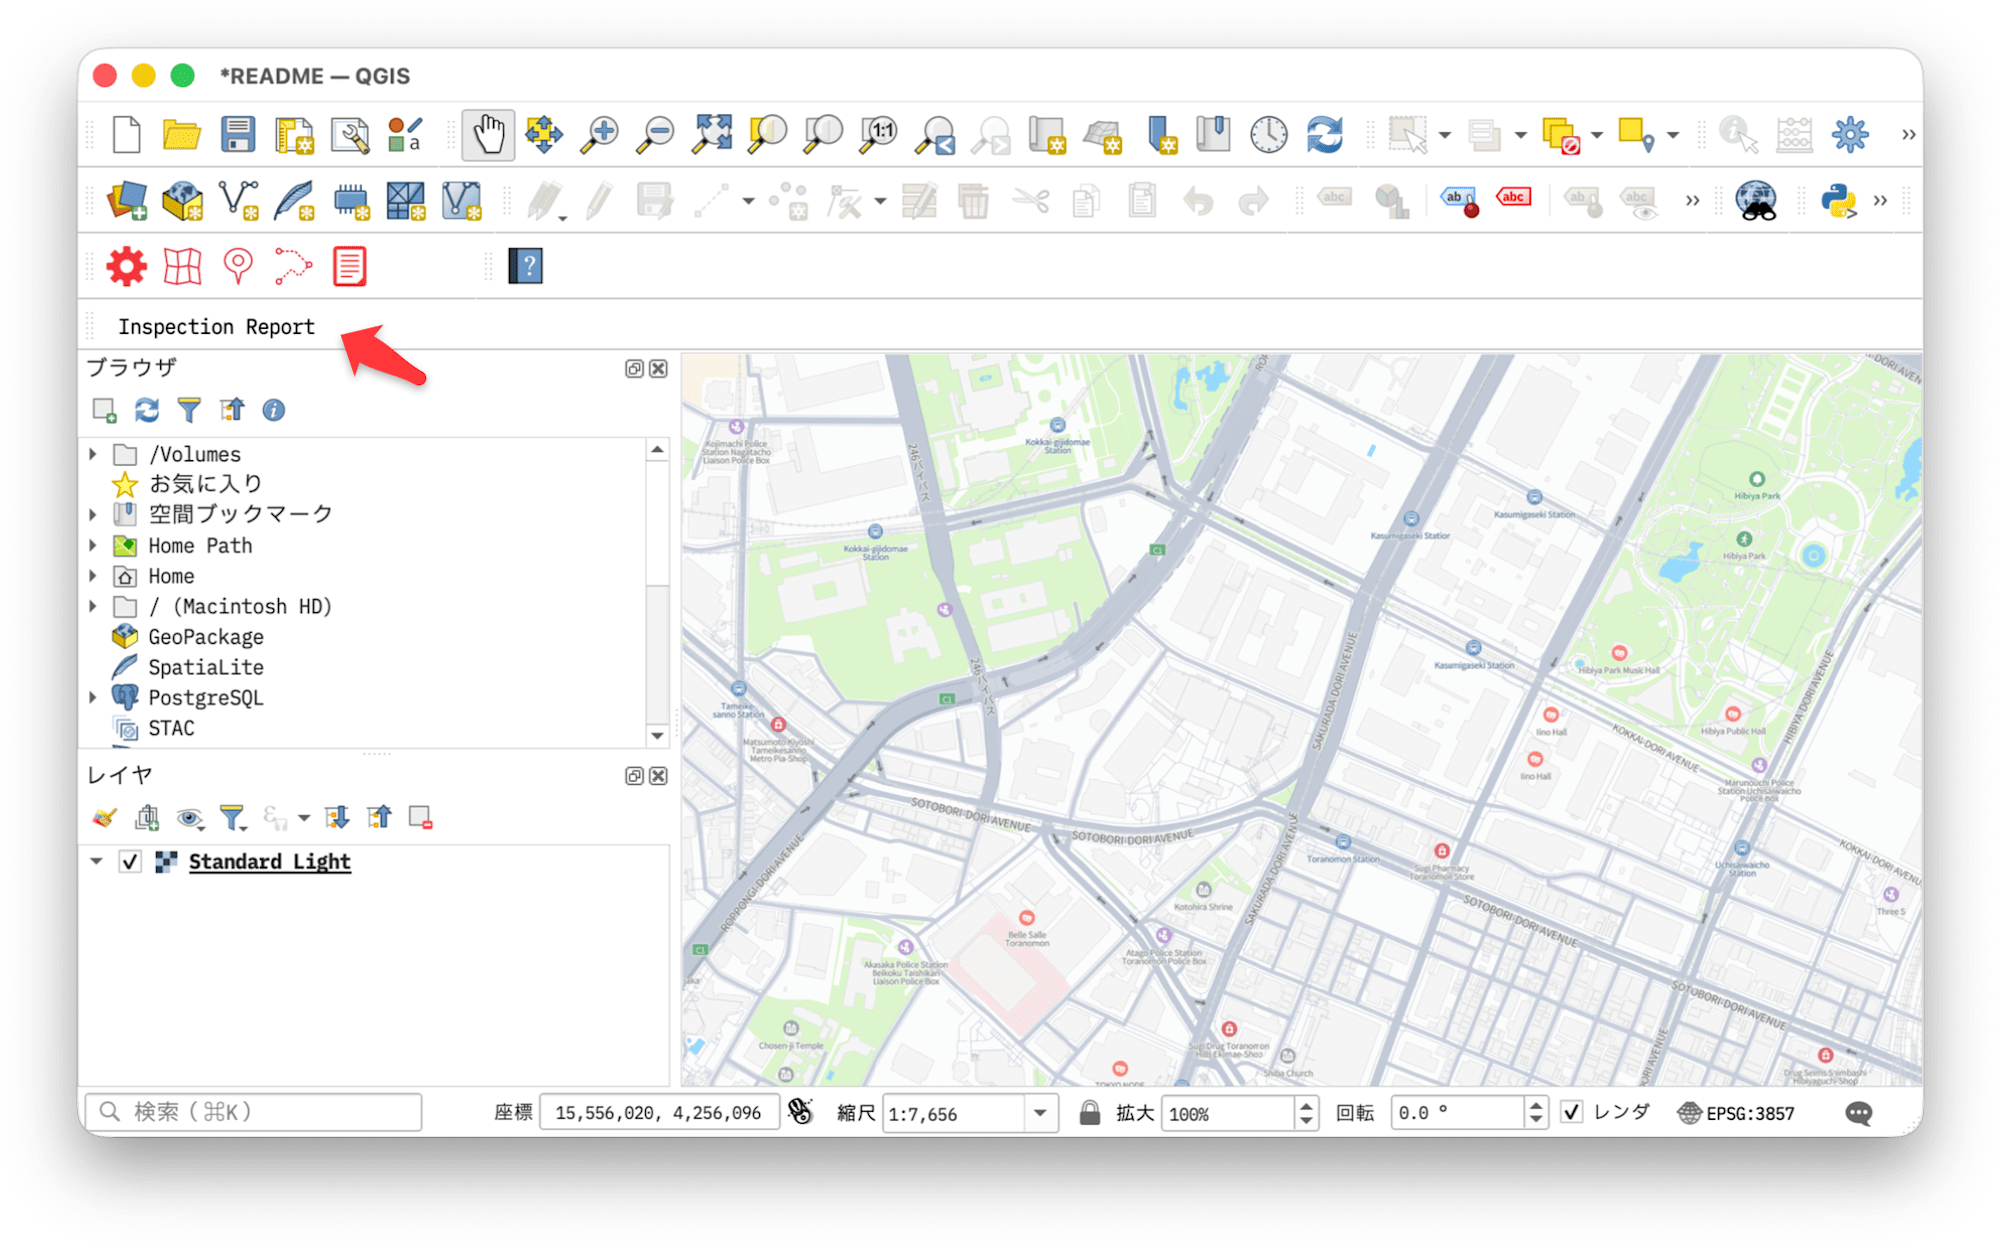
Step 2: Enable Recording of Inspection Points
We change the single skeleton button into two: "Create Inspection Layer" and "Record Inspection Point." Since entering, viewing, correcting, and deleting are all part of the same workflow, we'll build the recording features together.
> Please add a feature to create an inspection layer and a feature to record
inspection points to this plugin.
Replace the skeleton button with two buttons: "Create Inspection Layer" and
"Record Inspection Point."
"Create Inspection Layer" creates a layer for inspection points that can record
facility name, status, comment, photo, and inspection datetime.
Record in latitude/longitude, and it's fine to be a temporary layer held within
the QGIS project without saving to a file.
After pressing "Record Inspection Point," clicking on the map should allow
recording an inspection point. If an existing point is at the clicked location,
edit its content; otherwise add a new one.
Only show a delete button in the dialog when editing.
Once fixed, reload with reload_plugin and verify operation.
From this instruction, Claude Code assembled it as a memory layer with EPSG:4326 attributes name / status / comment / photo / inspected_at. Claude Code appends the code, reloads with reload_plugin, and verifies operation. If something doesn't work, it investigates the state with get_plugin_info or execute_code and fixes it itself. The point where "you can reload and verify without restarting QGIS" works well here, making the fix cycle run fast.
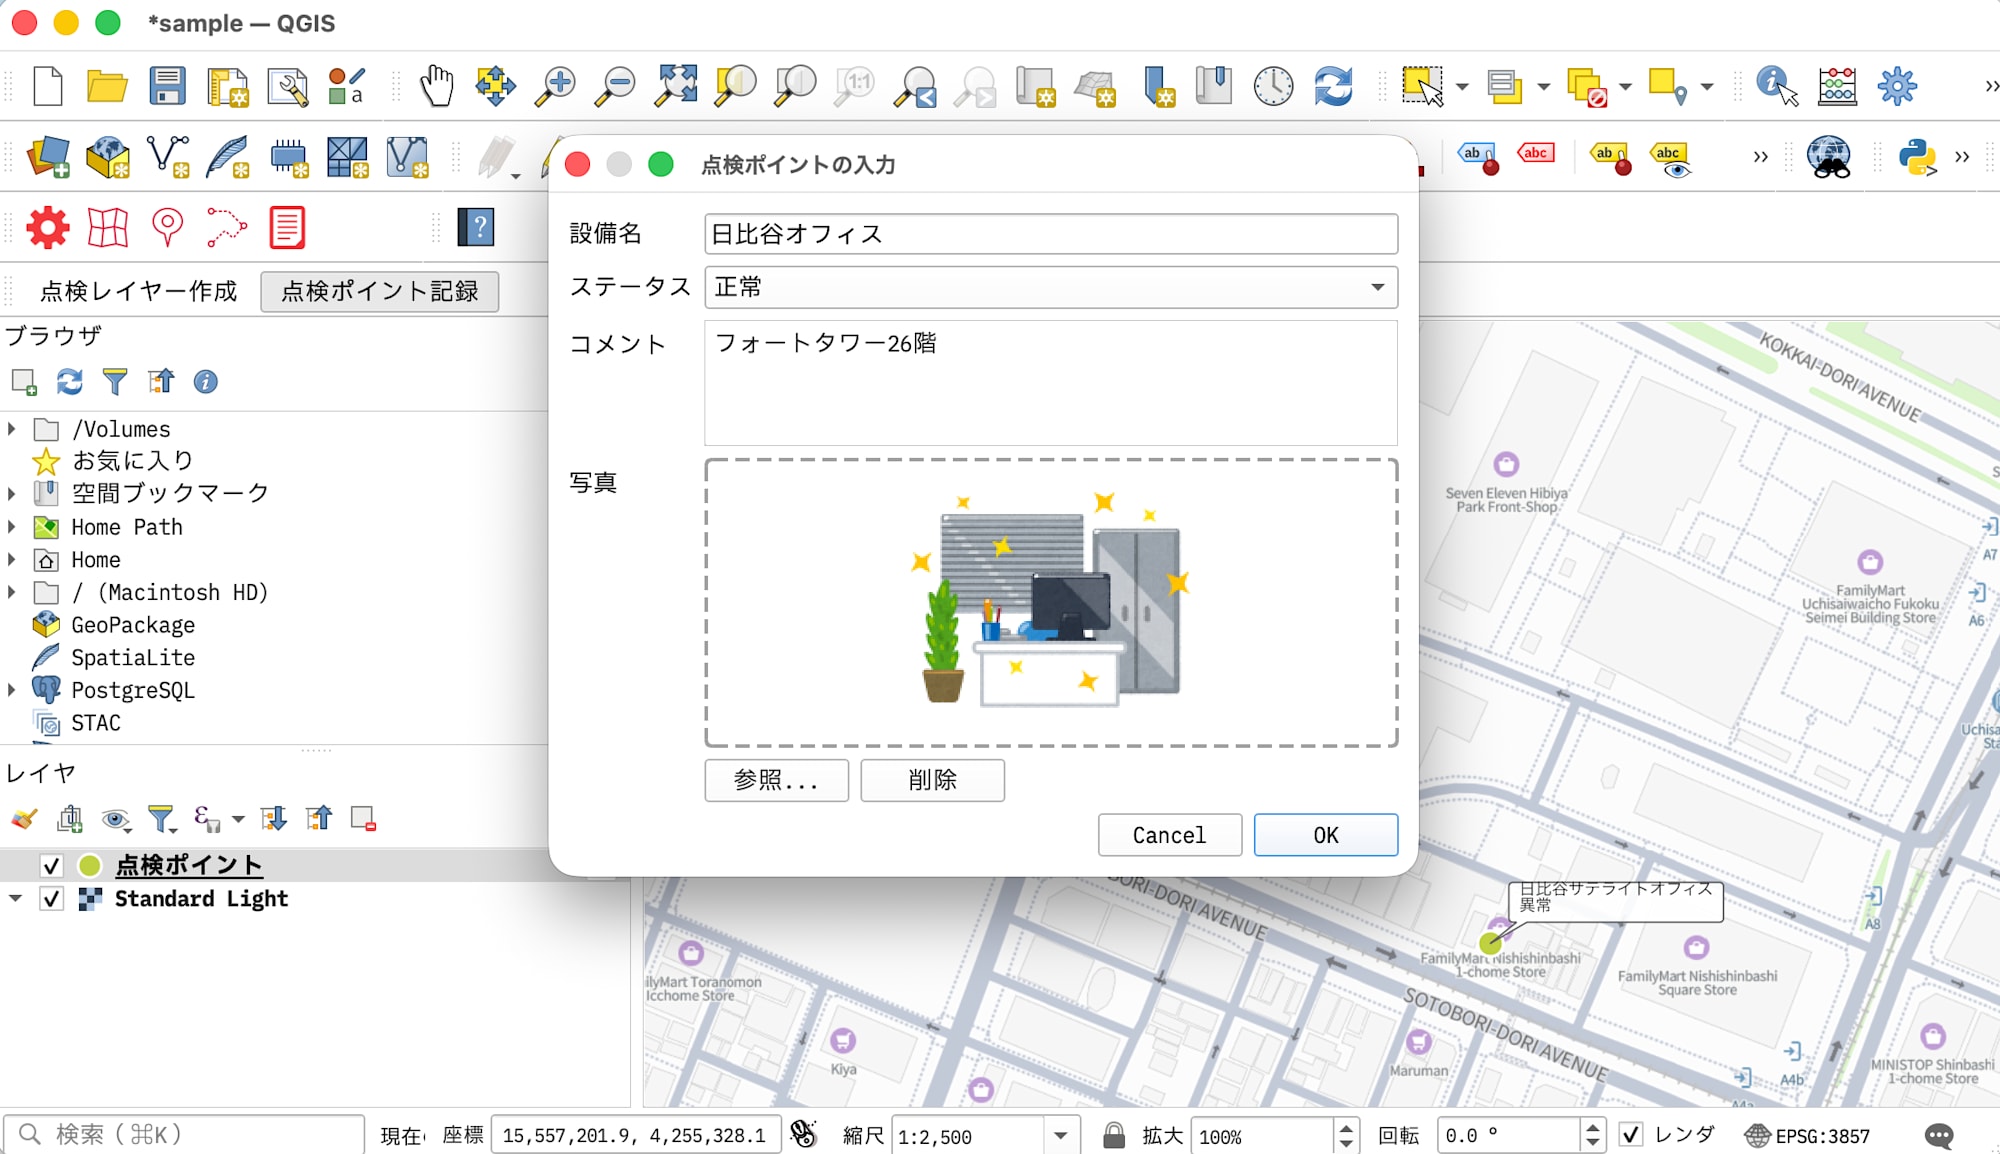
The following were decided through back-and-forth:
- Combining add and edit into one tool: Rather than having separate buttons, branch based on whether an existing point is at the clicked location. This lets you handle both "entering" and "correcting" with the same operation
- Making hit detection pixel-based: Search for features within a tolerance rectangle centered on the click position, then select the nearest one within the radius by actual distance. Fixing the tolerance at 12px means the feel of operation doesn't change even when the scale changes
- Keeping the inspection layer to one: If a new layer is created every time "Create Inspection Layer" is pressed, the recording destination and report output target become ambiguous. If an inspection layer already exists, just make it active, preventing duplicate creation
- Making delete a third return value in the dialog: Place a "Delete" button in
QDialogButtonBoxwithDestructiveRole, pass a custom return value todone()after inserting a confirmation step. This lets you handle the three-way branch of OK / Cancel / Delete using only the return value ofexec_()
Add and edit branching (abbreviated version)
# ※ This is an abbreviated version highlighting key points
HIT_TOLERANCE_PX = 12  # Radius for treating a click position as "on top of an existing point"

def record_point(self, canvas_point):
    """If on top of an existing point, edit; otherwise add."""
    layer = self.inspection_layer()
    point = self._to_layer_crs(layer, canvas_point)
    feature = self._feature_at(layer, point, canvas_point)
    if feature is None:
        self._add_point(layer, point)
    else:
        self._edit_point(layer, feature)

def _feature_at(self, layer, point, canvas_point):
    """Returns the nearest point within tolerance of the click position."""
    tolerance = self._tolerance_in_layer_units(layer, point, canvas_point)

    rect = QgsRectangle(
        point.x() - tolerance, point.y() - tolerance,
        point.x() + tolerance, point.y() + tolerance,
    )
    nearest, nearest_distance = None, None
    for feature in layer.getFeatures(rect):
        distance = feature.geometry().asPoint().distance(point)
        # The corners of the rectangle are farther than the radius, so also filter by actual distance
        if distance > tolerance:
            continue
        if nearest_distance is None or distance < nearest_distance:
            nearest, nearest_distance = feature, distance
    return nearest

def _tolerance_in_layer_units(self, layer, point, canvas_point):
    """Converts the tolerance radius (pixels) to layer CRS distance near the click position."""
    # The scale in canvas CRS can vary by position, so measure at the click position, not the origin
    to_map = self.iface.mapCanvas().getCoordinateTransform()
    pixel = to_map.transform(canvas_point)
    tolerance = 0.0
    for dx, dy in ((HIT_TOLERANCE_PX, 0), (0, HIT_TOLERANCE_PX)):
        edge = self._to_layer_crs(
            layer, to_map.toMapCoordinates(pixel.x() + dx, pixel.y() + dy)
        )
        tolerance = max(tolerance, edge.distance(point))
    return tolerance
Embedding Photos in the Project
If photos are stored as local paths in attributes, the display breaks as soon as the original file is moved or deleted. If you hand the project file to a colleague, the photos won't go with it.
So we use a method where photos are reduced to 320px, converted to a PNG base64 data URI (data:image/png;base64,...), and embedded as the attribute value itself. Map tips and HTML frames in reports are rendered by the browser engine (Qt WebKit), so you can write the data URI directly to <img src> and display it without depending on the QGIS version.
Note that from QGIS 3.40 onward, QGIS itself can interpret data URIs as image paths, and the same attribute value can be used with raster markers and image items in layouts as well.
> Instead of storing the file path in the photo attribute, please convert it to
a PNG base64 data URI scaled down to 320px and embed it as the attribute value.
Place a dotted-border drop area in the input dialog so photos can be registered
via drag & drop of image files.
When editing, display the existing photo as a preview in that area.
The drop area handles not only file URLs (mimeData().hasUrls()) but also cases where an image itself is dropped from another application (mimeData().hasImage()). Previewing the existing photo when editing prevents accidents where you replace an image without knowing what it is.
In exchange, approximately 110KB per photo is added to the attribute value. The fact that the project file grows as the number of points increases is something that needs to be accounted for in operations.
Converting a photo to a data URI (abbreviated version)
# ※ This is an abbreviated version highlighting key points
THUMBNAIL_MAX_SIZE = 320
DATA_URI_PREFIX = "data:image/png;base64,"

def image_to_data_uri(image, max_size=THUMBNAIL_MAX_SIZE):
    """Scale down a QImage and convert it to a PNG base64 data URI."""
    if image.isNull():
        return ""

    thumbnail = image.scaled(
        max_size, max_size, Qt.KeepAspectRatio, Qt.SmoothTransformation
    )
    buffer_data = QByteArray()
    buffer = QBuffer(buffer_data)
    buffer.open(QIODevice.WriteOnly)
    thumbnail.save(buffer, "PNG")
    buffer.close()
    return DATA_URI_PREFIX + bytes(buffer_data.toBase64()).decode("ascii")

def file_to_data_uri(path, max_size=THUMBNAIL_MAX_SIZE):
    """Load an image file and convert it to a data URI (returns empty string if unreadable)."""
    return image_to_data_uri(QImage(path), max_size)
Checking Contents on the Map
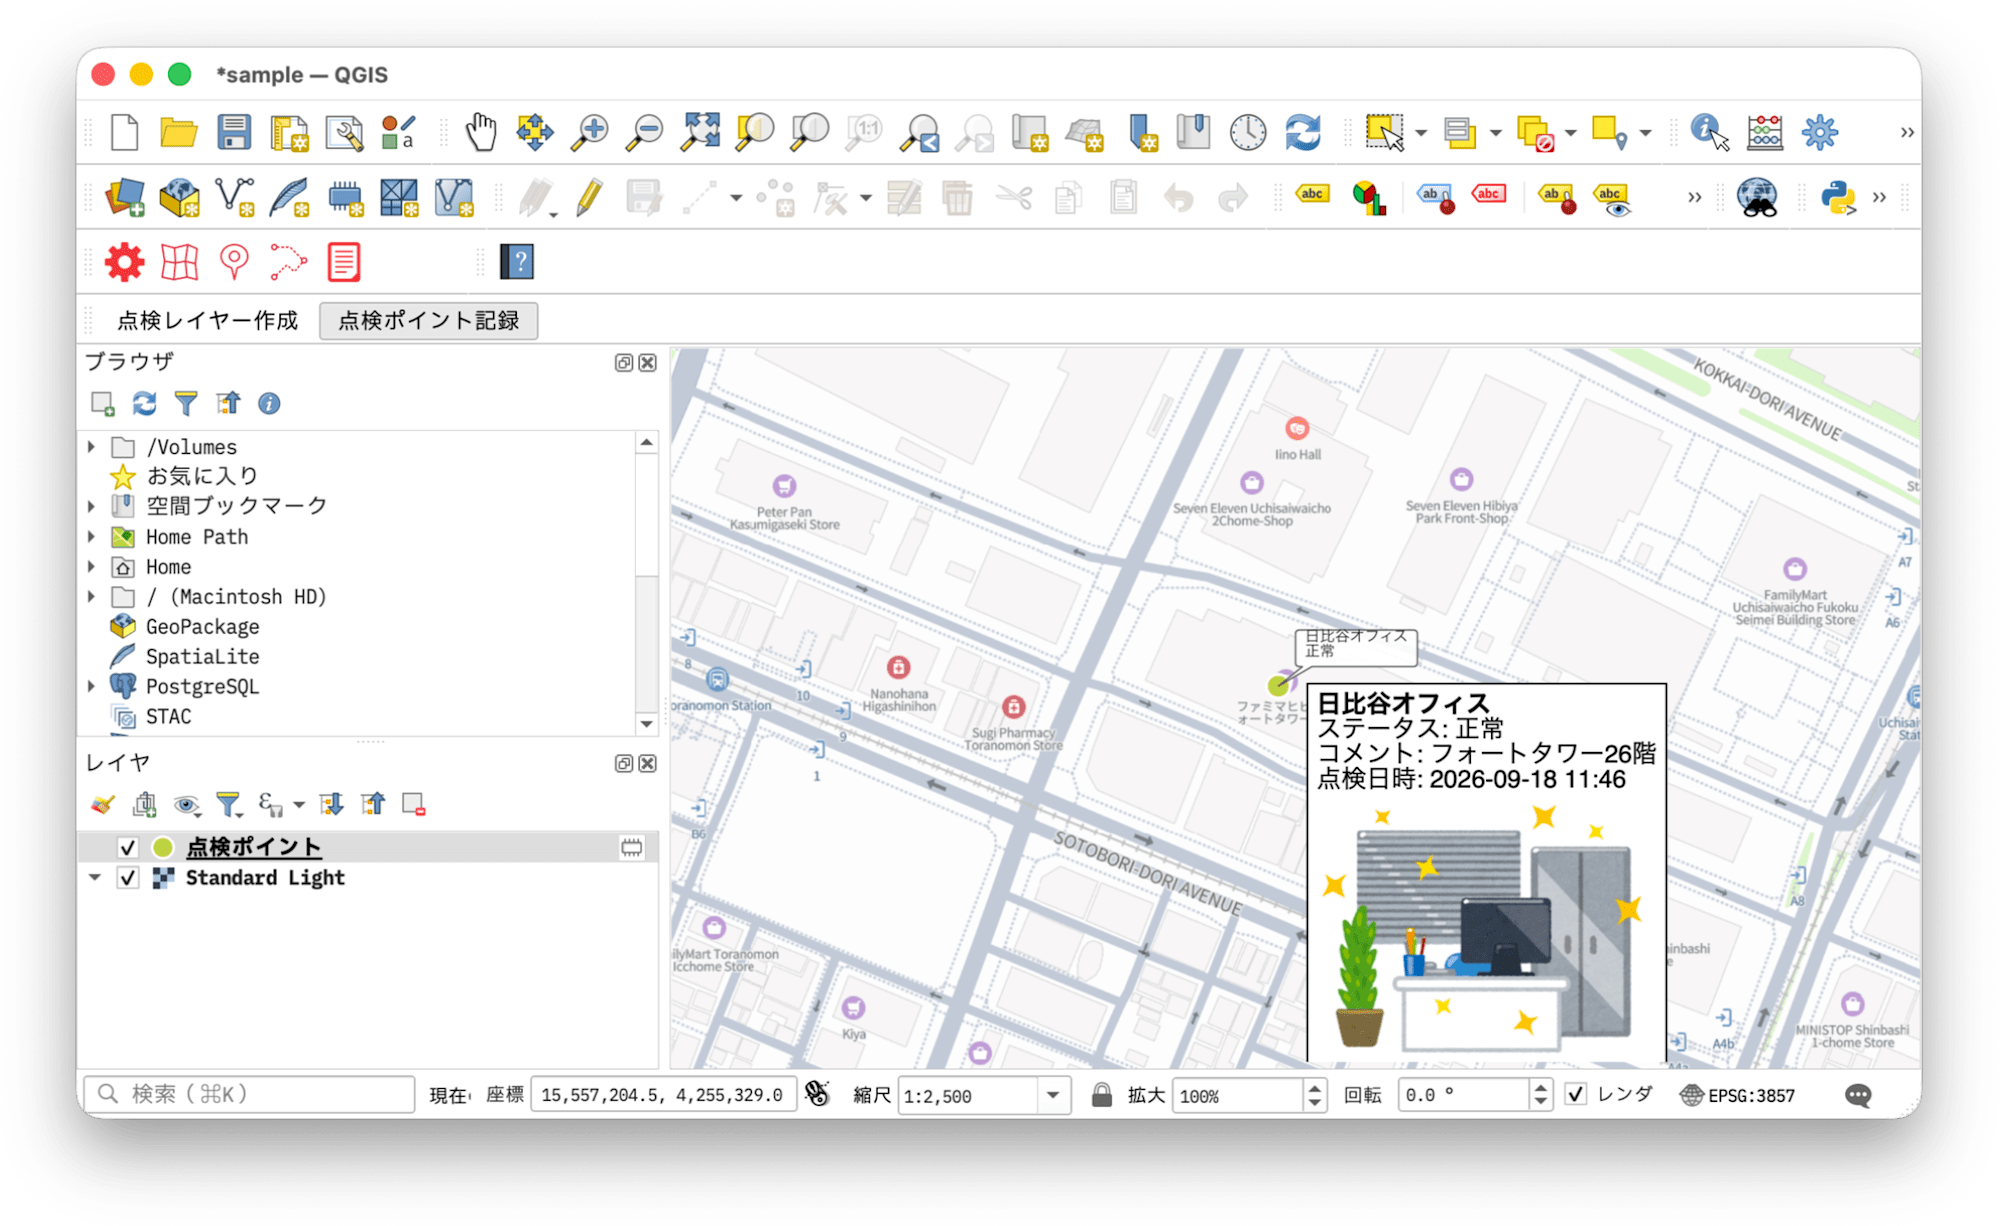
If you can't check the recorded content on the map, it will be inconvenient to use. We'll build in two things when generating the layer: map tips and callout labels.
Map tips are popups that appear when you hover over a feature. Simply pass HTML to setMapTipTemplate() to display facility name, status, comment, inspection datetime, and photo. Since the photo is an embedded data URI, you can write <img src="[% "photo" %]"/>. However, it only displays for the active layer, and won't appear if no map tool is set.
Callout labels are labels that constantly display the facility name and status on the map. Pass QgsBalloonCallout to QgsPalLayerSettings.setCallout(), set placement to AroundPoint, and set dist to about 8mm to separate it from the point so that the leader line is visible. When points are densely clustered, they are thinned out due to collisions, so scale-based show/hide is needed when there are many points.
Step 3: Incorporate Status Color-Coding
Color-code the recorded inspection statuses so they can be identified at a glance on the map. Have the classic color scheme of Normal=Green, Needs Review=Yellow, Abnormal=Red automatically applied when the layer is generated.
> Please automatically apply a classified symbol based on status to the
inspection layer.
"Normal" is green, "Needs Review" is yellow, and "Abnormal" is red.
By setting up a classified symbol (categorized renderer) on the plugin side, colors corresponding to the status are automatically applied each time a point is added. Abnormal locations stand out in red on the map, making priorities intuitively clear.
Since the color scheme is referenced in three places — the input dialog choices, the map color-coding, and the report — keeping the definition in a single module prevents inconsistencies.
Step 4: Add a PDF Report Output Button
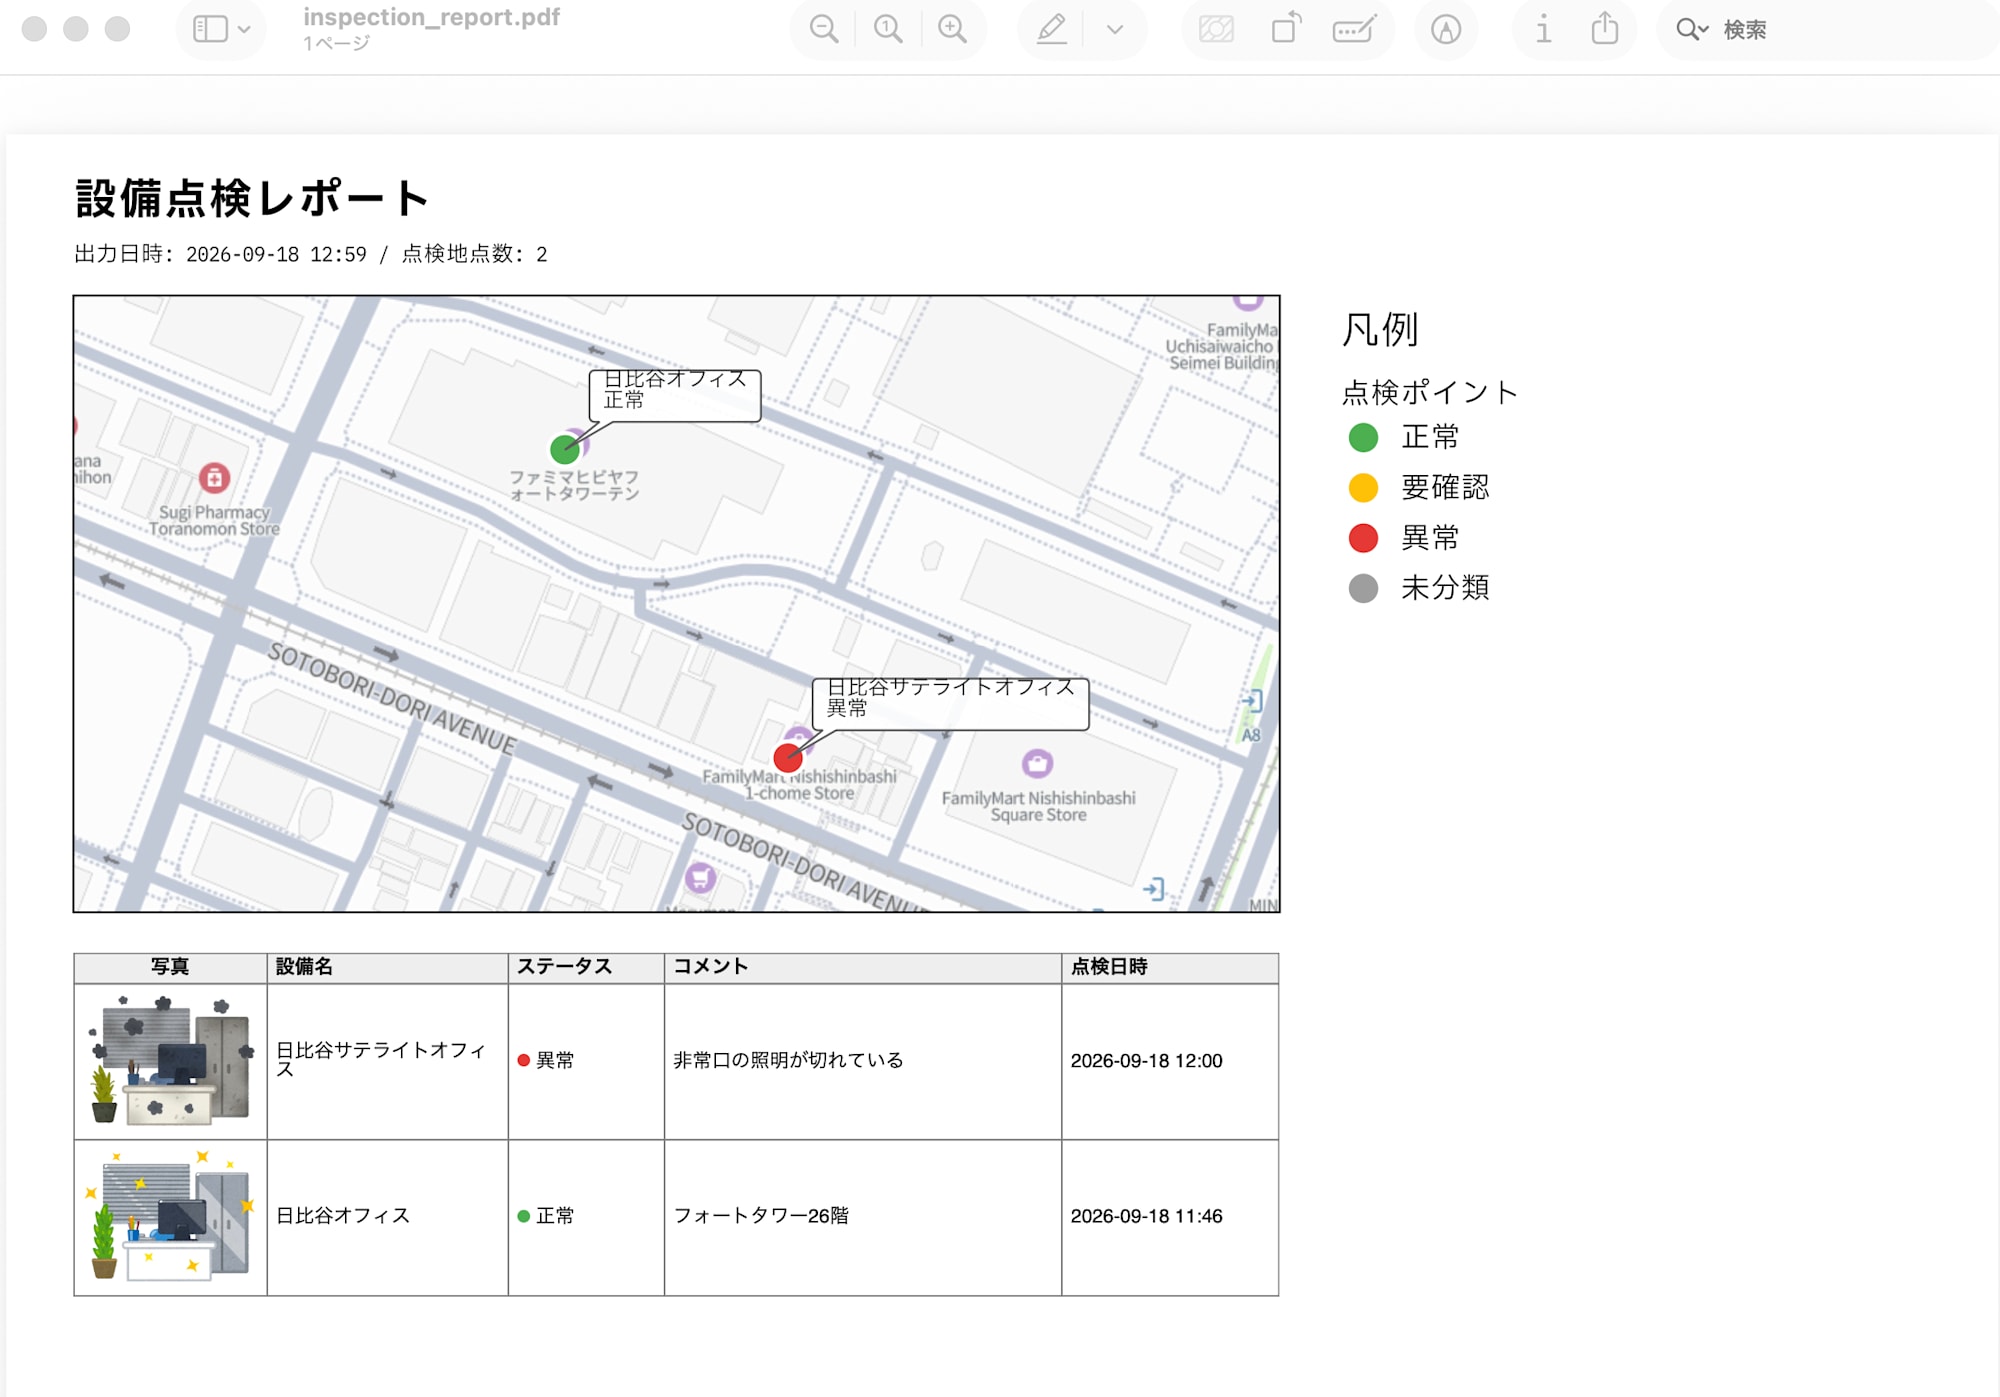
Finally, the main feature. When you press the "Output Report" button, it exports the inspection results compiled into a single page to PDF. The page will contain the following:
- Title (output datetime and number of inspection points)
- Map (inspection points color-coded by status + background map)
- Legend (meaning of status colors)
- Inspection results list table (photo, facility name, status, comment, inspection datetime)
For PDF output, we use QGIS's native Print Layout. This is a feature for arranging maps, legends, tables, and images on a single page and exporting to PDF, included in QGIS itself, so no external libraries are needed.
> Please add an "Output Report" button to this plugin.
When pressed, create an A4 landscape print layout, arrange the title, map,
legend, and inspection results list table, and export a PDF to the specified path.
Place the photo column on the left end of the list table, and sort locations
with abnormal/needs-review status to the top.
Photos are kept not just for abnormal cases, but also as evidence for normal cases. Therefore, all locations are listed regardless of whether they have a photo, and rows without a photo display "No photo." The sort order puts abnormal and needs-review at the top, with a maximum of 20 rows to fit on a single A4 landscape page.
Using QgsLayoutItemHtml in ManualHtml mode and building an HTML table manually allows the photo column on the left and each row to align at the same height. Since the attribute data URI can be written directly to <img src="...">, no processing to expand temporary files is needed.
PDF report output excerpt (abbreviated version)
# ※ This is an abbreviated version highlighting key points (element coordinates/sizes require adjustment)
def build(self):
    self.layout = QgsPrintLayout(self.project)
    self.layout.initializeDefaults()
    self.layout.pageCollection().page(0).setPageSize(
        "A4", QgsLayoutItemPage.Landscape
    )

    self._add_title()
    self._add_map()
    self._add_legend()
    self._add_table()
    return self.layout

def _add_table(self):
    # Build with HTML instead of an attribute table, placing the photo column on the left
    table = QgsLayoutItemHtml.create(self.layout)
    self.layout.addMultiFrame(table)
    table.setContentMode(QgsLayoutItemHtml.ManualHtml)
    table.setHtml(self._build_html())
    table.loadHtml()

    # Allocate the area from below the map to the bottom edge of the page for the table
    table_y = MARGIN + 14 + MAP_HEIGHT + 6
    frame = QgsLayoutFrame(self.layout, table)
    frame.attemptSetSceneRect(
        QRectF(MARGIN, table_y, LEFT_WIDTH, PAGE_HEIGHT - table_y - MARGIN)
    )
    table.addFrame(frame)

def _build_row(self, feature):
    photo = feature["photo"]
    if is_embedded_photo(photo):
        # The attribute value is a data URI, so it can be placed directly in the img src
        photo_cell = '<td class="photo"><img src="%s"/></td>' % photo
    else:
        photo_cell = '<td class="photo empty">No photo</td>'
    ...
The page layout tended to have overlapping elements with a single instruction, and it took several back-and-forth adjustment instructions like "move the table below the map" and "move the legend to the right."
What I Learned
What Worked Well
- From plugin skeleton to feature additions could be left to Claude Code. Even without knowing the conventions for
metadata.txtorclassFactory, a working plugin can be created with just instructions - Hot-reloading via
reload_pluginis effective. The loop of "fix code → reload → verify withexecute_code" could be run at high speed without restarting QGIS - Repetitive tasks become button operations. Once turned into a plugin, recording and report output are complete with buttons from the next time onward. Unlike one-off natural language operations, it becomes an asset usable repeatedly in business operations
- PDF output uses QGIS's native print layout, so it's self-contained without additional libraries
What Was Difficult
- UI and PDF formatting don't come together in one shot. Dialog arrangement and layout margins and overlaps required going back and forth with "fix this here" instructions after actually running it
- The list table is capped at a number of rows that fit on one page. This time it's fixed at a maximum of 20 rows, so if there are more inspection points, multi-page splitting or output by area is needed. For business use, it's worth estimating the number of points handled per inspection in advance
- How photos are stored affects how the report is built. Storing as local paths breaks on distribution; embedding as data URIs bloats attribute values. Moreover, whether photos can be listed in a table depends on this choice. Deciding early reduces rework
Designing "What to Build" Is the Human's Job
Claude Code writes code, reloads it, and verifies operation, but designing the business requirements — "what attributes should be recorded" and "what should go in the report" — must be decided by humans. It's the same as what I wrote in my previous article, "the need to understand GIS doesn't go away," and this time too, the need to understand what is needed for the business doesn't go away.
Conversely, I got the sense that as long as the requirements can be articulated, the implementation from there can largely be left to Claude Code.
Notes
- Destructive tools (such as
execute_code/remove_layer/delete_features) are annotated withdestructive, and clients such as Claude Code will ask for permission before executing. There is also a double-confirmation mechanism on the server side, but this is disabled by default. When using it with a client that executes tools unattended, specifyQGIS_MCP_AUTO_CONFIRM=0to enable it - The socket is bound to localhost by default with no authentication. On a shared machine, you can set a shared secret with
QGIS_MCP_TOKEN - When distributing or publishing the plugin you've created, please include the correct license and author information in
metadata.txt
In Closing
As a follow-up to my previous QGIS MCP blog post, I tried creating a QGIS plugin that performs "field survey recording → PDF report output with map" by having Claude Code write the code.
Rather than giving one-off map operation instructions every time, solidifying repetitive tasks as a plugin means that from the next time onward, button operations alone suffice. And the development experience of having Claude Code grow that plugin itself while reloading with reload_plugin was quite comfortable. I feel that the impression that "plugin development has a high barrier" has eased considerably.
On the other hand, fine-tuning the UI and PDF formatting still involves back-and-forth with natural language alone. I felt that the practical division of labor is "have Claude Code create a draft all at once, and humans handle the finishing touches."
This time I used equipment inspection as an example, but the same plugin form can be applied to any work where you "record per location and create a list report," such as road damage, disaster damage situations, or store patrol checks. The more repetitive the work, the greater the benefit of turning it into a plugin. Please give it a try.
I hope this blog is helpful to someone.