I tried visualizing Claude Code's OTel logs in a CloudWatch dashboard
This page has been translated by machine translation. View original
Introduction
I'm kasama from the Data Business Division.
This time, I'd like to send Claude Code's OpenTelemetry (OTel) telemetry directly to CloudWatch Logs and visualize the team's usage with a CloudWatch dashboard. Since a dashboard that's just built tends to go unvisited, I'll also build a Skill that generates and posts a weekly Slack digest as a set.
Overview
Claude Code has built-in functionality to send metrics and logs via OpenTelemetry. Details are described in the Anthropic official documentation.
On the AWS side, CloudWatch natively provides an OTLP endpoint, and using Bearer Token authentication allows logs to be sent directly from workloads outside AWS without a collector.
The basic procedure for sending OTel logs from Claude Code / Cowork to CloudWatch Logs without a collector is explained in detail in the following article. This article builds on that configuration and adds Sanitizer Lambda for secret removal, dashboarding, and weekly Slack digest.
Combining these two, you can aggregate telemetry from each member's Claude Code to the team's AWS account without running an OTel Collector container or EC2 instance. The only additional resource is a single serverless Sanitizer Lambda.
Architecture
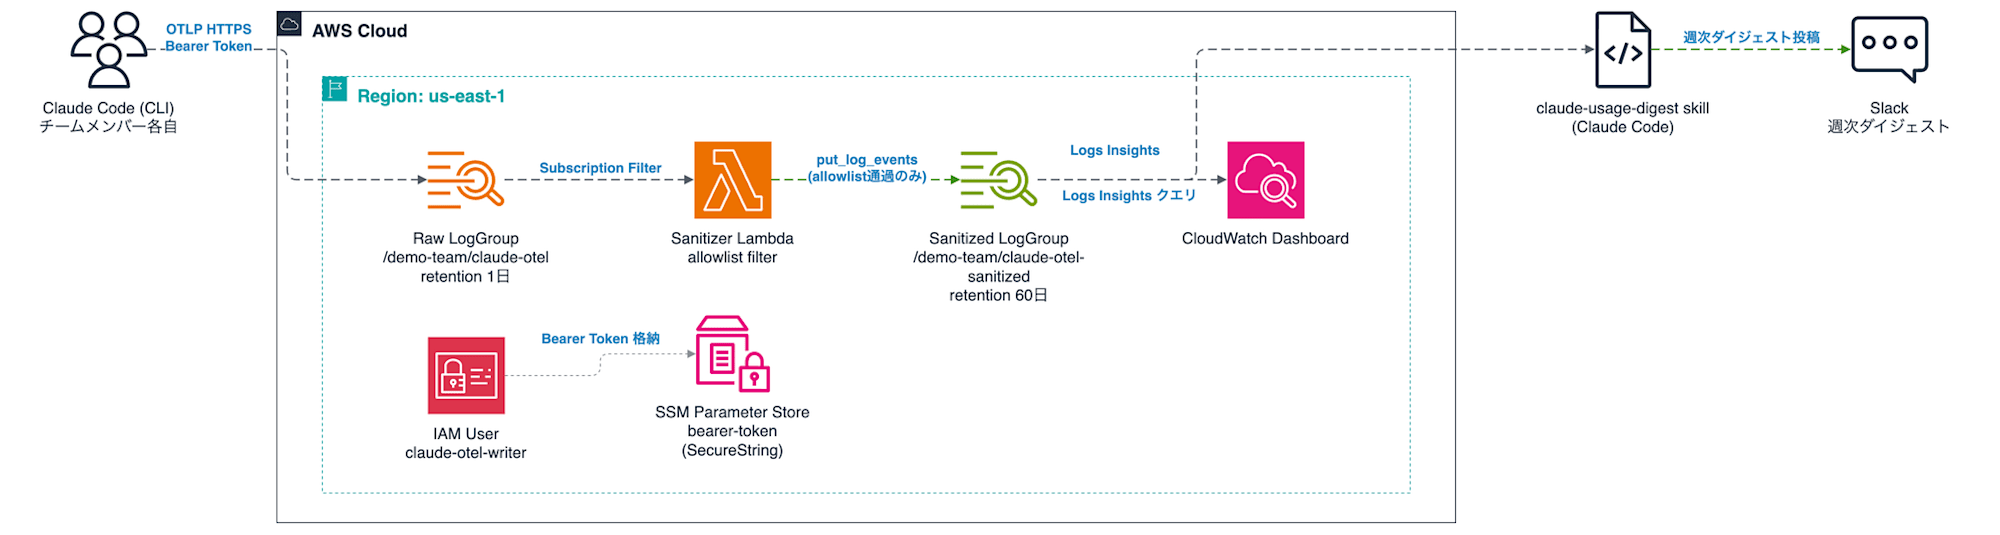
The processing flow is as follows.
- Each member's Claude Code sends logs directly to the CloudWatch Logs OTLP endpoint via OTLP HTTPS + Bearer Token
- Events arrive at the Raw LogGroup (1-day retention)
- The Sanitizer Lambda is triggered via Subscription Filter and discards sensitive fields using an allowlist approach
- Written back to the Sanitized LogGroup (60-day retention)
- The CloudWatch dashboard and weekly digest Skill reference only the Sanitized data
Why use a two-stage Raw and Sanitized structure
When OTEL_LOG_TOOL_DETAILS=1 is enabled in Claude Code's OTel logs, not only skill names but also Bash command contents and file paths are sent as tool details. Skill names are needed for per-skill usage aggregation, but command contents and paths may contain repository structure information that we don't want stored long-term in the team's shared account. Therefore, the Raw side is limited to 1-day retention, and the Lambda only passes allowed fields (cost, token count, model name, skill name, subagent type, MCP server name, etc.) to the Sanitized side. Prompt content is sent as <REDACTED> unless OTEL_LOG_USER_PROMPTS is configured.
Differences from existing verification methods
| Method | Target | Form |
|---|---|---|
| /usage command | Individual | In-session on-the-spot check |
| /insights command | Individual | Local HTML report |
| OTel + CloudWatch dashboard (this article) | Team | Continuous collection + dashboard + weekly Slack |
Built-in commands are sufficient for individual usage status, but to continuously monitor "who on the team is using which skills, subagents, and MCPs and how much," aggregation via OTel becomes necessary.
Constraints
- CloudWatch Logs OTLP endpoint Bearer Token authentication is limited to US regions (us-east-1, us-east-2, us-west-1, us-west-2). Since telemetry is stored in the United States, please verify in advance if you have data residency requirements
Prerequisites
- Claude Code is installed
- AWS CLI v2, SAM CLI, Python 3.13, and pytest are installed
- Authentication for the deployment target AWS account is configured (able to run with
aws ... --profile <your-profile>)
Implementation
The implementation code is stored on GitHub.
The project structure is as follows.
70_claude_code_otel_dashboard/
├── cfn/
│   └── claude-otel-logs.yml          # LogGroup, IAM User, dashboard
├── sam/
│   └── claude-otel-sanitizer/
│       ├── template.yaml             # Sanitizer Lambda + Subscription Filter
│       ├── samconfig.toml
│       ├── src/handler.py            # allowlist filter
│       └── tests/test_handler.py
└── .claude/skills/claude-usage-digest/   # Weekly Slack digest Skill
    ├── SKILL.md
    ├── references/
    ├── scripts/queries.txt           # Logs Insights query collection
    └── templates/digest-template.txt
CloudFormation
claude-otel-logs.yml defines the two LogGroups (Raw / Sanitized), a write-only IAM User, and the dashboard. The IAM User's permissions are limited to only logs:CallWithBearerToken and PutLogEvents / CreateLogStream on the Raw LogGroup, so even if a Bearer Token is leaked, nothing can be done other than writing.
The dashboard is composed of Logs Insights queries to the Sanitized LogGroup and includes the following widgets.
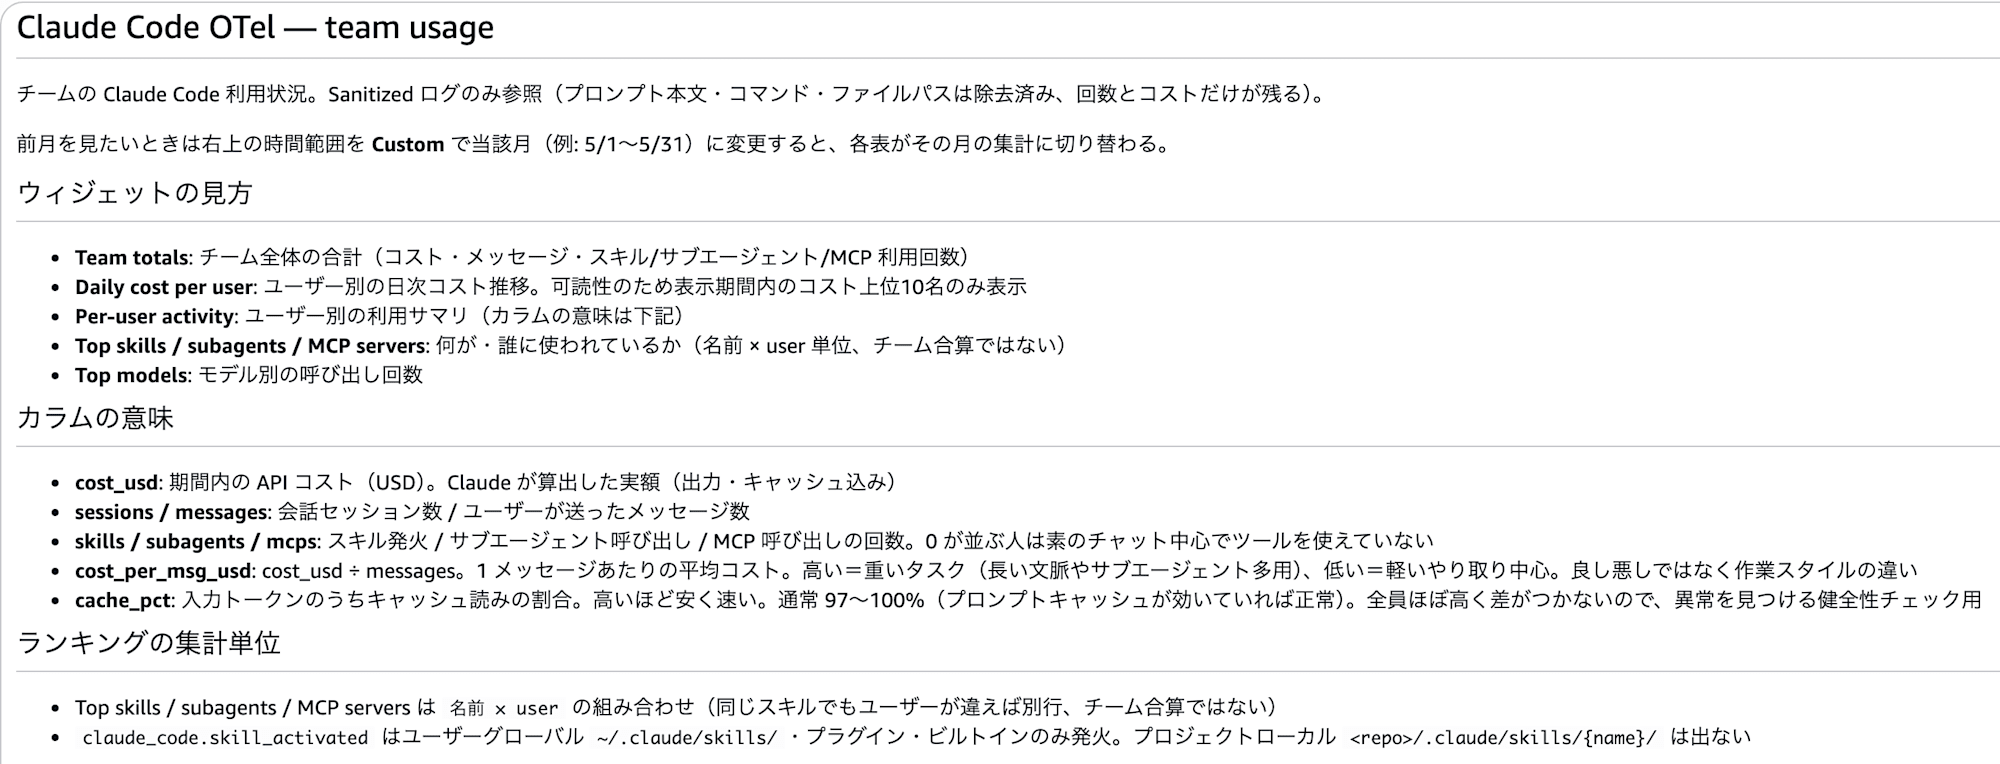
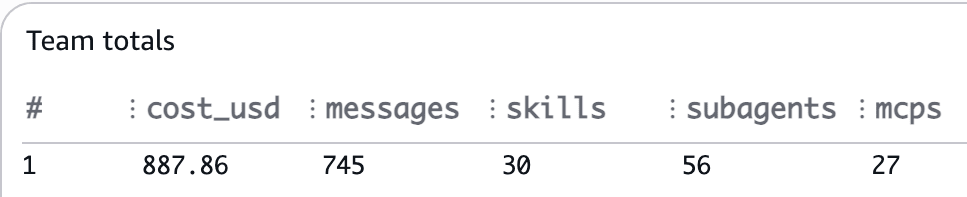
- Team totals: Team-wide totals (cost, message count, skill / subagent / MCP usage count)
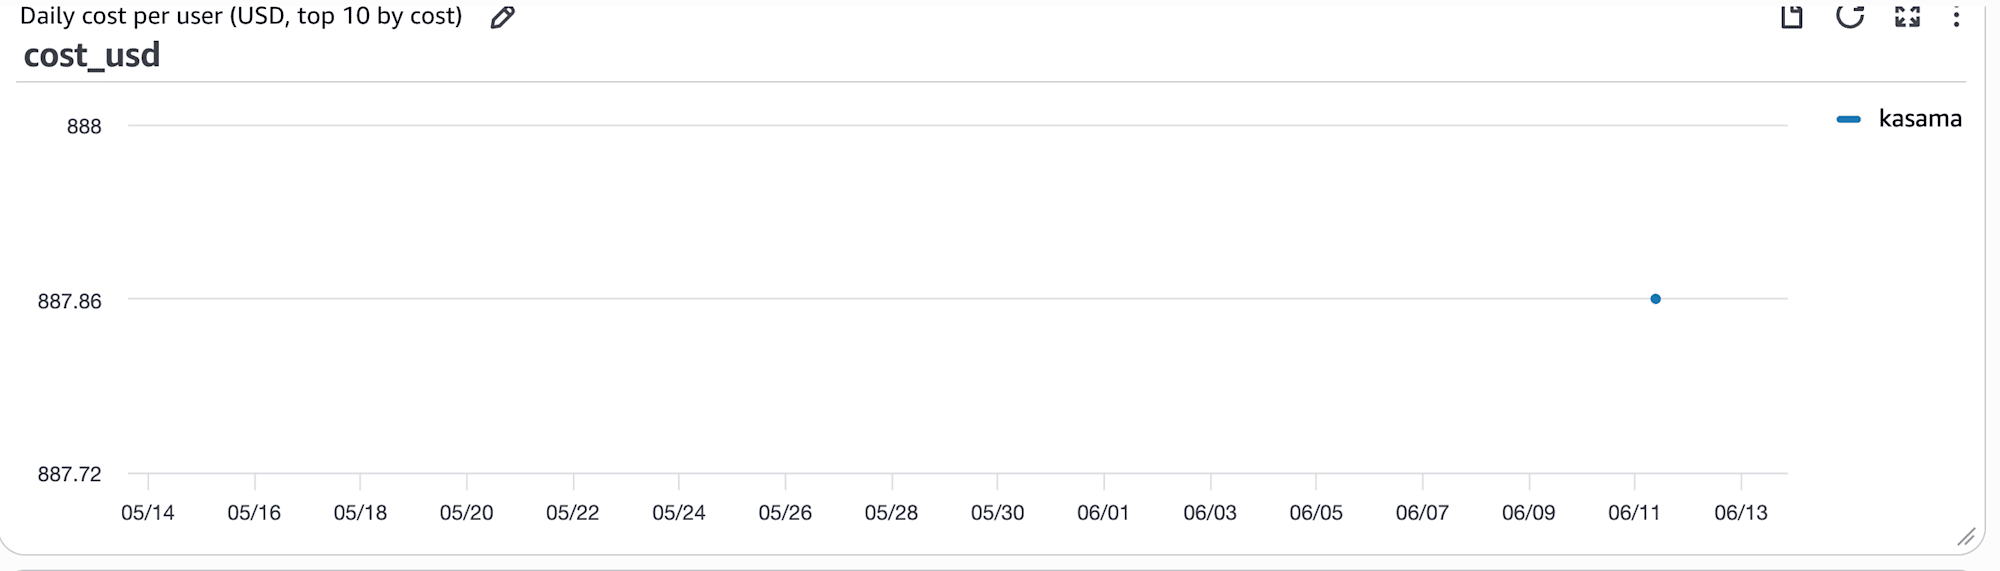
- Daily cost per user: Daily cost trend per user (only the top 10 users by cost within the display period are shown for readability)
- Per-user activity: Per-user summary (session count, model-specific calls, cost per message, cache rate)
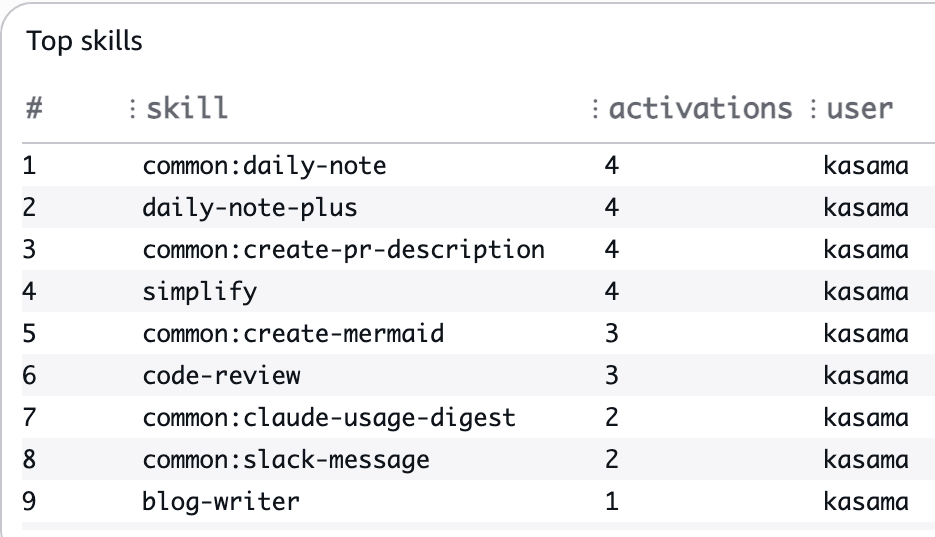
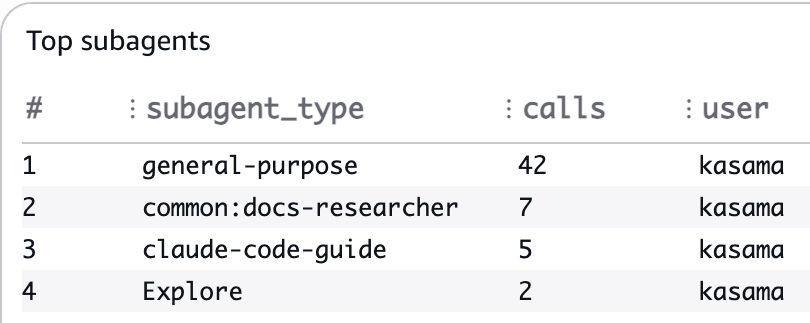
- Top skills / subagents / MCP servers / models: Rankings of what is being used by whom
Key points are that dashboard variables (variables) allow switching the sort axis of tables, and that cost, messages, and skill counts are aggregated in a single stats. As an example, here is an excerpt of the core of the Per-user activity query.
SOURCE '/demo-team/claude-otel-sanitized'
| filter ispresent(attributes.user.email)
| parse attributes.user.email /(?<user>[^@]+)/
| stats sum(coalesce(attributes.cost_usd, 0)) as cost,
        count_distinct(attributes.session.id) as sessions,
        sum(if(body = "claude_code.user_prompt", 1, 0)) as messages,
        sum(if(body = "claude_code.skill_activated", 1, 0)) as skills,
        ...
        by user
SAM (Sanitizer Lambda)
template.yaml defines the Sanitizer Lambda and Subscription Filter. Using SAM's CloudWatchLogs event source automatically configures the Subscription Filter creation and Lambda execution permissions for CloudWatch Logs. The Lambda's IAM policy covers only writes to the Sanitized LogGroup, and read permissions for the Raw side are not needed (because the Subscription Filter pushes events to it).
handler.py is the body of the allowlist filter. Allowed fields are declared as sets in ATTRS / RES_ATTRS, and everything else (tool_input, prompt, bash_command, etc.) is discarded. Only tool_parameters is handled specially, extracting only subagent_type from Agent tools and mcp_server_name from MCP tools to pass through. The reason for using an allowlist rather than a denylist is to ensure safety when new attributes are added by updates on the Claude Code side.
test_handler.py verifies with exact matching using fixtures that simulate real events that PII (user.id, organization.id, request_id, etc.) does not leak. The practice is to always update tests as well when changing the allowlist.
Skill (Weekly Slack Digest)
Since a dashboard that's just built tends to go unvisited, a digest generation Skill that posts to Slack weekly is prepared. When run without arguments, it retrieves the last 7 days of aggregation (team totals, who used what skills, heavy users, MCP usage) from Logs Insights and assembles the Slack message; when run with arguments, it functions as natural language usage analysis (e.g., "analyze why costs spiked last week").
A distinctive feature is that it includes AI observations in addition to aggregate values. Before the observations, Claude Code fetches the official documentation (changelog, etc.) live via WebFetch, and proposes along the flow of "observed usage → latest official features → next steps," making the digest itself an opportunity to promote utilization within the team. Note that the digest only has a positive frame of celebrating people and skills that are being actively used, without singling out non-users (because the purpose is cross-pollination, not surveillance).
Scheduled execution was considered with Claude Desktop's routines, but since the IAM role used for Logs Insights queries requires MFA and is incompatible with headless execution, it is currently set to weekly manual execution.
Deployment
1. Deploy CloudFormation Stack
Creates LogGroups, IAM User, and dashboard.
cd 70_claude_code_otel_dashboard
aws cloudformation deploy \
  --stack-name demo-team-claude-otel-logs \
  --template-file cfn/claude-otel-logs.yml \
  --parameter-overrides ProjectName=demo-team LogRetentionDays=60 RawLogRetentionDays=1 \
  --capabilities CAPABILITY_NAMED_IAM \
  --region us-east-1 \
  --profile <your-profile>
2. Deploy Sanitizer Lambda
Before deployment, run unit tests to confirm allowlist behavior and absence of PII leakage.
cd sam/claude-otel-sanitizer
pytest tests/ -v
sam build
sam deploy --profile <your-profile>
The Lambda execution logs (/aws/lambda/demo-team-claude-otel-sanitizer) default to indefinite retention in SAM, so set a retention period after deployment.
aws logs put-retention-policy \
  --log-group-name /aws/lambda/demo-team-claude-otel-sanitizer \
  --retention-in-days 60 --region us-east-1 --profile <your-profile>
3. Enable Bearer Token Authentication and Issue API Key (Manual)
This cannot be completed with CloudFormation and requires manual work in the console. Although the BearerTokenAuthenticationEnabled property for LogGroup exists, as of April 2026 there was an issue where enabling it failed with a security token invalid error, so this template uses the procedure of enabling it from the console.
- CloudWatch console (us-east-1) → Log groups →
/demo-team/claude-otel→Actions→Enable bearer token authentication - IAM console → Users →
demo-team-claude-otel-writer→Security credentials→API keys→Create API key(note the displayed secret as it cannot be shown again) - Save to SSM Parameter Store as SecureString
/demo-team/claude-otel/bearer-tokenfor team distribution
4. Configure Claude Code for Each Member
Each member adds the following to the env section of ~/.claude/settings.json. Since it contains the Bearer Token, do not write this in the repository-side .claude/settings.json.
{
  "env": {
    "CLAUDE_CODE_ENABLE_TELEMETRY": "1",
    "OTEL_LOGS_EXPORTER": "otlp",
    "OTEL_EXPORTER_OTLP_PROTOCOL": "http/protobuf",
    "OTEL_EXPORTER_OTLP_ENDPOINT": "https://logs.us-east-1.amazonaws.com",
    "OTEL_EXPORTER_OTLP_HEADERS": "Authorization=Bearer <token>,x-aws-log-group=/demo-team/claude-otel,x-aws-log-stream=code",
    "OTEL_LOG_TOOL_DETAILS": "1",
    "OTEL_RESOURCE_ATTRIBUTES": "user.plan=pro"
  }
}
Setting OTEL_LOG_TOOL_DETAILS=1 records actual skill names in claude_code.skill_activated, enabling per-skill aggregation in the dashboard. user.plan in OTEL_RESOURCE_ATTRIBUTES is optional; setting it causes a plan column to appear in the dashboard.
If you want to stop sending for a specific repository, you can opt out by overriding CLAUDE_CODE_ENABLE_TELEMETRY to 0 in that repository's .claude/settings.json. For customer-confidential repositories, it is safer to explicitly state this in the repository-side .claude/settings.json for team sharing.
Testing it out
Injecting Verification Data
For verification, I injected OTel events from my own last 7 days of Claude Code usage history (local session logs) into the Raw LogGroup to run the entire pipeline. Email addresses were replaced with sample values (kasama@example.com).
Verifying Sanitizer Operation
After injection into the Raw LogGroup, events were written to the Sanitized LogGroup after passing through the allowlist within a few seconds. The events on the Sanitized side were in the following form, confirming that tool details and prompt-related fields were dropped.
{
  "body": "claude_code.api_request",
  "attributes": {
    "user.email": "kasama@example.com",
    "session.id": "<session-uuid>",
    "model": "claude-opus-4-8",
    "cost_usd": "0.1000455",
    "input_tokens": "10",
    "cache_read_tokens": "190383"
  },
  "resource": {
    "attributes": {
      "user.plan": "max-5x",
      "service.name": "claude-code",
      "service.version": "2.1.121"
    }
  }
}
Checking the Dashboard
Open the dashboard from the URL output in CloudFormation's Outputs. The text widget at the top describes how to read each widget and the meaning of each column (interpretation of cost_per_msg_usd and cache_pct), so people who open it can immediately understand how to read it.
Team totals shows the team-wide totals.
Daily cost per user shows the daily cost trend per user (only the top 10 users by cost are shown for readability).
Per-user activity lets you grasp each user's cost, session count, message count, skill / subagent / MCP count, model-specific calls, and cache rate in a single row. In the verification data, approximately $888 over 7 days (API equivalent cost for the Max plan; Max is a flat-rate plan so this is not the actual billed amount), with cache_pct at 99.9%, indicating that prompt caching was effective.

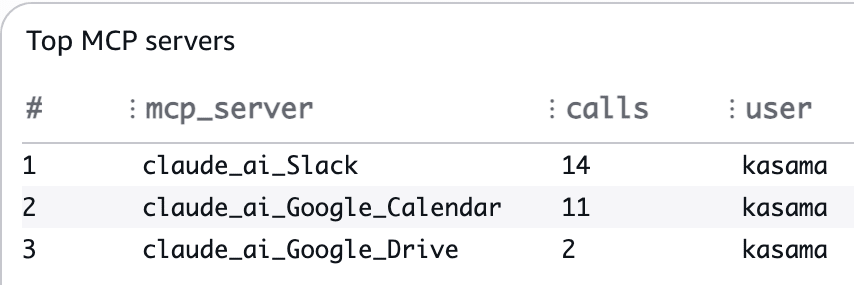
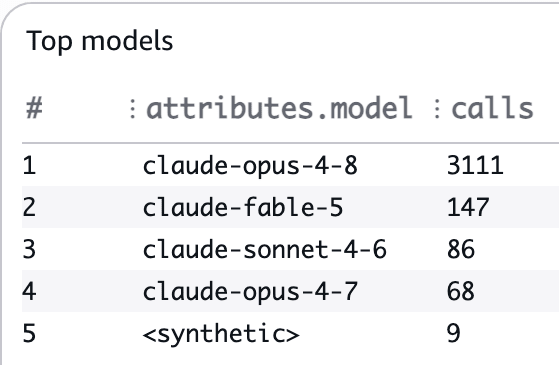
Rankings for Top skills / subagents / MCP servers / models. Daily-note type and PR creation type skills appear at the top, subagents are centered on general-purpose, and MCPs show heavy use of Slack and Google Calendar — my own usage tendencies reflected directly.
Posting the Weekly Digest to Slack
Running /claude-usage-digest without arguments aggregates the last 7 days via Logs Insights, fetches the official changelog via WebFetch, and assembles the Slack message. This time, it was sent to my own DM via Slack MCP. The actually posted message is as follows.
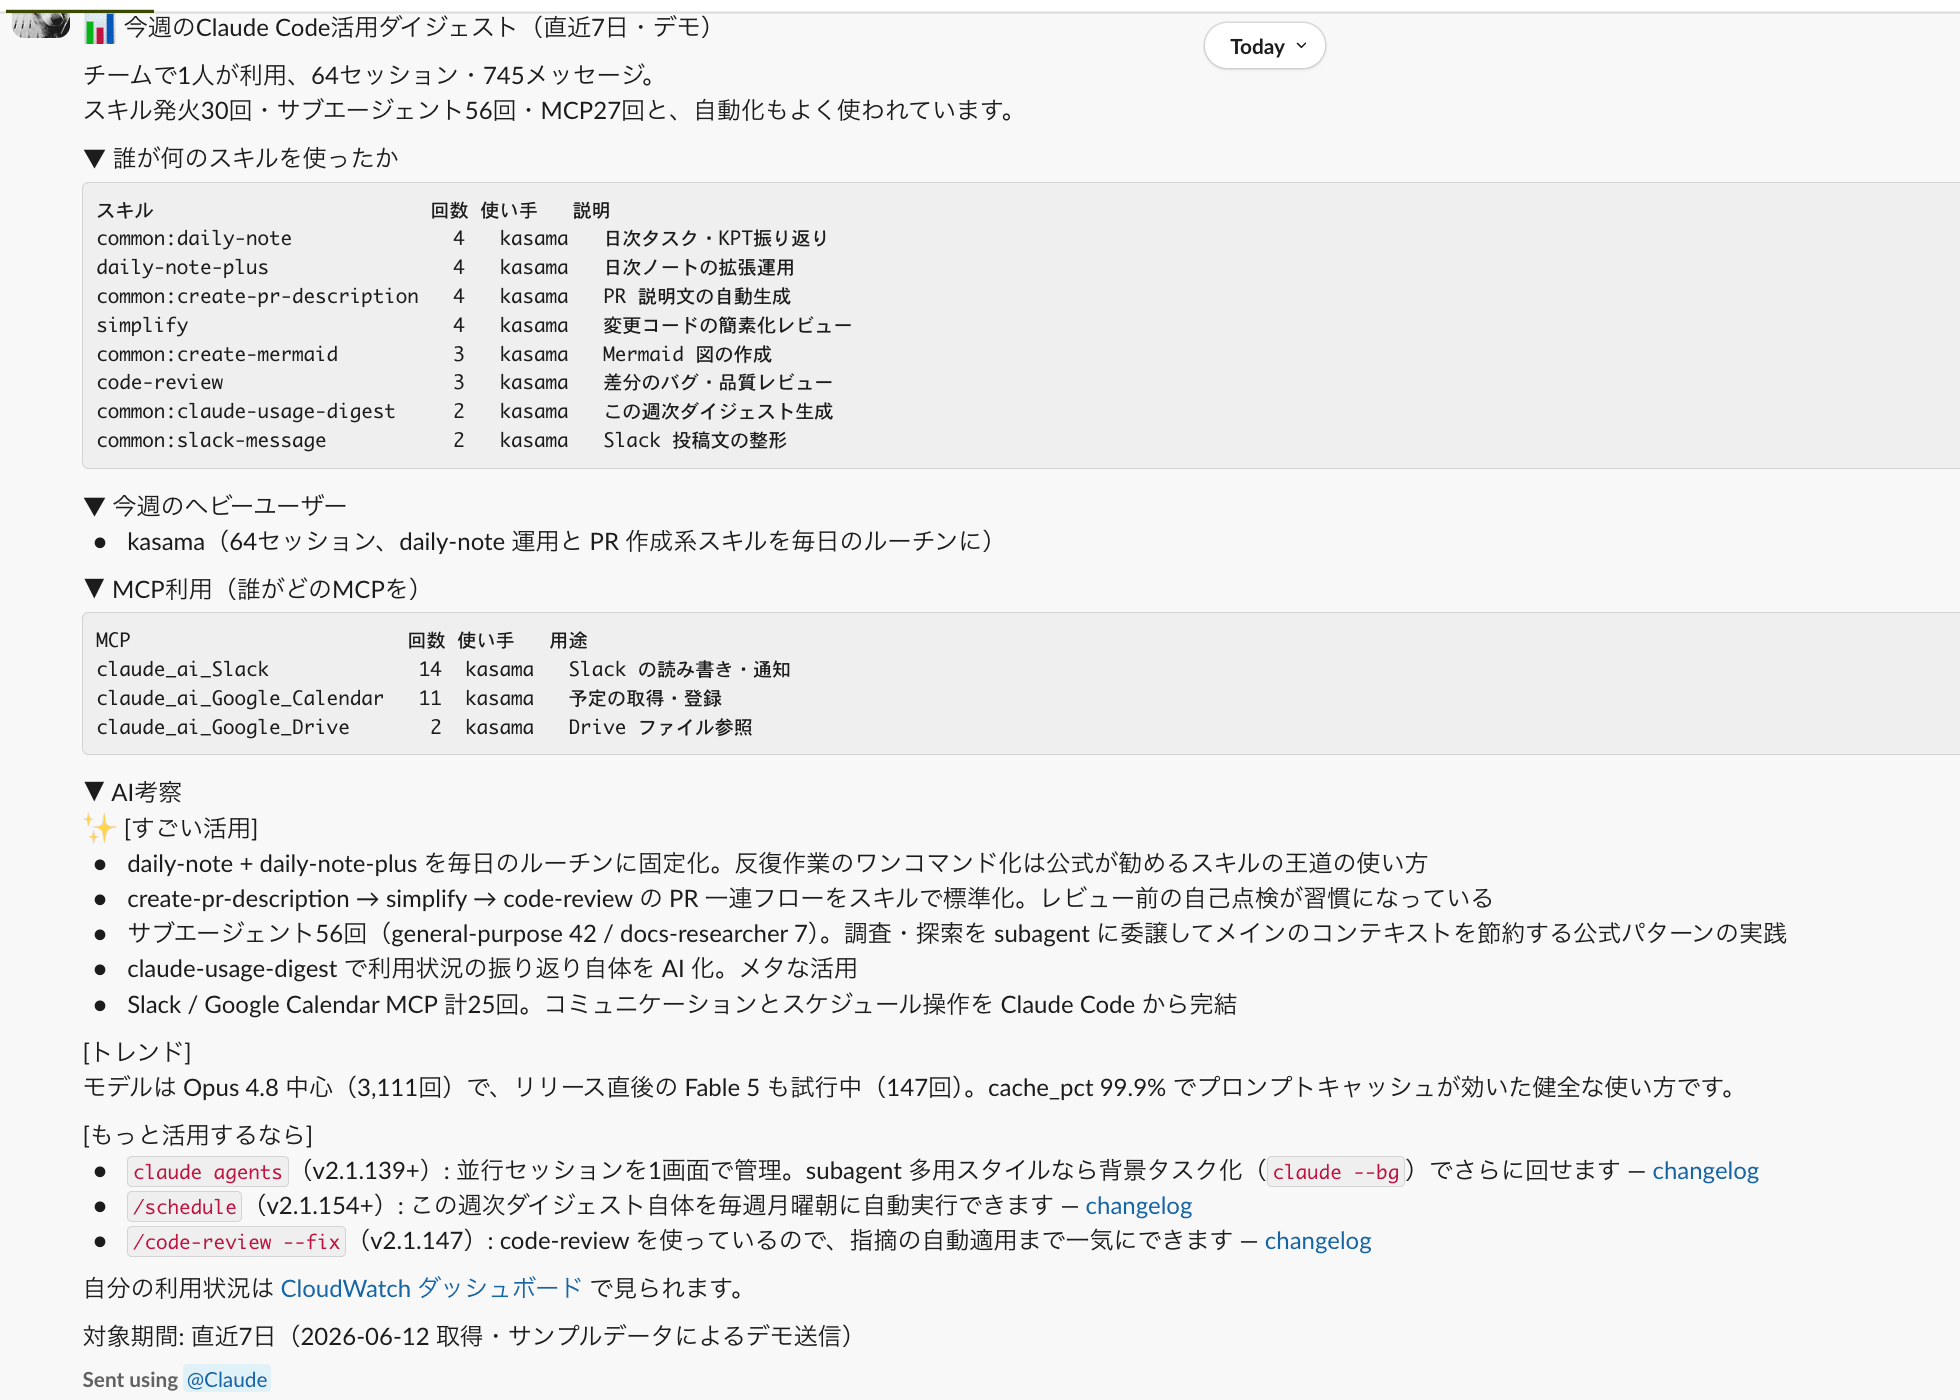
Since the AI observation "to make better use of it" is updated weekly based on the official changelog, the digest itself serves as a way to inform the team about new features.
Cost
Actual measurements from approximately 1 month of operation (31 days, 1,238 sessions, 7,121 messages) with a team of 15 people. Infrastructure costs (ingestion, Lambda, storage) were just under $0.2 per month.
| Item | Actual (15 people, 31 days) |
|---|---|
| Ingestion (Raw + Sanitized + Lambda logs) | $0.17 |
| Storage (Sanitized, etc.) | $0.001 |
| Lambda (approximately 40,000 executions, mostly within free tier) | $0.008 |
| Subtotal | Approximately $0.18 |
The main cost item is ingestion, which is billed twice for Raw and Sanitized (the price of the two-stage structure; Lambda stays within the free tier even with many executions).
Separate from this, Logs Insights scan charges ($0.005/GB) apply. This is a variable cost that scans "number of widgets × data volume for the time range" each time the dashboard is opened; for the above 15 people over approximately 1 month, it was $0.26 per month. As usage scale and dashboard viewing frequency increase, it can grow to tens of dollars depending on assumptions (e.g., estimated tens of dollars per month assuming 100 people open it once per week with the default 31-day range). The most effective cost measure is to shorten the time range (e.g., from the default 31 days to 7 days).
Closing Thoughts
I sent Claude Code's OTel telemetry directly to the CloudWatch Logs OTLP endpoint, stripped sensitive data with a Sanitizer Lambda, visualized the team's usage status on a dashboard, and also systematized the generation of a weekly Slack digest. By making it collector-less with virtually no fixed costs, ensuring no sensitive data remains with the allowlist approach, and shifting from "going to look at" the dashboard to having the digest "arrive," sharing the team's AI usage status has become something that sustains itself as an ongoing operation. I hope this is helpful to someone.