
I compared CloudWatch alarm behavior between basic monitoring and detailed monitoring for EC2
This page has been translated by machine translation. View original
Introduction
Hello, I'm Shota Yamamoto, currently studying for the SOA certification.
While studying for SOA, I learned about CloudWatch detailed monitoring.
This time, I will use both basic monitoring and detailed monitoring to compare how metrics appear and how CloudWatch alarms behave.
What Are Basic Monitoring and Detailed Monitoring?
CloudWatch monitoring comes in two types: basic monitoring and detailed monitoring.
| Item | Basic Monitoring | Detailed Monitoring |
|---|---|---|
| Metric transmission interval | 5 minutes | 1 minute |
| Cost | No additional charge | Additional charge applies |
| Default | Enabled | Disabled |
With basic monitoring, metrics such as CPUUtilization are sent to CloudWatch at 5-minute intervals.
On the other hand, enabling detailed monitoring causes them to be sent at 1-minute intervals.
Let's Try It
Configuration
We will verify using the following configuration.
| Target | EC2 Monitoring | CloudWatch Alarm Period |
|---|---|---|
| Instance A | Basic Monitoring | 1 minute |
| Instance B | Detailed Monitoring | 1 minute |
We will apply the same CPU load conditions to both EC2 instances and compare how the metrics appear and how the alarm states transition.
SNS email notifications will be used for alerts.
1. Create an SNS Topic
First, create an SNS topic as the notification destination for CloudWatch alarms.
Open Amazon SNS from the management console.
Select "Topics" from the left menu and click "Create topic."
- Type: Standard
- Name: ec2-monitoring-alarm-topic
After creating the topic, add a subscription.
- Protocol: Email
- Endpoint: The email address where you want to receive notifications
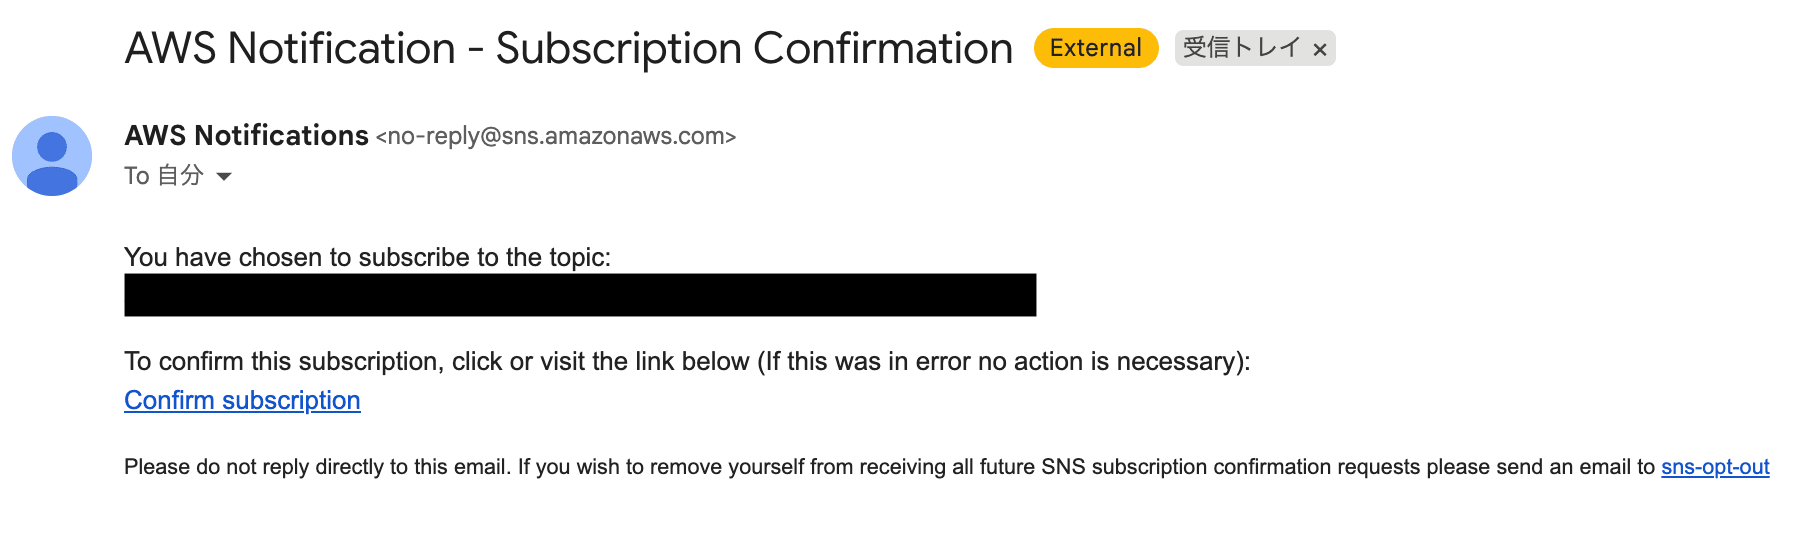
A confirmation email will be sent after creating the subscription, so click "Confirm subscription" in the email.
It's OK if the status shows "Confirmed."
2. Create EC2 Instances
Create 2 EC2 instances.
The settings will be the same except for whether detailed monitoring is enabled or disabled.
For Basic Monitoring
Open EC2 from the management console and click "Launch instances."
- Name: basic-monitoring-test
- AMI: Amazon Linux 2023
- Instance type: t2.micro
- Key pair: Any
- Security group: Allow SSH (port 22) from your own IP
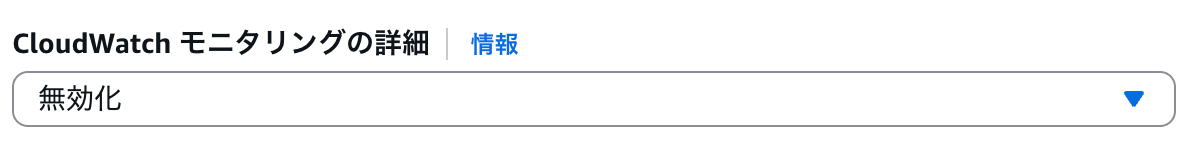
Open "Advanced details" and confirm that detailed CloudWatch monitoring is set to "Disabled" before launching the instance.
For Detailed Monitoring
Create a second instance following the same steps.
- Name: detailed-monitoring-test
- AMI: Amazon Linux 2023
- Instance type: t2.micro
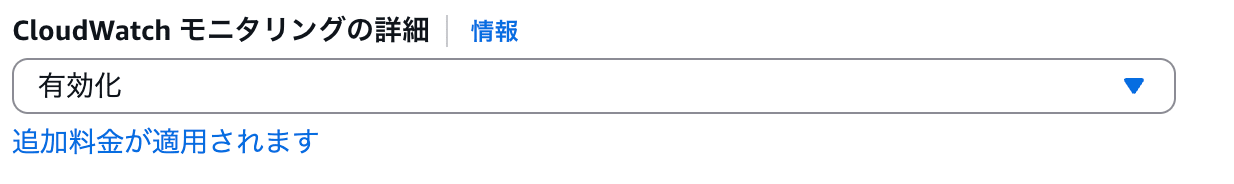
For this one, change the detailed CloudWatch monitoring to "Enabled" under "Advanced details" before launching the instance.
3. Create CloudWatch Alarms
Create CloudWatch alarms for both EC2 instances.
Open CloudWatch from the management console and click "Create alarm."
Alarm for Basic Monitoring
From "Select metric," choose EC2 > Per-Instance Metrics and select CPUUtilization for basic-monitoring-test.
- Statistic: Average
- Period: 1 minute
- Threshold type: Static
- Condition: CPUUtilization >= 70%
- Evaluation period: 1
- Datapoints to alarm: 1/1
- Missing data treatment: Treat missing data as not breaching
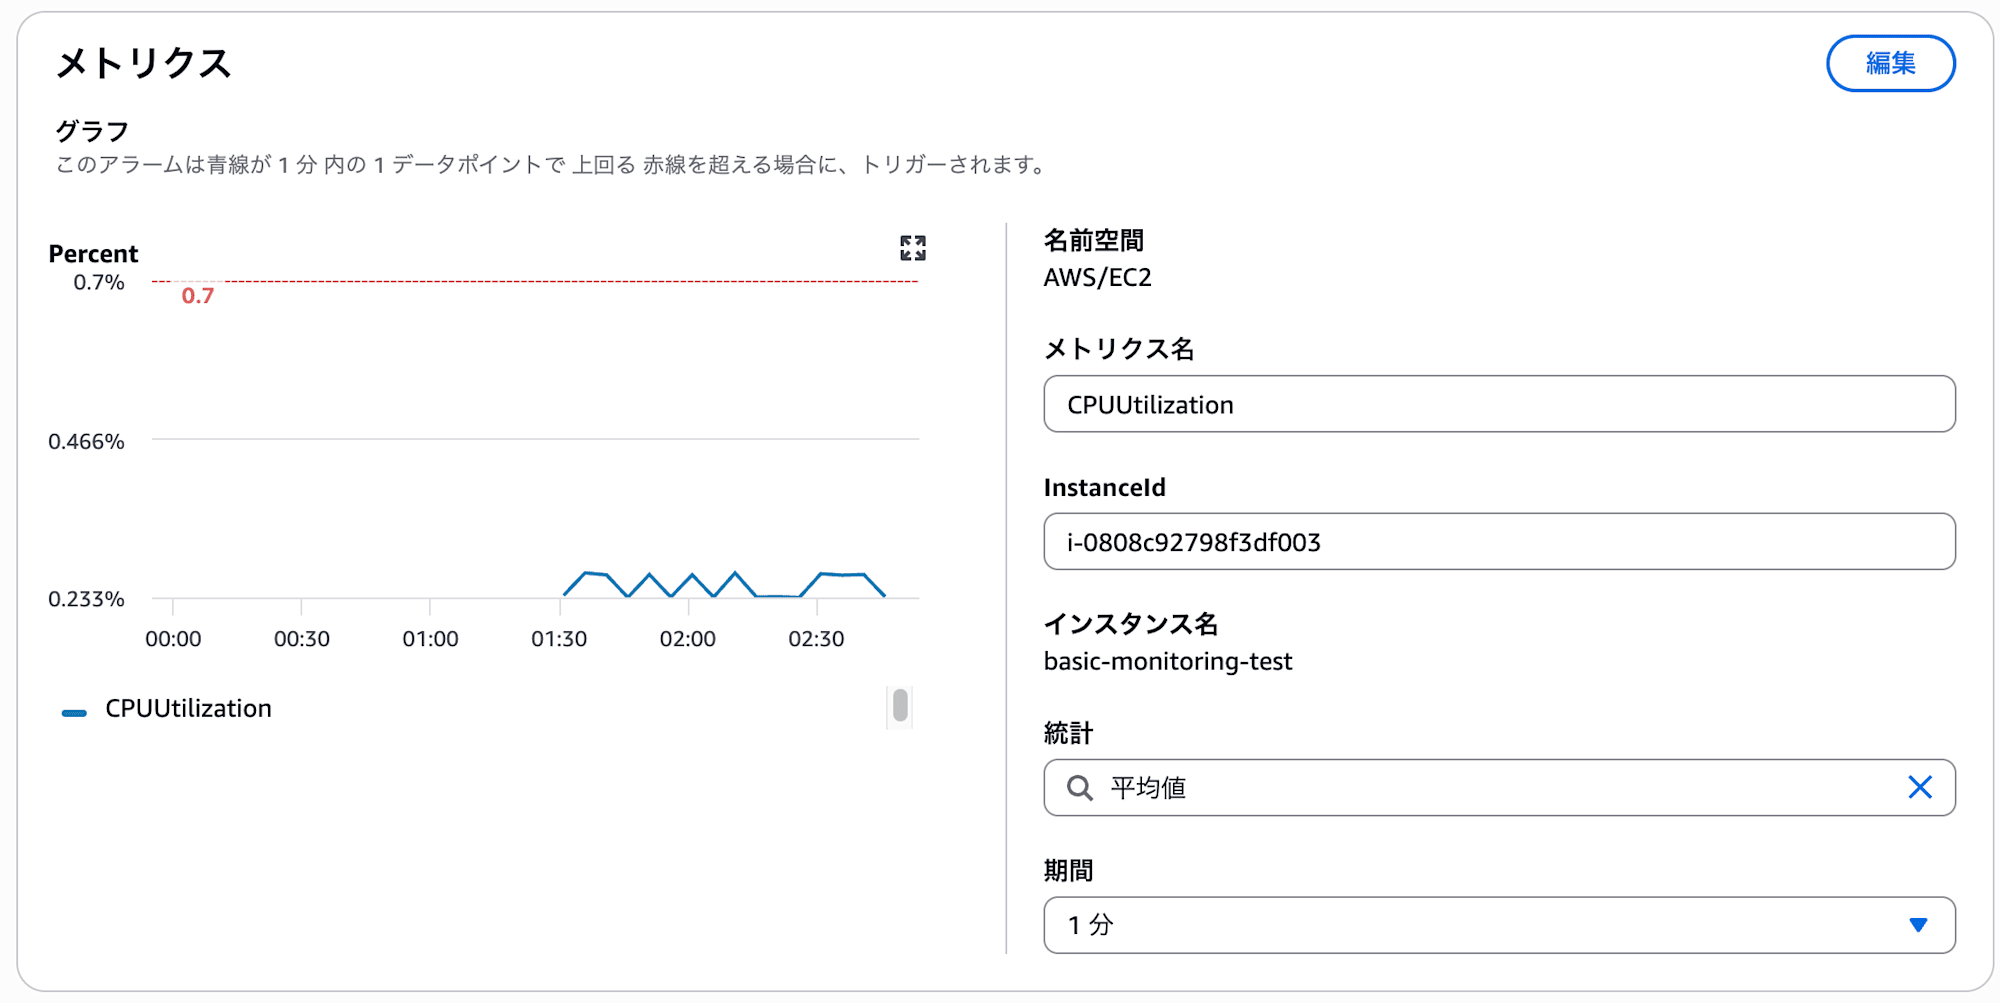
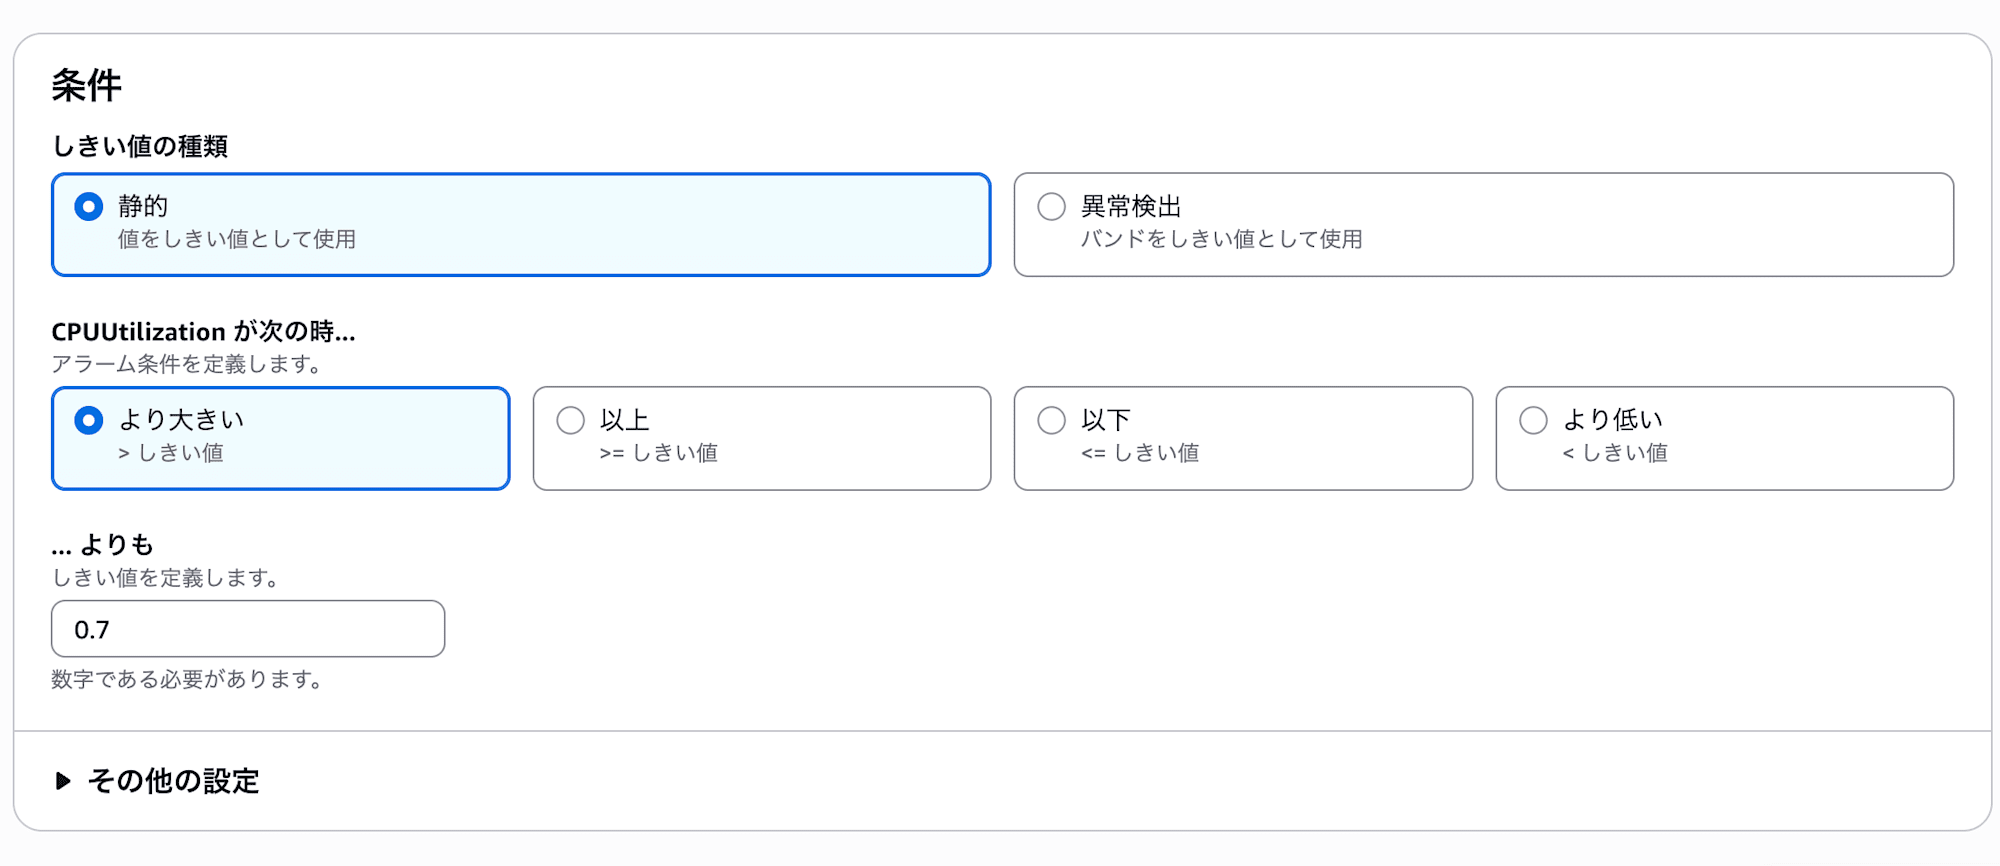
(The image shows 0.7, but please create it with 70%)
In the notification settings, configure it to notify the SNS topic created earlier (ec2-monitoring-alarm-topic) when the alarm state is triggered.
- Alarm name: basic-monitoring-cpu-1min-alarm
Alarm for Detailed Monitoring
Follow the same steps to create an alarm for the CPUUtilization of detailed-monitoring-test.
Use the same conditions as the basic monitoring side.
- Alarm name: detailed-monitoring-cpu-1min-alarm
4. Apply CPU Load
Connect to both EC2 instances and apply CPU load.
You can connect using EC2 Instance Connect, SSH, or any method you prefer.
Run the following command on both EC2 instances.
for n in 1 2 3 4 5; do
  echo "[$(date)] start load test: ${n}"

  pids=""
  for i in $(seq 1 $(nproc)); do
    yes > /dev/null &
    pids="$pids $!"
  done

  sleep 90

  echo "[$(date)] stop load test: ${n}"
  kill $pids

  sleep 180
done
This script repeats the operation of applying CPU load for 90 seconds followed by a 180-second pause, 5 times.
Since t2.micro has 1 vCPU, yes processes equal to the number from nproc are launched to apply load across the entire CPU.
The total time is approximately 22 minutes.
5. Check the Results
After the load test is complete, check the results from the CloudWatch console.
Metric Comparison
From CloudWatch "Metrics," open EC2 > Per-Instance Metrics and display CPUUtilization for both instances with a 1-minute period.
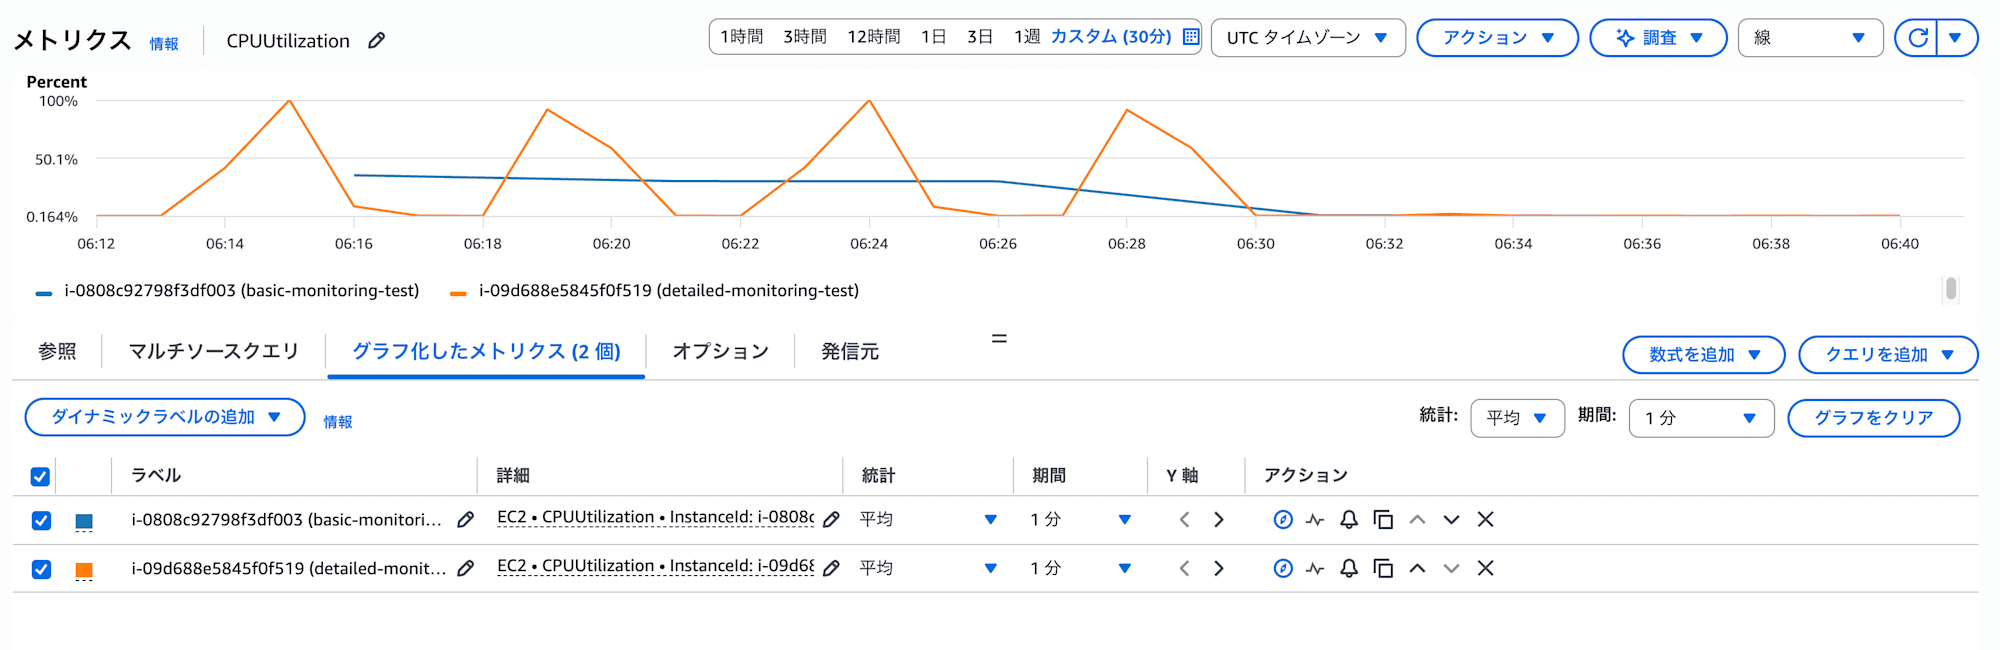
The basic monitoring side showed a stable graph averaging around 40%.
Since data is sent at 5-minute intervals, the 90-second CPU load and 180-second pause are averaged out, making it difficult to see the CPU spikes.
On the other hand, the detailed monitoring side showed a graph alternating between around 80% and approximately 0%.
Since data is sent at 1-minute intervals, the timing of load application and stoppage is clearly visible.
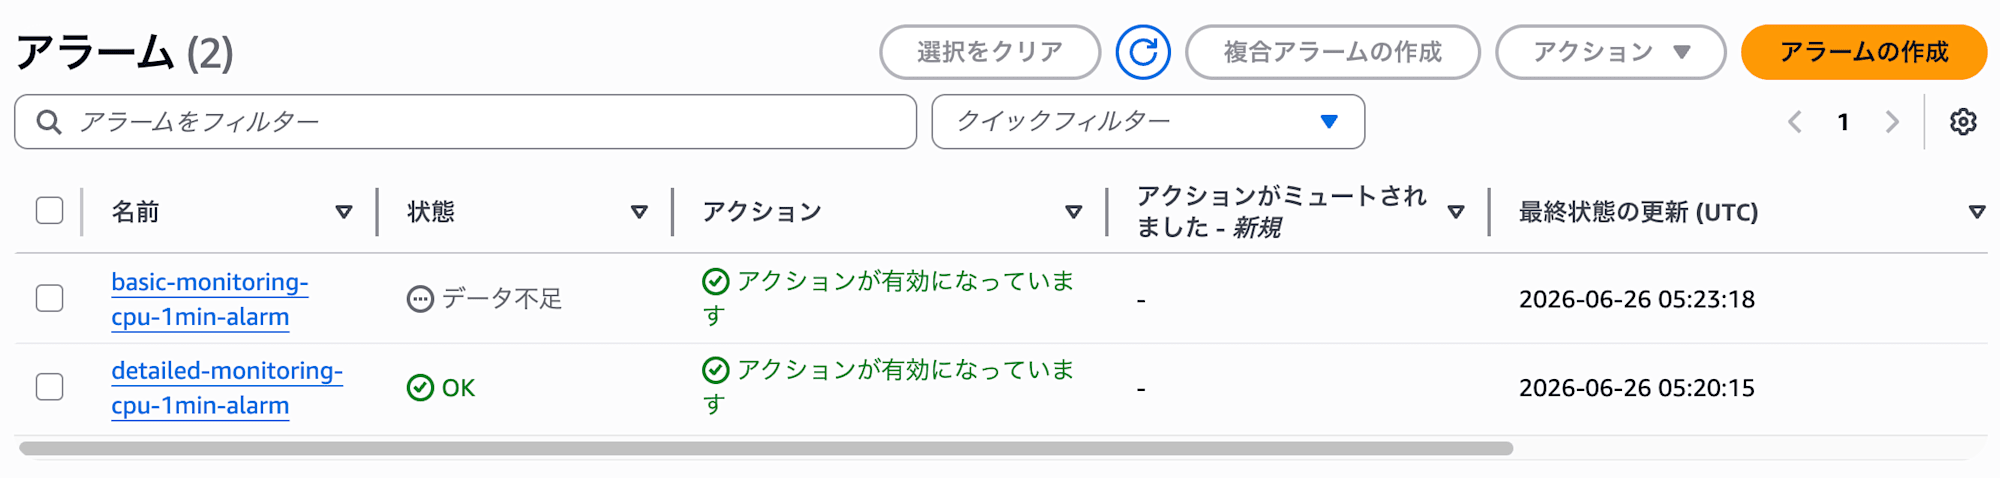
Alarm State Comparison
After reviewing the alarm history, the following results were obtained.
| Item | Basic Monitoring + 1-min Alarm | Detailed Monitoring + 1-min Alarm |
|---|---|---|
| Number of ALARM notification emails | 0 | 4 |
| CPU graph appearance | Stable at average 40% | Alternating between 80% and ~0% |
The basic monitoring side did not trigger a single alarm.
This is likely because the metrics are at 5-minute intervals, so the 90-second load was averaged out and did not exceed the 70% threshold.
The detailed monitoring side triggered alarms 4 out of 5 times.
Since metrics are sent at 1-minute intervals, CPU spikes are correctly detected.
Conclusion
This time, I compared the behavior of CloudWatch alarms (1-minute period) between EC2 basic monitoring and detailed monitoring.
Even if you set the CloudWatch alarm period to 1 minute, if EC2 remains on basic monitoring, it will not provide 1-minute-level monitoring.
Since the underlying metrics are sent at 5-minute intervals, short-duration loads may be averaged out and alarms may not trigger.
If you want to evaluate EC2 standard metrics at 1-minute granularity, you need to enable detailed monitoring.
References
About Classmethod Operations, Inc.
We are an operations company within the Classmethod Group.
Specialized teams in operations, maintenance development, support, information systems, and back-office functions provide customers with everything from business process outsourcing to problem-solving and high-value-added services through "mechanisms" that make full use of IT and AI.
We are recruiting members for various positions.
If you are interested in our culture, systems, and work styles that realize both "operational excellence" and "working and living true to yourself," please visit the Classmethod Operations, Inc. Corporate Site. ※ The company name was changed from Annotation Inc. in January 2026.
